Herreid, SD Map & Demographics
Herreid Map
Herreid Overview
$32,279
PER CAPITA INCOME
$88,786
AVG FAMILY INCOME
$75,179
AVG HOUSEHOLD INCOME
54.0%
WAGE / INCOME GAP [ % ]
46.0¢/ $1
WAGE / INCOME GAP [ $ ]
0.39
INEQUALITY / GINI INDEX
568
TOTAL POPULATION
319
MALE POPULATION
249
FEMALE POPULATION
128.11
MALES / 100 FEMALES
78.06
FEMALES / 100 MALES
41.0
MEDIAN AGE
3.4
AVG FAMILY SIZE
2.4
AVG HOUSEHOLD SIZE
254
LABOR FORCE [ PEOPLE ]
63.2%
PERCENT IN LABOR FORCE
5.9%
UNEMPLOYMENT RATE
Herreid Zip Codes
Herreid Area Codes
Income in Herreid
Income Overview in Herreid
Per Capita Income in Herreid is $32,279, while median incomes of families and households are $88,786 and $75,179 respectively.
| Characteristic | Number | Measure |
| Per Capita Income | 568 | $32,279 |
| Median Family Income | 140 | $88,786 |
| Mean Family Income | 140 | $107,796 |
| Median Household Income | 239 | $75,179 |
| Mean Household Income | 239 | $79,964 |
| Income Deficit | 140 | $0 |
| Wage / Income Gap (%) | 568 | 54.00% |
| Wage / Income Gap ($) | 568 | 46.00¢ per $1 |
| Gini / Inequality Index | 568 | 0.39 |
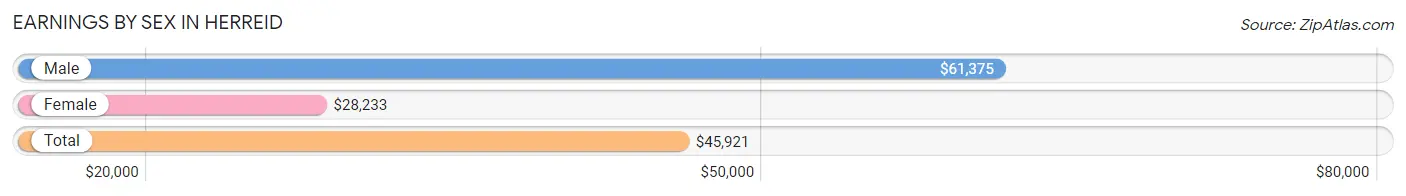
Earnings by Sex in Herreid
Average Earnings in Herreid are $45,921, $61,375 for men and $28,233 for women, a difference of 54.0%.
| Sex | Number | Average Earnings |
| Male | 129 (48.9%) | $61,375 |
| Female | 135 (51.1%) | $28,233 |
| Total | 264 (100.0%) | $45,921 |
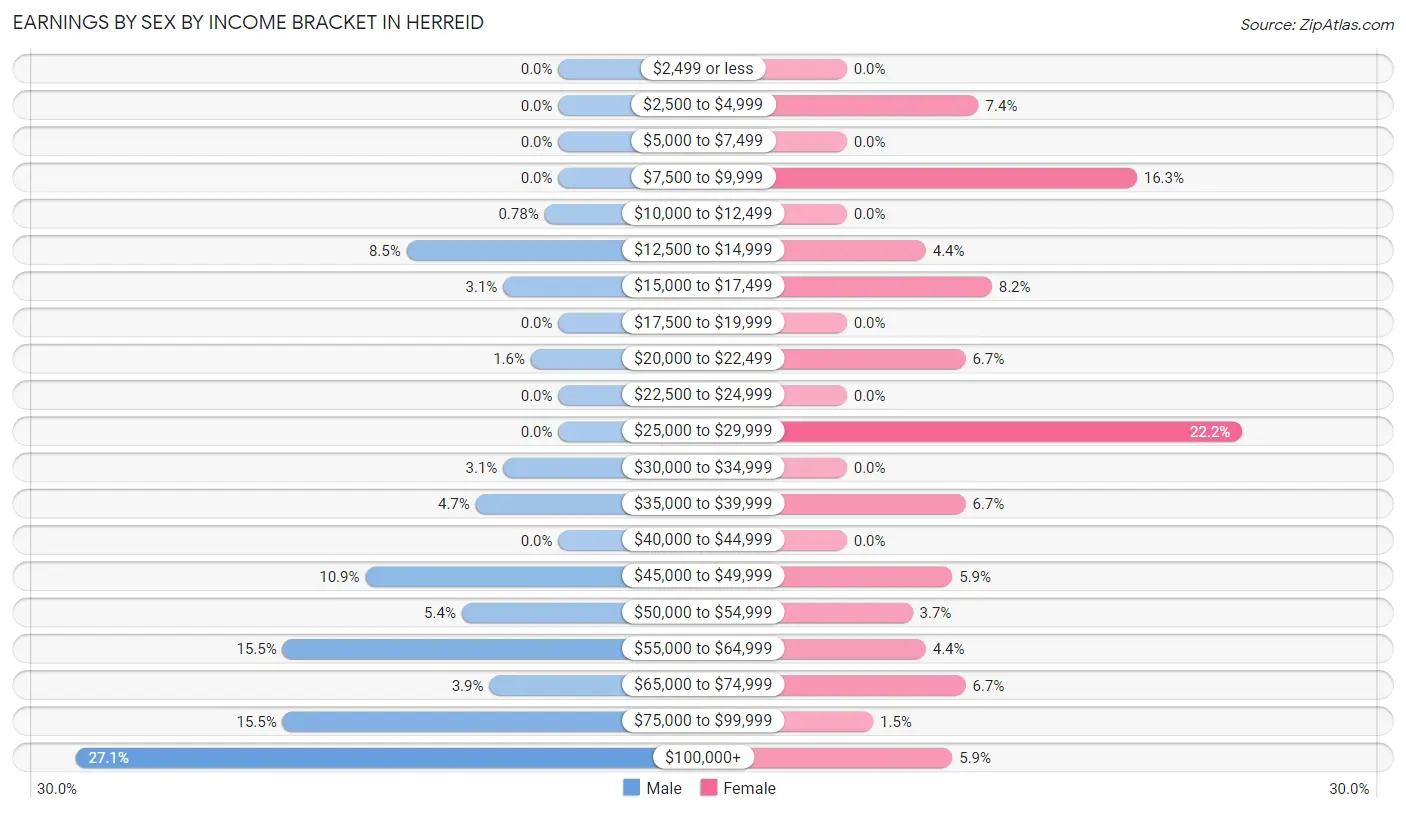
Earnings by Sex by Income Bracket in Herreid
The most common earnings brackets in Herreid are $100,000+ for men (35 | 27.1%) and $25,000 to $29,999 for women (30 | 22.2%).
| Income | Male | Female |
| $2,499 or less | 0 (0.0%) | 0 (0.0%) |
| $2,500 to $4,999 | 0 (0.0%) | 10 (7.4%) |
| $5,000 to $7,499 | 0 (0.0%) | 0 (0.0%) |
| $7,500 to $9,999 | 0 (0.0%) | 22 (16.3%) |
| $10,000 to $12,499 | 1 (0.8%) | 0 (0.0%) |
| $12,500 to $14,999 | 11 (8.5%) | 6 (4.4%) |
| $15,000 to $17,499 | 4 (3.1%) | 11 (8.2%) |
| $17,500 to $19,999 | 0 (0.0%) | 0 (0.0%) |
| $20,000 to $22,499 | 2 (1.5%) | 9 (6.7%) |
| $22,500 to $24,999 | 0 (0.0%) | 0 (0.0%) |
| $25,000 to $29,999 | 0 (0.0%) | 30 (22.2%) |
| $30,000 to $34,999 | 4 (3.1%) | 0 (0.0%) |
| $35,000 to $39,999 | 6 (4.6%) | 9 (6.7%) |
| $40,000 to $44,999 | 0 (0.0%) | 0 (0.0%) |
| $45,000 to $49,999 | 14 (10.8%) | 8 (5.9%) |
| $50,000 to $54,999 | 7 (5.4%) | 5 (3.7%) |
| $55,000 to $64,999 | 20 (15.5%) | 6 (4.4%) |
| $65,000 to $74,999 | 5 (3.9%) | 9 (6.7%) |
| $75,000 to $99,999 | 20 (15.5%) | 2 (1.5%) |
| $100,000+ | 35 (27.1%) | 8 (5.9%) |
| Total | 129 (100.0%) | 135 (100.0%) |
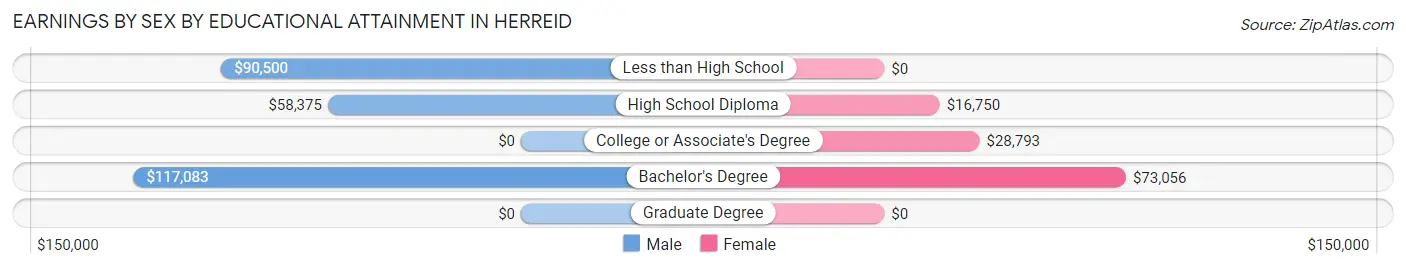
Earnings by Sex by Educational Attainment in Herreid
Average earnings in Herreid are $68,000 for men and $28,664 for women, a difference of 57.9%. Men with an educational attainment of bachelor's degree enjoy the highest average annual earnings of $117,083, while those with high school diploma education earn the least with $58,375. Women with an educational attainment of bachelor's degree earn the most with the average annual earnings of $73,056, while those with high school diploma education have the smallest earnings of $16,750.
| Educational Attainment | Male Income | Female Income |
| Less than High School | $90,500 | $0 |
| High School Diploma | $58,375 | $16,750 |
| College or Associate's Degree | - | - |
| Bachelor's Degree | $117,083 | $73,056 |
| Graduate Degree | - | - |
| Total | $68,000 | $28,664 |
Family Income in Herreid
Family Income Brackets in Herreid
According to the Herreid family income data, there are 67 families falling into the $75,000 to $99,999 income range, which is the most common income bracket and makes up 47.9% of all families.
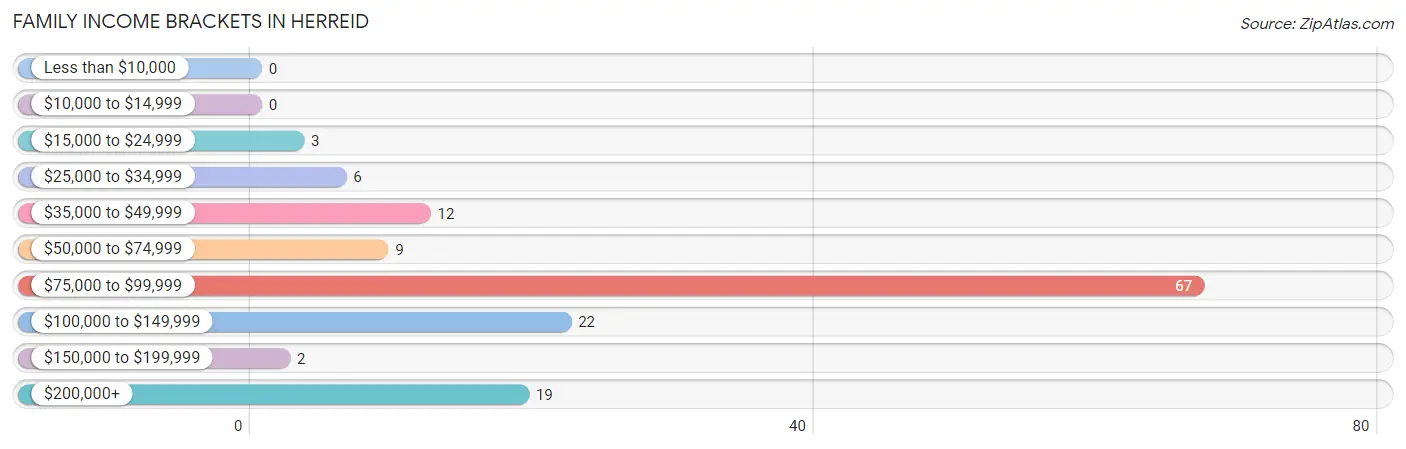
| Income Bracket | # Families | % Families |
| Less than $10,000 | 0 | 0.0% |
| $10,000 to $14,999 | 0 | 0.0% |
| $15,000 to $24,999 | 3 | 2.1% |
| $25,000 to $34,999 | 6 | 4.3% |
| $35,000 to $49,999 | 12 | 8.6% |
| $50,000 to $74,999 | 9 | 6.4% |
| $75,000 to $99,999 | 67 | 47.9% |
| $100,000 to $149,999 | 22 | 15.7% |
| $150,000 to $199,999 | 2 | 1.4% |
| $200,000+ | 19 | 13.6% |
Family Income by Famaliy Size in Herreid
4-person families (24 | 17.1%) account for the highest median family income in Herreid with $243,889 per family, while 4-person families (24 | 17.1%) have the highest median income of $60,972 per family member.
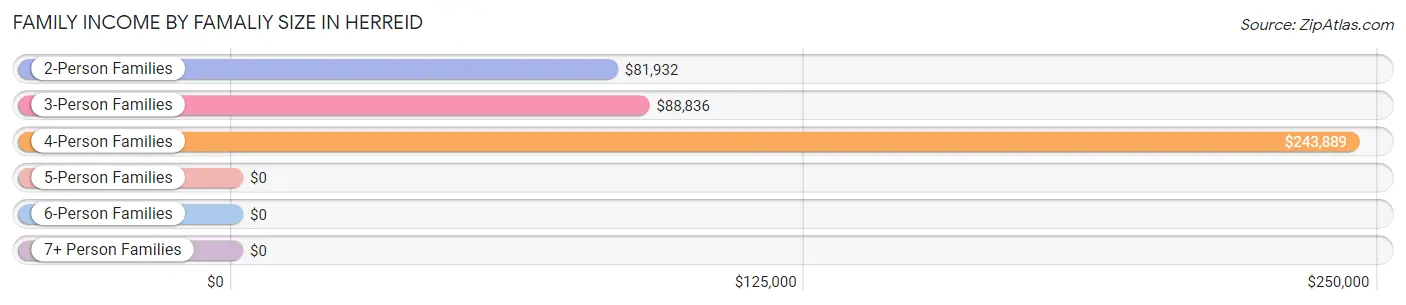
| Income Bracket | # Families | Median Income |
| 2-Person Families | 65 (46.4%) | $81,932 |
| 3-Person Families | 37 (26.4%) | $88,836 |
| 4-Person Families | 24 (17.1%) | $243,889 |
| 5-Person Families | 2 (1.4%) | $0 |
| 6-Person Families | 2 (1.4%) | $0 |
| 7+ Person Families | 10 (7.1%) | $0 |
| Total | 140 (100.0%) | $88,786 |
Family Income by Number of Earners in Herreid
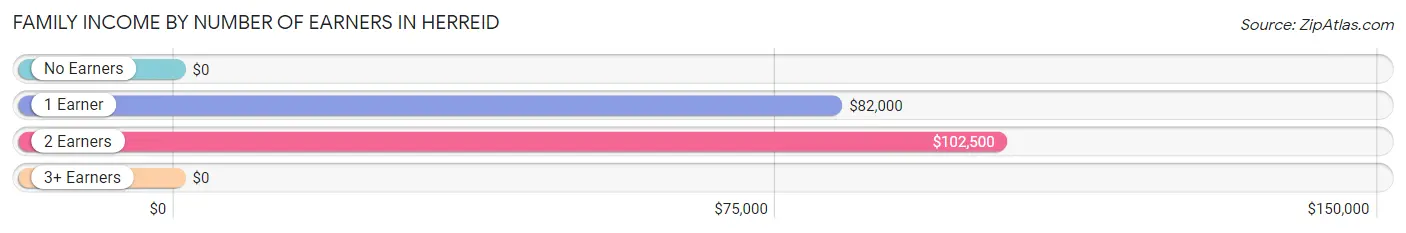
| Number of Earners | # Families | Median Income |
| No Earners | 9 (6.4%) | $0 |
| 1 Earner | 40 (28.6%) | $82,000 |
| 2 Earners | 62 (44.3%) | $102,500 |
| 3+ Earners | 29 (20.7%) | $0 |
| Total | 140 (100.0%) | $88,786 |
Household Income in Herreid
Household Income Brackets in Herreid
With 73 households falling in the category, the $75,000 to $99,999 income range is the most frequent in Herreid, accounting for 30.5% of all households.
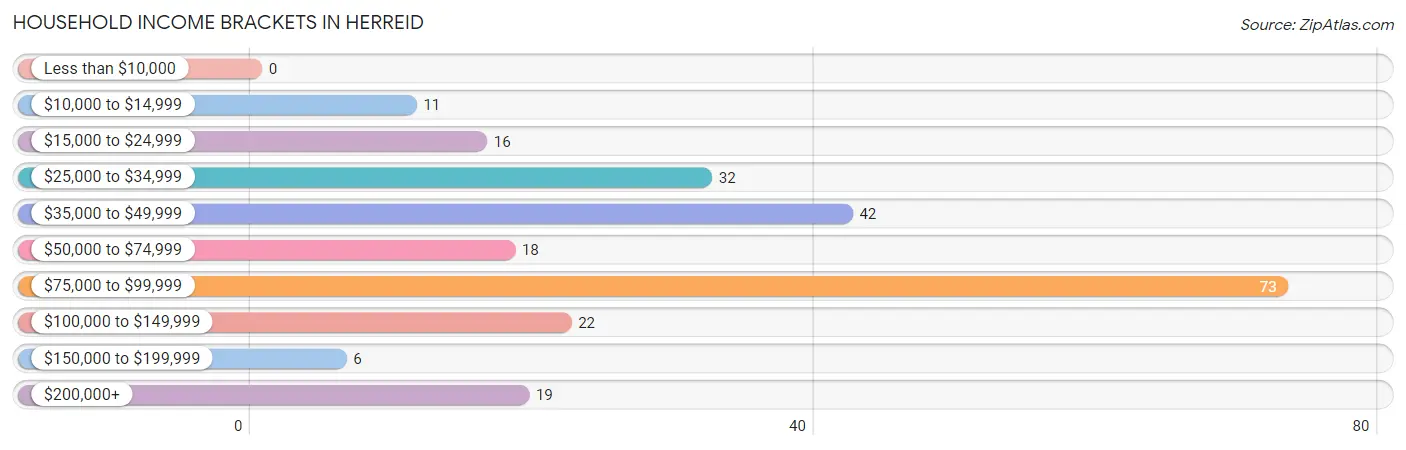
| Income Bracket | # Households | % Households |
| Less than $10,000 | 0 | 0.0% |
| $10,000 to $14,999 | 11 | 4.6% |
| $15,000 to $24,999 | 16 | 6.7% |
| $25,000 to $34,999 | 32 | 13.4% |
| $35,000 to $49,999 | 42 | 17.6% |
| $50,000 to $74,999 | 18 | 7.5% |
| $75,000 to $99,999 | 73 | 30.5% |
| $100,000 to $149,999 | 22 | 9.2% |
| $150,000 to $199,999 | 6 | 2.5% |
| $200,000+ | 19 | 7.9% |
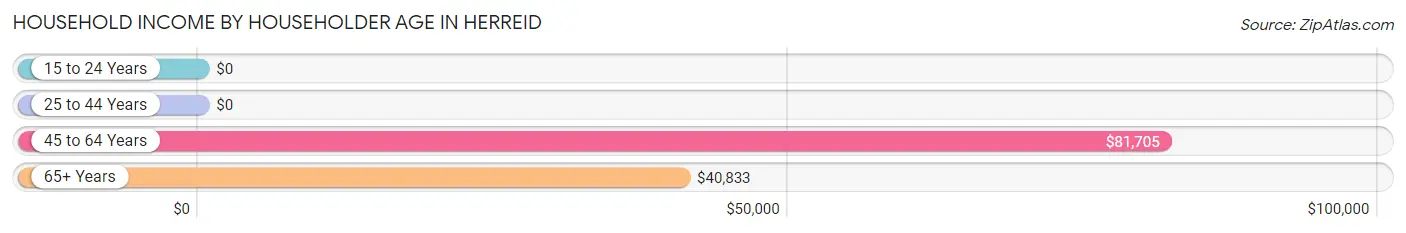
Household Income by Householder Age in Herreid
The median household income in Herreid is $75,179, with the highest median household income of $81,705 found in the 45 to 64 years age bracket for the primary householder. A total of 91 households (38.1%) fall into this category.
| Income Bracket | # Households | Median Income |
| 15 to 24 Years | 0 (0.0%) | $0 |
| 25 to 44 Years | 40 (16.7%) | $0 |
| 45 to 64 Years | 91 (38.1%) | $81,705 |
| 65+ Years | 108 (45.2%) | $40,833 |
| Total | 239 (100.0%) | $75,179 |
Poverty in Herreid
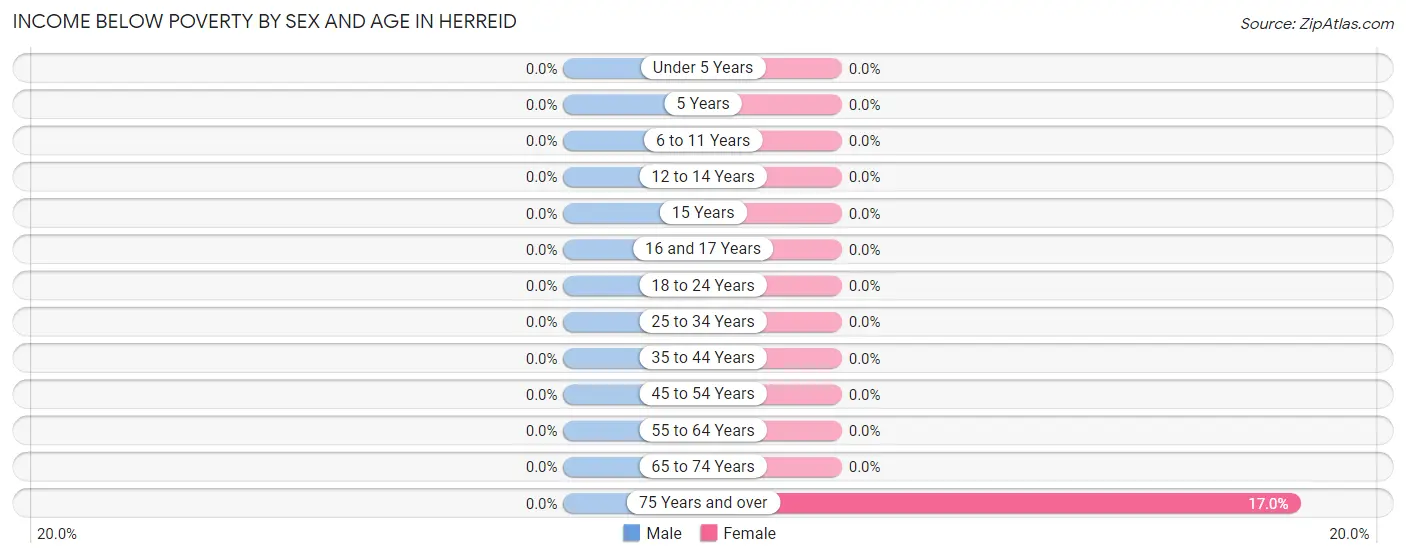
Income Below Poverty by Sex and Age in Herreid
| Age Bracket | Male | Female |
| Under 5 Years | 0 (0.0%) | 0 (0.0%) |
| 5 Years | 0 (0.0%) | 0 (0.0%) |
| 6 to 11 Years | 0 (0.0%) | 0 (0.0%) |
| 12 to 14 Years | 0 (0.0%) | 0 (0.0%) |
| 15 Years | 0 (0.0%) | 0 (0.0%) |
| 16 and 17 Years | 0 (0.0%) | 0 (0.0%) |
| 18 to 24 Years | 0 (0.0%) | 0 (0.0%) |
| 25 to 34 Years | 0 (0.0%) | 0 (0.0%) |
| 35 to 44 Years | 0 (0.0%) | 0 (0.0%) |
| 45 to 54 Years | 0 (0.0%) | 0 (0.0%) |
| 55 to 64 Years | 0 (0.0%) | 0 (0.0%) |
| 65 to 74 Years | 0 (0.0%) | 0 (0.0%) |
| 75 Years and over | 0 (0.0%) | 8 (17.0%) |
| Total | 0 (0.0%) | 8 (3.2%) |
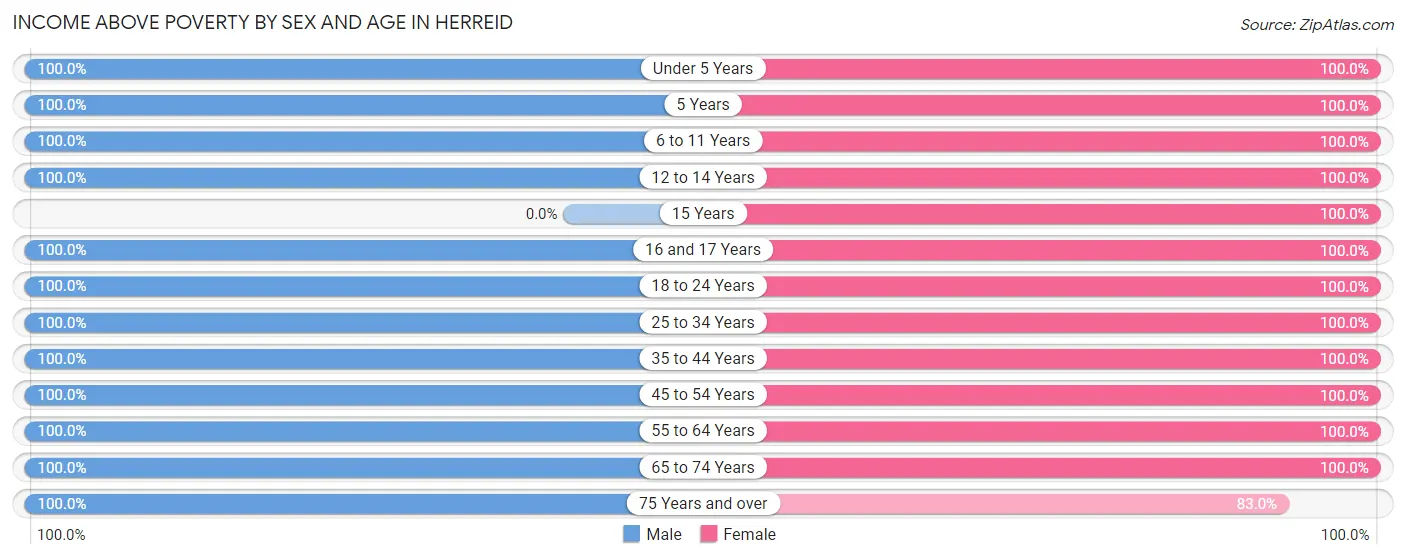
Income Above Poverty by Sex and Age in Herreid
According to the poverty statistics in Herreid, males aged under 5 years and females aged under 5 years are the age groups that are most secure financially, with 100.0% of males and 100.0% of females in these age groups living above the poverty line.
| Age Bracket | Male | Female |
| Under 5 Years | 68 (100.0%) | 2 (100.0%) |
| 5 Years | 9 (100.0%) | 2 (100.0%) |
| 6 to 11 Years | 38 (100.0%) | 28 (100.0%) |
| 12 to 14 Years | 12 (100.0%) | 5 (100.0%) |
| 15 Years | 0 (0.0%) | 2 (100.0%) |
| 16 and 17 Years | 11 (100.0%) | 16 (100.0%) |
| 18 to 24 Years | 11 (100.0%) | 13 (100.0%) |
| 25 to 34 Years | 3 (100.0%) | 24 (100.0%) |
| 35 to 44 Years | 37 (100.0%) | 21 (100.0%) |
| 45 to 54 Years | 12 (100.0%) | 36 (100.0%) |
| 55 to 64 Years | 45 (100.0%) | 32 (100.0%) |
| 65 to 74 Years | 18 (100.0%) | 21 (100.0%) |
| 75 Years and over | 55 (100.0%) | 39 (83.0%) |
| Total | 319 (100.0%) | 241 (96.8%) |
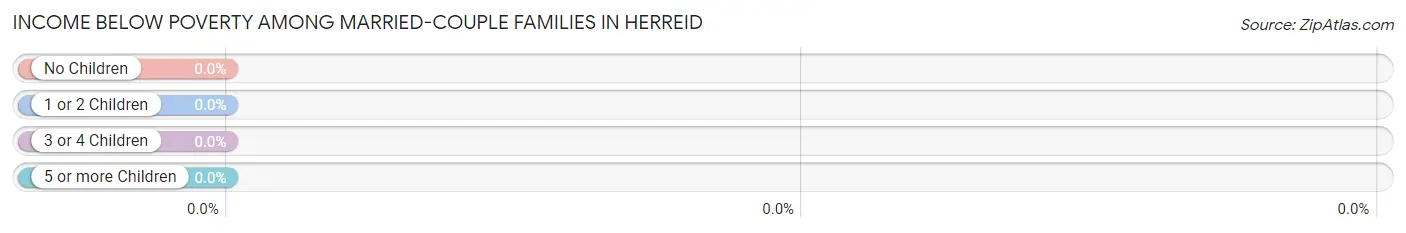
Income Below Poverty Among Married-Couple Families in Herreid
| Children | Above Poverty | Below Poverty |
| No Children | 94 (100.0%) | 0 (0.0%) |
| 1 or 2 Children | 28 (100.0%) | 0 (0.0%) |
| 3 or 4 Children | 2 (100.0%) | 0 (0.0%) |
| 5 or more Children | 10 (100.0%) | 0 (0.0%) |
| Total | 134 (100.0%) | 0 (0.0%) |
Income Below Poverty Among Single-Parent Households in Herreid
| Children | Single Father | Single Mother |
| No Children | 0 (0.0%) | 0 (0.0%) |
| 1 or 2 Children | 0 (0.0%) | 0 (0.0%) |
| 3 or 4 Children | 0 (0.0%) | 0 (0.0%) |
| 5 or more Children | 0 (0.0%) | 0 (0.0%) |
| Total | 0 (0.0%) | 0 (0.0%) |
Income Below Poverty Among Married-Couple vs Single-Parent Households in Herreid
| Children | Married-Couple Families | Single-Parent Households |
| No Children | 0 (0.0%) | 0 (0.0%) |
| 1 or 2 Children | 0 (0.0%) | 0 (0.0%) |
| 3 or 4 Children | 0 (0.0%) | 0 (0.0%) |
| 5 or more Children | 0 (0.0%) | 0 (0.0%) |
| Total | 0 (0.0%) | 0 (0.0%) |
Race in Herreid
The most populous races in Herreid are White / Caucasian (563 | 99.1%), Hispanic or Latino (4 | 0.7%), and Some other Race (4 | 0.7%).
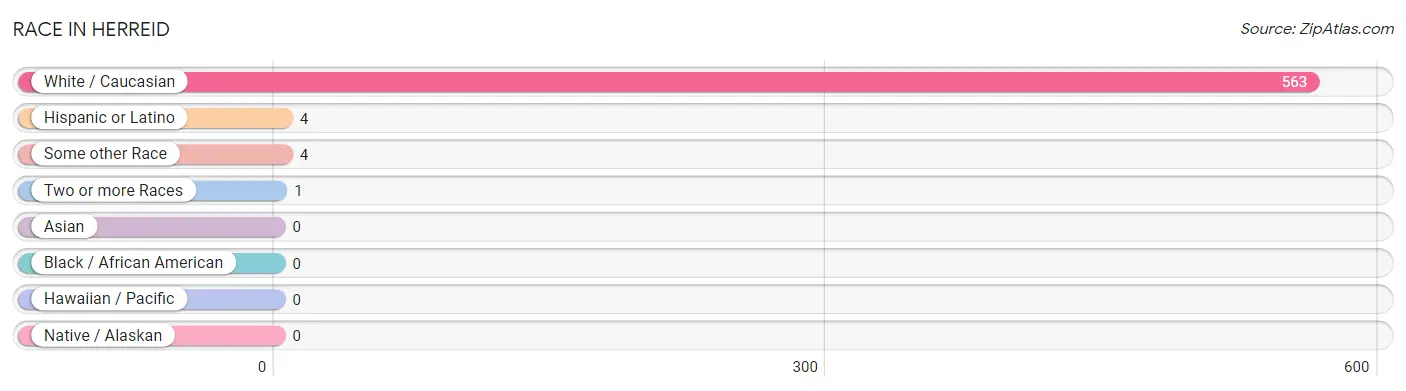
| Race | # Population | % Population |
| Asian | 0 | 0.0% |
| Black / African American | 0 | 0.0% |
| Hawaiian / Pacific | 0 | 0.0% |
| Hispanic or Latino | 4 | 0.7% |
| Native / Alaskan | 0 | 0.0% |
| White / Caucasian | 563 | 99.1% |
| Two or more Races | 1 | 0.2% |
| Some other Race | 4 | 0.7% |
| Total | 568 | 100.0% |
Ancestry in Herreid
The most populous ancestries reported in Herreid are German (468 | 82.4%), Dutch (170 | 29.9%), Norwegian (81 | 14.3%), Russian (60 | 10.6%), and English (20 | 3.5%), together accounting for 140.7% of all Herreid residents.
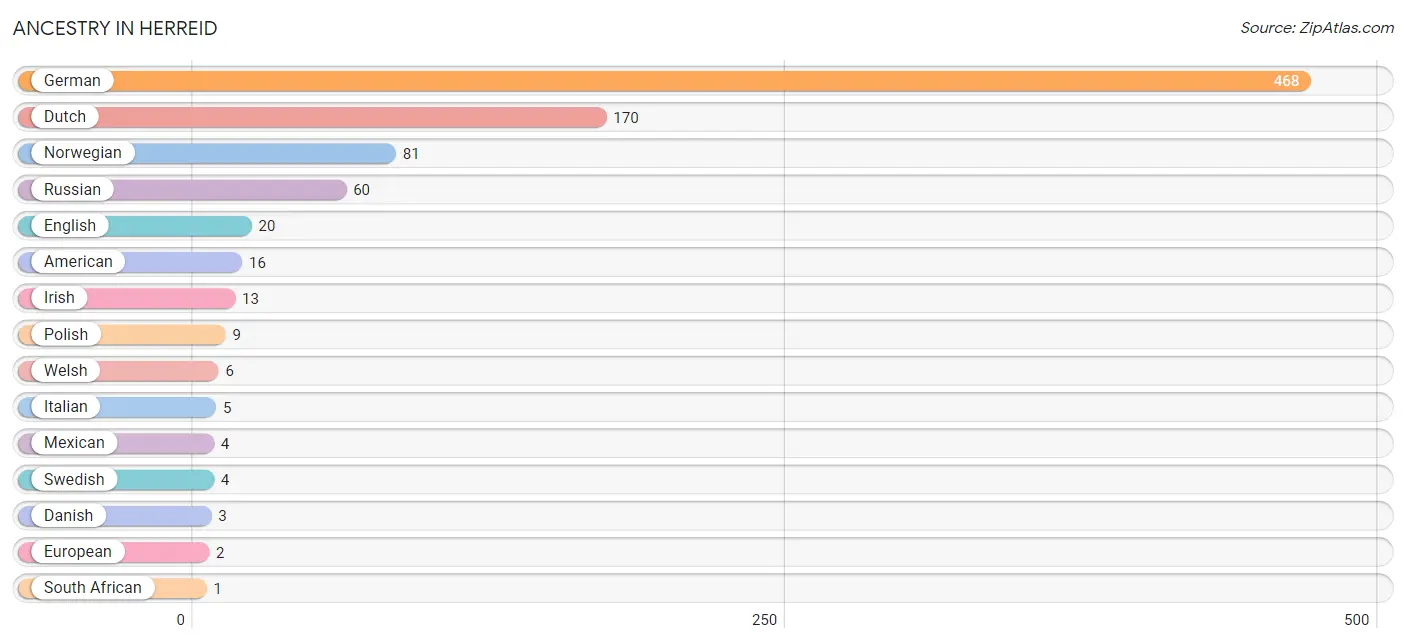
| Ancestry | # Population | % Population |
| American | 16 | 2.8% |
| Danish | 3 | 0.5% |
| Dutch | 170 | 29.9% |
| English | 20 | 3.5% |
| European | 2 | 0.4% |
| German | 468 | 82.4% |
| Irish | 13 | 2.3% |
| Italian | 5 | 0.9% |
| Mexican | 4 | 0.7% |
| Norwegian | 81 | 14.3% |
| Polish | 9 | 1.6% |
| Russian | 60 | 10.6% |
| South African | 1 | 0.2% |
| Subsaharan African | 1 | 0.2% |
| Swedish | 4 | 0.7% |
| Welsh | 6 | 1.1% | View All 16 Rows |
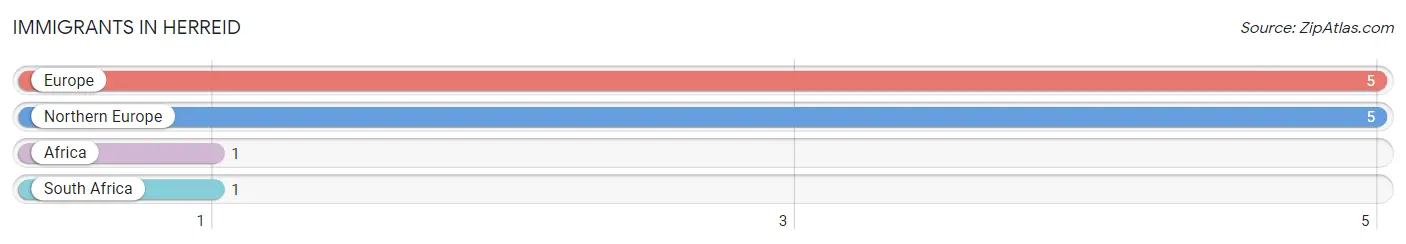
Immigrants in Herreid
The most numerous immigrant groups reported in Herreid came from Europe (5 | 0.9%), Northern Europe (5 | 0.9%), Africa (1 | 0.2%), and South Africa (1 | 0.2%), together accounting for 2.1% of all Herreid residents.
| Immigration Origin | # Population | % Population |
| Africa | 1 | 0.2% |
| Europe | 5 | 0.9% |
| Northern Europe | 5 | 0.9% |
| South Africa | 1 | 0.2% | View All 4 Rows |
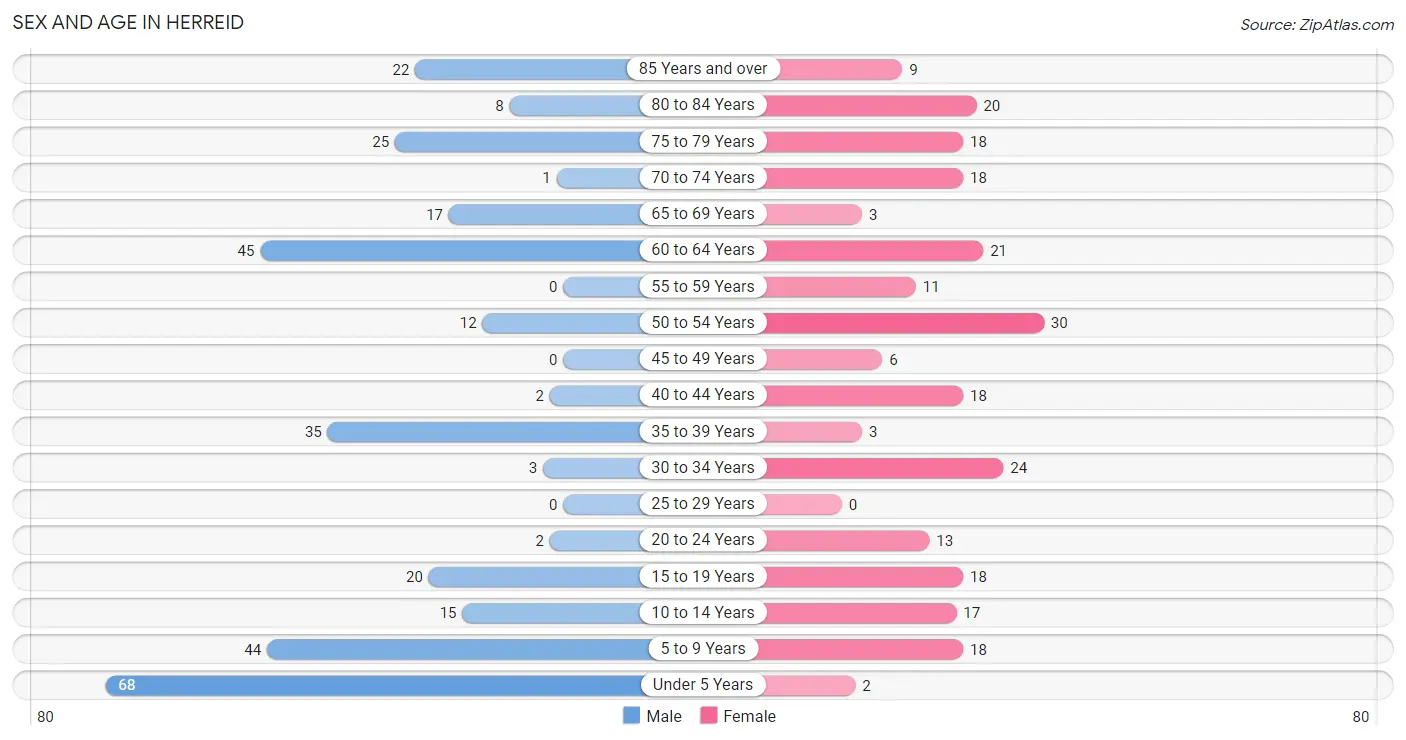
Sex and Age in Herreid
Sex and Age in Herreid
The most populous age groups in Herreid are Under 5 Years (68 | 21.3%) for men and 50 to 54 Years (30 | 12.0%) for women.
| Age Bracket | Male | Female |
| Under 5 Years | 68 (21.3%) | 2 (0.8%) |
| 5 to 9 Years | 44 (13.8%) | 18 (7.2%) |
| 10 to 14 Years | 15 (4.7%) | 17 (6.8%) |
| 15 to 19 Years | 20 (6.3%) | 18 (7.2%) |
| 20 to 24 Years | 2 (0.6%) | 13 (5.2%) |
| 25 to 29 Years | 0 (0.0%) | 0 (0.0%) |
| 30 to 34 Years | 3 (0.9%) | 24 (9.6%) |
| 35 to 39 Years | 35 (11.0%) | 3 (1.2%) |
| 40 to 44 Years | 2 (0.6%) | 18 (7.2%) |
| 45 to 49 Years | 0 (0.0%) | 6 (2.4%) |
| 50 to 54 Years | 12 (3.8%) | 30 (12.0%) |
| 55 to 59 Years | 0 (0.0%) | 11 (4.4%) |
| 60 to 64 Years | 45 (14.1%) | 21 (8.4%) |
| 65 to 69 Years | 17 (5.3%) | 3 (1.2%) |
| 70 to 74 Years | 1 (0.3%) | 18 (7.2%) |
| 75 to 79 Years | 25 (7.8%) | 18 (7.2%) |
| 80 to 84 Years | 8 (2.5%) | 20 (8.0%) |
| 85 Years and over | 22 (6.9%) | 9 (3.6%) |
| Total | 319 (100.0%) | 249 (100.0%) |
Families and Households in Herreid
Median Family Size in Herreid
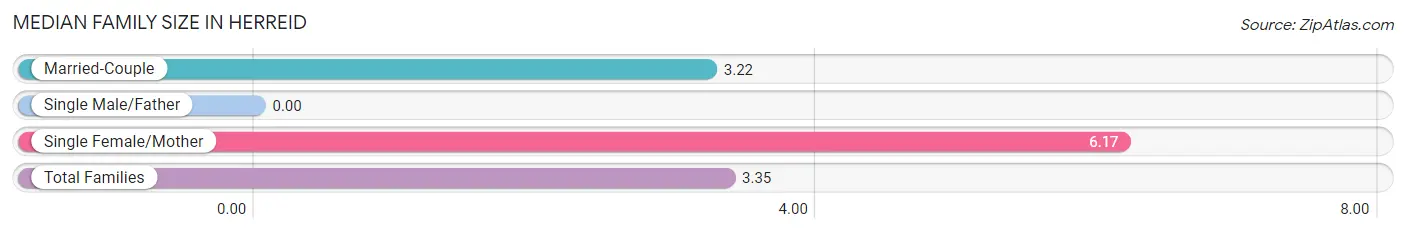
| Family Type | # Families | Family Size |
| Married-Couple | 134 (95.7%) | 3.22 |
| Single Male/Father | 0 (0.0%) | - |
| Single Female/Mother | 6 (4.3%) | 6.17 |
| Total Families | 140 (100.0%) | 3.35 |
Median Household Size in Herreid
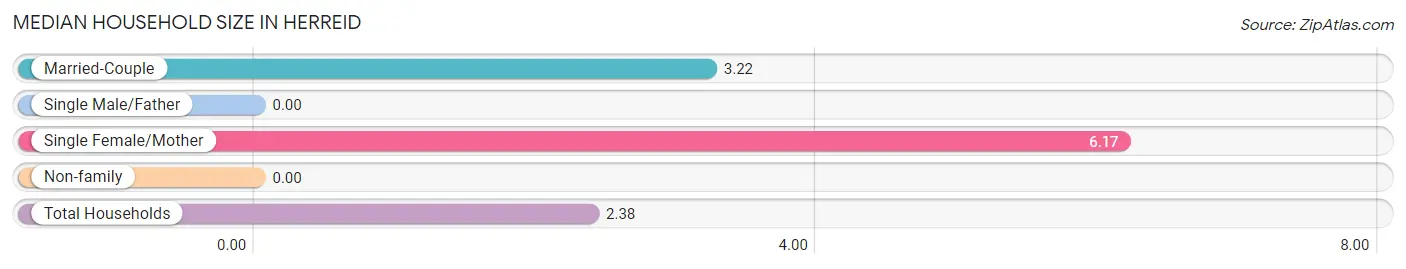
| Household Type | # Households | Household Size |
| Married-Couple | 134 (56.1%) | 3.22 |
| Single Male/Father | 0 (0.0%) | - |
| Single Female/Mother | 6 (2.5%) | 6.17 |
| Non-family | 99 (41.4%) | - |
| Total Households | 239 (100.0%) | 2.38 |
Household Size by Marriage Status in Herreid
Out of a total of 239 households in Herreid, 140 (58.6%) are family households, while 99 (41.4%) are nonfamily households. The most numerous type of family households are 2-person households, comprising 65, and the most common type of nonfamily households are 1-person households, comprising 99.
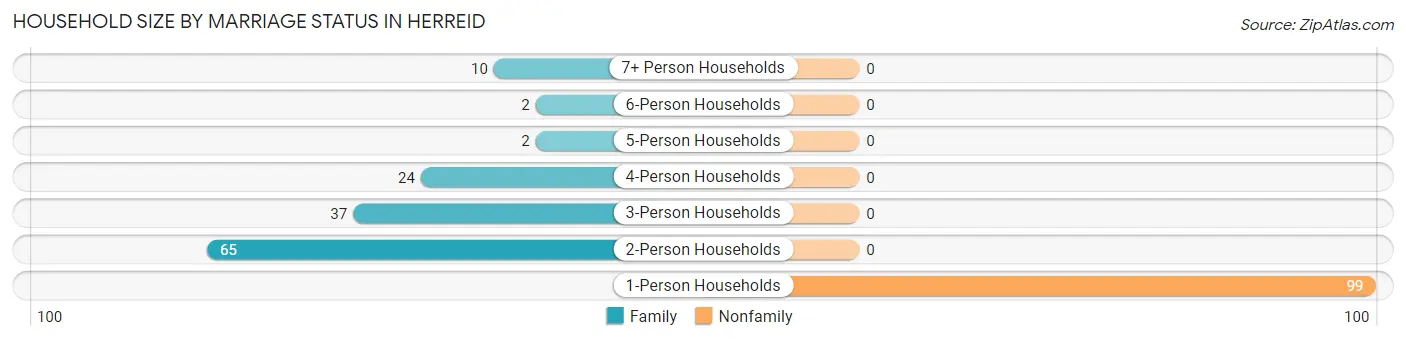
| Household Size | Family Households | Nonfamily Households |
| 1-Person Households | - | 99 (41.4%) |
| 2-Person Households | 65 (27.2%) | 0 (0.0%) |
| 3-Person Households | 37 (15.5%) | 0 (0.0%) |
| 4-Person Households | 24 (10.0%) | 0 (0.0%) |
| 5-Person Households | 2 (0.8%) | 0 (0.0%) |
| 6-Person Households | 2 (0.8%) | 0 (0.0%) |
| 7+ Person Households | 10 (4.2%) | 0 (0.0%) |
| Total | 140 (58.6%) | 99 (41.4%) |
Female Fertility in Herreid
Fertility by Age in Herreid
Average fertility rate in Herreid is 162.0 births per 1,000 women. Women in the age bracket of 35 to 50 years have the highest fertility rate with 268.0 births per 1,000 women. Women in the age bracket of 35 to 50 years acount for 83.3% of all women with births.
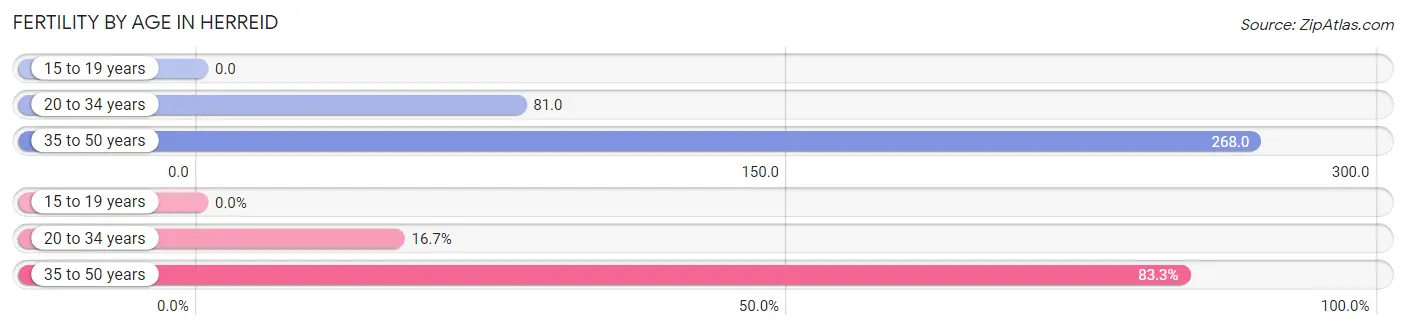
| Age Bracket | Women with Births | Births / 1,000 Women |
| 15 to 19 years | 0 (0.0%) | 0.0 |
| 20 to 34 years | 3 (16.7%) | 81.0 |
| 35 to 50 years | 15 (83.3%) | 268.0 |
| Total | 18 (100.0%) | 162.0 |
Fertility by Age by Marriage Status in Herreid
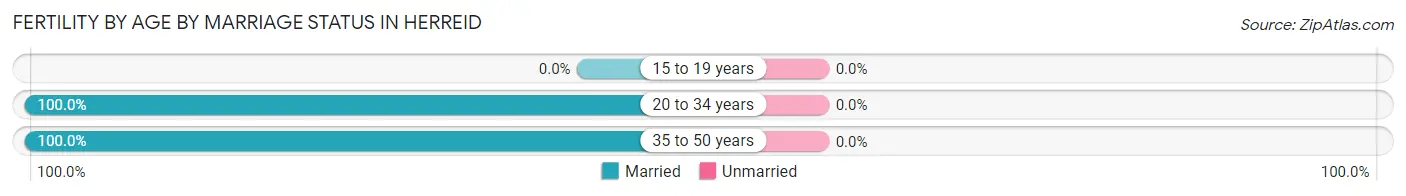
| Age Bracket | Married | Unmarried |
| 15 to 19 years | 0 (0.0%) | 0 (0.0%) |
| 20 to 34 years | 3 (100.0%) | 0 (0.0%) |
| 35 to 50 years | 15 (100.0%) | 0 (0.0%) |
| Total | 18 (100.0%) | 0 (0.0%) |
Fertility by Education in Herreid
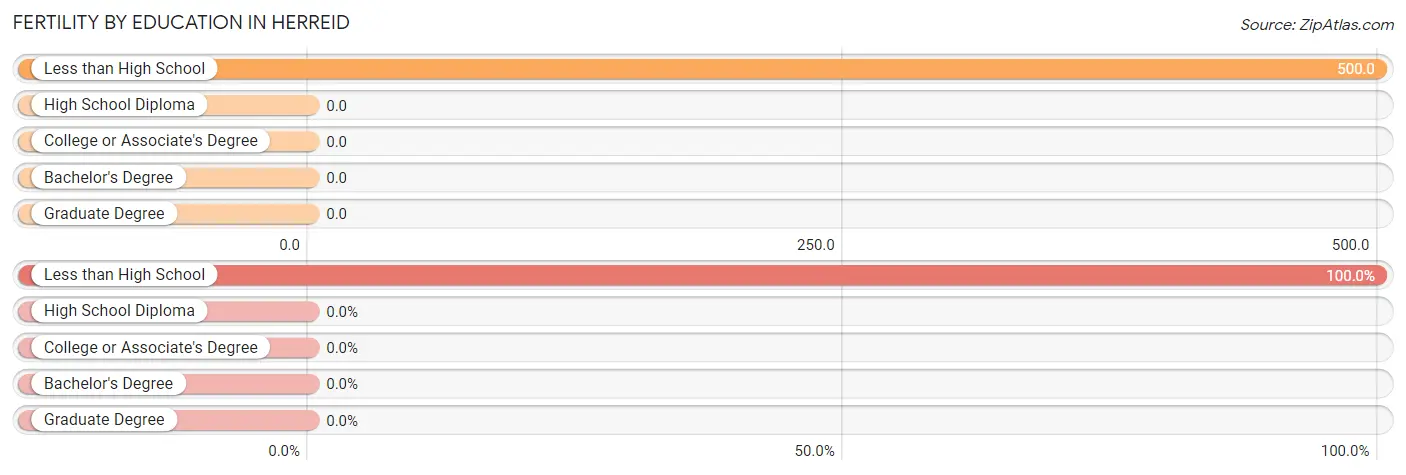
| Educational Attainment | Women with Births | Births / 1,000 Women |
| Less than High School | 18 (100.0%) | 500.0 |
| High School Diploma | 0 (0.0%) | 0.0 |
| College or Associate's Degree | 0 (0.0%) | 0.0 |
| Bachelor's Degree | 0 (0.0%) | 0.0 |
| Graduate Degree | 0 (0.0%) | 0.0 |
| Total | 18 (100.0%) | 162.0 |
Fertility by Education by Marriage Status in Herreid
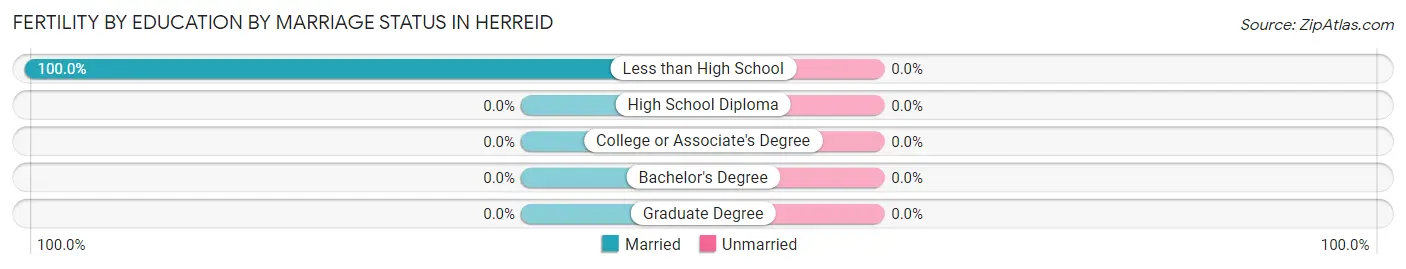
| Educational Attainment | Married | Unmarried |
| Less than High School | 18 (100.0%) | 0 (0.0%) |
| High School Diploma | 0 (0.0%) | 0 (0.0%) |
| College or Associate's Degree | 0 (0.0%) | 0 (0.0%) |
| Bachelor's Degree | 0 (0.0%) | 0 (0.0%) |
| Graduate Degree | 0 (0.0%) | 0 (0.0%) |
| Total | 18 (100.0%) | 0 (0.0%) |
Employment Characteristics in Herreid
Employment by Class of Employer in Herreid
Among the 239 employed individuals in Herreid, private company employees (144 | 60.3%), self-employed (not incorporated) (37 | 15.5%), and local government employees (32 | 13.4%) make up the most common classes of employment.
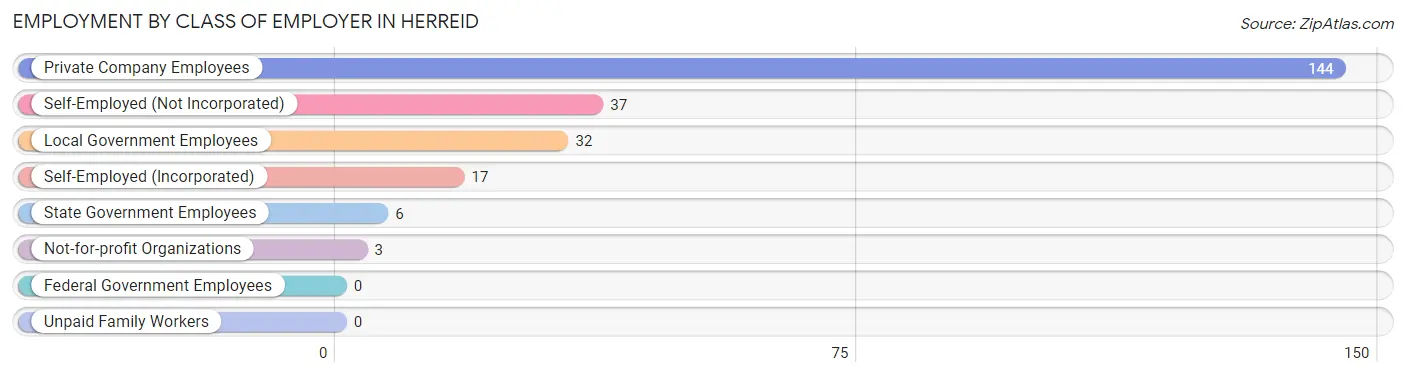
| Employer Class | # Employees | % Employees |
| Private Company Employees | 144 | 60.3% |
| Self-Employed (Incorporated) | 17 | 7.1% |
| Self-Employed (Not Incorporated) | 37 | 15.5% |
| Not-for-profit Organizations | 3 | 1.3% |
| Local Government Employees | 32 | 13.4% |
| State Government Employees | 6 | 2.5% |
| Federal Government Employees | 0 | 0.0% |
| Unpaid Family Workers | 0 | 0.0% |
| Total | 239 | 100.0% |
Employment Status by Age in Herreid
According to the labor force statistics for Herreid, out of the total population over 16 years of age (402), 63.2% or 254 individuals are in the labor force, with 5.9% or 15 of them unemployed. The age group with the highest labor force participation rate is 30 to 34 years, with 100.0% or 27 individuals in the labor force. Within the labor force, the 35 to 44 years age range has the highest percentage of unemployed individuals, with 26.3% or 15 of them being unemployed.
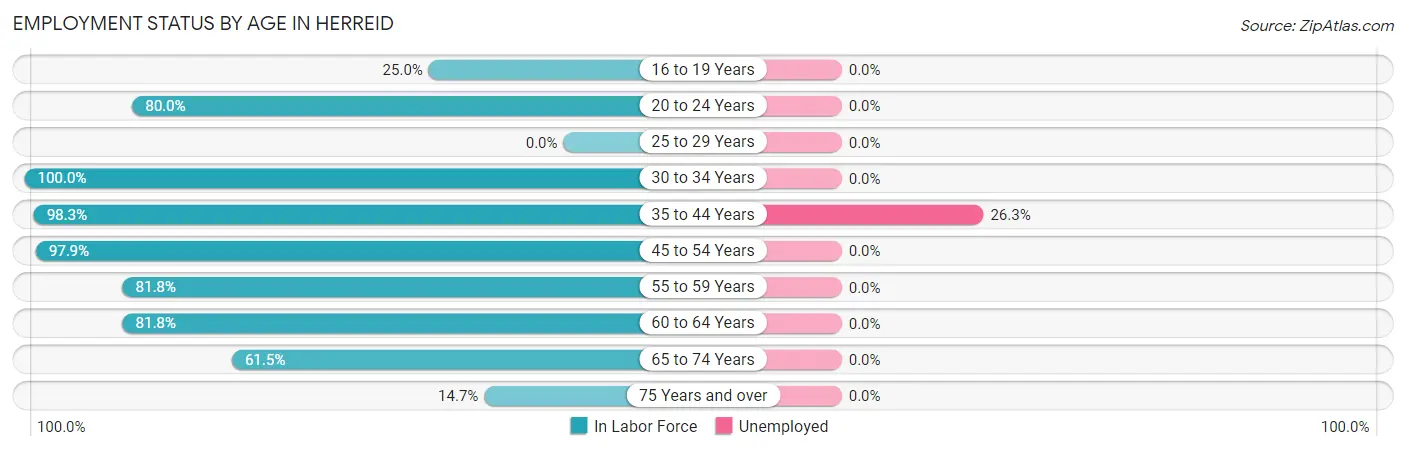
| Age Bracket | In Labor Force | Unemployed |
| 16 to 19 Years | 9 (25.0%) | 0 (0.0%) |
| 20 to 24 Years | 12 (80.0%) | 0 (0.0%) |
| 25 to 29 Years | 0 (0.0%) | 0 (0.0%) |
| 30 to 34 Years | 27 (100.0%) | 0 (0.0%) |
| 35 to 44 Years | 57 (98.3%) | 15 (26.3%) |
| 45 to 54 Years | 47 (97.9%) | 0 (0.0%) |
| 55 to 59 Years | 9 (81.8%) | 0 (0.0%) |
| 60 to 64 Years | 54 (81.8%) | 0 (0.0%) |
| 65 to 74 Years | 24 (61.5%) | 0 (0.0%) |
| 75 Years and over | 15 (14.7%) | 0 (0.0%) |
| Total | 254 (63.2%) | 15 (5.9%) |
Employment Status by Educational Attainment in Herreid
According to labor force statistics for Herreid, 92.4% of individuals (194) out of the total population between 25 and 64 years of age (210) are in the labor force, with 7.7% or 15 of them being unemployed. The group with the highest labor force participation rate are those with the educational attainment of high school diploma, with 100.0% or 52 individuals in the labor force. Within the labor force, individuals with less than high school education have the highest percentage of unemployment, with 45.5% or 15 of them being unemployed.
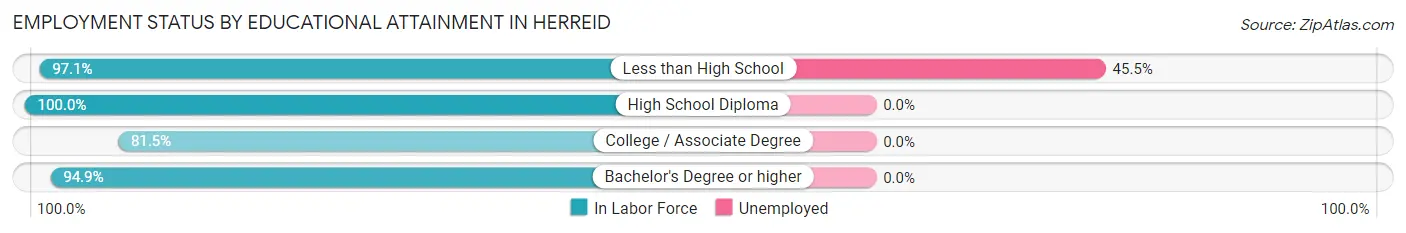
| Educational Attainment | In Labor Force | Unemployed |
| Less than High School | 33 (97.1%) | 15 (45.5%) |
| High School Diploma | 52 (100.0%) | 0 (0.0%) |
| College / Associate Degree | 53 (81.5%) | 0 (0.0%) |
| Bachelor's Degree or higher | 56 (94.9%) | 0 (0.0%) |
| Total | 194 (92.4%) | 16 (7.7%) |
Employment Occupations by Sex in Herreid
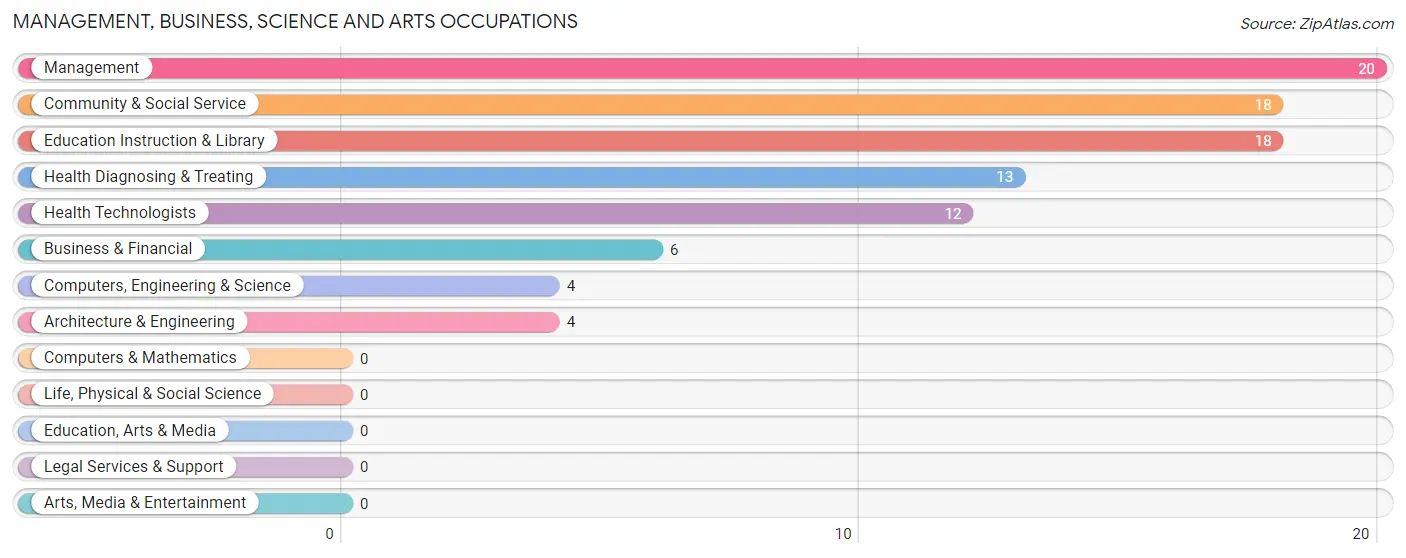
Management, Business, Science and Arts Occupations
The most common Management, Business, Science and Arts occupations in Herreid are Management (20 | 8.4%), Community & Social Service (18 | 7.5%), Education Instruction & Library (18 | 7.5%), Health Diagnosing & Treating (13 | 5.4%), and Health Technologists (12 | 5.0%).
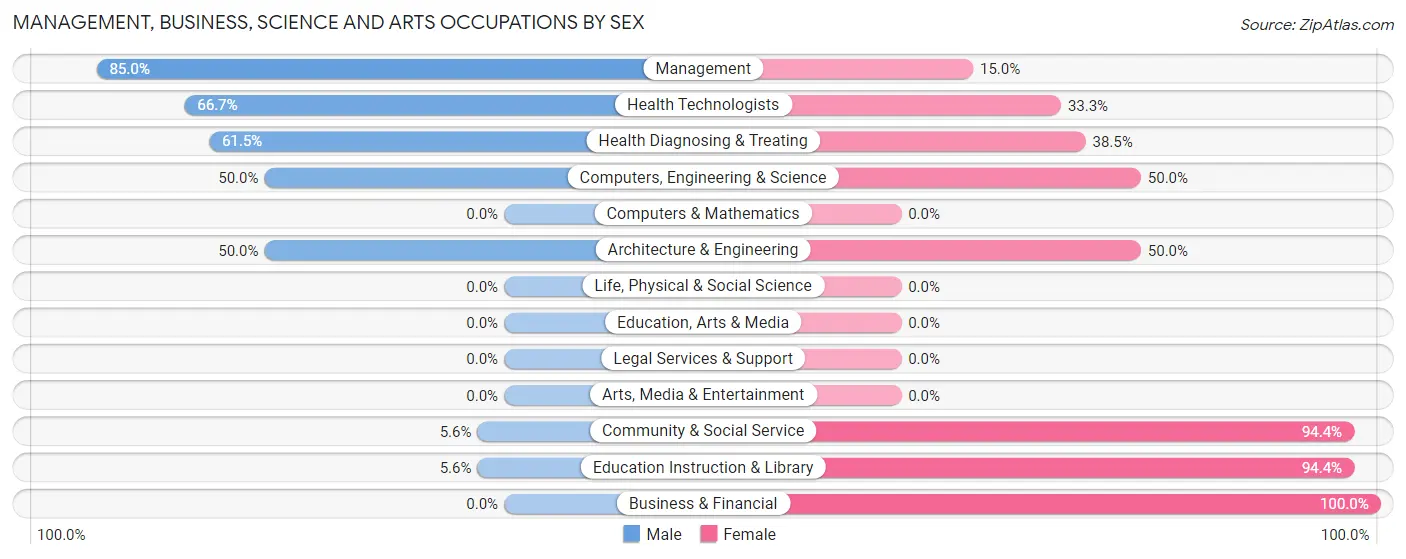
Management, Business, Science and Arts Occupations by Sex
Within the Management, Business, Science and Arts occupations in Herreid, the most male-oriented occupations are Management (85.0%), Health Technologists (66.7%), and Health Diagnosing & Treating (61.5%), while the most female-oriented occupations are Business & Financial (100.0%), Community & Social Service (94.4%), and Education Instruction & Library (94.4%).
| Occupation | Male | Female |
| Management | 17 (85.0%) | 3 (15.0%) |
| Business & Financial | 0 (0.0%) | 6 (100.0%) |
| Computers, Engineering & Science | 2 (50.0%) | 2 (50.0%) |
| Computers & Mathematics | 0 (0.0%) | 0 (0.0%) |
| Architecture & Engineering | 2 (50.0%) | 2 (50.0%) |
| Life, Physical & Social Science | 0 (0.0%) | 0 (0.0%) |
| Community & Social Service | 1 (5.6%) | 17 (94.4%) |
| Education, Arts & Media | 0 (0.0%) | 0 (0.0%) |
| Legal Services & Support | 0 (0.0%) | 0 (0.0%) |
| Education Instruction & Library | 1 (5.6%) | 17 (94.4%) |
| Arts, Media & Entertainment | 0 (0.0%) | 0 (0.0%) |
| Health Diagnosing & Treating | 8 (61.5%) | 5 (38.5%) |
| Health Technologists | 8 (66.7%) | 4 (33.3%) |
| Total (Category) | 28 (45.9%) | 33 (54.1%) |
| Total (Overall) | 124 (51.9%) | 115 (48.1%) |
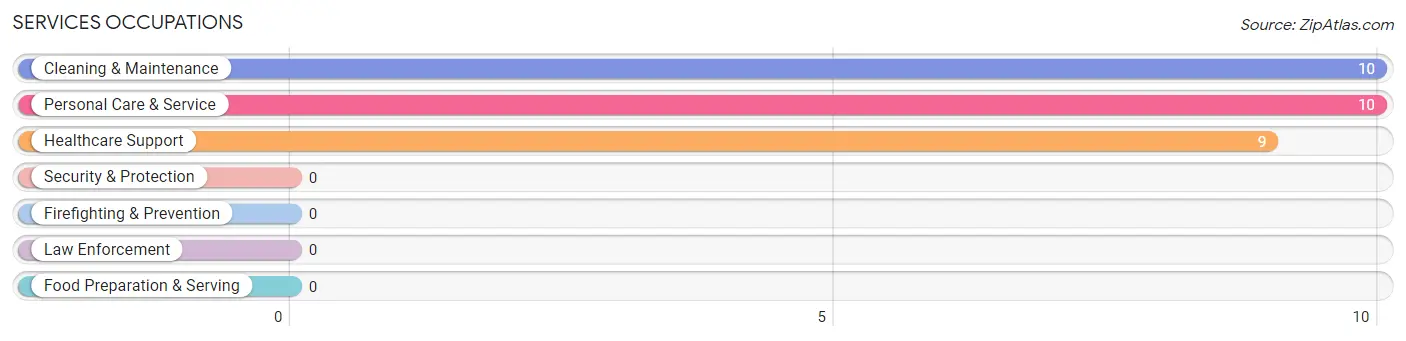
Services Occupations
The most common Services occupations in Herreid are Cleaning & Maintenance (10 | 4.2%), Personal Care & Service (10 | 4.2%), and Healthcare Support (9 | 3.8%).
Services Occupations by Sex
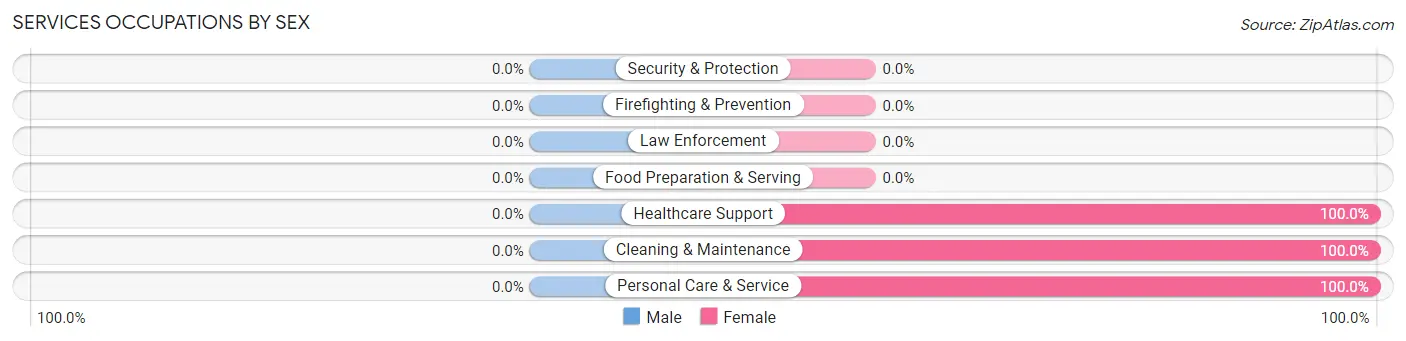
| Occupation | Male | Female |
| Healthcare Support | 0 (0.0%) | 9 (100.0%) |
| Security & Protection | 0 (0.0%) | 0 (0.0%) |
| Firefighting & Prevention | 0 (0.0%) | 0 (0.0%) |
| Law Enforcement | 0 (0.0%) | 0 (0.0%) |
| Food Preparation & Serving | 0 (0.0%) | 0 (0.0%) |
| Cleaning & Maintenance | 0 (0.0%) | 10 (100.0%) |
| Personal Care & Service | 0 (0.0%) | 10 (100.0%) |
| Total (Category) | 0 (0.0%) | 29 (100.0%) |
| Total (Overall) | 124 (51.9%) | 115 (48.1%) |
Sales and Office Occupations
The most common Sales and Office occupations in Herreid are Sales & Related (56 | 23.4%), and Office & Administration (20 | 8.4%).
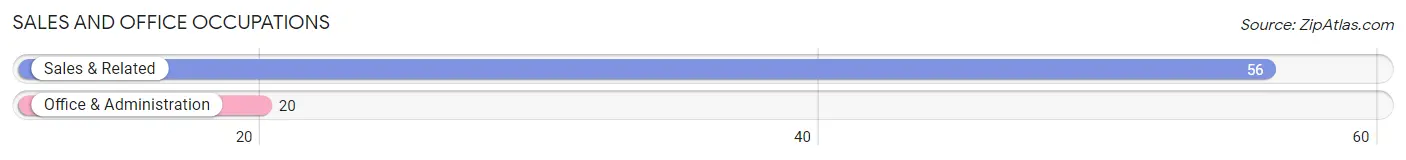
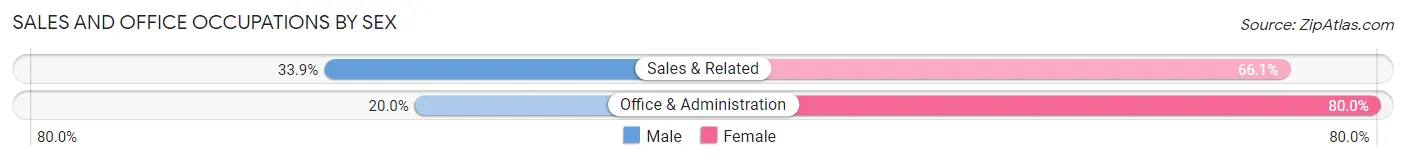
Sales and Office Occupations by Sex
| Occupation | Male | Female |
| Sales & Related | 19 (33.9%) | 37 (66.1%) |
| Office & Administration | 4 (20.0%) | 16 (80.0%) |
| Total (Category) | 23 (30.3%) | 53 (69.7%) |
| Total (Overall) | 124 (51.9%) | 115 (48.1%) |
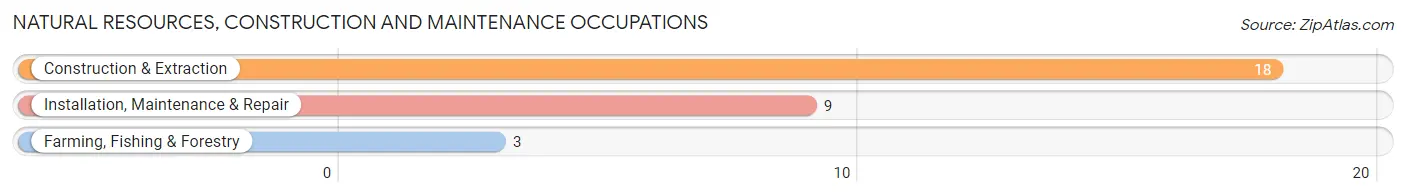
Natural Resources, Construction and Maintenance Occupations
The most common Natural Resources, Construction and Maintenance occupations in Herreid are Construction & Extraction (18 | 7.5%), Installation, Maintenance & Repair (9 | 3.8%), and Farming, Fishing & Forestry (3 | 1.3%).
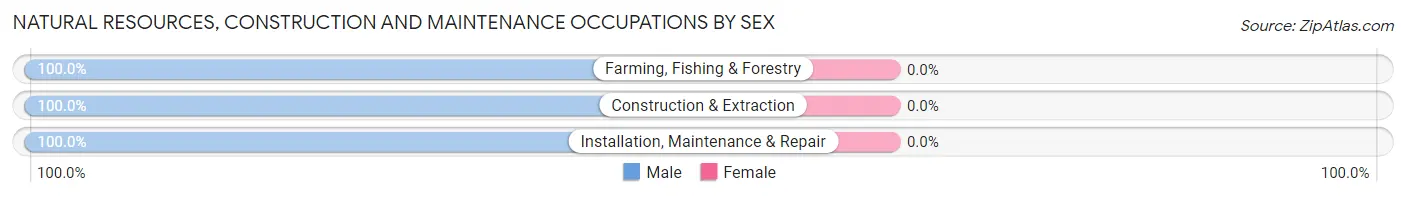
Natural Resources, Construction and Maintenance Occupations by Sex
| Occupation | Male | Female |
| Farming, Fishing & Forestry | 3 (100.0%) | 0 (0.0%) |
| Construction & Extraction | 18 (100.0%) | 0 (0.0%) |
| Installation, Maintenance & Repair | 9 (100.0%) | 0 (0.0%) |
| Total (Category) | 30 (100.0%) | 0 (0.0%) |
| Total (Overall) | 124 (51.9%) | 115 (48.1%) |
Production, Transportation and Moving Occupations
The most common Production, Transportation and Moving occupations in Herreid are Transportation (35 | 14.6%), Production (6 | 2.5%), and Material Moving (2 | 0.8%).
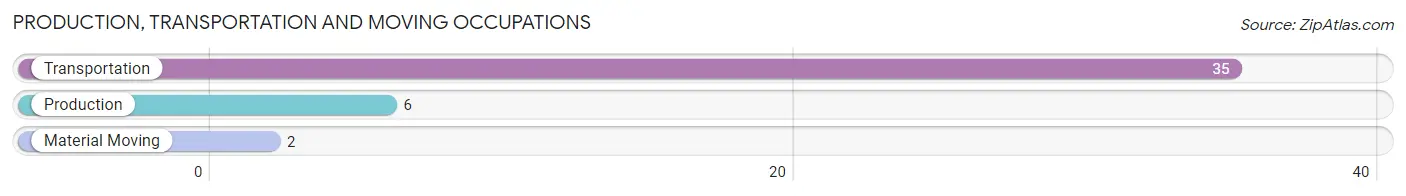
Production, Transportation and Moving Occupations by Sex
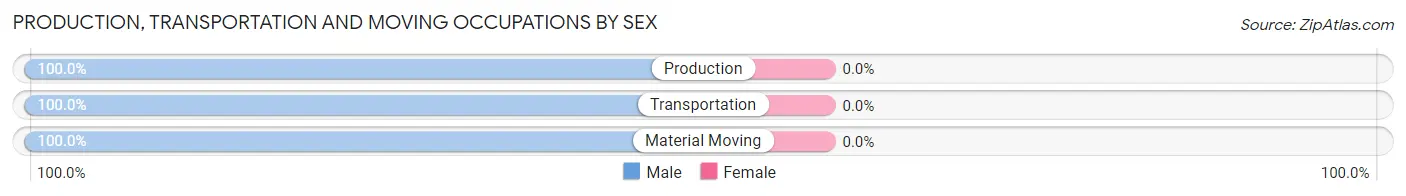
| Occupation | Male | Female |
| Production | 6 (100.0%) | 0 (0.0%) |
| Transportation | 35 (100.0%) | 0 (0.0%) |
| Material Moving | 2 (100.0%) | 0 (0.0%) |
| Total (Category) | 43 (100.0%) | 0 (0.0%) |
| Total (Overall) | 124 (51.9%) | 115 (48.1%) |
Employment Industries by Sex in Herreid
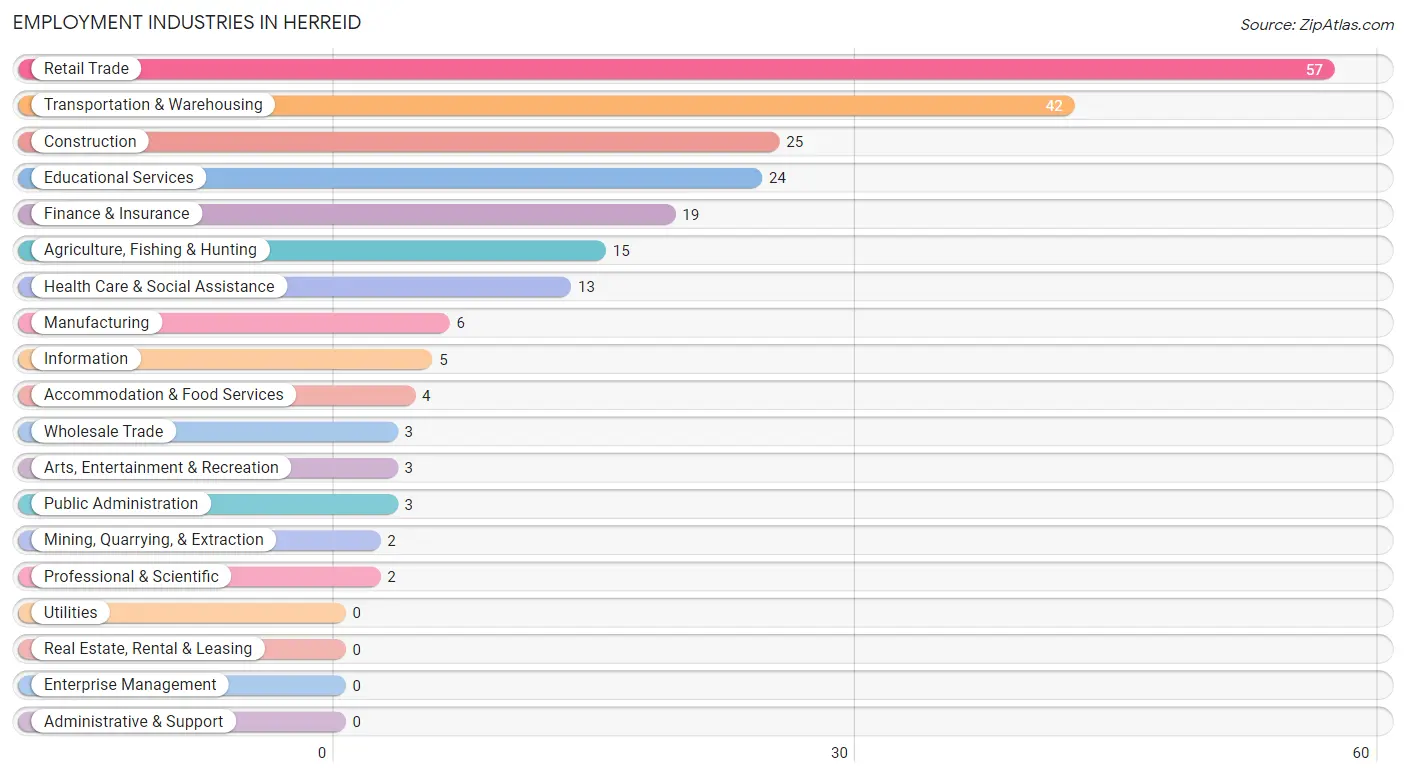
Employment Industries in Herreid
The major employment industries in Herreid include Retail Trade (57 | 23.8%), Transportation & Warehousing (42 | 17.6%), Construction (25 | 10.5%), Educational Services (24 | 10.0%), and Finance & Insurance (19 | 8.0%).
Employment Industries by Sex in Herreid
The Herreid industries that see more men than women are Agriculture, Fishing & Hunting (100.0%), Mining, Quarrying, & Extraction (100.0%), and Manufacturing (100.0%), whereas the industries that tend to have a higher number of women are Information (100.0%), Professional & Scientific (100.0%), and Arts, Entertainment & Recreation (100.0%).
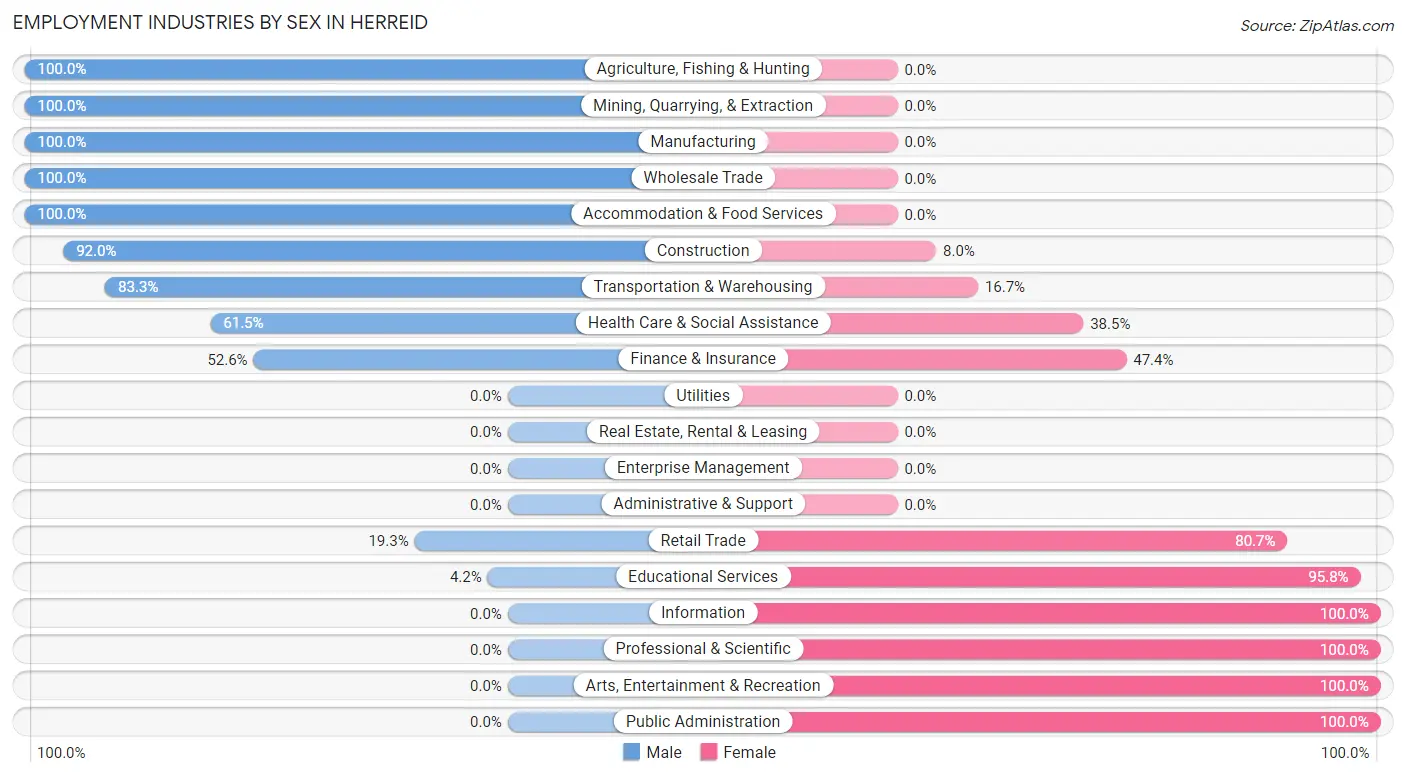
| Industry | Male | Female |
| Agriculture, Fishing & Hunting | 15 (100.0%) | 0 (0.0%) |
| Mining, Quarrying, & Extraction | 2 (100.0%) | 0 (0.0%) |
| Construction | 23 (92.0%) | 2 (8.0%) |
| Manufacturing | 6 (100.0%) | 0 (0.0%) |
| Wholesale Trade | 3 (100.0%) | 0 (0.0%) |
| Retail Trade | 11 (19.3%) | 46 (80.7%) |
| Transportation & Warehousing | 35 (83.3%) | 7 (16.7%) |
| Utilities | 0 (0.0%) | 0 (0.0%) |
| Information | 0 (0.0%) | 5 (100.0%) |
| Finance & Insurance | 10 (52.6%) | 9 (47.4%) |
| Real Estate, Rental & Leasing | 0 (0.0%) | 0 (0.0%) |
| Professional & Scientific | 0 (0.0%) | 2 (100.0%) |
| Enterprise Management | 0 (0.0%) | 0 (0.0%) |
| Administrative & Support | 0 (0.0%) | 0 (0.0%) |
| Educational Services | 1 (4.2%) | 23 (95.8%) |
| Health Care & Social Assistance | 8 (61.5%) | 5 (38.5%) |
| Arts, Entertainment & Recreation | 0 (0.0%) | 3 (100.0%) |
| Accommodation & Food Services | 4 (100.0%) | 0 (0.0%) |
| Public Administration | 0 (0.0%) | 3 (100.0%) |
| Total | 124 (51.9%) | 115 (48.1%) |
Education in Herreid
School Enrollment in Herreid
The most common levels of schooling among the 160 students in Herreid are elementary school (63 | 39.4%), high school (49 | 30.6%), and nursery / preschool (24 | 15.0%).
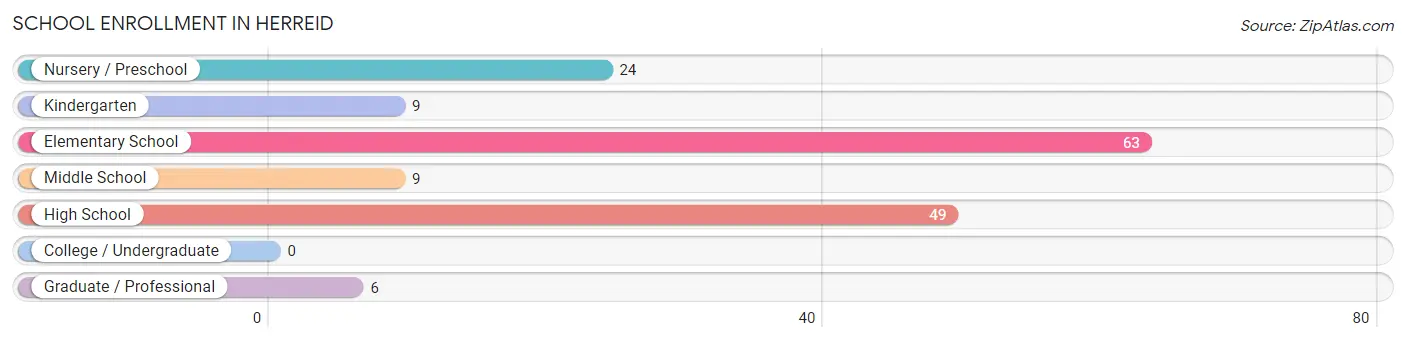
| School Level | # Students | % Students |
| Nursery / Preschool | 24 | 15.0% |
| Kindergarten | 9 | 5.6% |
| Elementary School | 63 | 39.4% |
| Middle School | 9 | 5.6% |
| High School | 49 | 30.6% |
| College / Undergraduate | 0 | 0.0% |
| Graduate / Professional | 6 | 3.7% |
| Total | 160 | 100.0% |
School Enrollment by Age by Funding Source in Herreid
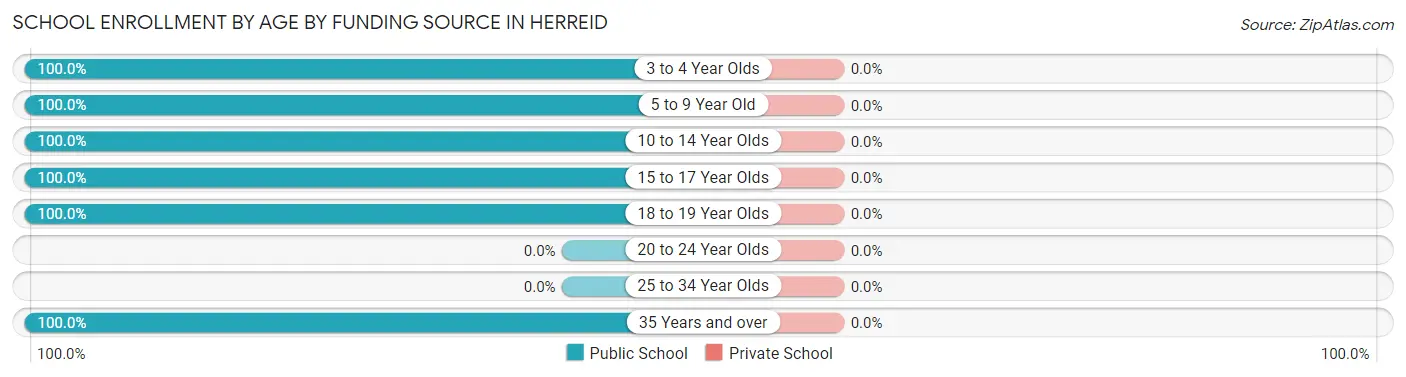
| Age Bracket | Public School | Private School |
| 3 to 4 Year Olds | 22 (100.0%) | 0 (0.0%) |
| 5 to 9 Year Old | 62 (100.0%) | 0 (0.0%) |
| 10 to 14 Year Olds | 32 (100.0%) | 0 (0.0%) |
| 15 to 17 Year Olds | 29 (100.0%) | 0 (0.0%) |
| 18 to 19 Year Olds | 9 (100.0%) | 0 (0.0%) |
| 20 to 24 Year Olds | 0 (0.0%) | 0 (0.0%) |
| 25 to 34 Year Olds | 0 (0.0%) | 0 (0.0%) |
| 35 Years and over | 6 (100.0%) | 0 (0.0%) |
| Total | 160 (100.0%) | 0 (0.0%) |
Educational Attainment by Field of Study in Herreid
Science & technology (24 | 28.9%), education (24 | 28.9%), business (14 | 16.9%), bio, nature & agricultural (12 | 14.5%), and physical & health sciences (9 | 10.8%) are the most common fields of study among 83 individuals in Herreid who have obtained a bachelor's degree or higher.
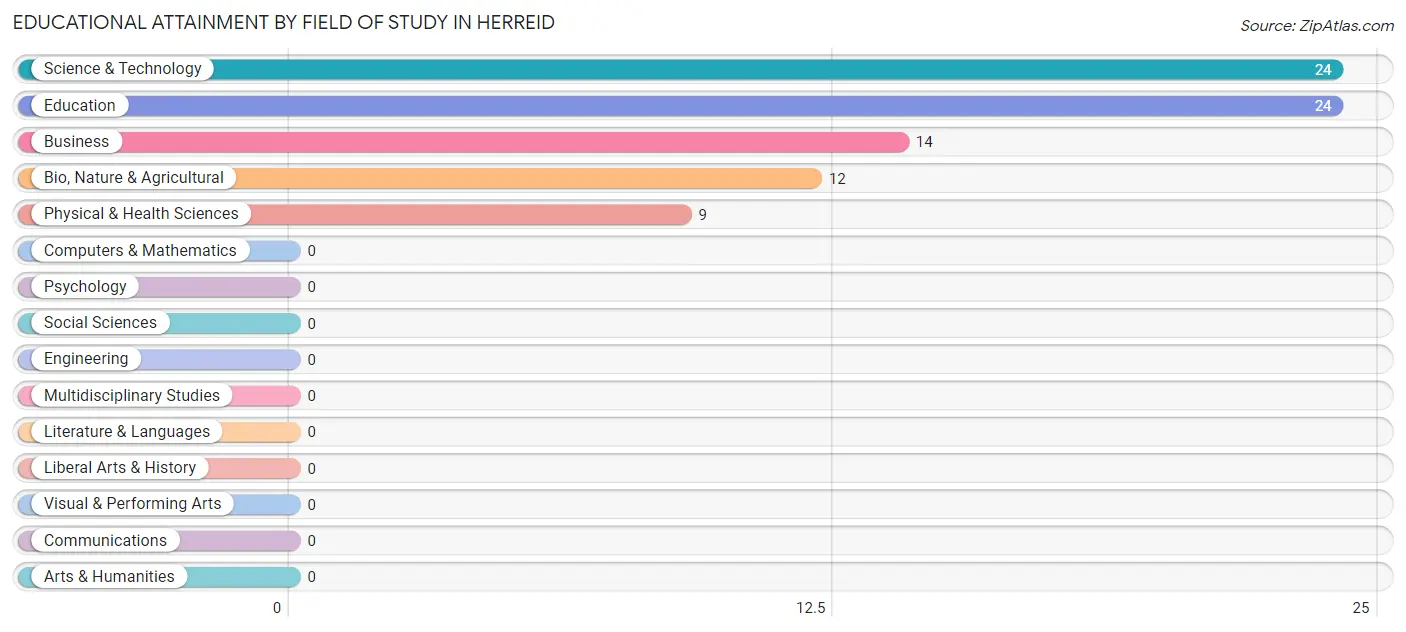
| Field of Study | # Graduates | % Graduates |
| Computers & Mathematics | 0 | 0.0% |
| Bio, Nature & Agricultural | 12 | 14.5% |
| Physical & Health Sciences | 9 | 10.8% |
| Psychology | 0 | 0.0% |
| Social Sciences | 0 | 0.0% |
| Engineering | 0 | 0.0% |
| Multidisciplinary Studies | 0 | 0.0% |
| Science & Technology | 24 | 28.9% |
| Business | 14 | 16.9% |
| Education | 24 | 28.9% |
| Literature & Languages | 0 | 0.0% |
| Liberal Arts & History | 0 | 0.0% |
| Visual & Performing Arts | 0 | 0.0% |
| Communications | 0 | 0.0% |
| Arts & Humanities | 0 | 0.0% |
| Total | 83 | 100.0% |
Transportation & Commute in Herreid
Vehicle Availability by Sex in Herreid
The most prevalent vehicle ownership categories in Herreid are males with 2 vehicles (42, accounting for 33.9%) and females with 2 vehicles (50, making up 36.5%).
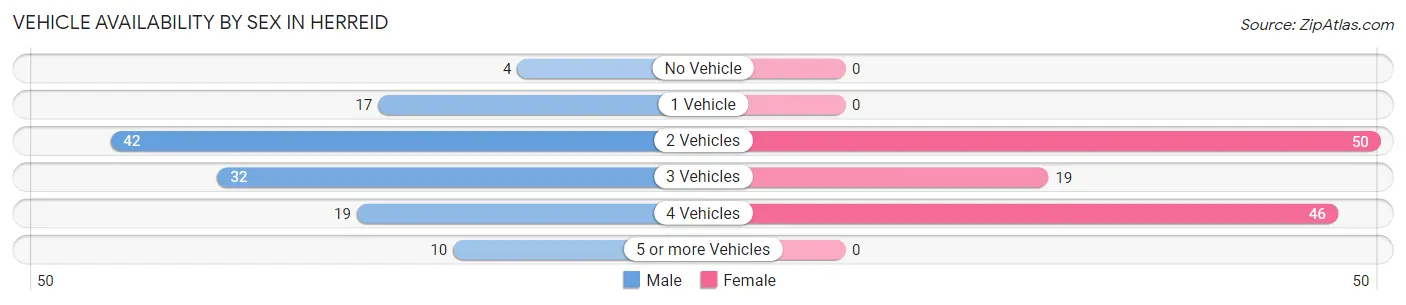
| Vehicles Available | Male | Female |
| No Vehicle | 4 (3.2%) | 0 (0.0%) |
| 1 Vehicle | 17 (13.7%) | 0 (0.0%) |
| 2 Vehicles | 42 (33.9%) | 50 (43.5%) |
| 3 Vehicles | 32 (25.8%) | 19 (16.5%) |
| 4 Vehicles | 19 (15.3%) | 46 (40.0%) |
| 5 or more Vehicles | 10 (8.1%) | 0 (0.0%) |
| Total | 124 (100.0%) | 115 (100.0%) |
Commute Time in Herreid
The most frequently occuring commute durations in Herreid are 5 to 9 minutes (88 commuters, 41.9%), less than 5 minutes (35 commuters, 16.7%), and 20 to 24 minutes (25 commuters, 11.9%).
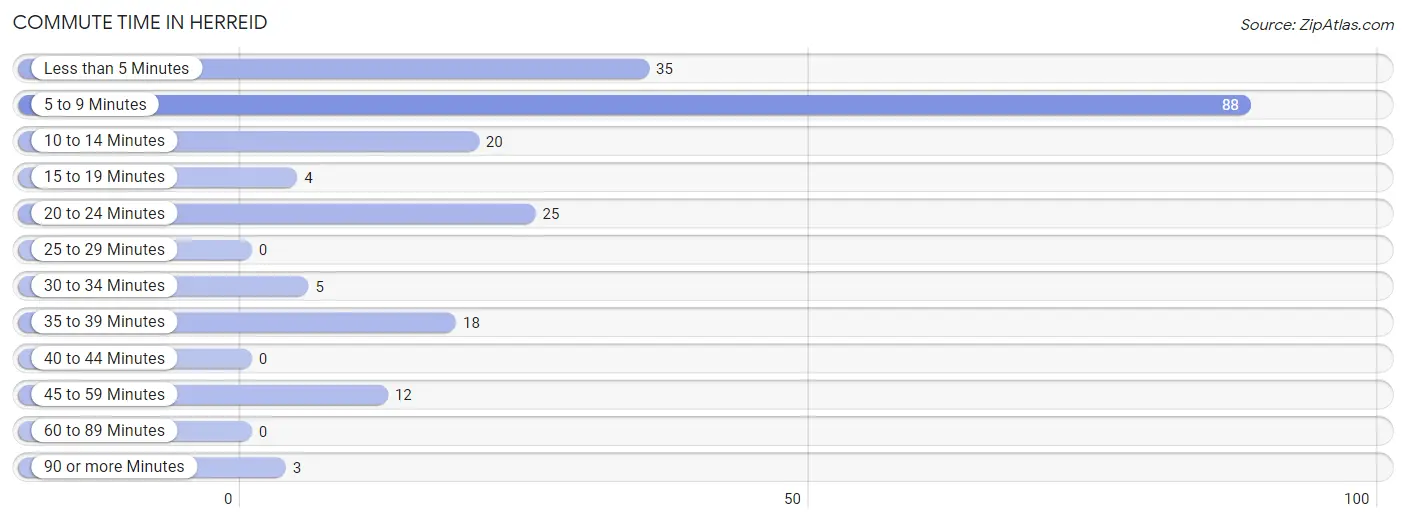
| Commute Time | # Commuters | % Commuters |
| Less than 5 Minutes | 35 | 16.7% |
| 5 to 9 Minutes | 88 | 41.9% |
| 10 to 14 Minutes | 20 | 9.5% |
| 15 to 19 Minutes | 4 | 1.9% |
| 20 to 24 Minutes | 25 | 11.9% |
| 25 to 29 Minutes | 0 | 0.0% |
| 30 to 34 Minutes | 5 | 2.4% |
| 35 to 39 Minutes | 18 | 8.6% |
| 40 to 44 Minutes | 0 | 0.0% |
| 45 to 59 Minutes | 12 | 5.7% |
| 60 to 89 Minutes | 0 | 0.0% |
| 90 or more Minutes | 3 | 1.4% |
Commute Time by Sex in Herreid
The most common commute times in Herreid are 5 to 9 minutes (29 commuters, 25.4%) for males and 5 to 9 minutes (59 commuters, 61.5%) for females.
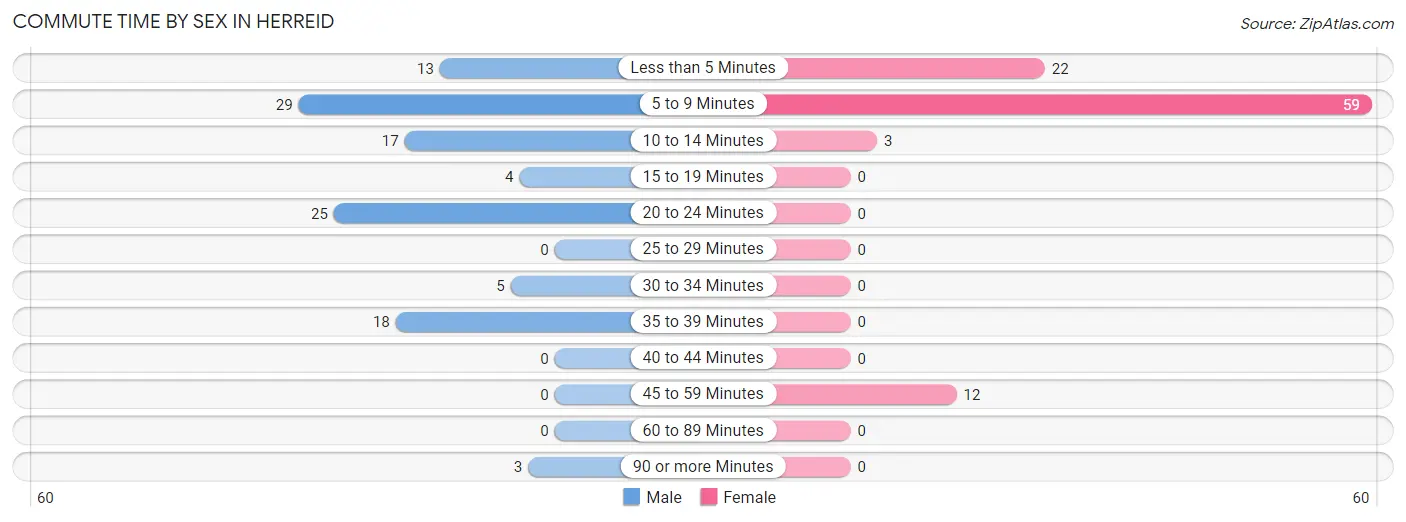
| Commute Time | Male | Female |
| Less than 5 Minutes | 13 (11.4%) | 22 (22.9%) |
| 5 to 9 Minutes | 29 (25.4%) | 59 (61.5%) |
| 10 to 14 Minutes | 17 (14.9%) | 3 (3.1%) |
| 15 to 19 Minutes | 4 (3.5%) | 0 (0.0%) |
| 20 to 24 Minutes | 25 (21.9%) | 0 (0.0%) |
| 25 to 29 Minutes | 0 (0.0%) | 0 (0.0%) |
| 30 to 34 Minutes | 5 (4.4%) | 0 (0.0%) |
| 35 to 39 Minutes | 18 (15.8%) | 0 (0.0%) |
| 40 to 44 Minutes | 0 (0.0%) | 0 (0.0%) |
| 45 to 59 Minutes | 0 (0.0%) | 12 (12.5%) |
| 60 to 89 Minutes | 0 (0.0%) | 0 (0.0%) |
| 90 or more Minutes | 3 (2.6%) | 0 (0.0%) |
Time of Departure to Work by Sex in Herreid
The most frequent times of departure to work in Herreid are 8:00 AM to 8:29 AM (31, 27.2%) for males and 5:00 AM to 5:29 AM (29, 30.2%) for females.
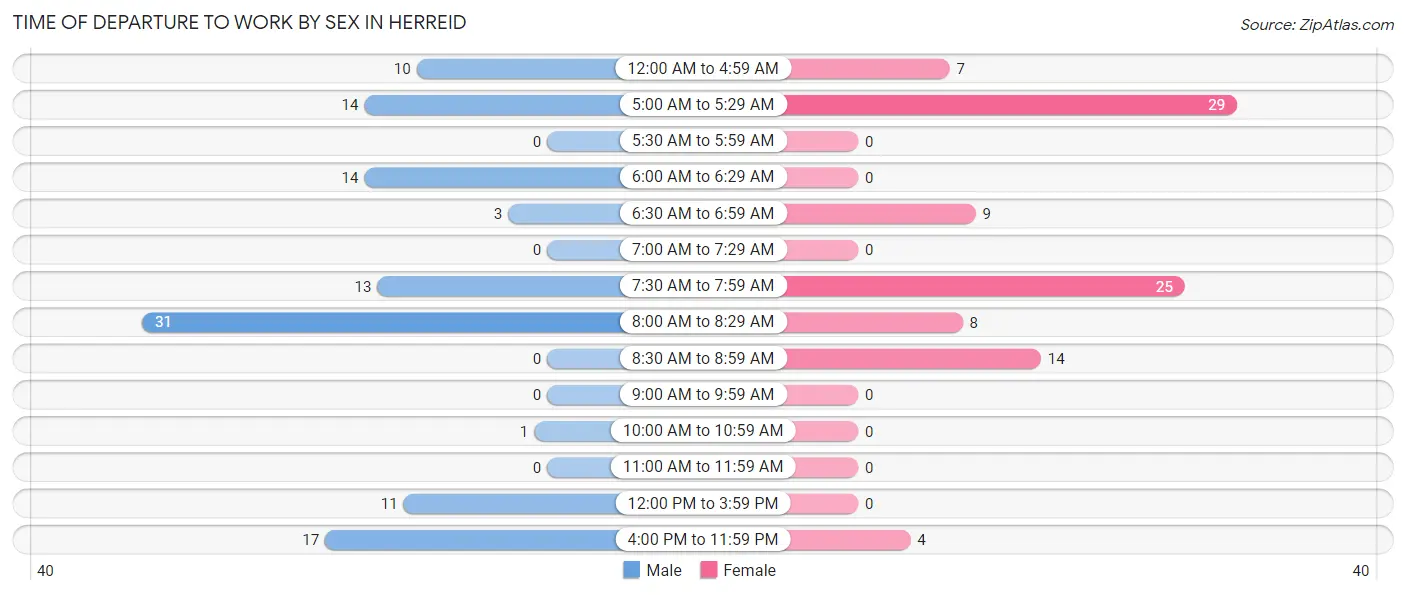
| Time of Departure | Male | Female |
| 12:00 AM to 4:59 AM | 10 (8.8%) | 7 (7.3%) |
| 5:00 AM to 5:29 AM | 14 (12.3%) | 29 (30.2%) |
| 5:30 AM to 5:59 AM | 0 (0.0%) | 0 (0.0%) |
| 6:00 AM to 6:29 AM | 14 (12.3%) | 0 (0.0%) |
| 6:30 AM to 6:59 AM | 3 (2.6%) | 9 (9.4%) |
| 7:00 AM to 7:29 AM | 0 (0.0%) | 0 (0.0%) |
| 7:30 AM to 7:59 AM | 13 (11.4%) | 25 (26.0%) |
| 8:00 AM to 8:29 AM | 31 (27.2%) | 8 (8.3%) |
| 8:30 AM to 8:59 AM | 0 (0.0%) | 14 (14.6%) |
| 9:00 AM to 9:59 AM | 0 (0.0%) | 0 (0.0%) |
| 10:00 AM to 10:59 AM | 1 (0.9%) | 0 (0.0%) |
| 11:00 AM to 11:59 AM | 0 (0.0%) | 0 (0.0%) |
| 12:00 PM to 3:59 PM | 11 (9.7%) | 0 (0.0%) |
| 4:00 PM to 11:59 PM | 17 (14.9%) | 4 (4.2%) |
| Total | 114 (100.0%) | 96 (100.0%) |
Housing Occupancy in Herreid
Occupancy by Ownership in Herreid
Of the total 239 dwellings in Herreid, owner-occupied units account for 184 (77.0%), while renter-occupied units make up 55 (23.0%).
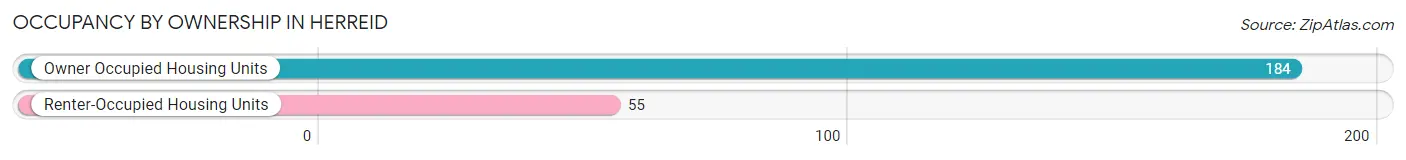
| Occupancy | # Housing Units | % Housing Units |
| Owner Occupied Housing Units | 184 | 77.0% |
| Renter-Occupied Housing Units | 55 | 23.0% |
| Total Occupied Housing Units | 239 | 100.0% |
Occupancy by Household Size in Herreid
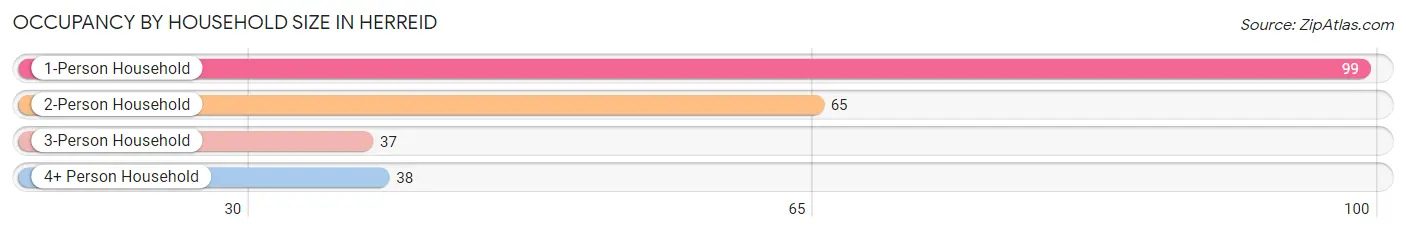
| Household Size | # Housing Units | % Housing Units |
| 1-Person Household | 99 | 41.4% |
| 2-Person Household | 65 | 27.2% |
| 3-Person Household | 37 | 15.5% |
| 4+ Person Household | 38 | 15.9% |
| Total Housing Units | 239 | 100.0% |
Occupancy by Ownership by Household Size in Herreid
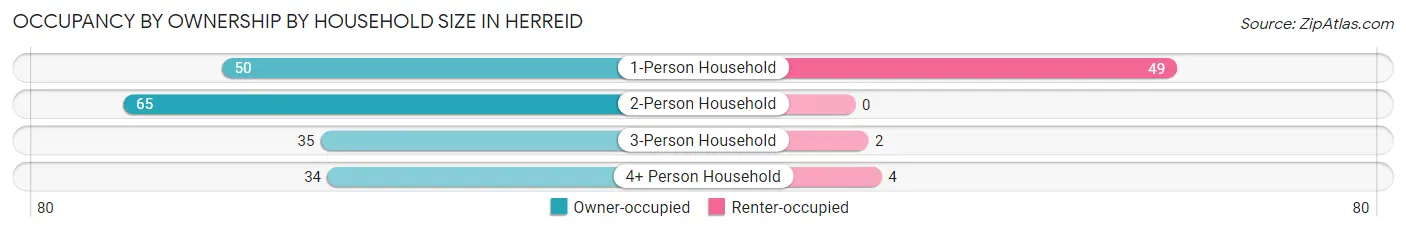
| Household Size | Owner-occupied | Renter-occupied |
| 1-Person Household | 50 (50.5%) | 49 (49.5%) |
| 2-Person Household | 65 (100.0%) | 0 (0.0%) |
| 3-Person Household | 35 (94.6%) | 2 (5.4%) |
| 4+ Person Household | 34 (89.5%) | 4 (10.5%) |
| Total Housing Units | 184 (77.0%) | 55 (23.0%) |
Occupancy by Educational Attainment in Herreid
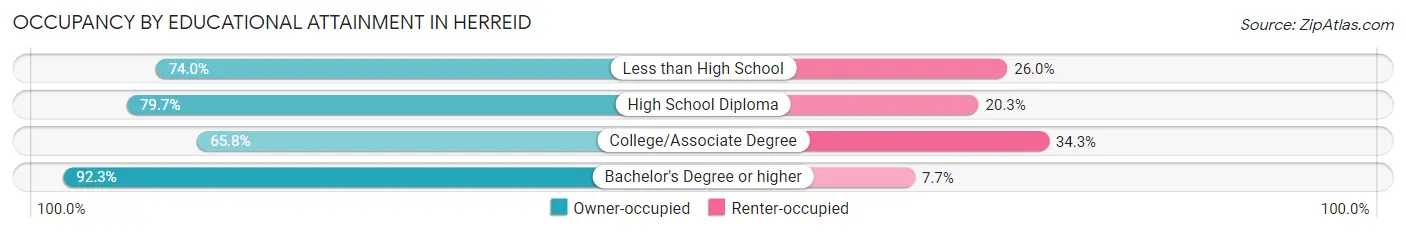
| Household Size | Owner-occupied | Renter-occupied |
| Less than High School | 37 (74.0%) | 13 (26.0%) |
| High School Diploma | 51 (79.7%) | 13 (20.3%) |
| College/Associate Degree | 48 (65.7%) | 25 (34.3%) |
| Bachelor's Degree or higher | 48 (92.3%) | 4 (7.7%) |
Occupancy by Age of Householder in Herreid
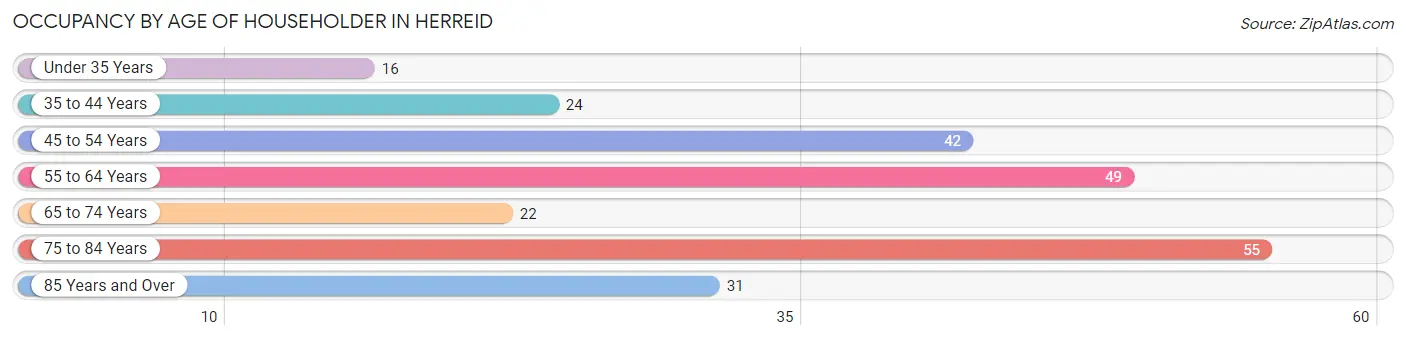
| Age Bracket | # Households | % Households |
| Under 35 Years | 16 | 6.7% |
| 35 to 44 Years | 24 | 10.0% |
| 45 to 54 Years | 42 | 17.6% |
| 55 to 64 Years | 49 | 20.5% |
| 65 to 74 Years | 22 | 9.2% |
| 75 to 84 Years | 55 | 23.0% |
| 85 Years and Over | 31 | 13.0% |
| Total | 239 | 100.0% |
Housing Finances in Herreid
Median Income by Occupancy in Herreid
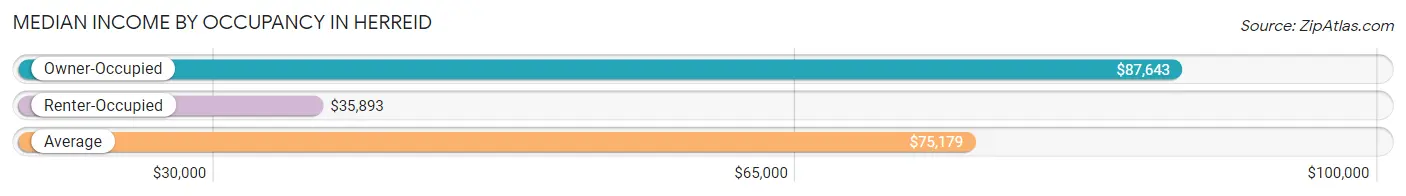
| Occupancy Type | # Households | Median Income |
| Owner-Occupied | 184 (77.0%) | $87,643 |
| Renter-Occupied | 55 (23.0%) | $35,893 |
| Average | 239 (100.0%) | $75,179 |
Occupancy by Householder Income Bracket in Herreid
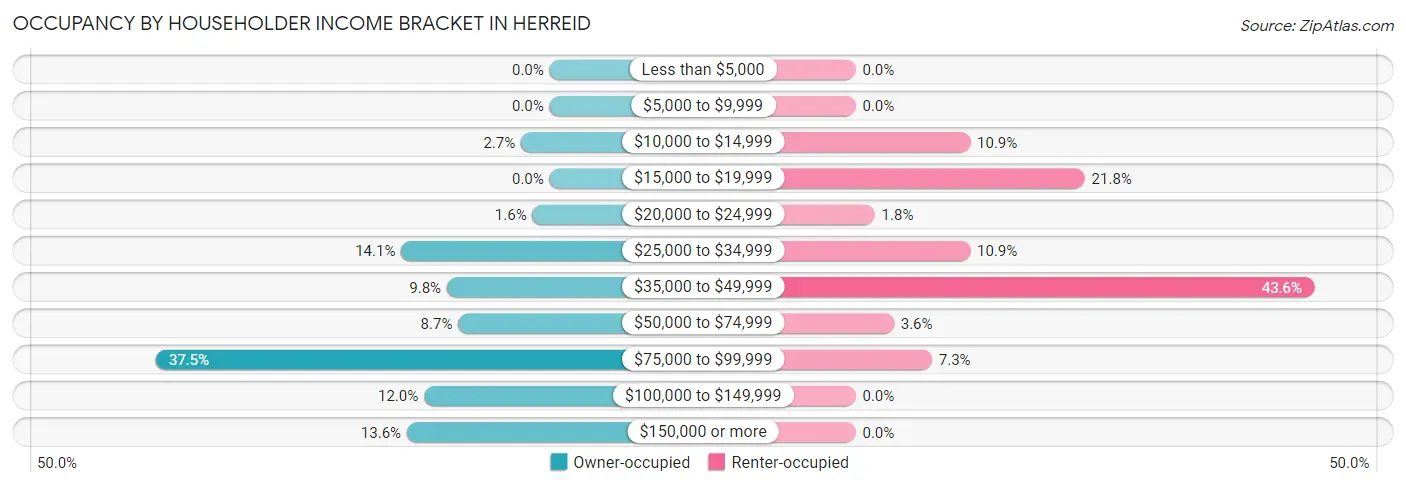
| Income Bracket | Owner-occupied | Renter-occupied |
| Less than $5,000 | 0 (0.0%) | 0 (0.0%) |
| $5,000 to $9,999 | 0 (0.0%) | 0 (0.0%) |
| $10,000 to $14,999 | 5 (2.7%) | 6 (10.9%) |
| $15,000 to $19,999 | 0 (0.0%) | 12 (21.8%) |
| $20,000 to $24,999 | 3 (1.6%) | 1 (1.8%) |
| $25,000 to $34,999 | 26 (14.1%) | 6 (10.9%) |
| $35,000 to $49,999 | 18 (9.8%) | 24 (43.6%) |
| $50,000 to $74,999 | 16 (8.7%) | 2 (3.6%) |
| $75,000 to $99,999 | 69 (37.5%) | 4 (7.3%) |
| $100,000 to $149,999 | 22 (12.0%) | 0 (0.0%) |
| $150,000 or more | 25 (13.6%) | 0 (0.0%) |
| Total | 184 (100.0%) | 55 (100.0%) |
Monthly Housing Cost Tiers in Herreid
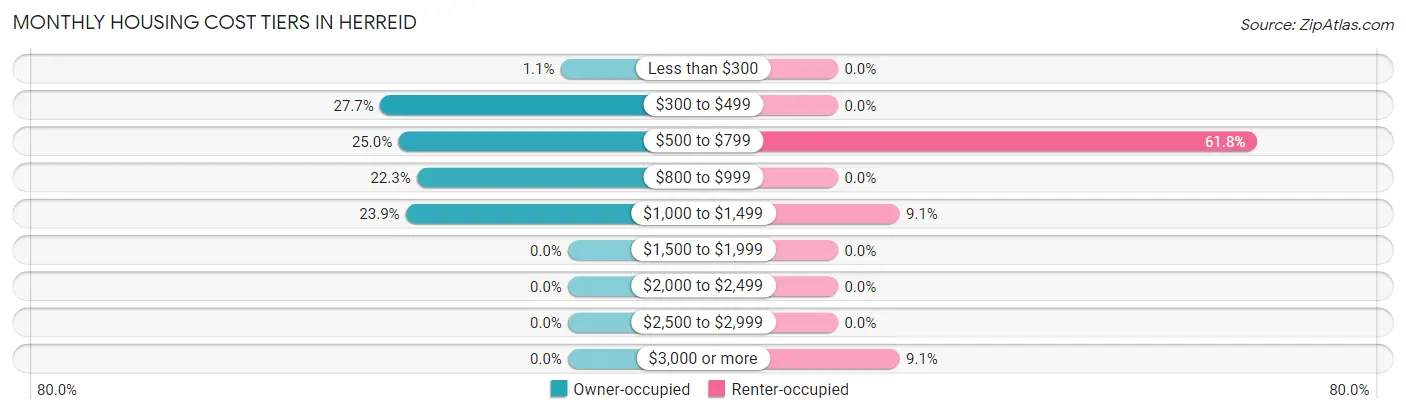
| Monthly Cost | Owner-occupied | Renter-occupied |
| Less than $300 | 2 (1.1%) | 0 (0.0%) |
| $300 to $499 | 51 (27.7%) | 0 (0.0%) |
| $500 to $799 | 46 (25.0%) | 34 (61.8%) |
| $800 to $999 | 41 (22.3%) | 0 (0.0%) |
| $1,000 to $1,499 | 44 (23.9%) | 5 (9.1%) |
| $1,500 to $1,999 | 0 (0.0%) | 0 (0.0%) |
| $2,000 to $2,499 | 0 (0.0%) | 0 (0.0%) |
| $2,500 to $2,999 | 0 (0.0%) | 0 (0.0%) |
| $3,000 or more | 0 (0.0%) | 5 (9.1%) |
| Total | 184 (100.0%) | 55 (100.0%) |
Physical Housing Characteristics in Herreid
Housing Structures in Herreid
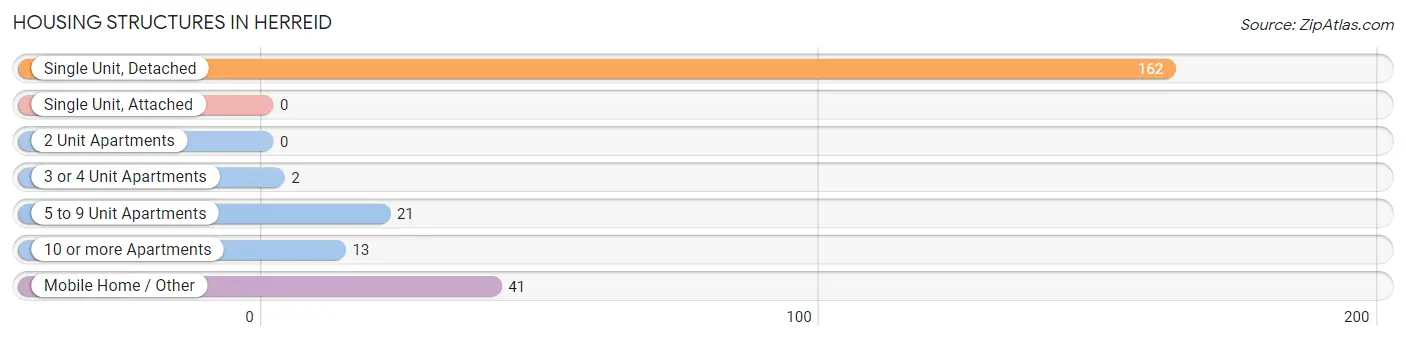
| Structure Type | # Housing Units | % Housing Units |
| Single Unit, Detached | 162 | 67.8% |
| Single Unit, Attached | 0 | 0.0% |
| 2 Unit Apartments | 0 | 0.0% |
| 3 or 4 Unit Apartments | 2 | 0.8% |
| 5 to 9 Unit Apartments | 21 | 8.8% |
| 10 or more Apartments | 13 | 5.4% |
| Mobile Home / Other | 41 | 17.2% |
| Total | 239 | 100.0% |
Housing Structures by Occupancy in Herreid
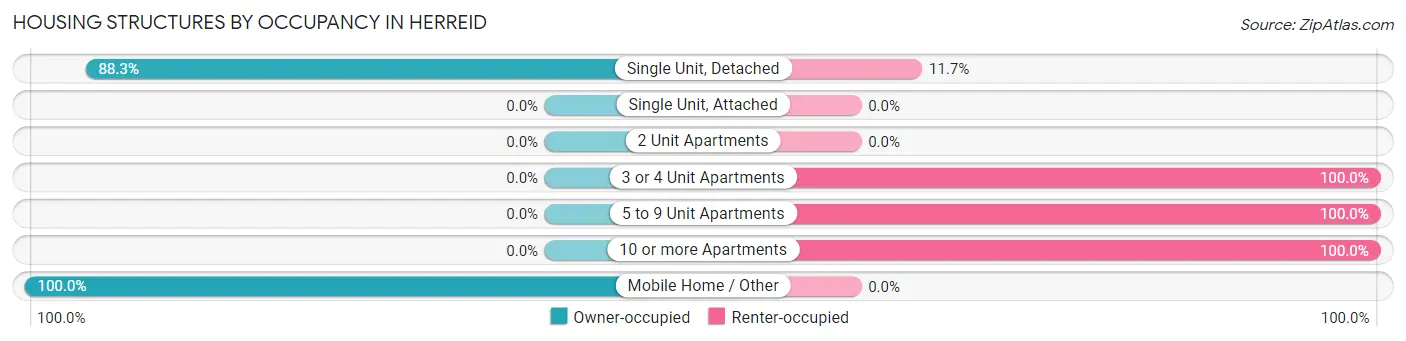
| Structure Type | Owner-occupied | Renter-occupied |
| Single Unit, Detached | 143 (88.3%) | 19 (11.7%) |
| Single Unit, Attached | 0 (0.0%) | 0 (0.0%) |
| 2 Unit Apartments | 0 (0.0%) | 0 (0.0%) |
| 3 or 4 Unit Apartments | 0 (0.0%) | 2 (100.0%) |
| 5 to 9 Unit Apartments | 0 (0.0%) | 21 (100.0%) |
| 10 or more Apartments | 0 (0.0%) | 13 (100.0%) |
| Mobile Home / Other | 41 (100.0%) | 0 (0.0%) |
| Total | 184 (77.0%) | 55 (23.0%) |
Housing Structures by Number of Rooms in Herreid
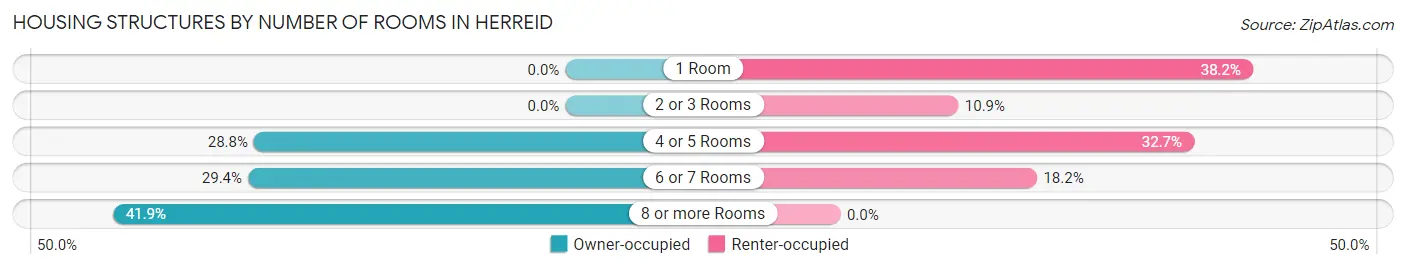
| Number of Rooms | Owner-occupied | Renter-occupied |
| 1 Room | 0 (0.0%) | 21 (38.2%) |
| 2 or 3 Rooms | 0 (0.0%) | 6 (10.9%) |
| 4 or 5 Rooms | 53 (28.8%) | 18 (32.7%) |
| 6 or 7 Rooms | 54 (29.3%) | 10 (18.2%) |
| 8 or more Rooms | 77 (41.8%) | 0 (0.0%) |
| Total | 184 (100.0%) | 55 (100.0%) |
Housing Structure by Heating Type in Herreid
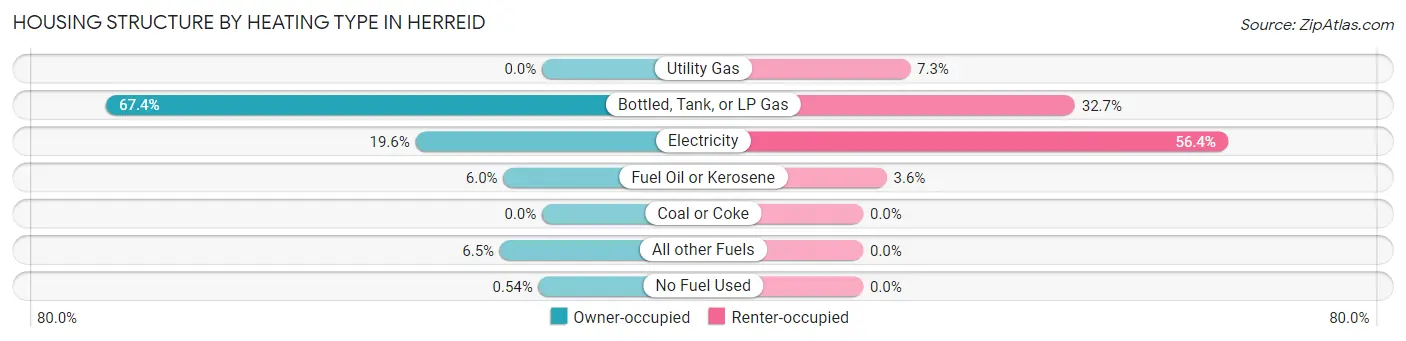
| Heating Type | Owner-occupied | Renter-occupied |
| Utility Gas | 0 (0.0%) | 4 (7.3%) |
| Bottled, Tank, or LP Gas | 124 (67.4%) | 18 (32.7%) |
| Electricity | 36 (19.6%) | 31 (56.4%) |
| Fuel Oil or Kerosene | 11 (6.0%) | 2 (3.6%) |
| Coal or Coke | 0 (0.0%) | 0 (0.0%) |
| All other Fuels | 12 (6.5%) | 0 (0.0%) |
| No Fuel Used | 1 (0.5%) | 0 (0.0%) |
| Total | 184 (100.0%) | 55 (100.0%) |
Household Vehicle Usage in Herreid
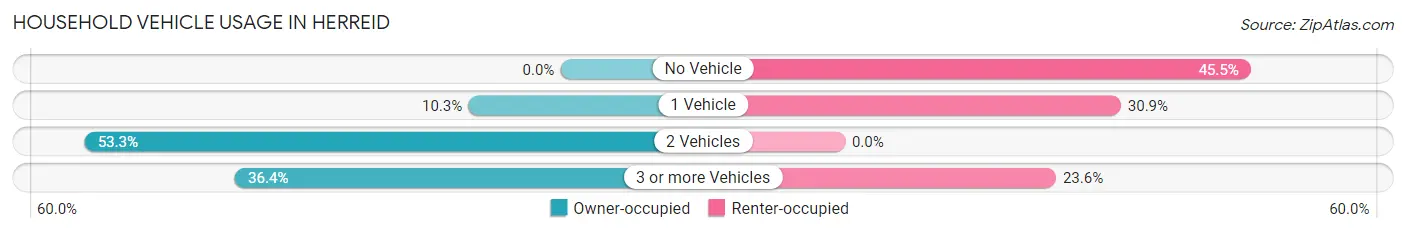
| Vehicles per Household | Owner-occupied | Renter-occupied |
| No Vehicle | 0 (0.0%) | 25 (45.5%) |
| 1 Vehicle | 19 (10.3%) | 17 (30.9%) |
| 2 Vehicles | 98 (53.3%) | 0 (0.0%) |
| 3 or more Vehicles | 67 (36.4%) | 13 (23.6%) |
| Total | 184 (100.0%) | 55 (100.0%) |
Real Estate & Mortgages in Herreid
Real Estate and Mortgage Overview in Herreid
| Characteristic | Without Mortgage | With Mortgage |
| Housing Units | 131 | 53 |
| Median Property Value | $81,400 | $0 |
| Median Household Income | $66,607 | $6 |
| Monthly Housing Costs | $603 | $0 |
| Real Estate Taxes | $1,293 | $10 |
Property Value by Mortgage Status in Herreid
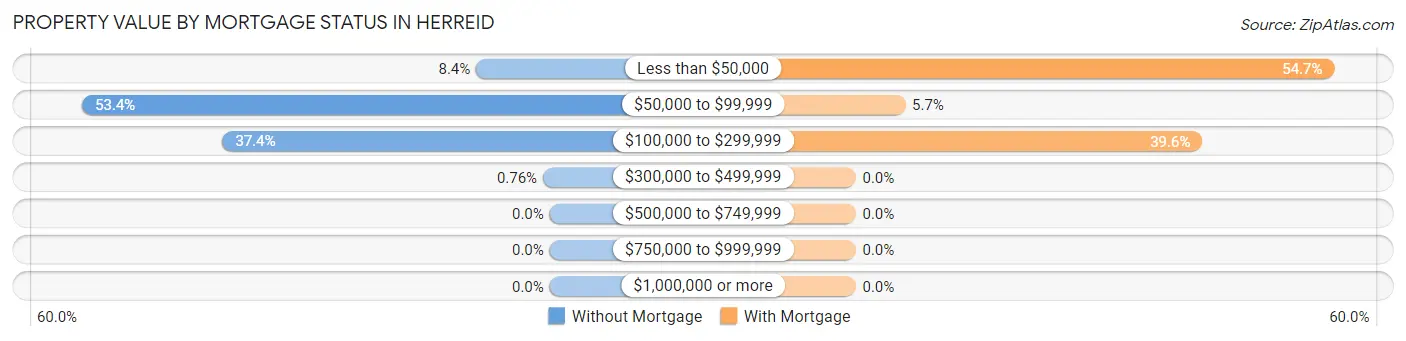
| Property Value | Without Mortgage | With Mortgage |
| Less than $50,000 | 11 (8.4%) | 29 (54.7%) |
| $50,000 to $99,999 | 70 (53.4%) | 3 (5.7%) |
| $100,000 to $299,999 | 49 (37.4%) | 21 (39.6%) |
| $300,000 to $499,999 | 1 (0.8%) | 0 (0.0%) |
| $500,000 to $749,999 | 0 (0.0%) | 0 (0.0%) |
| $750,000 to $999,999 | 0 (0.0%) | 0 (0.0%) |
| $1,000,000 or more | 0 (0.0%) | 0 (0.0%) |
| Total | 131 (100.0%) | 53 (100.0%) |
Household Income by Mortgage Status in Herreid
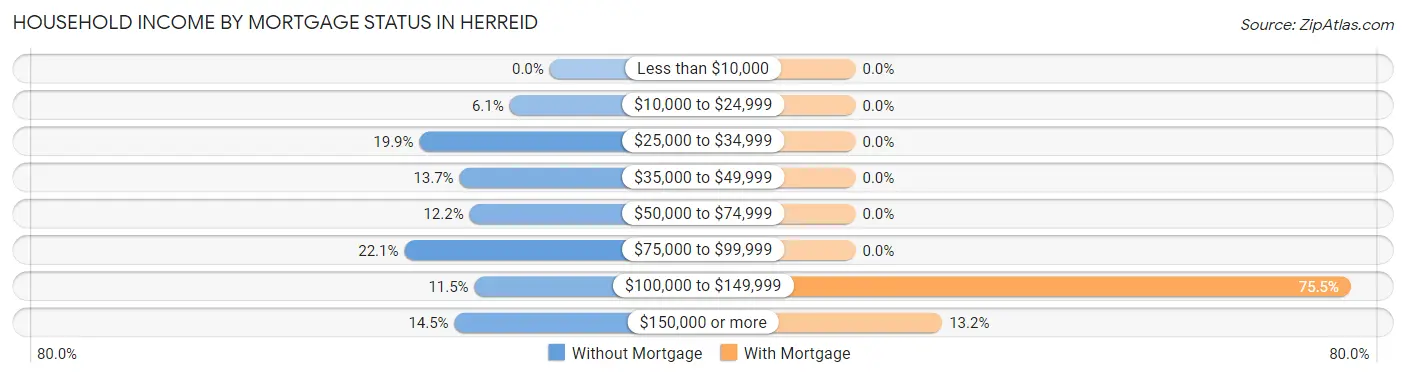
| Household Income | Without Mortgage | With Mortgage |
| Less than $10,000 | 0 (0.0%) | 0 (0.0%) |
| $10,000 to $24,999 | 8 (6.1%) | 0 (0.0%) |
| $25,000 to $34,999 | 26 (19.9%) | 0 (0.0%) |
| $35,000 to $49,999 | 18 (13.7%) | 0 (0.0%) |
| $50,000 to $74,999 | 16 (12.2%) | 0 (0.0%) |
| $75,000 to $99,999 | 29 (22.1%) | 0 (0.0%) |
| $100,000 to $149,999 | 15 (11.5%) | 40 (75.5%) |
| $150,000 or more | 19 (14.5%) | 7 (13.2%) |
| Total | 131 (100.0%) | 53 (100.0%) |
Property Value to Household Income Ratio in Herreid
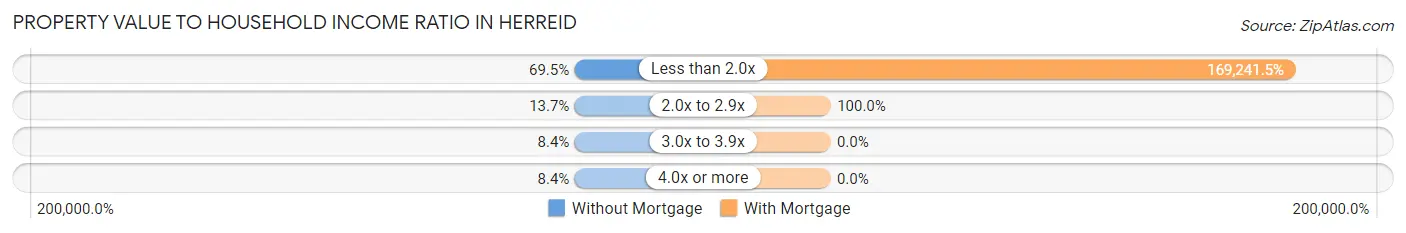
| Value-to-Income Ratio | Without Mortgage | With Mortgage |
| Less than 2.0x | 91 (69.5%) | 89,698 (169,241.5%) |
| 2.0x to 2.9x | 18 (13.7%) | 53 (100.0%) |
| 3.0x to 3.9x | 11 (8.4%) | 0 (0.0%) |
| 4.0x or more | 11 (8.4%) | 0 (0.0%) |
| Total | 131 (100.0%) | 53 (100.0%) |
Real Estate Taxes by Mortgage Status in Herreid
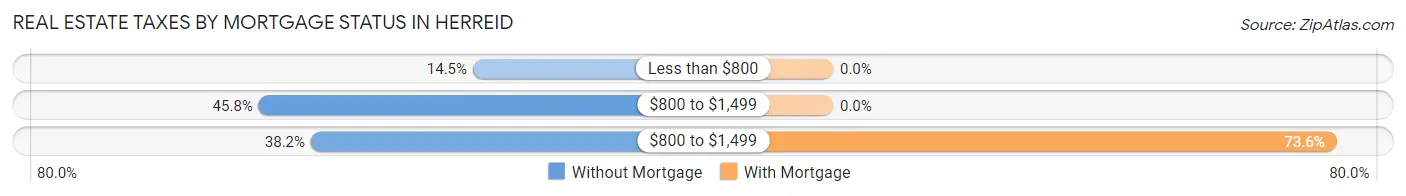
| Property Taxes | Without Mortgage | With Mortgage |
| Less than $800 | 19 (14.5%) | 0 (0.0%) |
| $800 to $1,499 | 60 (45.8%) | 0 (0.0%) |
| $800 to $1,499 | 50 (38.2%) | 39 (73.6%) |
| Total | 131 (100.0%) | 53 (100.0%) |
Health & Disability in Herreid
Health Insurance Coverage by Age in Herreid
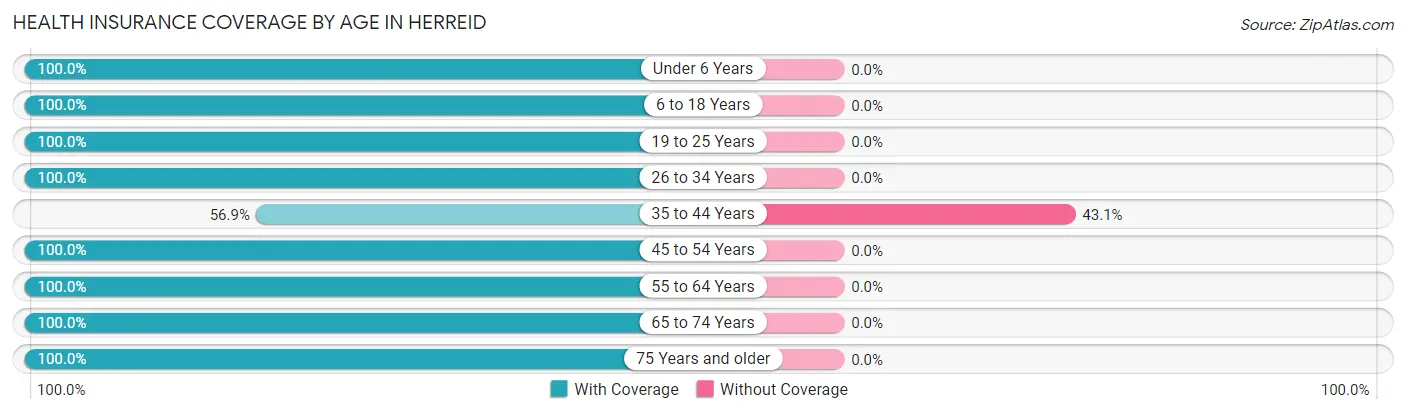
| Age Bracket | With Coverage | Without Coverage |
| Under 6 Years | 81 (100.0%) | 0 (0.0%) |
| 6 to 18 Years | 121 (100.0%) | 0 (0.0%) |
| 19 to 25 Years | 15 (100.0%) | 0 (0.0%) |
| 26 to 34 Years | 27 (100.0%) | 0 (0.0%) |
| 35 to 44 Years | 33 (56.9%) | 25 (43.1%) |
| 45 to 54 Years | 48 (100.0%) | 0 (0.0%) |
| 55 to 64 Years | 77 (100.0%) | 0 (0.0%) |
| 65 to 74 Years | 39 (100.0%) | 0 (0.0%) |
| 75 Years and older | 102 (100.0%) | 0 (0.0%) |
| Total | 543 (95.6%) | 25 (4.4%) |
Health Insurance Coverage by Citizenship Status in Herreid
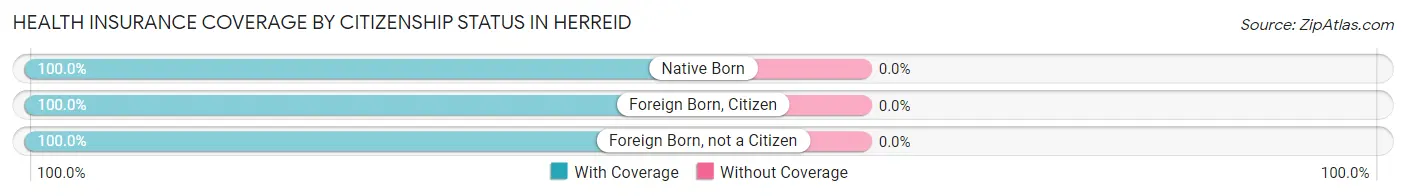
| Citizenship Status | With Coverage | Without Coverage |
| Native Born | 81 (100.0%) | 0 (0.0%) |
| Foreign Born, Citizen | 121 (100.0%) | 0 (0.0%) |
| Foreign Born, not a Citizen | 15 (100.0%) | 0 (0.0%) |
Health Insurance Coverage by Household Income in Herreid
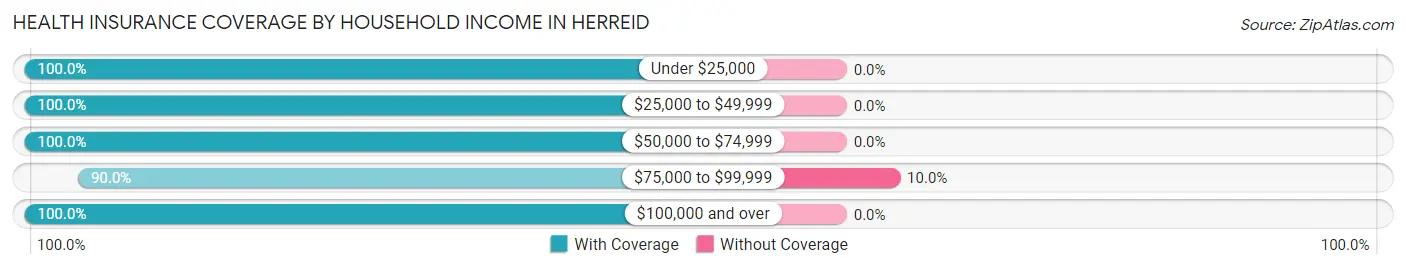
| Household Income | With Coverage | Without Coverage |
| Under $25,000 | 28 (100.0%) | 0 (0.0%) |
| $25,000 to $49,999 | 104 (100.0%) | 0 (0.0%) |
| $50,000 to $74,999 | 31 (100.0%) | 0 (0.0%) |
| $75,000 to $99,999 | 225 (90.0%) | 25 (10.0%) |
| $100,000 and over | 155 (100.0%) | 0 (0.0%) |
Public vs Private Health Insurance Coverage by Age in Herreid
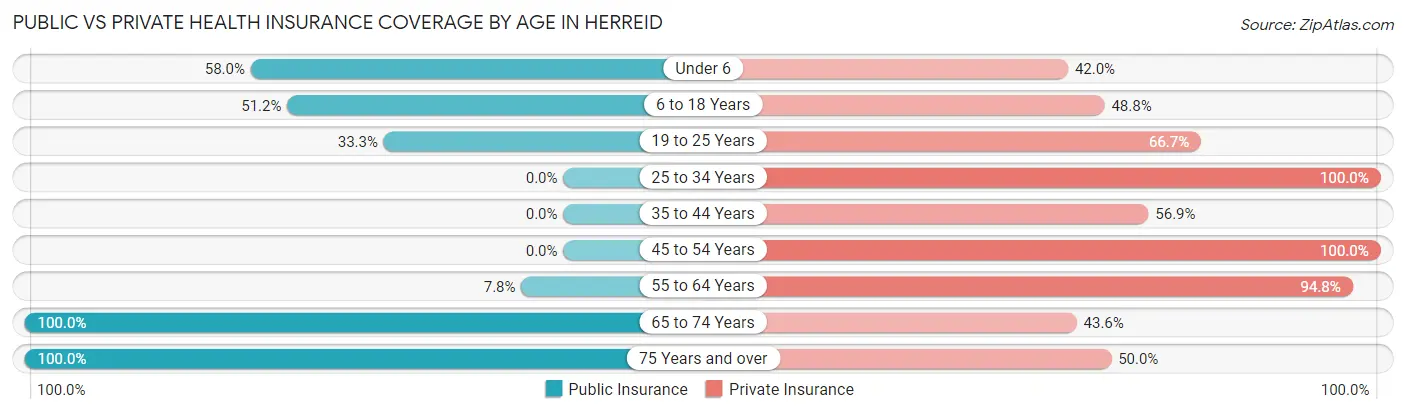
| Age Bracket | Public Insurance | Private Insurance |
| Under 6 | 47 (58.0%) | 34 (42.0%) |
| 6 to 18 Years | 62 (51.2%) | 59 (48.8%) |
| 19 to 25 Years | 5 (33.3%) | 10 (66.7%) |
| 25 to 34 Years | 0 (0.0%) | 27 (100.0%) |
| 35 to 44 Years | 0 (0.0%) | 33 (56.9%) |
| 45 to 54 Years | 0 (0.0%) | 48 (100.0%) |
| 55 to 64 Years | 6 (7.8%) | 73 (94.8%) |
| 65 to 74 Years | 39 (100.0%) | 17 (43.6%) |
| 75 Years and over | 102 (100.0%) | 51 (50.0%) |
| Total | 261 (46.0%) | 352 (62.0%) |
Disability Status by Sex by Age in Herreid
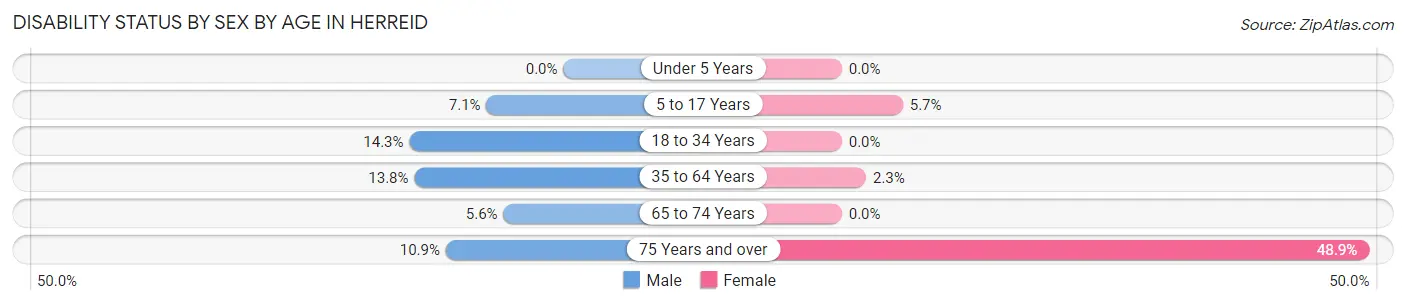
| Age Bracket | Male | Female |
| Under 5 Years | 0 (0.0%) | 0 (0.0%) |
| 5 to 17 Years | 5 (7.1%) | 3 (5.7%) |
| 18 to 34 Years | 2 (14.3%) | 0 (0.0%) |
| 35 to 64 Years | 13 (13.8%) | 2 (2.2%) |
| 65 to 74 Years | 1 (5.6%) | 0 (0.0%) |
| 75 Years and over | 6 (10.9%) | 23 (48.9%) |
Disability Class by Sex by Age in Herreid
Disability Class: Hearing Difficulty
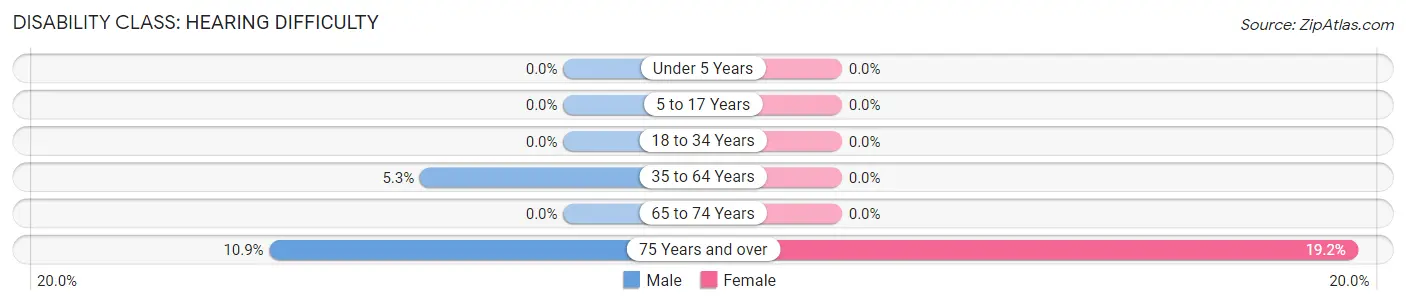
| Age Bracket | Male | Female |
| Under 5 Years | 0 (0.0%) | 0 (0.0%) |
| 5 to 17 Years | 0 (0.0%) | 0 (0.0%) |
| 18 to 34 Years | 0 (0.0%) | 0 (0.0%) |
| 35 to 64 Years | 5 (5.3%) | 0 (0.0%) |
| 65 to 74 Years | 0 (0.0%) | 0 (0.0%) |
| 75 Years and over | 6 (10.9%) | 9 (19.2%) |
Disability Class: Vision Difficulty
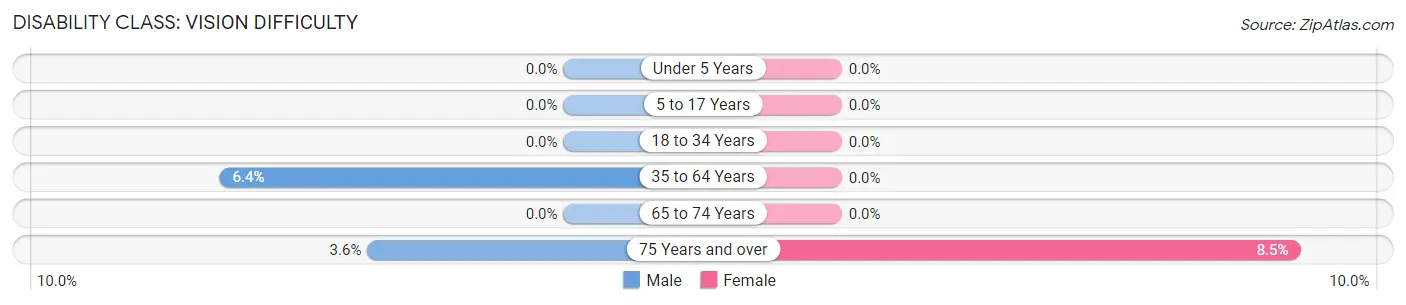
| Age Bracket | Male | Female |
| Under 5 Years | 0 (0.0%) | 0 (0.0%) |
| 5 to 17 Years | 0 (0.0%) | 0 (0.0%) |
| 18 to 34 Years | 0 (0.0%) | 0 (0.0%) |
| 35 to 64 Years | 6 (6.4%) | 0 (0.0%) |
| 65 to 74 Years | 0 (0.0%) | 0 (0.0%) |
| 75 Years and over | 2 (3.6%) | 4 (8.5%) |
Disability Class: Cognitive Difficulty
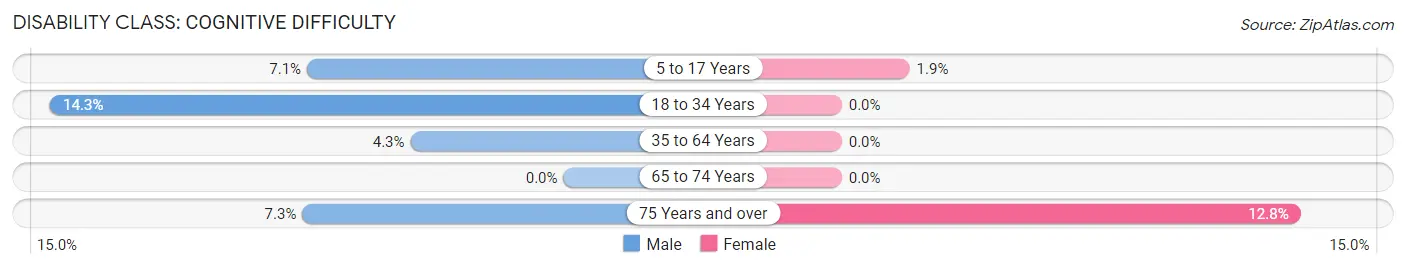
| Age Bracket | Male | Female |
| 5 to 17 Years | 5 (7.1%) | 1 (1.9%) |
| 18 to 34 Years | 2 (14.3%) | 0 (0.0%) |
| 35 to 64 Years | 4 (4.3%) | 0 (0.0%) |
| 65 to 74 Years | 0 (0.0%) | 0 (0.0%) |
| 75 Years and over | 4 (7.3%) | 6 (12.8%) |
Disability Class: Ambulatory Difficulty
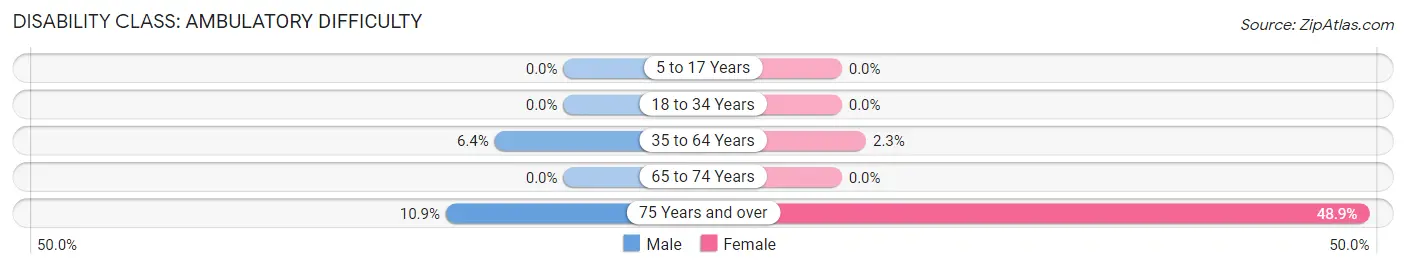
| Age Bracket | Male | Female |
| 5 to 17 Years | 0 (0.0%) | 0 (0.0%) |
| 18 to 34 Years | 0 (0.0%) | 0 (0.0%) |
| 35 to 64 Years | 6 (6.4%) | 2 (2.2%) |
| 65 to 74 Years | 0 (0.0%) | 0 (0.0%) |
| 75 Years and over | 6 (10.9%) | 23 (48.9%) |
Disability Class: Self-Care Difficulty
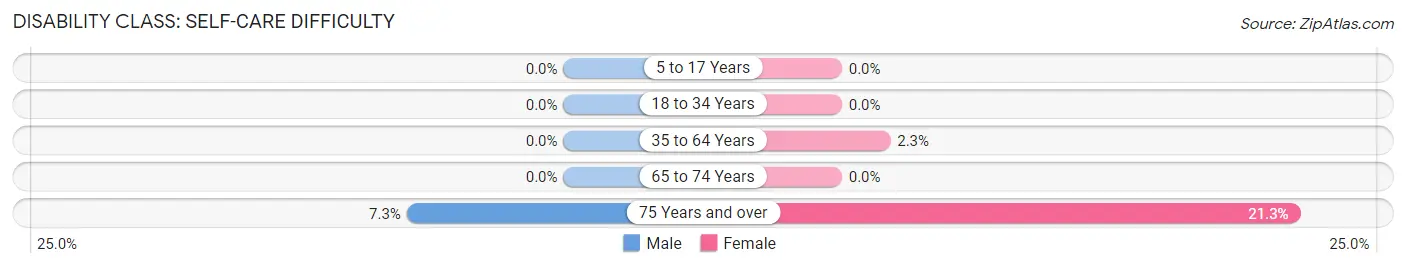
| Age Bracket | Male | Female |
| 5 to 17 Years | 0 (0.0%) | 0 (0.0%) |
| 18 to 34 Years | 0 (0.0%) | 0 (0.0%) |
| 35 to 64 Years | 0 (0.0%) | 2 (2.2%) |
| 65 to 74 Years | 0 (0.0%) | 0 (0.0%) |
| 75 Years and over | 4 (7.3%) | 10 (21.3%) |
Technology Access in Herreid
Computing Device Access in Herreid
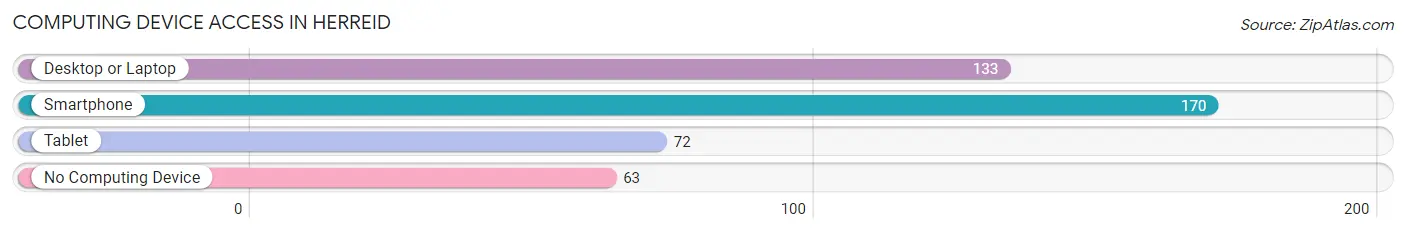
| Device Type | # Households | % Households |
| Desktop or Laptop | 133 | 55.6% |
| Smartphone | 170 | 71.1% |
| Tablet | 72 | 30.1% |
| No Computing Device | 63 | 26.4% |
| Total | 239 | 100.0% |
Internet Access in Herreid
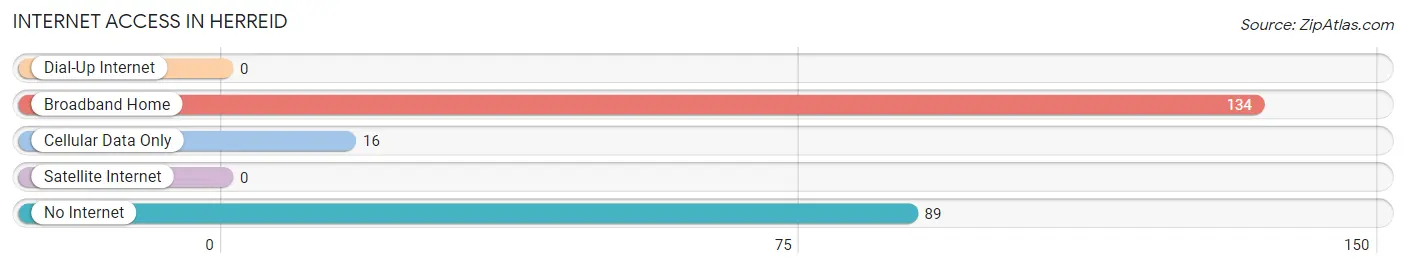
| Internet Type | # Households | % Households |
| Dial-Up Internet | 0 | 0.0% |
| Broadband Home | 134 | 56.1% |
| Cellular Data Only | 16 | 6.7% |
| Satellite Internet | 0 | 0.0% |
| No Internet | 89 | 37.2% |
| Total | 239 | 100.0% |
Herreid Summary
Herreid, South Dakota is a small town located in Campbell County, in the north-central part of the state. The town was founded in 1883 and is named after the first postmaster, John Herreid. The population of Herreid was 517 at the 2010 census.
Geography
Herreid is located at 45°45'17" North, 99°25'17" West (45.754722, -99.421389). The town is situated in the Missouri Coteau, a region of rolling hills and prairie. The terrain is mostly flat, with some hills in the area. The town is located on the banks of the Missouri River, which provides a source of recreation for the town.
The climate in Herreid is typical of the Great Plains, with hot summers and cold winters. The average high temperature in July is 85°F (29°C), and the average low temperature in January is -2°F (-19°C). The average annual precipitation is 17.5 inches (44.5 cm).
Economy
The economy of Herreid is largely based on agriculture. The town is home to several farms, which produce a variety of crops, including wheat, corn, soybeans, and sunflowers. The town also has a small manufacturing sector, which produces a variety of products, including furniture, clothing, and food products.
The town is also home to several businesses, including a grocery store, a hardware store, a bank, and a post office. There are also several restaurants and bars in the town.
Demographics
The population of Herreid was 517 at the 2010 census. The racial makeup of the town was 97.3% White, 0.4% African American, 0.2% Native American, 0.2% Asian, 0.2% from other races, and 1.9% from two or more races. Hispanic or Latino of any race were 0.8% of the population.
The median income for a household in Herreid was $37,500, and the median income for a family was $45,000. The per capita income for the town was $17,845. About 11.2% of families and 13.2% of the population were below the poverty line, including 16.7% of those under age 18 and 8.3% of those age 65 or over.
Herreid is served by the Herreid Public School District, which includes an elementary school, a middle school, and a high school. The town is also home to a branch of the Campbell County Library.
Herreid is a small town with a rich history and a strong sense of community. The town is home to a variety of businesses and organizations, and the residents take pride in their town and its history. Herreid is a great place to live and work, and it is a great place to raise a family.
Common Questions
What is Per Capita Income in Herreid?
Per Capita income in Herreid is $32,279.
What is the Median Family Income in Herreid?
Median Family Income in Herreid is $88,786.
What is the Median Household income in Herreid?
Median Household Income in Herreid is $75,179.
What is Income or Wage Gap in Herreid?
Income or Wage Gap in Herreid is 54.0%.
Women in Herreid earn 46.0 cents for every dollar earned by a man.
What is Inequality or Gini Index in Herreid?
Inequality or Gini Index in Herreid is 0.39.
What is the Total Population of Herreid?
Total Population of Herreid is 568.
What is the Total Male Population of Herreid?
Total Male Population of Herreid is 319.
What is the Total Female Population of Herreid?
Total Female Population of Herreid is 249.
What is the Ratio of Males per 100 Females in Herreid?
There are 128.11 Males per 100 Females in Herreid.
What is the Ratio of Females per 100 Males in Herreid?
There are 78.06 Females per 100 Males in Herreid.
What is the Median Population Age in Herreid?
Median Population Age in Herreid is 41.0 Years.
What is the Average Family Size in Herreid
Average Family Size in Herreid is 3.4 People.
What is the Average Household Size in Herreid
Average Household Size in Herreid is 2.4 People.
How Large is the Labor Force in Herreid?
There are 254 People in the Labor Forcein in Herreid.
What is the Percentage of People in the Labor Force in Herreid?
63.2% of People are in the Labor Force in Herreid.
What is the Unemployment Rate in Herreid?
Unemployment Rate in Herreid is 5.9%.