Zip Codes with the Highest Percentage of Population Employed in Architecture & Engineering in Sioux Falls, SD
RELATED REPORTS & OPTIONS
Architecture & Engineering
Sioux Falls
Compare Zip Codes
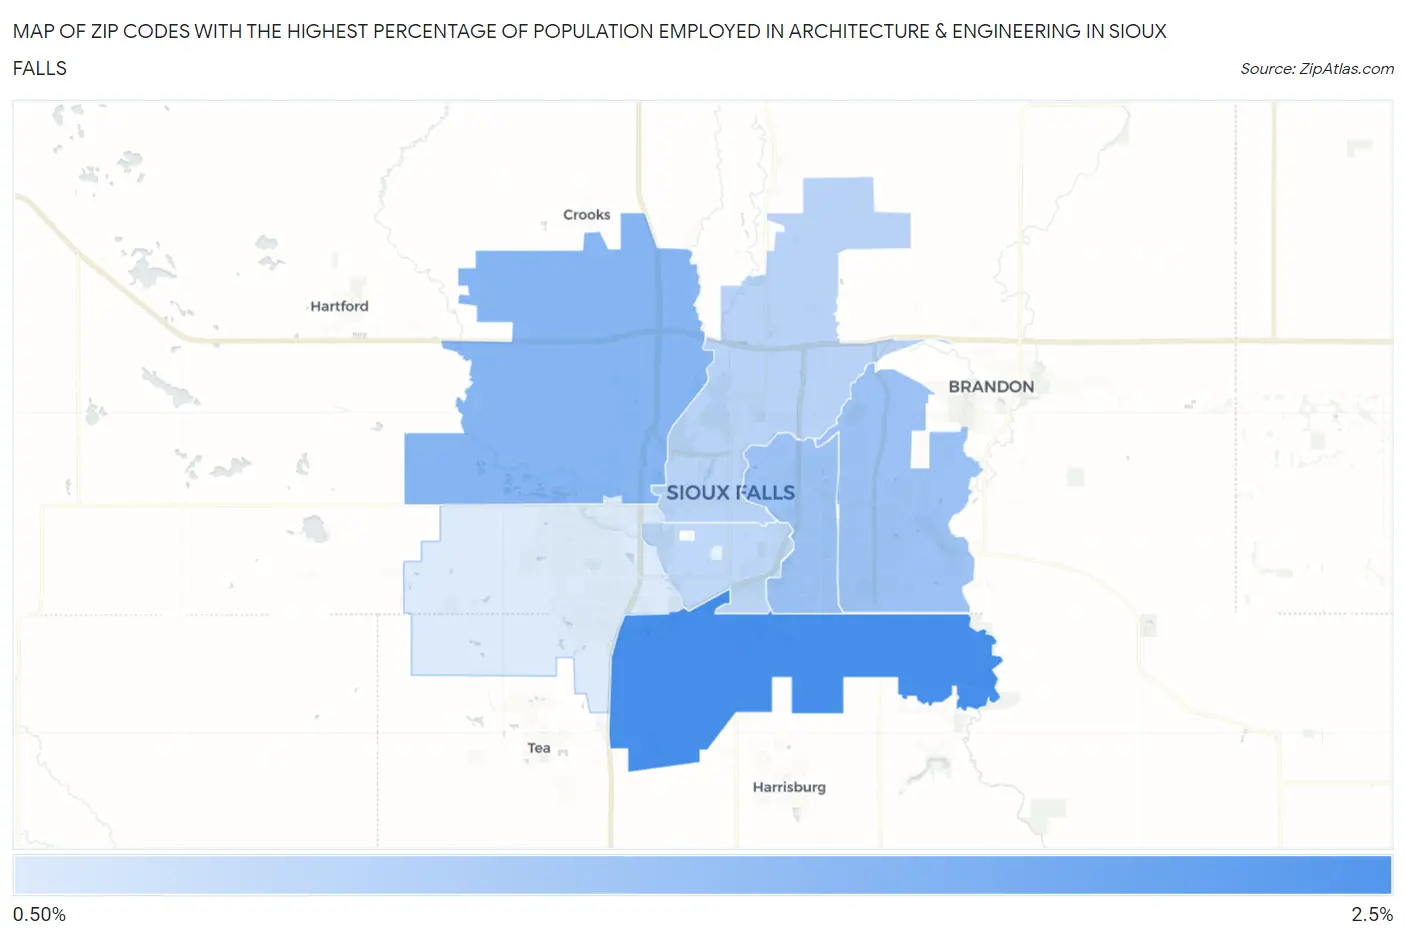
Map of Zip Codes with the Highest Percentage of Population Employed in Architecture & Engineering in Sioux Falls
0.84%
2.4%
Zip Codes with the Highest Percentage of Population Employed in Architecture & Engineering in Sioux Falls, SD
| Zip Code | % Employed | vs State | vs National | |
| 1. | 57108 | 2.4% | 1.6%(+0.821)#44 | 2.1%(+0.262)#7,429 |
| 2. | 57107 | 1.8% | 1.6%(+0.167)#70 | 2.1%(-0.392)#11,092 |
| 3. | 57110 | 1.5% | 1.6%(-0.062)#83 | 2.1%(-0.621)#12,662 |
| 4. | 57103 | 1.5% | 1.6%(-0.087)#86 | 2.1%(-0.646)#12,856 |
| 5. | 57104 | 1.2% | 1.6%(-0.370)#102 | 2.1%(-0.928)#14,919 |
| 6. | 57105 | 1.2% | 1.6%(-0.438)#105 | 2.1%(-0.997)#15,456 |
| 7. | 57106 | 0.84% | 1.6%(-0.754)#125 | 2.1%(-1.31)#17,872 |
1
Common Questions
What are the Top 5 Zip Codes with the Highest Percentage of Population Employed in Architecture & Engineering in Sioux Falls, SD?
Top 5 Zip Codes with the Highest Percentage of Population Employed in Architecture & Engineering in Sioux Falls, SD are:
What zip code has the Highest Percentage of Population Employed in Architecture & Engineering in Sioux Falls, SD?
57108 has the Highest Percentage of Population Employed in Architecture & Engineering in Sioux Falls, SD with 2.4%.
What is the Percentage of Population Employed in Architecture & Engineering in Sioux Falls, SD?
Percentage of Population Employed in Architecture & Engineering in Sioux Falls is 1.4%.
What is the Percentage of Population Employed in Architecture & Engineering in South Dakota?
Percentage of Population Employed in Architecture & Engineering in South Dakota is 1.6%.
What is the Percentage of Population Employed in Architecture & Engineering in the United States?
Percentage of Population Employed in Architecture & Engineering in the United States is 2.1%.