Stuckey, SC Map & Demographics
Stuckey Map
Stuckey Overview
$40,646
PER CAPITA INCOME
51.7%
WAGE / INCOME GAP [ % ]
48.3¢/ $1
WAGE / INCOME GAP [ $ ]
0.54
INEQUALITY / GINI INDEX
243
TOTAL POPULATION
111
MALE POPULATION
132
FEMALE POPULATION
84.09
MALES / 100 FEMALES
118.92
FEMALES / 100 MALES
71.7
MEDIAN AGE
2.8
AVG FAMILY SIZE
2.2
AVG HOUSEHOLD SIZE
129
LABOR FORCE [ PEOPLE ]
57.3%
PERCENT IN LABOR FORCE
10.9%
UNEMPLOYMENT RATE
Income in Stuckey
Income Overview in Stuckey
| Characteristic | Number | Measure |
| Per Capita Income | 243 | $40,646 |
| Median Family Income | 73 | $0 |
| Mean Family Income | 73 | $85,395 |
| Median Household Income | 111 | $0 |
| Mean Household Income | 111 | $66,841 |
| Income Deficit | 73 | $0 |
| Wage / Income Gap (%) | 243 | 51.70% |
| Wage / Income Gap ($) | 243 | 48.30¢ per $1 |
| Gini / Inequality Index | 243 | 0.54 |
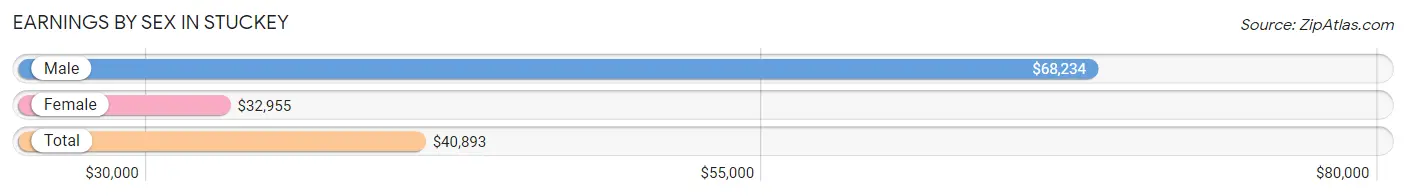
Earnings by Sex in Stuckey
Average Earnings in Stuckey are $40,893, $68,234 for men and $32,955 for women, a difference of 51.7%.
| Sex | Number | Average Earnings |
| Male | 71 (58.7%) | $68,234 |
| Female | 50 (41.3%) | $32,955 |
| Total | 121 (100.0%) | $40,893 |
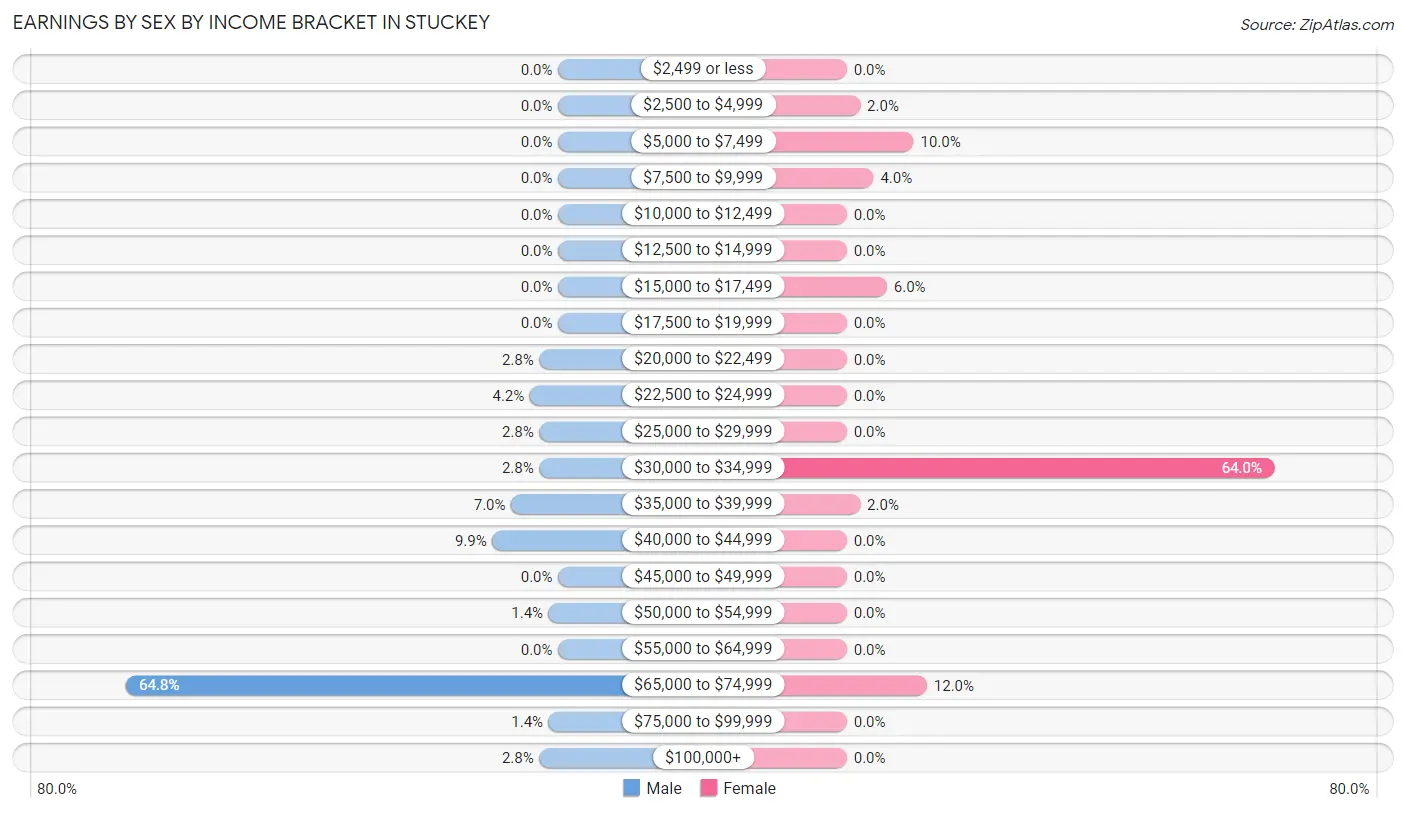
Earnings by Sex by Income Bracket in Stuckey
The most common earnings brackets in Stuckey are $65,000 to $74,999 for men (46 | 64.8%) and $30,000 to $34,999 for women (32 | 64.0%).
| Income | Male | Female |
| $2,499 or less | 0 (0.0%) | 0 (0.0%) |
| $2,500 to $4,999 | 0 (0.0%) | 1 (2.0%) |
| $5,000 to $7,499 | 0 (0.0%) | 5 (10.0%) |
| $7,500 to $9,999 | 0 (0.0%) | 2 (4.0%) |
| $10,000 to $12,499 | 0 (0.0%) | 0 (0.0%) |
| $12,500 to $14,999 | 0 (0.0%) | 0 (0.0%) |
| $15,000 to $17,499 | 0 (0.0%) | 3 (6.0%) |
| $17,500 to $19,999 | 0 (0.0%) | 0 (0.0%) |
| $20,000 to $22,499 | 2 (2.8%) | 0 (0.0%) |
| $22,500 to $24,999 | 3 (4.2%) | 0 (0.0%) |
| $25,000 to $29,999 | 2 (2.8%) | 0 (0.0%) |
| $30,000 to $34,999 | 2 (2.8%) | 32 (64.0%) |
| $35,000 to $39,999 | 5 (7.0%) | 1 (2.0%) |
| $40,000 to $44,999 | 7 (9.9%) | 0 (0.0%) |
| $45,000 to $49,999 | 0 (0.0%) | 0 (0.0%) |
| $50,000 to $54,999 | 1 (1.4%) | 0 (0.0%) |
| $55,000 to $64,999 | 0 (0.0%) | 0 (0.0%) |
| $65,000 to $74,999 | 46 (64.8%) | 6 (12.0%) |
| $75,000 to $99,999 | 1 (1.4%) | 0 (0.0%) |
| $100,000+ | 2 (2.8%) | 0 (0.0%) |
| Total | 71 (100.0%) | 50 (100.0%) |
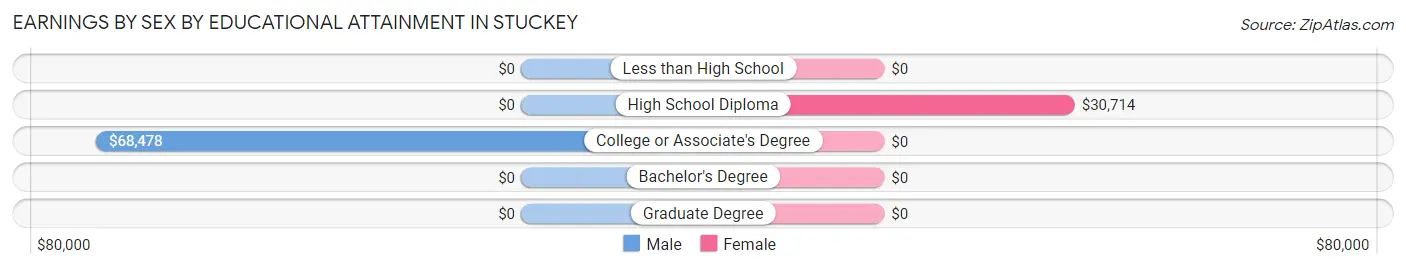
Earnings by Sex by Educational Attainment in Stuckey
Average earnings in Stuckey are $68,234 for men and $32,955 for women, a difference of 51.7%. Men with an educational attainment of college or associate's degree enjoy the highest average annual earnings of $68,478, while those with college or associate's degree education earn the least with $68,478. Women with an educational attainment of high school diploma earn the most with the average annual earnings of $30,714, while those with high school diploma education have the smallest earnings of $30,714.
| Educational Attainment | Male Income | Female Income |
| Less than High School | - | - |
| High School Diploma | - | - |
| College or Associate's Degree | $68,478 | $0 |
| Bachelor's Degree | - | - |
| Graduate Degree | - | - |
| Total | $68,234 | $32,955 |
Family Income in Stuckey
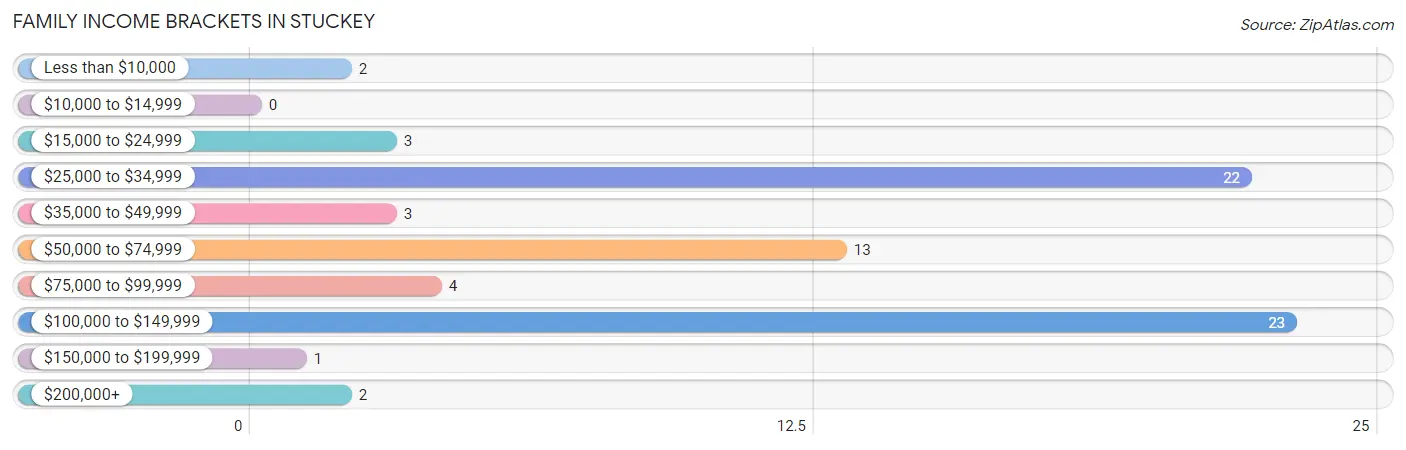
Family Income Brackets in Stuckey
According to the Stuckey family income data, there are 23 families falling into the $100,000 to $149,999 income range, which is the most common income bracket and makes up 31.5% of all families.
| Income Bracket | # Families | % Families |
| Less than $10,000 | 2 | 2.7% |
| $10,000 to $14,999 | 0 | 0.0% |
| $15,000 to $24,999 | 3 | 4.1% |
| $25,000 to $34,999 | 22 | 30.1% |
| $35,000 to $49,999 | 3 | 4.1% |
| $50,000 to $74,999 | 13 | 17.8% |
| $75,000 to $99,999 | 4 | 5.5% |
| $100,000 to $149,999 | 23 | 31.5% |
| $150,000 to $199,999 | 1 | 1.4% |
| $200,000+ | 2 | 2.7% |
Family Income by Famaliy Size in Stuckey
| Income Bracket | # Families | Median Income |
| 2-Person Families | 60 (82.2%) | $0 |
| 3-Person Families | 7 (9.6%) | $0 |
| 4-Person Families | 3 (4.1%) | $0 |
| 5-Person Families | 0 (0.0%) | $0 |
| 6-Person Families | 1 (1.4%) | $0 |
| 7+ Person Families | 2 (2.7%) | $0 |
| Total | 73 (100.0%) | $0 |
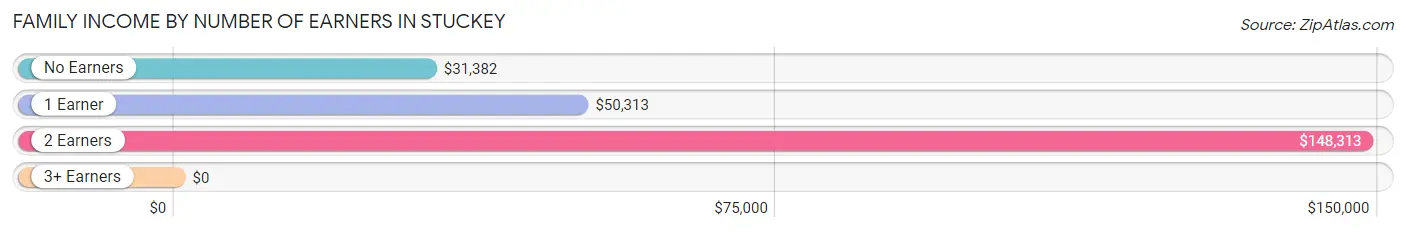
Family Income by Number of Earners in Stuckey
| Number of Earners | # Families | Median Income |
| No Earners | 27 (37.0%) | $31,382 |
| 1 Earner | 17 (23.3%) | $50,313 |
| 2 Earners | 29 (39.7%) | $148,313 |
| 3+ Earners | 0 (0.0%) | $0 |
| Total | 73 (100.0%) | $0 |
Household Income in Stuckey
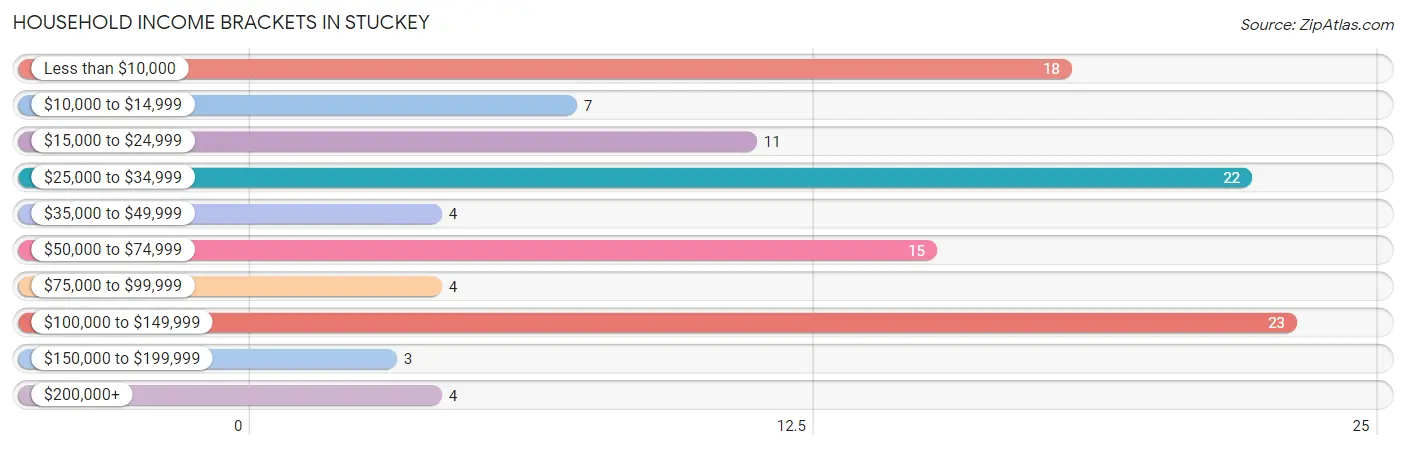
Household Income Brackets in Stuckey
With 23 households falling in the category, the $100,000 to $149,999 income range is the most frequent in Stuckey, accounting for 20.7% of all households. In contrast, only 3 households (2.7%) fall into the $150,000 to $199,999 income bracket, making it the least populous group.
| Income Bracket | # Households | % Households |
| Less than $10,000 | 18 | 16.2% |
| $10,000 to $14,999 | 7 | 6.3% |
| $15,000 to $24,999 | 11 | 9.9% |
| $25,000 to $34,999 | 22 | 19.8% |
| $35,000 to $49,999 | 4 | 3.6% |
| $50,000 to $74,999 | 15 | 13.5% |
| $75,000 to $99,999 | 4 | 3.6% |
| $100,000 to $149,999 | 23 | 20.7% |
| $150,000 to $199,999 | 3 | 2.7% |
| $200,000+ | 4 | 3.6% |
Household Income by Householder Age in Stuckey
The median household income in Stuckey is $0, with the highest median household income of $40,417 found in the 45 to 64 years age bracket for the primary householder. A total of 19 households (17.1%) fall into this category.
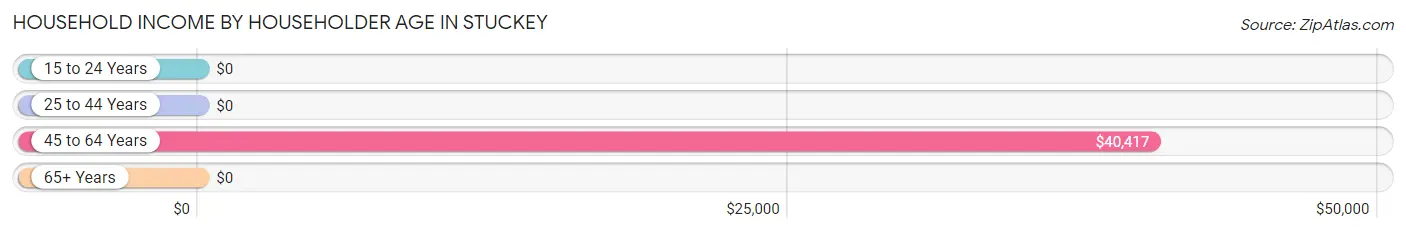
| Income Bracket | # Households | Median Income |
| 15 to 24 Years | 0 (0.0%) | $0 |
| 25 to 44 Years | 5 (4.5%) | $0 |
| 45 to 64 Years | 19 (17.1%) | $40,417 |
| 65+ Years | 87 (78.4%) | $0 |
| Total | 111 (100.0%) | $0 |
Poverty in Stuckey
Income Below Poverty by Sex and Age in Stuckey
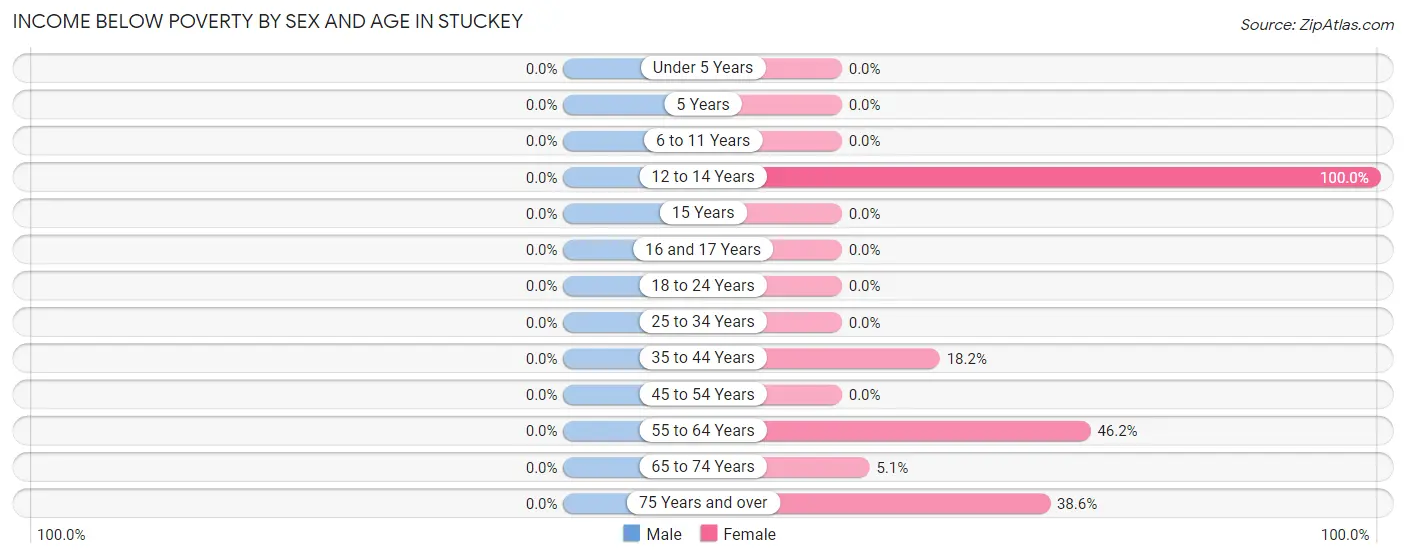
| Age Bracket | Male | Female |
| Under 5 Years | 0 (0.0%) | 0 (0.0%) |
| 5 Years | 0 (0.0%) | 0 (0.0%) |
| 6 to 11 Years | 0 (0.0%) | 0 (0.0%) |
| 12 to 14 Years | 0 (0.0%) | 4 (100.0%) |
| 15 Years | 0 (0.0%) | 0 (0.0%) |
| 16 and 17 Years | 0 (0.0%) | 0 (0.0%) |
| 18 to 24 Years | 0 (0.0%) | 0 (0.0%) |
| 25 to 34 Years | 0 (0.0%) | 0 (0.0%) |
| 35 to 44 Years | 0 (0.0%) | 2 (18.2%) |
| 45 to 54 Years | 0 (0.0%) | 0 (0.0%) |
| 55 to 64 Years | 0 (0.0%) | 6 (46.2%) |
| 65 to 74 Years | 0 (0.0%) | 2 (5.1%) |
| 75 Years and over | 0 (0.0%) | 17 (38.6%) |
| Total | 0 (0.0%) | 31 (23.5%) |
Income Above Poverty by Sex and Age in Stuckey
According to the poverty statistics in Stuckey, males aged under 5 years and females aged 5 years are the age groups that are most secure financially, with 100.0% of males and 100.0% of females in these age groups living above the poverty line.
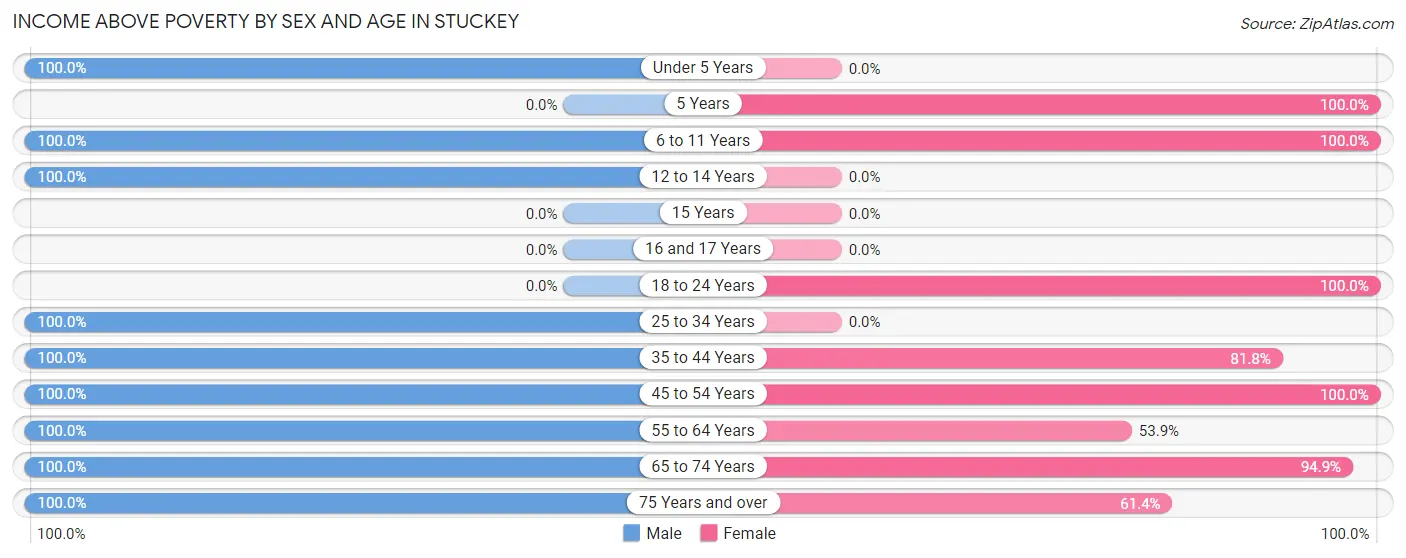
| Age Bracket | Male | Female |
| Under 5 Years | 7 (100.0%) | 0 (0.0%) |
| 5 Years | 0 (0.0%) | 3 (100.0%) |
| 6 to 11 Years | 1 (100.0%) | 1 (100.0%) |
| 12 to 14 Years | 2 (100.0%) | 0 (0.0%) |
| 15 Years | 0 (0.0%) | 0 (0.0%) |
| 16 and 17 Years | 0 (0.0%) | 0 (0.0%) |
| 18 to 24 Years | 0 (0.0%) | 10 (100.0%) |
| 25 to 34 Years | 10 (100.0%) | 0 (0.0%) |
| 35 to 44 Years | 7 (100.0%) | 9 (81.8%) |
| 45 to 54 Years | 2 (100.0%) | 7 (100.0%) |
| 55 to 64 Years | 12 (100.0%) | 7 (53.8%) |
| 65 to 74 Years | 6 (100.0%) | 37 (94.9%) |
| 75 Years and over | 64 (100.0%) | 27 (61.4%) |
| Total | 111 (100.0%) | 101 (76.5%) |
Income Below Poverty Among Married-Couple Families in Stuckey
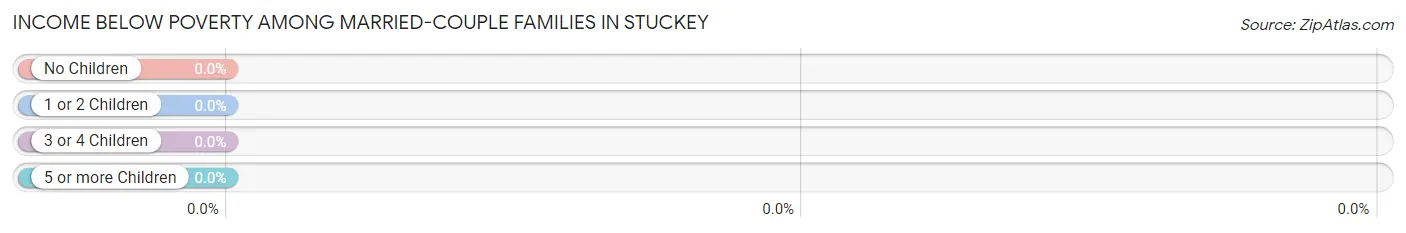
| Children | Above Poverty | Below Poverty |
| No Children | 56 (100.0%) | 0 (0.0%) |
| 1 or 2 Children | 3 (100.0%) | 0 (0.0%) |
| 3 or 4 Children | 1 (100.0%) | 0 (0.0%) |
| 5 or more Children | 0 (0.0%) | 0 (0.0%) |
| Total | 60 (100.0%) | 0 (0.0%) |
Income Below Poverty Among Single-Parent Households in Stuckey
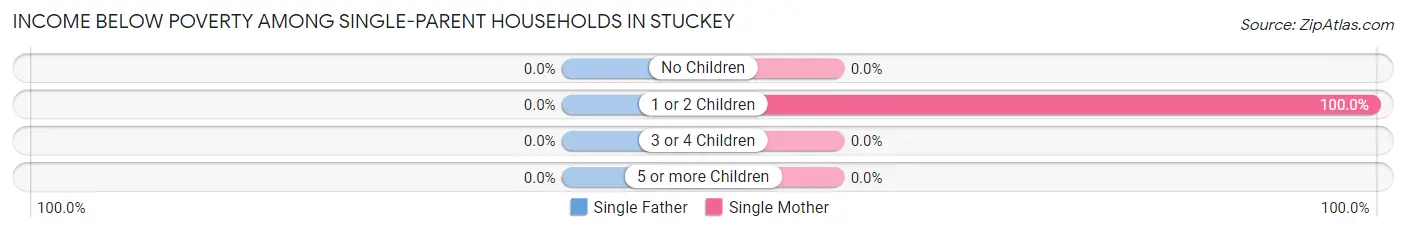
| Children | Single Father | Single Mother |
| No Children | 0 (0.0%) | 0 (0.0%) |
| 1 or 2 Children | 0 (0.0%) | 2 (100.0%) |
| 3 or 4 Children | 0 (0.0%) | 0 (0.0%) |
| 5 or more Children | 0 (0.0%) | 0 (0.0%) |
| Total | 0 (0.0%) | 2 (20.0%) |
Income Below Poverty Among Married-Couple vs Single-Parent Households in Stuckey
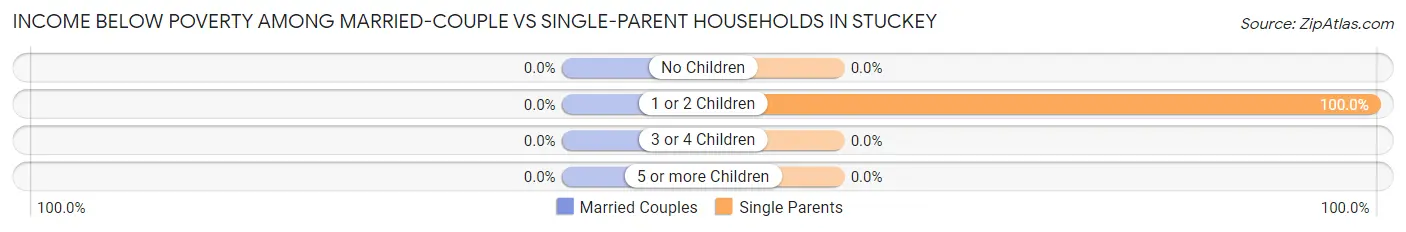
| Children | Married-Couple Families | Single-Parent Households |
| No Children | 0 (0.0%) | 0 (0.0%) |
| 1 or 2 Children | 0 (0.0%) | 2 (100.0%) |
| 3 or 4 Children | 0 (0.0%) | 0 (0.0%) |
| 5 or more Children | 0 (0.0%) | 0 (0.0%) |
| Total | 0 (0.0%) | 2 (15.4%) |
Race in Stuckey
The most populous races in Stuckey are Black / African American (150 | 61.7%), and White / Caucasian (93 | 38.3%).
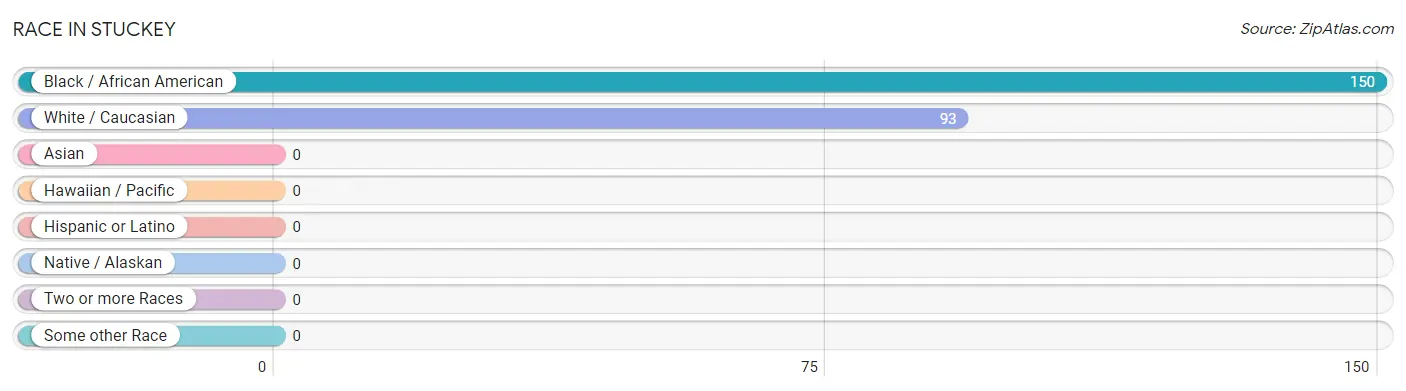
| Race | # Population | % Population |
| Asian | 0 | 0.0% |
| Black / African American | 150 | 61.7% |
| Hawaiian / Pacific | 0 | 0.0% |
| Hispanic or Latino | 0 | 0.0% |
| Native / Alaskan | 0 | 0.0% |
| White / Caucasian | 93 | 38.3% |
| Two or more Races | 0 | 0.0% |
| Some other Race | 0 | 0.0% |
| Total | 243 | 100.0% |
Ancestry in Stuckey
The most populous ancestries reported in Stuckey are British (66 | 27.2%), American (8 | 3.3%), German (5 | 2.1%), Irish (4 | 1.7%), and English (2 | 0.8%), together accounting for 35.0% of all Stuckey residents.
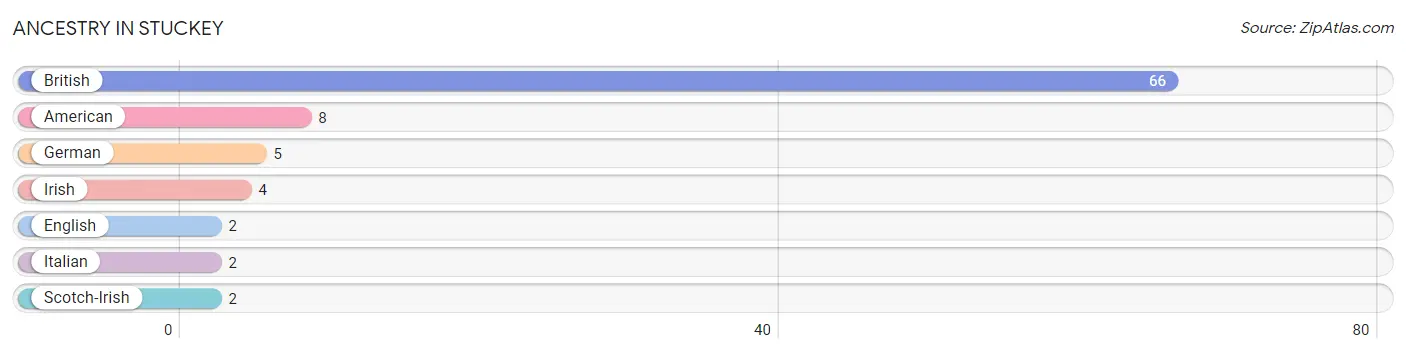
| Ancestry | # Population | % Population |
| American | 8 | 3.3% |
| British | 66 | 27.2% |
| English | 2 | 0.8% |
| German | 5 | 2.1% |
| Irish | 4 | 1.7% |
| Italian | 2 | 0.8% |
| Scotch-Irish | 2 | 0.8% | View All 7 Rows |
Immigrants in Stuckey

| Immigration Origin | # Population | % Population | View All 0 Rows |
Sex and Age in Stuckey
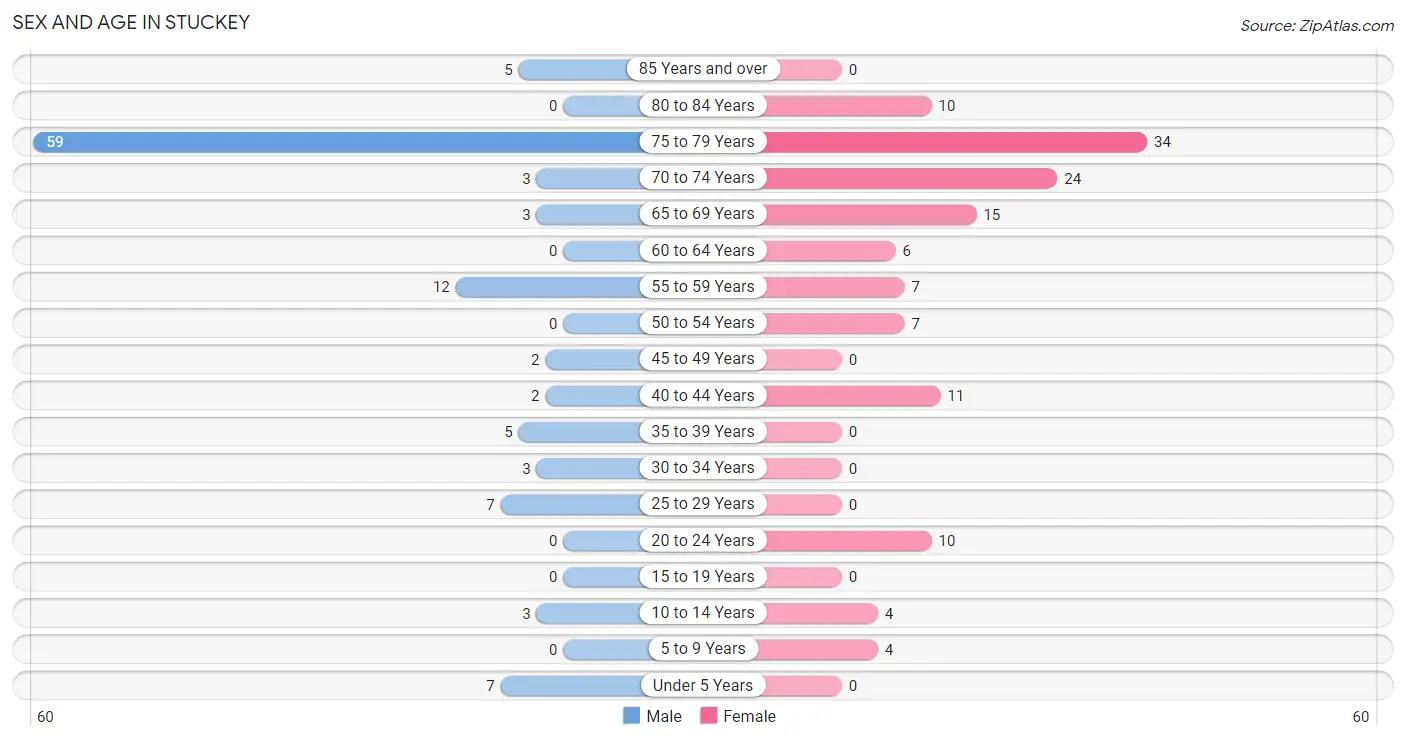
Sex and Age in Stuckey
The most populous age groups in Stuckey are 75 to 79 Years (59 | 53.1%) for men and 75 to 79 Years (34 | 25.8%) for women.
| Age Bracket | Male | Female |
| Under 5 Years | 7 (6.3%) | 0 (0.0%) |
| 5 to 9 Years | 0 (0.0%) | 4 (3.0%) |
| 10 to 14 Years | 3 (2.7%) | 4 (3.0%) |
| 15 to 19 Years | 0 (0.0%) | 0 (0.0%) |
| 20 to 24 Years | 0 (0.0%) | 10 (7.6%) |
| 25 to 29 Years | 7 (6.3%) | 0 (0.0%) |
| 30 to 34 Years | 3 (2.7%) | 0 (0.0%) |
| 35 to 39 Years | 5 (4.5%) | 0 (0.0%) |
| 40 to 44 Years | 2 (1.8%) | 11 (8.3%) |
| 45 to 49 Years | 2 (1.8%) | 0 (0.0%) |
| 50 to 54 Years | 0 (0.0%) | 7 (5.3%) |
| 55 to 59 Years | 12 (10.8%) | 7 (5.3%) |
| 60 to 64 Years | 0 (0.0%) | 6 (4.5%) |
| 65 to 69 Years | 3 (2.7%) | 15 (11.4%) |
| 70 to 74 Years | 3 (2.7%) | 24 (18.2%) |
| 75 to 79 Years | 59 (53.1%) | 34 (25.8%) |
| 80 to 84 Years | 0 (0.0%) | 10 (7.6%) |
| 85 Years and over | 5 (4.5%) | 0 (0.0%) |
| Total | 111 (100.0%) | 132 (100.0%) |
Families and Households in Stuckey
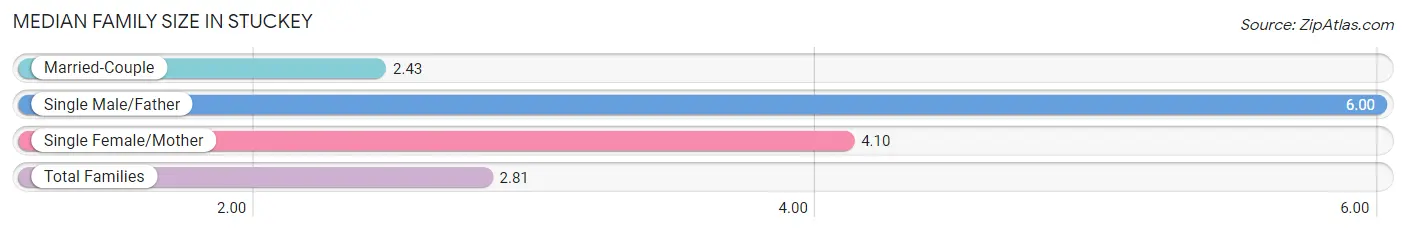
Median Family Size in Stuckey
The median family size in Stuckey is 2.81 persons per family, with single male/father families (3 | 4.1%) accounting for the largest median family size of 6 persons per family. On the other hand, married-couple families (60 | 82.2%) represent the smallest median family size with 2.43 persons per family.
| Family Type | # Families | Family Size |
| Married-Couple | 60 (82.2%) | 2.43 |
| Single Male/Father | 3 (4.1%) | 6.00 |
| Single Female/Mother | 10 (13.7%) | 4.10 |
| Total Families | 73 (100.0%) | 2.81 |
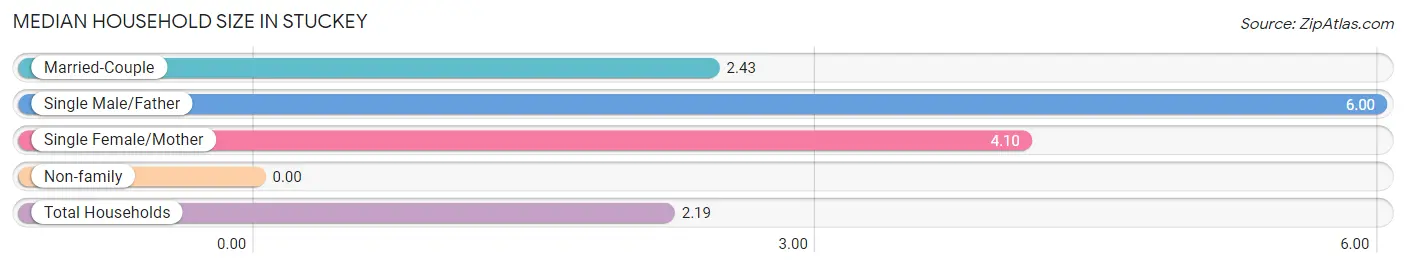
Median Household Size in Stuckey
| Household Type | # Households | Household Size |
| Married-Couple | 60 (54.0%) | 2.43 |
| Single Male/Father | 3 (2.7%) | 6.00 |
| Single Female/Mother | 10 (9.0%) | 4.10 |
| Non-family | 38 (34.2%) | - |
| Total Households | 111 (100.0%) | 2.19 |
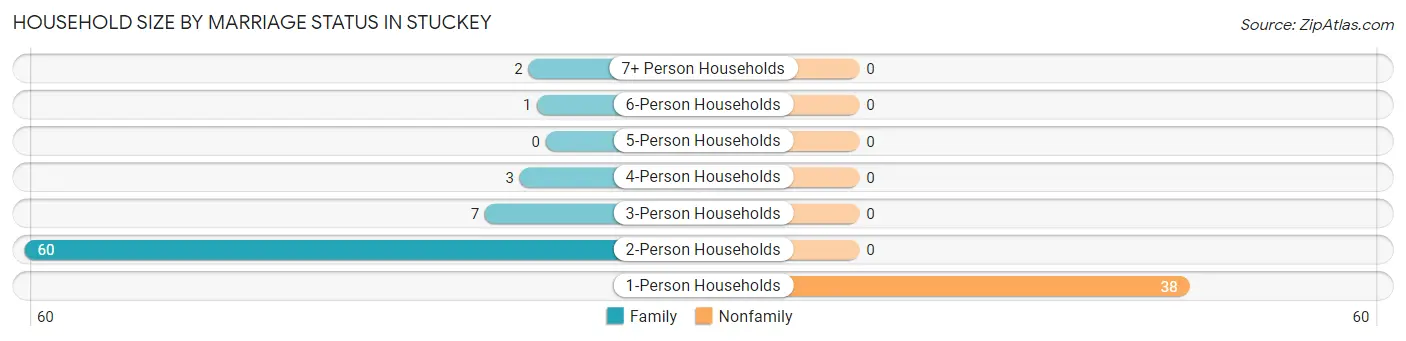
Household Size by Marriage Status in Stuckey
Out of a total of 111 households in Stuckey, 73 (65.8%) are family households, while 38 (34.2%) are nonfamily households. The most numerous type of family households are 2-person households, comprising 60, and the most common type of nonfamily households are 1-person households, comprising 38.
| Household Size | Family Households | Nonfamily Households |
| 1-Person Households | - | 38 (34.2%) |
| 2-Person Households | 60 (54.0%) | 0 (0.0%) |
| 3-Person Households | 7 (6.3%) | 0 (0.0%) |
| 4-Person Households | 3 (2.7%) | 0 (0.0%) |
| 5-Person Households | 0 (0.0%) | 0 (0.0%) |
| 6-Person Households | 1 (0.9%) | 0 (0.0%) |
| 7+ Person Households | 2 (1.8%) | 0 (0.0%) |
| Total | 73 (65.8%) | 38 (34.2%) |
Female Fertility in Stuckey
Fertility by Age in Stuckey
| Age Bracket | Women with Births | Births / 1,000 Women |
| 15 to 19 years | 0 (0.0%) | 0.0 |
| 20 to 34 years | 0 (0.0%) | 0.0 |
| 35 to 50 years | 0 (0.0%) | 0.0 |
| Total | 0 (0.0%) | 0.0 |
Fertility by Age by Marriage Status in Stuckey
| Age Bracket | Married | Unmarried |
| 15 to 19 years | 0 (0.0%) | 0 (0.0%) |
| 20 to 34 years | 0 (0.0%) | 0 (0.0%) |
| 35 to 50 years | 0 (0.0%) | 0 (0.0%) |
| Total | 0 (0.0%) | 0 (0.0%) |
Fertility by Education in Stuckey
| Educational Attainment | Women with Births | Births / 1,000 Women |
| Less than High School | 0 (0.0%) | 0.0 |
| High School Diploma | 0 (0.0%) | 0.0 |
| College or Associate's Degree | 0 (0.0%) | 0.0 |
| Bachelor's Degree | 0 (0.0%) | 0.0 |
| Graduate Degree | 0 (0.0%) | 0.0 |
| Total | 0 (0.0%) | 0.0 |
Fertility by Education by Marriage Status in Stuckey
| Educational Attainment | Married | Unmarried |
| Less than High School | 0 (0.0%) | 0 (0.0%) |
| High School Diploma | 0 (0.0%) | 0 (0.0%) |
| College or Associate's Degree | 0 (0.0%) | 0 (0.0%) |
| Bachelor's Degree | 0 (0.0%) | 0 (0.0%) |
| Graduate Degree | 0 (0.0%) | 0 (0.0%) |
| Total | 0 (0.0%) | 0 (0.0%) |
Employment Characteristics in Stuckey
Employment by Class of Employer in Stuckey
Among the 115 employed individuals in Stuckey, private company employees (106 | 92.2%), local government employees (6 | 5.2%), and self-employed (not incorporated) (2 | 1.7%) make up the most common classes of employment.
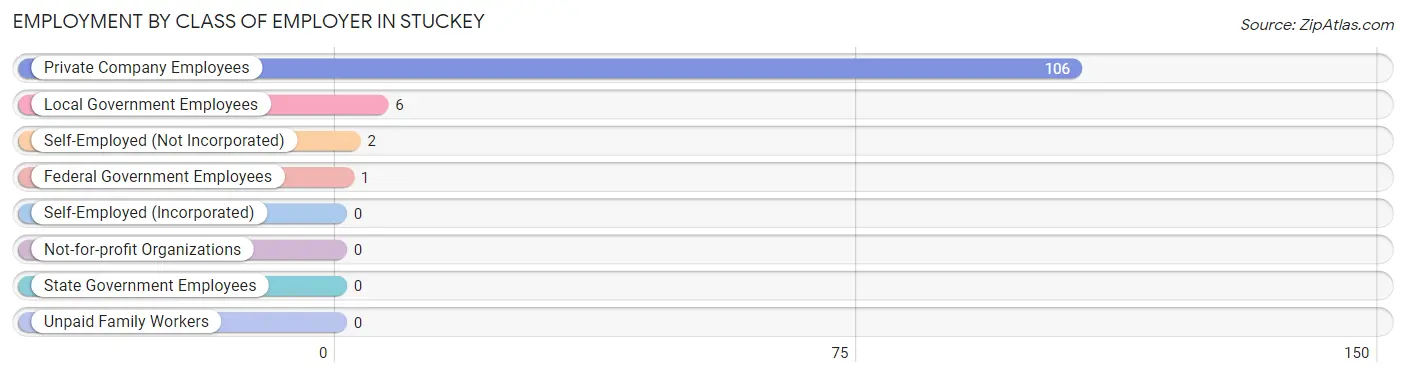
| Employer Class | # Employees | % Employees |
| Private Company Employees | 106 | 92.2% |
| Self-Employed (Incorporated) | 0 | 0.0% |
| Self-Employed (Not Incorporated) | 2 | 1.7% |
| Not-for-profit Organizations | 0 | 0.0% |
| Local Government Employees | 6 | 5.2% |
| State Government Employees | 0 | 0.0% |
| Federal Government Employees | 1 | 0.9% |
| Unpaid Family Workers | 0 | 0.0% |
| Total | 115 | 100.0% |
Employment Status by Age in Stuckey
According to the labor force statistics for Stuckey, out of the total population over 16 years of age (225), 57.3% or 129 individuals are in the labor force, with 10.9% or 14 of them unemployed. The age group with the highest labor force participation rate is 25 to 29 years, with 100.0% or 7 individuals in the labor force. Within the labor force, the 20 to 24 years age range has the highest percentage of unemployed individuals, with 100.0% or 7 of them being unemployed.
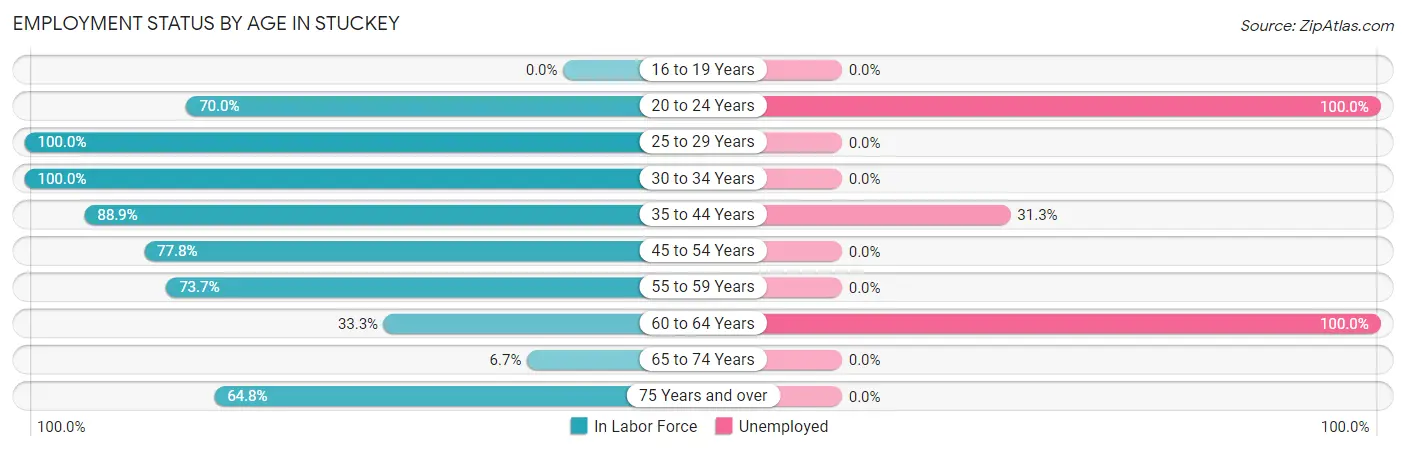
| Age Bracket | In Labor Force | Unemployed |
| 16 to 19 Years | 0 (0.0%) | 0 (0.0%) |
| 20 to 24 Years | 7 (70.0%) | 7 (100.0%) |
| 25 to 29 Years | 7 (100.0%) | 0 (0.0%) |
| 30 to 34 Years | 3 (100.0%) | 0 (0.0%) |
| 35 to 44 Years | 16 (88.9%) | 5 (31.3%) |
| 45 to 54 Years | 7 (77.8%) | 0 (0.0%) |
| 55 to 59 Years | 14 (73.7%) | 0 (0.0%) |
| 60 to 64 Years | 2 (33.3%) | 2 (100.0%) |
| 65 to 74 Years | 3 (6.7%) | 0 (0.0%) |
| 75 Years and over | 70 (64.8%) | 0 (0.0%) |
| Total | 129 (57.3%) | 14 (10.9%) |
Employment Status by Educational Attainment in Stuckey
According to labor force statistics for Stuckey, 79.0% of individuals (49) out of the total population between 25 and 64 years of age (62) are in the labor force, with 14.3% or 7 of them being unemployed. The group with the highest labor force participation rate are those with the educational attainment of bachelor's degree or higher, with 100.0% or 8 individuals in the labor force. Within the labor force, individuals with high school diploma education have the highest percentage of unemployment, with 20.0% or 5 of them being unemployed.
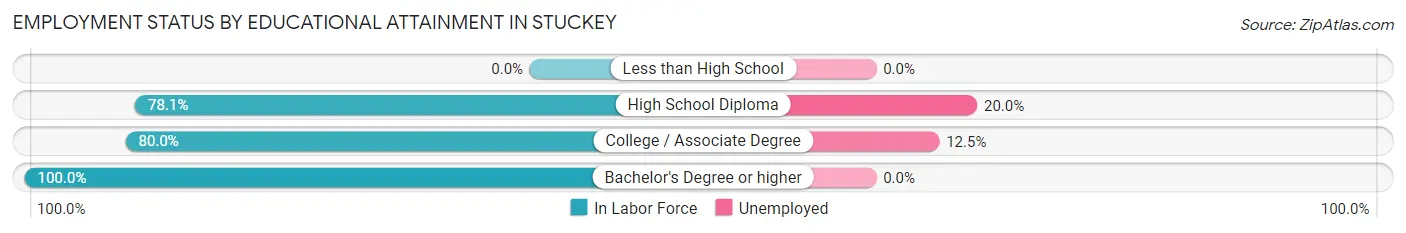
| Educational Attainment | In Labor Force | Unemployed |
| Less than High School | 0 (0.0%) | 0 (0.0%) |
| High School Diploma | 25 (78.1%) | 6 (20.0%) |
| College / Associate Degree | 16 (80.0%) | 2 (12.5%) |
| Bachelor's Degree or higher | 8 (100.0%) | 0 (0.0%) |
| Total | 49 (79.0%) | 9 (14.3%) |
Employment Occupations by Sex in Stuckey
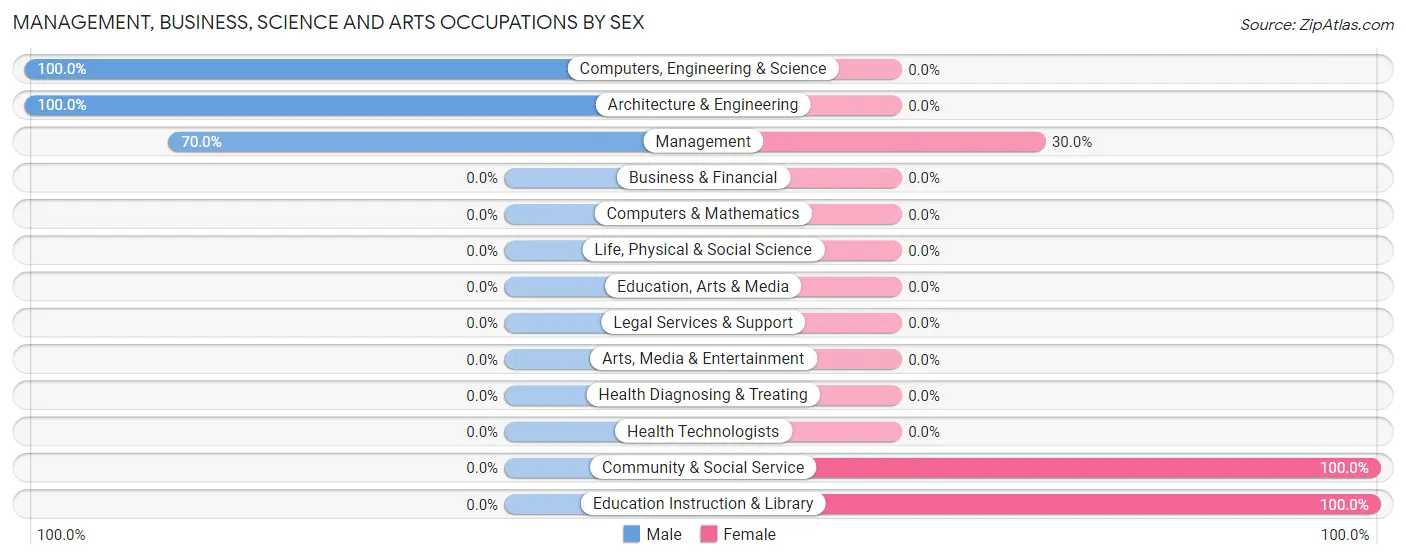
Management, Business, Science and Arts Occupations
The most common Management, Business, Science and Arts occupations in Stuckey are Management (70 | 60.9%), Community & Social Service (5 | 4.3%), Education Instruction & Library (5 | 4.3%), Computers, Engineering & Science (1 | 0.9%), and Architecture & Engineering (1 | 0.9%).
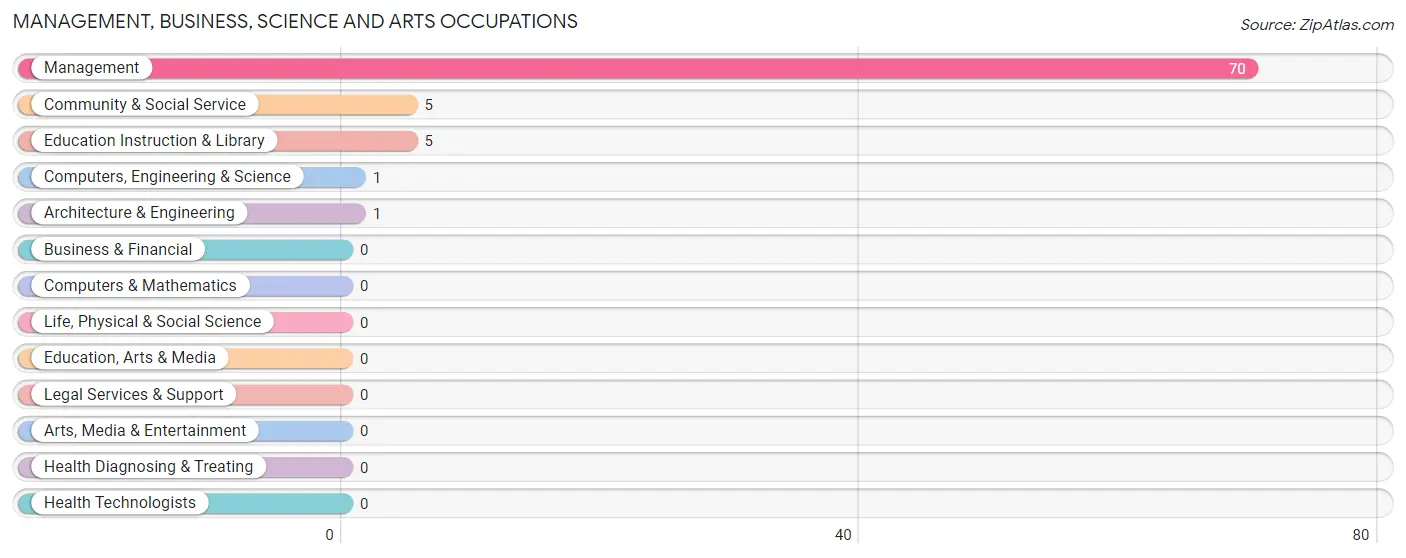
Management, Business, Science and Arts Occupations by Sex
Within the Management, Business, Science and Arts occupations in Stuckey, the most male-oriented occupations are Computers, Engineering & Science (100.0%), Architecture & Engineering (100.0%), and Management (70.0%), while the most female-oriented occupations are Community & Social Service (100.0%), Education Instruction & Library (100.0%), and Management (30.0%).
| Occupation | Male | Female |
| Management | 49 (70.0%) | 21 (30.0%) |
| Business & Financial | 0 (0.0%) | 0 (0.0%) |
| Computers, Engineering & Science | 1 (100.0%) | 0 (0.0%) |
| Computers & Mathematics | 0 (0.0%) | 0 (0.0%) |
| Architecture & Engineering | 1 (100.0%) | 0 (0.0%) |
| Life, Physical & Social Science | 0 (0.0%) | 0 (0.0%) |
| Community & Social Service | 0 (0.0%) | 5 (100.0%) |
| Education, Arts & Media | 0 (0.0%) | 0 (0.0%) |
| Legal Services & Support | 0 (0.0%) | 0 (0.0%) |
| Education Instruction & Library | 0 (0.0%) | 5 (100.0%) |
| Arts, Media & Entertainment | 0 (0.0%) | 0 (0.0%) |
| Health Diagnosing & Treating | 0 (0.0%) | 0 (0.0%) |
| Health Technologists | 0 (0.0%) | 0 (0.0%) |
| Total (Category) | 50 (65.8%) | 26 (34.2%) |
| Total (Overall) | 71 (61.7%) | 44 (38.3%) |
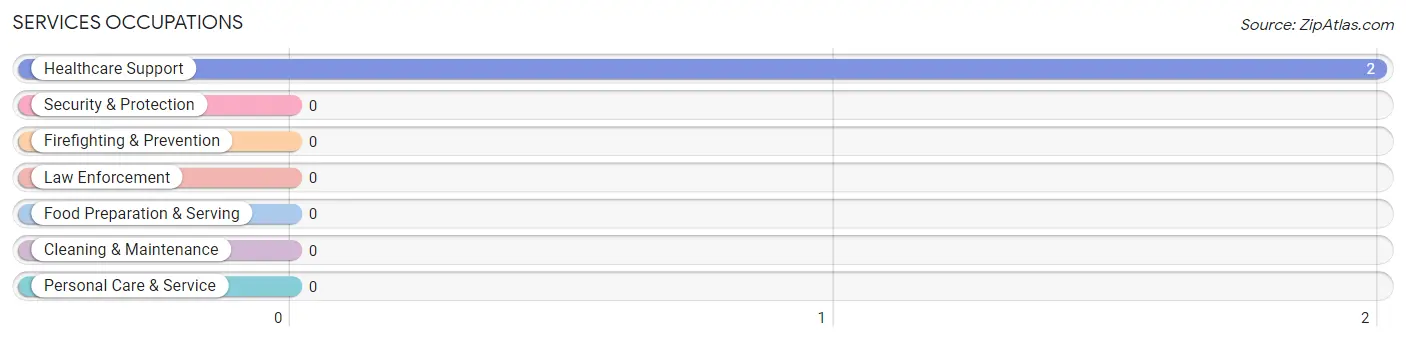
Services Occupations
The most common Services occupations in Stuckey are , and Healthcare Support (2 | 1.7%).
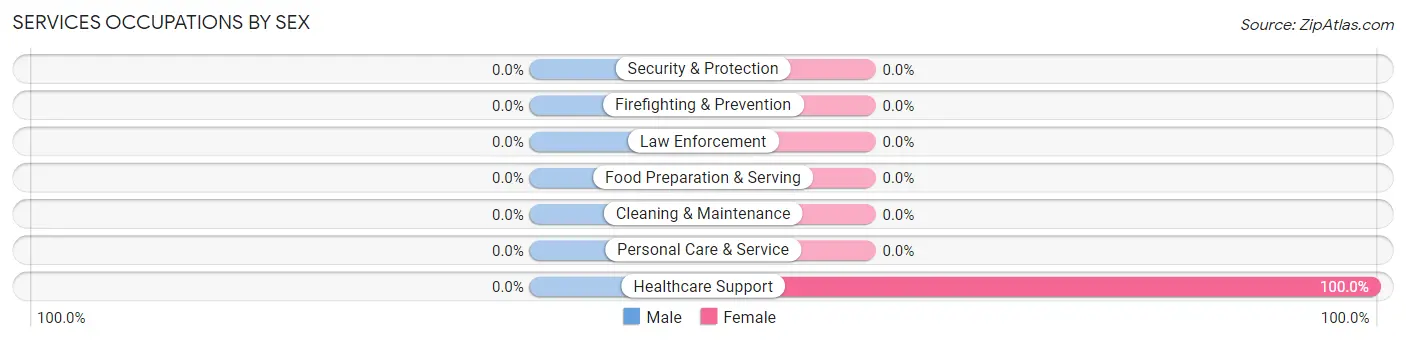
Services Occupations by Sex
| Occupation | Male | Female |
| Healthcare Support | 0 (0.0%) | 2 (100.0%) |
| Security & Protection | 0 (0.0%) | 0 (0.0%) |
| Firefighting & Prevention | 0 (0.0%) | 0 (0.0%) |
| Law Enforcement | 0 (0.0%) | 0 (0.0%) |
| Food Preparation & Serving | 0 (0.0%) | 0 (0.0%) |
| Cleaning & Maintenance | 0 (0.0%) | 0 (0.0%) |
| Personal Care & Service | 0 (0.0%) | 0 (0.0%) |
| Total (Category) | 0 (0.0%) | 2 (100.0%) |
| Total (Overall) | 71 (61.7%) | 44 (38.3%) |
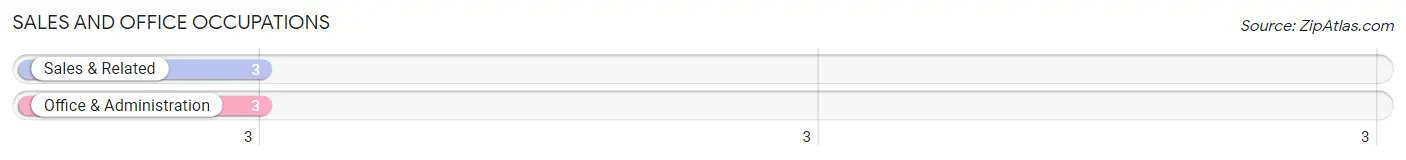
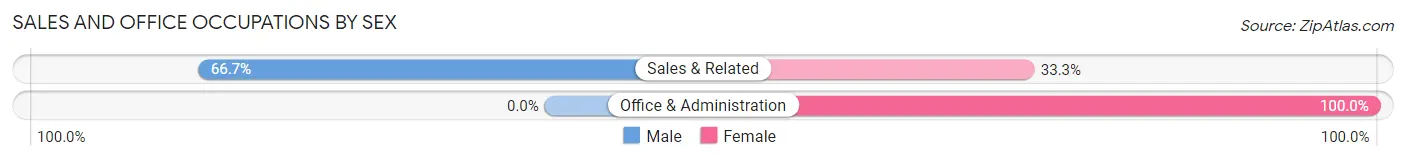
Sales and Office Occupations
The most common Sales and Office occupations in Stuckey are Sales & Related (3 | 2.6%), and Office & Administration (3 | 2.6%).
Sales and Office Occupations by Sex
| Occupation | Male | Female |
| Sales & Related | 2 (66.7%) | 1 (33.3%) |
| Office & Administration | 0 (0.0%) | 3 (100.0%) |
| Total (Category) | 2 (33.3%) | 4 (66.7%) |
| Total (Overall) | 71 (61.7%) | 44 (38.3%) |
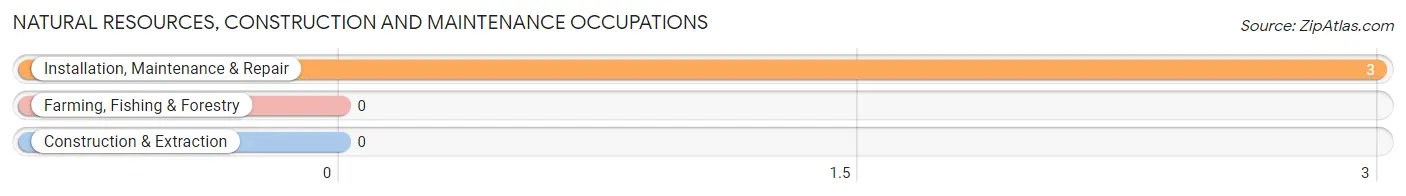
Natural Resources, Construction and Maintenance Occupations
The most common Natural Resources, Construction and Maintenance occupations in Stuckey are , and Installation, Maintenance & Repair (3 | 2.6%).
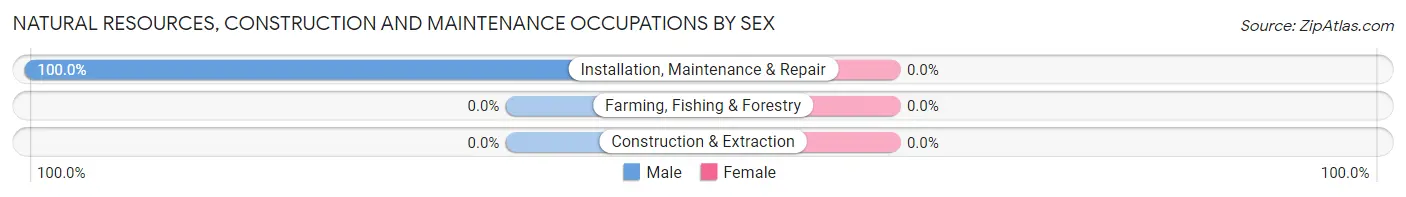
Natural Resources, Construction and Maintenance Occupations by Sex
| Occupation | Male | Female |
| Farming, Fishing & Forestry | 0 (0.0%) | 0 (0.0%) |
| Construction & Extraction | 0 (0.0%) | 0 (0.0%) |
| Installation, Maintenance & Repair | 3 (100.0%) | 0 (0.0%) |
| Total (Category) | 3 (100.0%) | 0 (0.0%) |
| Total (Overall) | 71 (61.7%) | 44 (38.3%) |
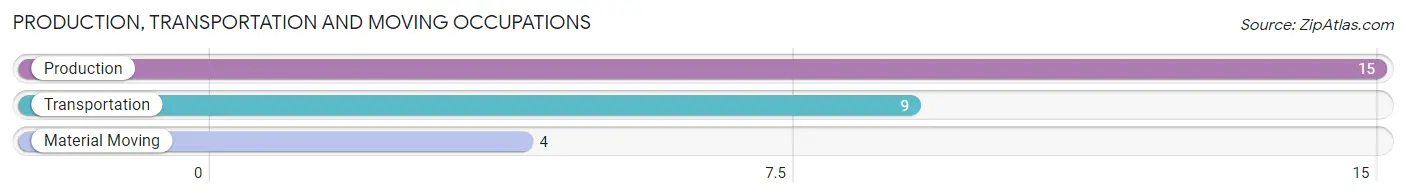
Production, Transportation and Moving Occupations
The most common Production, Transportation and Moving occupations in Stuckey are Production (15 | 13.0%), Transportation (9 | 7.8%), and Material Moving (4 | 3.5%).
Production, Transportation and Moving Occupations by Sex
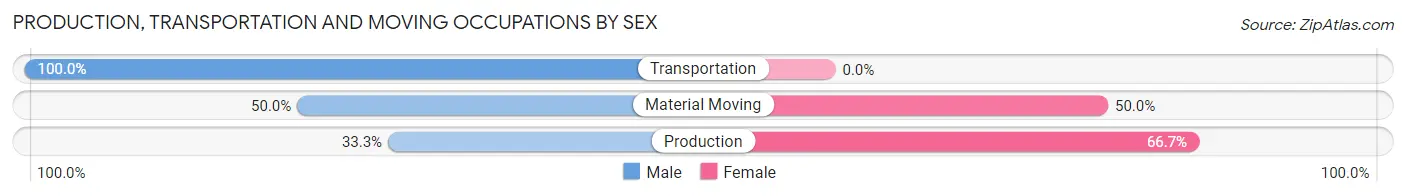
| Occupation | Male | Female |
| Production | 5 (33.3%) | 10 (66.7%) |
| Transportation | 9 (100.0%) | 0 (0.0%) |
| Material Moving | 2 (50.0%) | 2 (50.0%) |
| Total (Category) | 16 (57.1%) | 12 (42.9%) |
| Total (Overall) | 71 (61.7%) | 44 (38.3%) |
Employment Industries by Sex in Stuckey
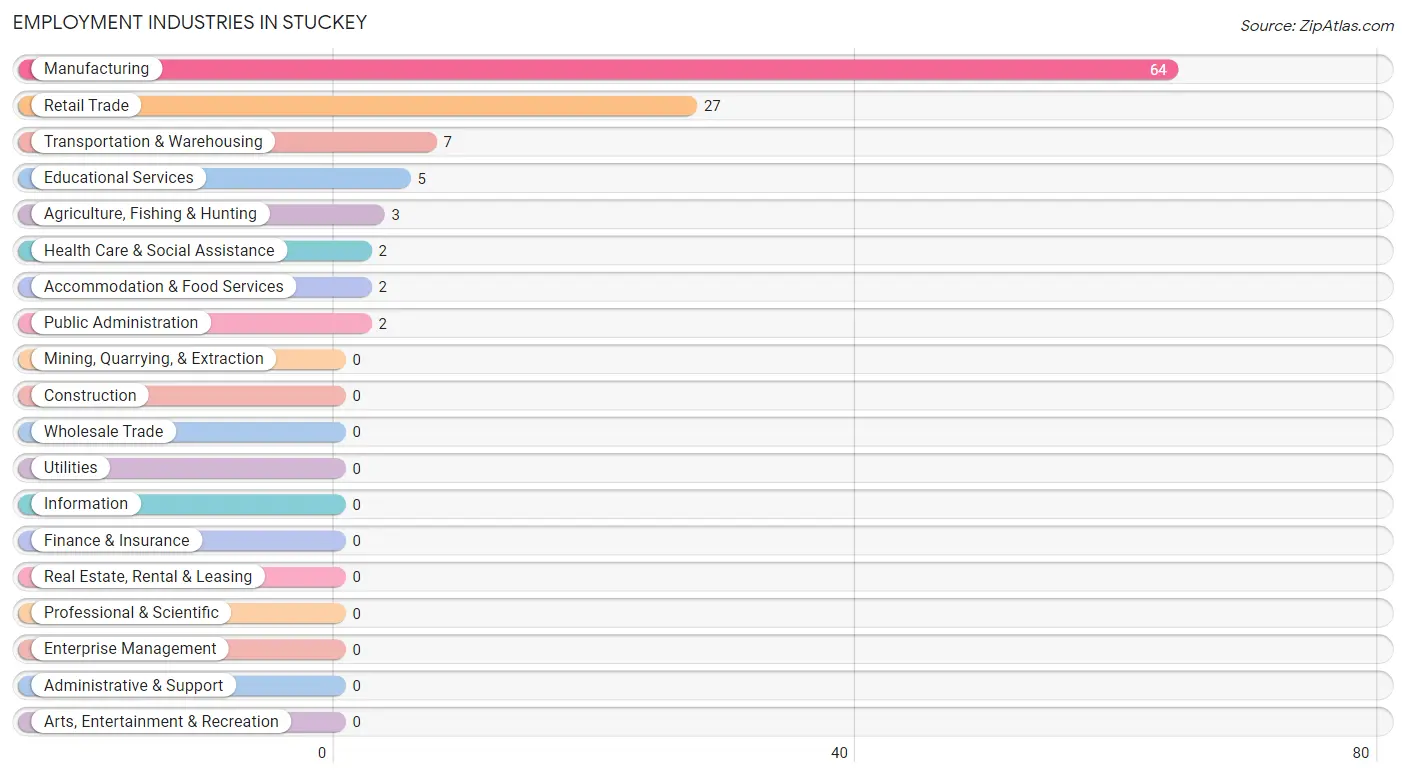
Employment Industries in Stuckey
The major employment industries in Stuckey include Manufacturing (64 | 55.6%), Retail Trade (27 | 23.5%), Transportation & Warehousing (7 | 6.1%), Educational Services (5 | 4.3%), and Agriculture, Fishing & Hunting (3 | 2.6%).
Employment Industries by Sex in Stuckey
The Stuckey industries that see more men than women are Agriculture, Fishing & Hunting (100.0%), Transportation & Warehousing (100.0%), and Accommodation & Food Services (100.0%), whereas the industries that tend to have a higher number of women are Educational Services (100.0%), Health Care & Social Assistance (100.0%), and Public Administration (100.0%).
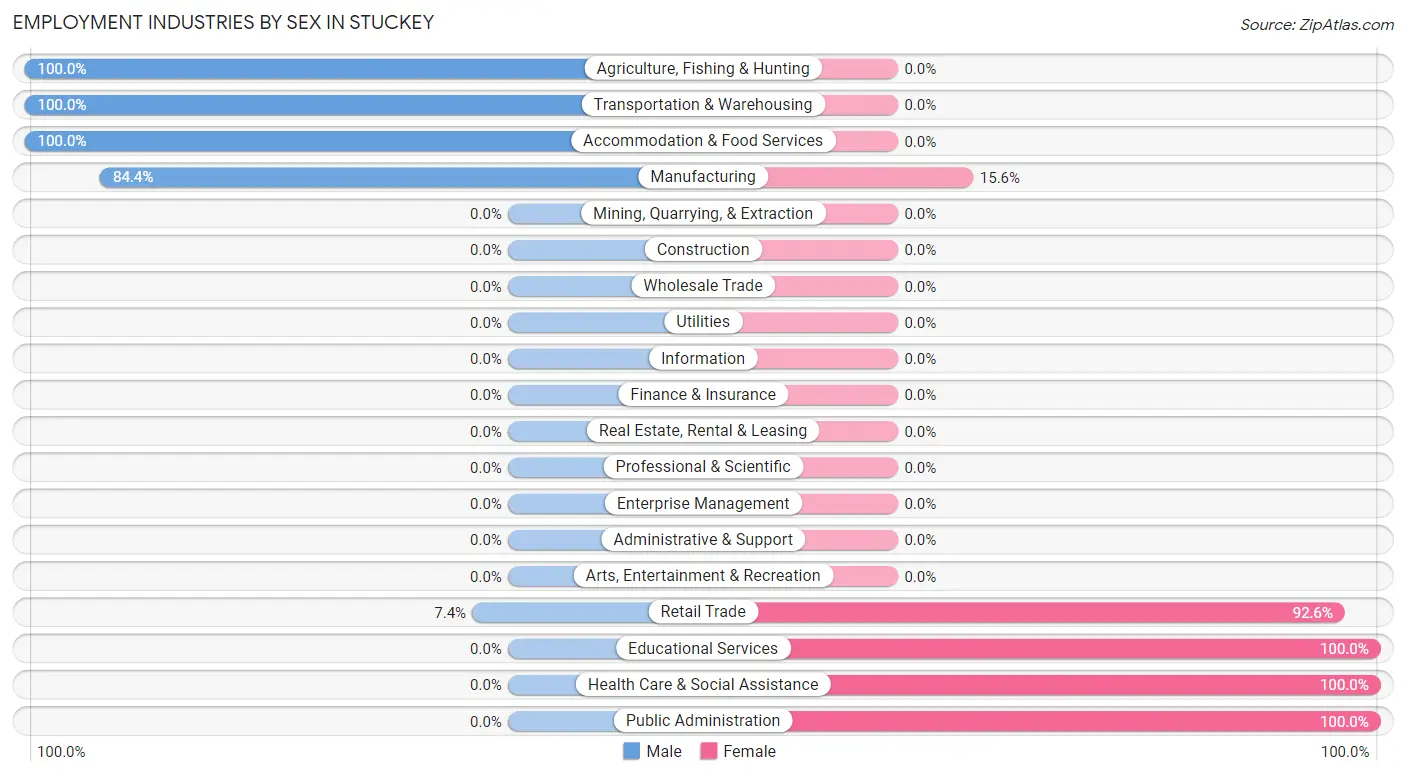
| Industry | Male | Female |
| Agriculture, Fishing & Hunting | 3 (100.0%) | 0 (0.0%) |
| Mining, Quarrying, & Extraction | 0 (0.0%) | 0 (0.0%) |
| Construction | 0 (0.0%) | 0 (0.0%) |
| Manufacturing | 54 (84.4%) | 10 (15.6%) |
| Wholesale Trade | 0 (0.0%) | 0 (0.0%) |
| Retail Trade | 2 (7.4%) | 25 (92.6%) |
| Transportation & Warehousing | 7 (100.0%) | 0 (0.0%) |
| Utilities | 0 (0.0%) | 0 (0.0%) |
| Information | 0 (0.0%) | 0 (0.0%) |
| Finance & Insurance | 0 (0.0%) | 0 (0.0%) |
| Real Estate, Rental & Leasing | 0 (0.0%) | 0 (0.0%) |
| Professional & Scientific | 0 (0.0%) | 0 (0.0%) |
| Enterprise Management | 0 (0.0%) | 0 (0.0%) |
| Administrative & Support | 0 (0.0%) | 0 (0.0%) |
| Educational Services | 0 (0.0%) | 5 (100.0%) |
| Health Care & Social Assistance | 0 (0.0%) | 2 (100.0%) |
| Arts, Entertainment & Recreation | 0 (0.0%) | 0 (0.0%) |
| Accommodation & Food Services | 2 (100.0%) | 0 (0.0%) |
| Public Administration | 0 (0.0%) | 2 (100.0%) |
| Total | 71 (61.7%) | 44 (38.3%) |
Education in Stuckey
School Enrollment in Stuckey
The most common levels of schooling among the 30 students in Stuckey are college / undergraduate (9 | 30.0%), middle school (6 | 20.0%), and nursery / preschool (5 | 16.7%).
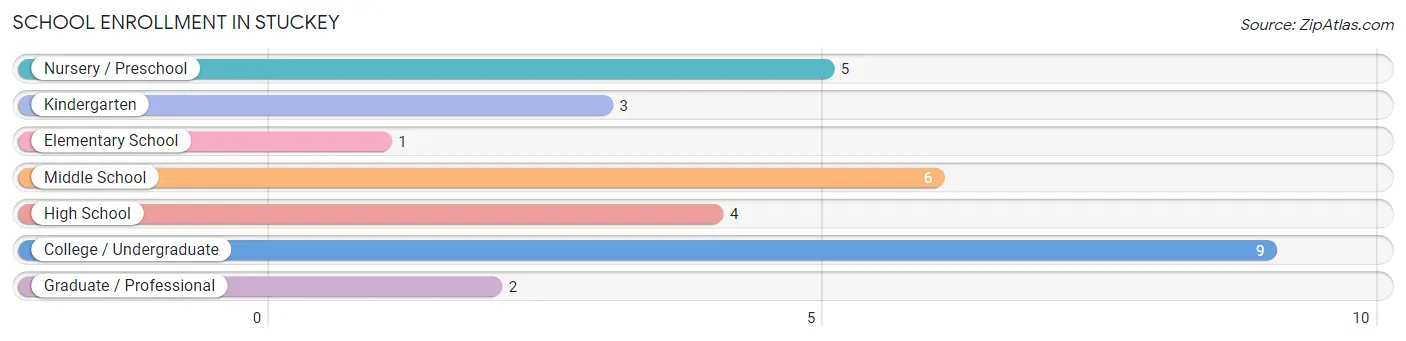
| School Level | # Students | % Students |
| Nursery / Preschool | 5 | 16.7% |
| Kindergarten | 3 | 10.0% |
| Elementary School | 1 | 3.3% |
| Middle School | 6 | 20.0% |
| High School | 4 | 13.3% |
| College / Undergraduate | 9 | 30.0% |
| Graduate / Professional | 2 | 6.7% |
| Total | 30 | 100.0% |
School Enrollment by Age by Funding Source in Stuckey
Out of a total of 30 students who are enrolled in schools in Stuckey, 2 (6.7%) attend a private institution, while the remaining 28 (93.3%) are enrolled in public schools. The age group of 10 to 14 year olds has the highest likelihood of being enrolled in private schools, with 2 (28.6% in the age bracket) enrolled. Conversely, the age group of 3 to 4 year olds has the lowest likelihood of being enrolled in a private school, with 5 (100.0% in the age bracket) attending a public institution.
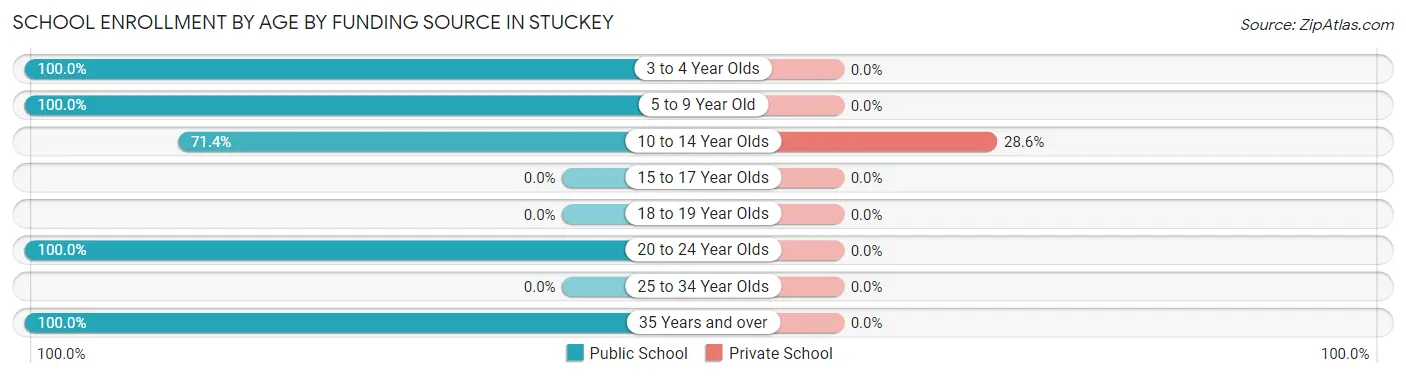
| Age Bracket | Public School | Private School |
| 3 to 4 Year Olds | 5 (100.0%) | 0 (0.0%) |
| 5 to 9 Year Old | 3 (100.0%) | 0 (0.0%) |
| 10 to 14 Year Olds | 5 (71.4%) | 2 (28.6%) |
| 15 to 17 Year Olds | 0 (0.0%) | 0 (0.0%) |
| 18 to 19 Year Olds | 0 (0.0%) | 0 (0.0%) |
| 20 to 24 Year Olds | 7 (100.0%) | 0 (0.0%) |
| 25 to 34 Year Olds | 0 (0.0%) | 0 (0.0%) |
| 35 Years and over | 8 (100.0%) | 0 (0.0%) |
| Total | 28 (93.3%) | 2 (6.7%) |
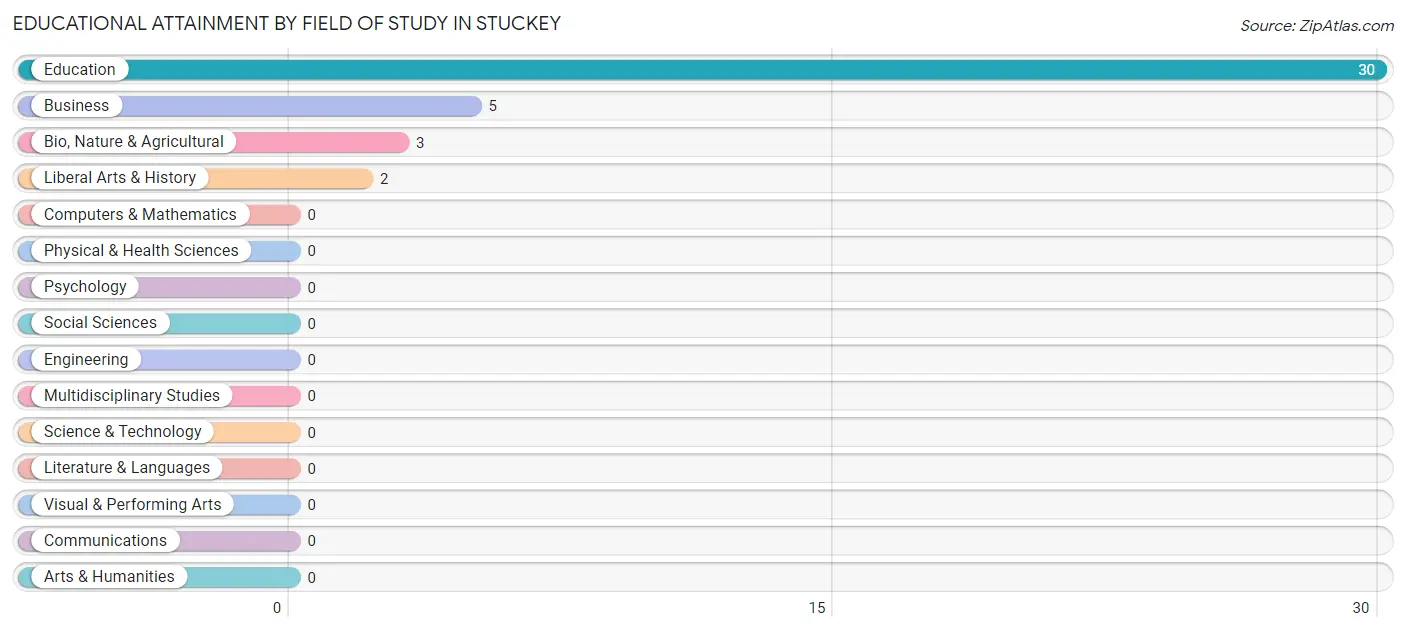
Educational Attainment by Field of Study in Stuckey
Education (30 | 75.0%), business (5 | 12.5%), bio, nature & agricultural (3 | 7.5%), and liberal arts & history (2 | 5.0%) are the most common fields of study among 40 individuals in Stuckey who have obtained a bachelor's degree or higher.
| Field of Study | # Graduates | % Graduates |
| Computers & Mathematics | 0 | 0.0% |
| Bio, Nature & Agricultural | 3 | 7.5% |
| Physical & Health Sciences | 0 | 0.0% |
| Psychology | 0 | 0.0% |
| Social Sciences | 0 | 0.0% |
| Engineering | 0 | 0.0% |
| Multidisciplinary Studies | 0 | 0.0% |
| Science & Technology | 0 | 0.0% |
| Business | 5 | 12.5% |
| Education | 30 | 75.0% |
| Literature & Languages | 0 | 0.0% |
| Liberal Arts & History | 2 | 5.0% |
| Visual & Performing Arts | 0 | 0.0% |
| Communications | 0 | 0.0% |
| Arts & Humanities | 0 | 0.0% |
| Total | 40 | 100.0% |
Transportation & Commute in Stuckey
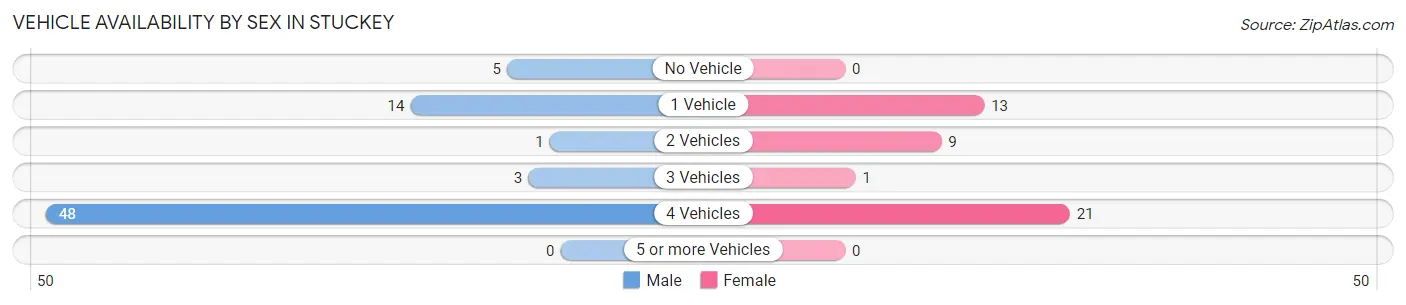
Vehicle Availability by Sex in Stuckey
The most prevalent vehicle ownership categories in Stuckey are males with 4 vehicles (48, accounting for 67.6%) and females with 4 vehicles (21, making up 109.1%).
| Vehicles Available | Male | Female |
| No Vehicle | 5 (7.0%) | 0 (0.0%) |
| 1 Vehicle | 14 (19.7%) | 13 (29.5%) |
| 2 Vehicles | 1 (1.4%) | 9 (20.4%) |
| 3 Vehicles | 3 (4.2%) | 1 (2.3%) |
| 4 Vehicles | 48 (67.6%) | 21 (47.7%) |
| 5 or more Vehicles | 0 (0.0%) | 0 (0.0%) |
| Total | 71 (100.0%) | 44 (100.0%) |
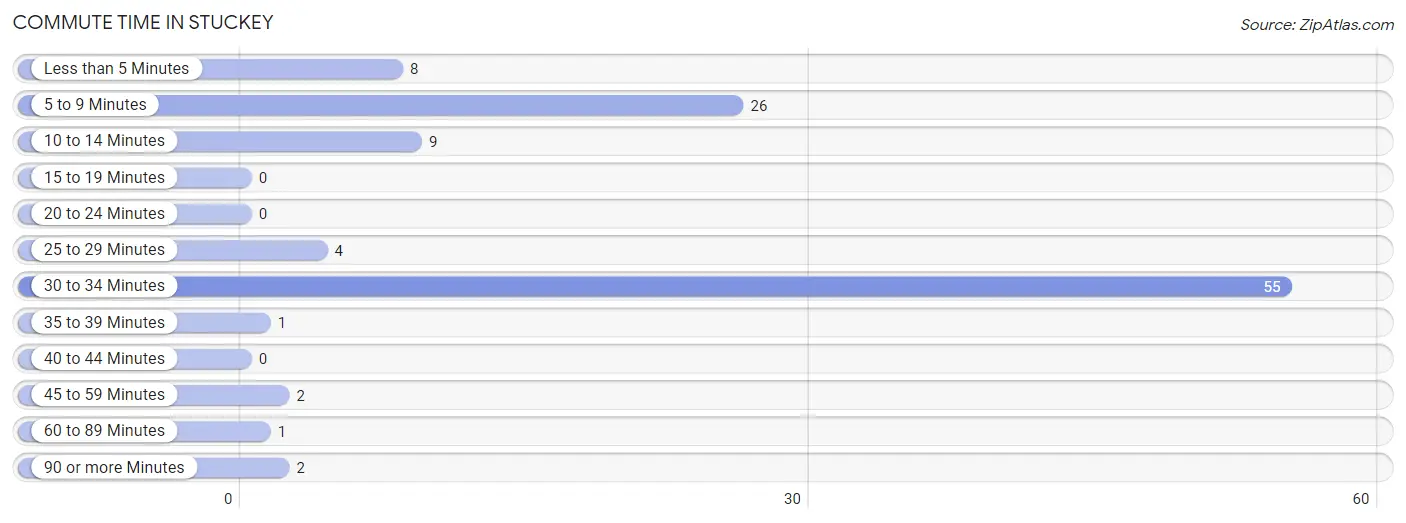
Commute Time in Stuckey
The most frequently occuring commute durations in Stuckey are 30 to 34 minutes (55 commuters, 50.9%), 5 to 9 minutes (26 commuters, 24.1%), and 10 to 14 minutes (9 commuters, 8.3%).
| Commute Time | # Commuters | % Commuters |
| Less than 5 Minutes | 8 | 7.4% |
| 5 to 9 Minutes | 26 | 24.1% |
| 10 to 14 Minutes | 9 | 8.3% |
| 15 to 19 Minutes | 0 | 0.0% |
| 20 to 24 Minutes | 0 | 0.0% |
| 25 to 29 Minutes | 4 | 3.7% |
| 30 to 34 Minutes | 55 | 50.9% |
| 35 to 39 Minutes | 1 | 0.9% |
| 40 to 44 Minutes | 0 | 0.0% |
| 45 to 59 Minutes | 2 | 1.8% |
| 60 to 89 Minutes | 1 | 0.9% |
| 90 or more Minutes | 2 | 1.8% |
Commute Time by Sex in Stuckey
The most common commute times in Stuckey are 30 to 34 minutes (46 commuters, 64.8%) for males and 5 to 9 minutes (22 commuters, 59.5%) for females.
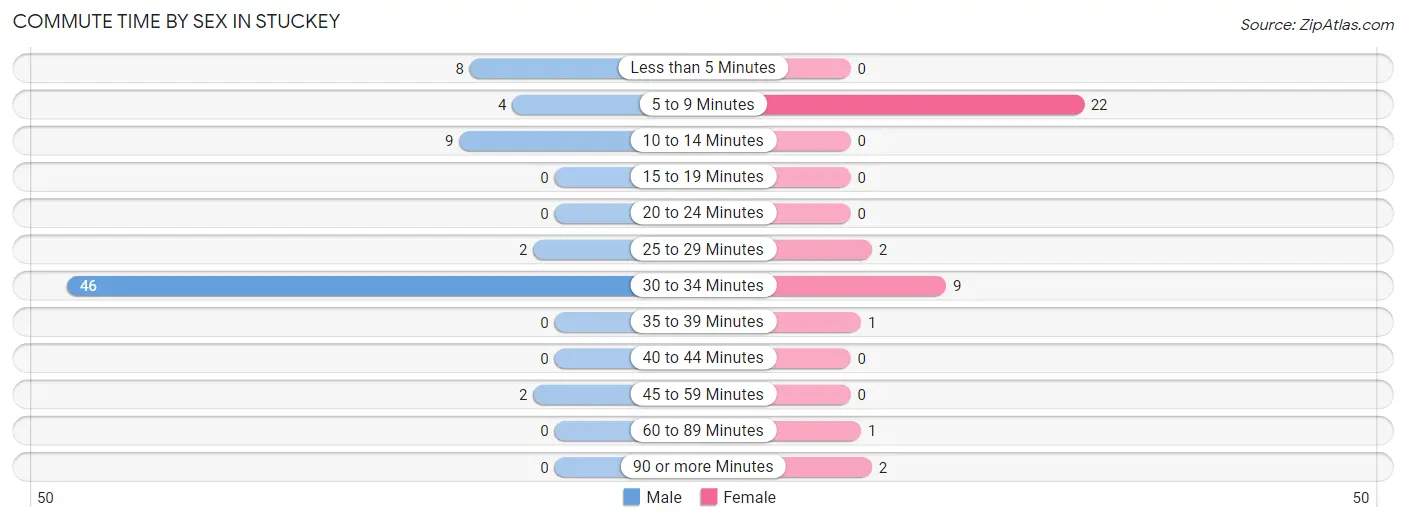
| Commute Time | Male | Female |
| Less than 5 Minutes | 8 (11.3%) | 0 (0.0%) |
| 5 to 9 Minutes | 4 (5.6%) | 22 (59.5%) |
| 10 to 14 Minutes | 9 (12.7%) | 0 (0.0%) |
| 15 to 19 Minutes | 0 (0.0%) | 0 (0.0%) |
| 20 to 24 Minutes | 0 (0.0%) | 0 (0.0%) |
| 25 to 29 Minutes | 2 (2.8%) | 2 (5.4%) |
| 30 to 34 Minutes | 46 (64.8%) | 9 (24.3%) |
| 35 to 39 Minutes | 0 (0.0%) | 1 (2.7%) |
| 40 to 44 Minutes | 0 (0.0%) | 0 (0.0%) |
| 45 to 59 Minutes | 2 (2.8%) | 0 (0.0%) |
| 60 to 89 Minutes | 0 (0.0%) | 1 (2.7%) |
| 90 or more Minutes | 0 (0.0%) | 2 (5.4%) |
Time of Departure to Work by Sex in Stuckey
The most frequent times of departure to work in Stuckey are 7:30 AM to 7:59 AM (46, 64.8%) for males and 8:30 AM to 8:59 AM (20, 54.0%) for females.
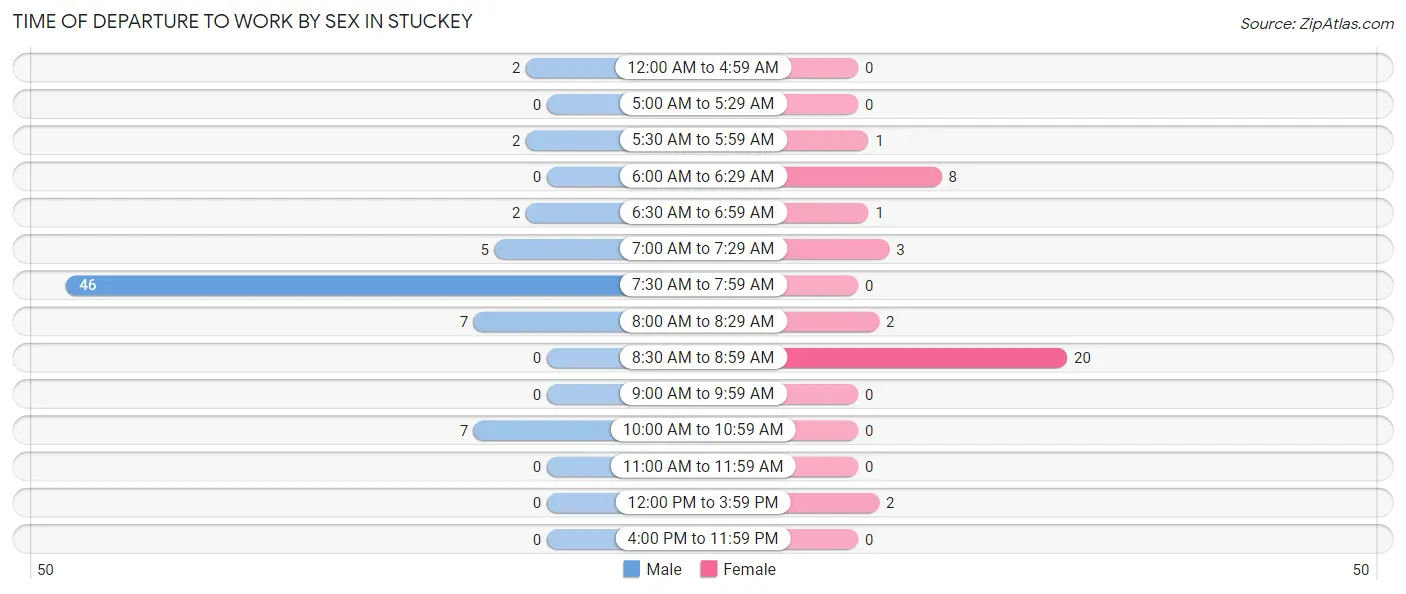
| Time of Departure | Male | Female |
| 12:00 AM to 4:59 AM | 2 (2.8%) | 0 (0.0%) |
| 5:00 AM to 5:29 AM | 0 (0.0%) | 0 (0.0%) |
| 5:30 AM to 5:59 AM | 2 (2.8%) | 1 (2.7%) |
| 6:00 AM to 6:29 AM | 0 (0.0%) | 8 (21.6%) |
| 6:30 AM to 6:59 AM | 2 (2.8%) | 1 (2.7%) |
| 7:00 AM to 7:29 AM | 5 (7.0%) | 3 (8.1%) |
| 7:30 AM to 7:59 AM | 46 (64.8%) | 0 (0.0%) |
| 8:00 AM to 8:29 AM | 7 (9.9%) | 2 (5.4%) |
| 8:30 AM to 8:59 AM | 0 (0.0%) | 20 (54.0%) |
| 9:00 AM to 9:59 AM | 0 (0.0%) | 0 (0.0%) |
| 10:00 AM to 10:59 AM | 7 (9.9%) | 0 (0.0%) |
| 11:00 AM to 11:59 AM | 0 (0.0%) | 0 (0.0%) |
| 12:00 PM to 3:59 PM | 0 (0.0%) | 2 (5.4%) |
| 4:00 PM to 11:59 PM | 0 (0.0%) | 0 (0.0%) |
| Total | 71 (100.0%) | 37 (100.0%) |
Housing Occupancy in Stuckey
Occupancy by Ownership in Stuckey
Of the total 111 dwellings in Stuckey, owner-occupied units account for 102 (91.9%), while renter-occupied units make up 9 (8.1%).
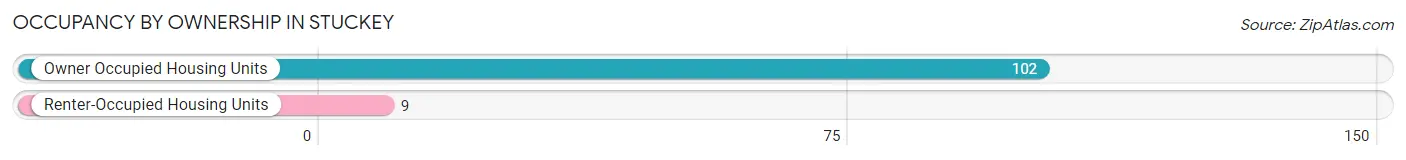
| Occupancy | # Housing Units | % Housing Units |
| Owner Occupied Housing Units | 102 | 91.9% |
| Renter-Occupied Housing Units | 9 | 8.1% |
| Total Occupied Housing Units | 111 | 100.0% |
Occupancy by Household Size in Stuckey
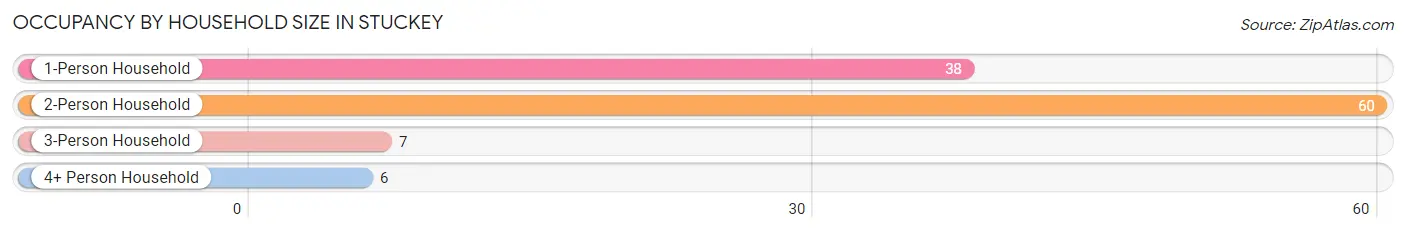
| Household Size | # Housing Units | % Housing Units |
| 1-Person Household | 38 | 34.2% |
| 2-Person Household | 60 | 54.0% |
| 3-Person Household | 7 | 6.3% |
| 4+ Person Household | 6 | 5.4% |
| Total Housing Units | 111 | 100.0% |
Occupancy by Ownership by Household Size in Stuckey
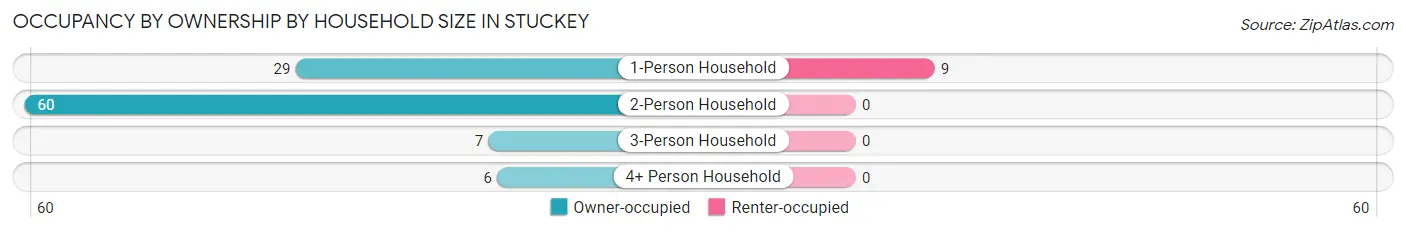
| Household Size | Owner-occupied | Renter-occupied |
| 1-Person Household | 29 (76.3%) | 9 (23.7%) |
| 2-Person Household | 60 (100.0%) | 0 (0.0%) |
| 3-Person Household | 7 (100.0%) | 0 (0.0%) |
| 4+ Person Household | 6 (100.0%) | 0 (0.0%) |
| Total Housing Units | 102 (91.9%) | 9 (8.1%) |
Occupancy by Educational Attainment in Stuckey
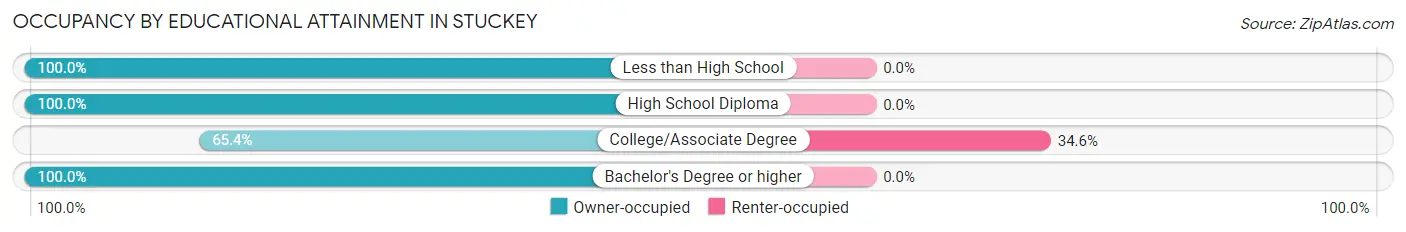
| Household Size | Owner-occupied | Renter-occupied |
| Less than High School | 14 (100.0%) | 0 (0.0%) |
| High School Diploma | 43 (100.0%) | 0 (0.0%) |
| College/Associate Degree | 17 (65.4%) | 9 (34.6%) |
| Bachelor's Degree or higher | 28 (100.0%) | 0 (0.0%) |
Occupancy by Age of Householder in Stuckey
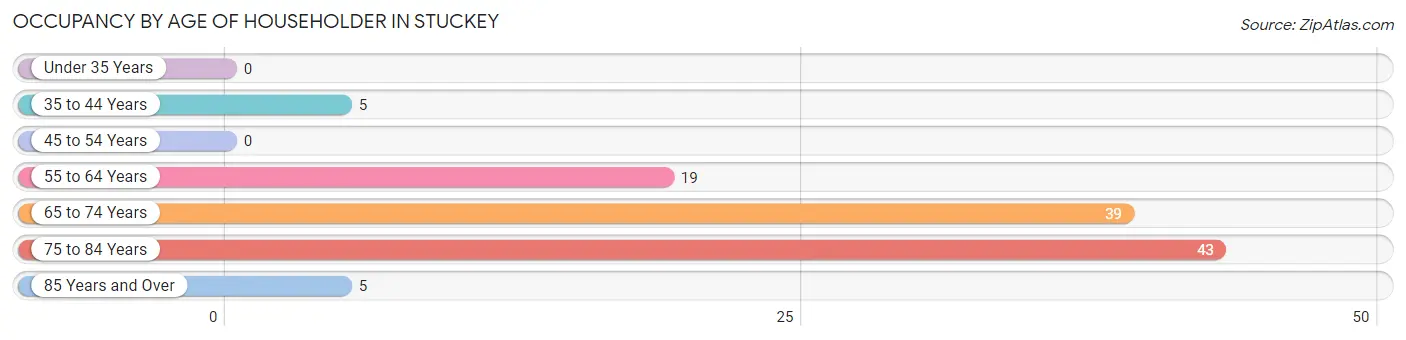
| Age Bracket | # Households | % Households |
| Under 35 Years | 0 | 0.0% |
| 35 to 44 Years | 5 | 4.5% |
| 45 to 54 Years | 0 | 0.0% |
| 55 to 64 Years | 19 | 17.1% |
| 65 to 74 Years | 39 | 35.1% |
| 75 to 84 Years | 43 | 38.7% |
| 85 Years and Over | 5 | 4.5% |
| Total | 111 | 100.0% |
Housing Finances in Stuckey
Median Income by Occupancy in Stuckey
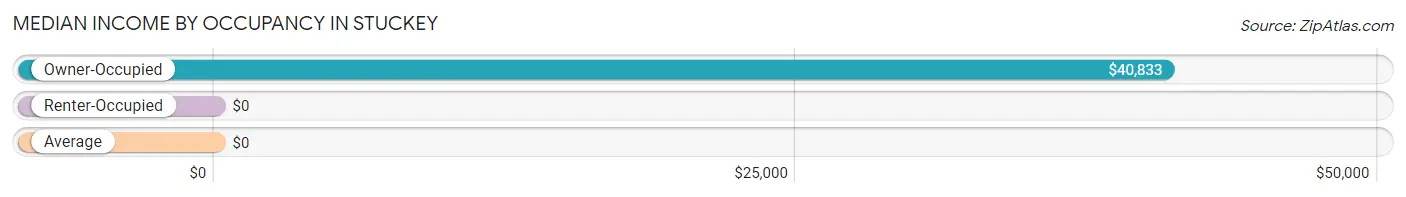
| Occupancy Type | # Households | Median Income |
| Owner-Occupied | 102 (91.9%) | $40,833 |
| Renter-Occupied | 9 (8.1%) | $0 |
| Average | 111 (100.0%) | $0 |
Occupancy by Householder Income Bracket in Stuckey
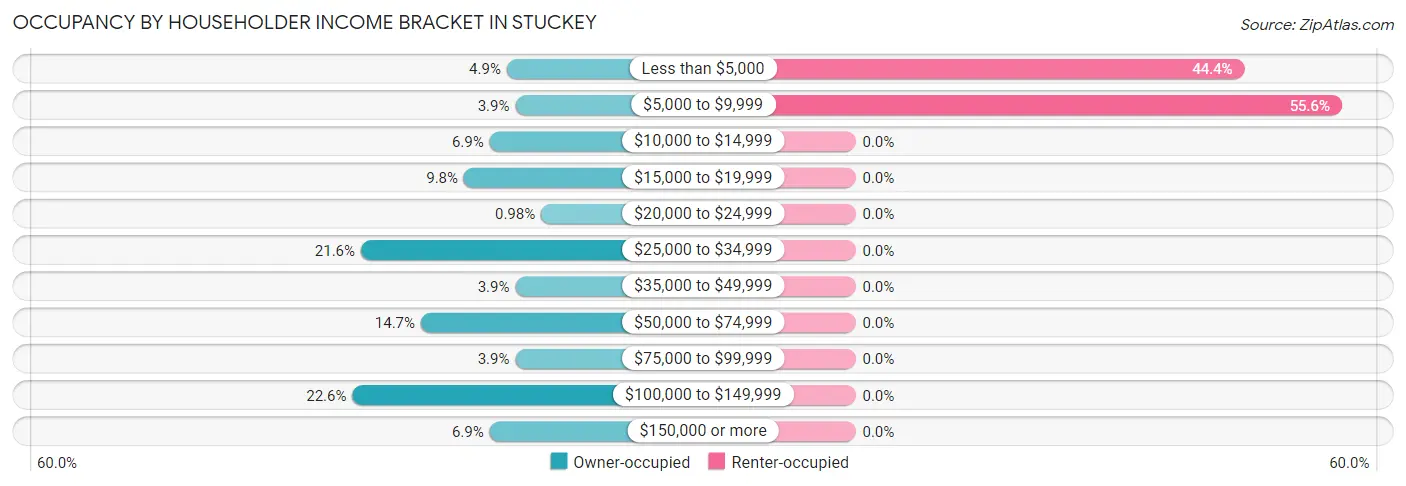
| Income Bracket | Owner-occupied | Renter-occupied |
| Less than $5,000 | 5 (4.9%) | 4 (44.4%) |
| $5,000 to $9,999 | 4 (3.9%) | 5 (55.6%) |
| $10,000 to $14,999 | 7 (6.9%) | 0 (0.0%) |
| $15,000 to $19,999 | 10 (9.8%) | 0 (0.0%) |
| $20,000 to $24,999 | 1 (1.0%) | 0 (0.0%) |
| $25,000 to $34,999 | 22 (21.6%) | 0 (0.0%) |
| $35,000 to $49,999 | 4 (3.9%) | 0 (0.0%) |
| $50,000 to $74,999 | 15 (14.7%) | 0 (0.0%) |
| $75,000 to $99,999 | 4 (3.9%) | 0 (0.0%) |
| $100,000 to $149,999 | 23 (22.6%) | 0 (0.0%) |
| $150,000 or more | 7 (6.9%) | 0 (0.0%) |
| Total | 102 (100.0%) | 9 (100.0%) |
Monthly Housing Cost Tiers in Stuckey
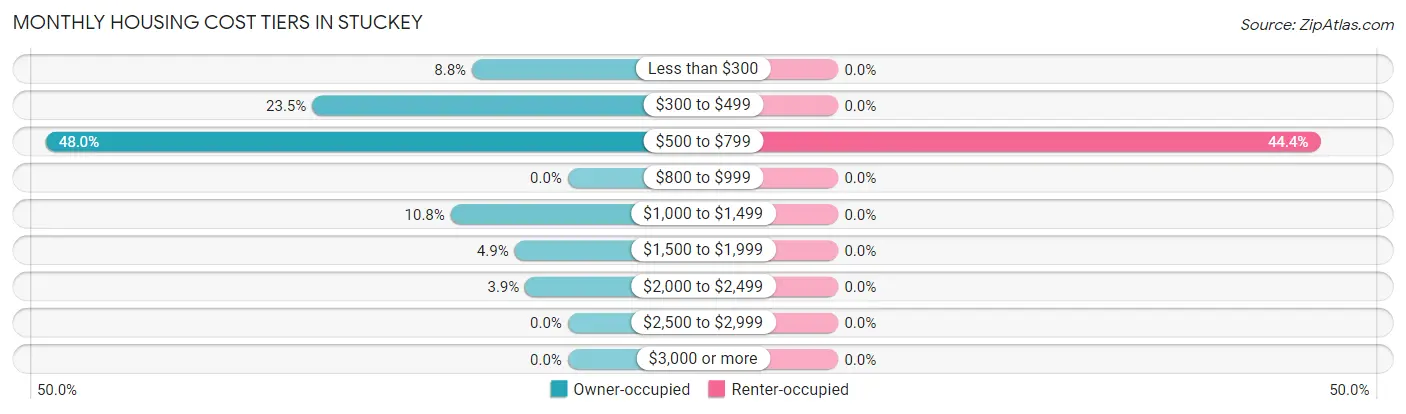
| Monthly Cost | Owner-occupied | Renter-occupied |
| Less than $300 | 9 (8.8%) | 0 (0.0%) |
| $300 to $499 | 24 (23.5%) | 0 (0.0%) |
| $500 to $799 | 49 (48.0%) | 4 (44.4%) |
| $800 to $999 | 0 (0.0%) | 0 (0.0%) |
| $1,000 to $1,499 | 11 (10.8%) | 0 (0.0%) |
| $1,500 to $1,999 | 5 (4.9%) | 0 (0.0%) |
| $2,000 to $2,499 | 4 (3.9%) | 0 (0.0%) |
| $2,500 to $2,999 | 0 (0.0%) | 0 (0.0%) |
| $3,000 or more | 0 (0.0%) | 0 (0.0%) |
| Total | 102 (100.0%) | 9 (100.0%) |
Physical Housing Characteristics in Stuckey
Housing Structures in Stuckey
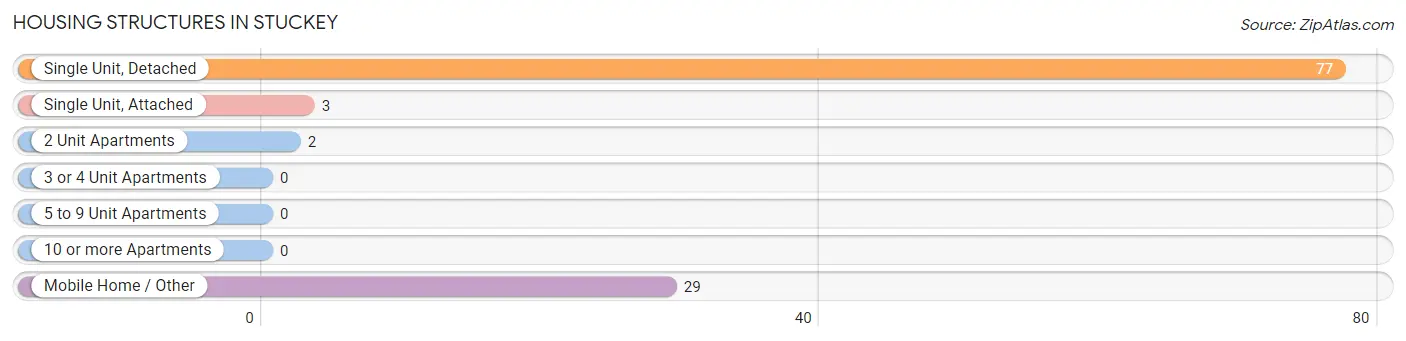
| Structure Type | # Housing Units | % Housing Units |
| Single Unit, Detached | 77 | 69.4% |
| Single Unit, Attached | 3 | 2.7% |
| 2 Unit Apartments | 2 | 1.8% |
| 3 or 4 Unit Apartments | 0 | 0.0% |
| 5 to 9 Unit Apartments | 0 | 0.0% |
| 10 or more Apartments | 0 | 0.0% |
| Mobile Home / Other | 29 | 26.1% |
| Total | 111 | 100.0% |
Housing Structures by Occupancy in Stuckey
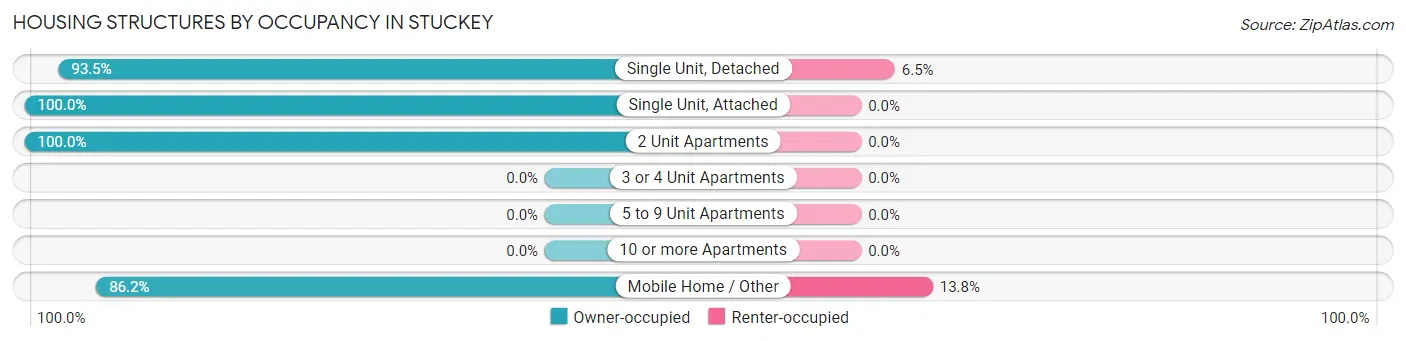
| Structure Type | Owner-occupied | Renter-occupied |
| Single Unit, Detached | 72 (93.5%) | 5 (6.5%) |
| Single Unit, Attached | 3 (100.0%) | 0 (0.0%) |
| 2 Unit Apartments | 2 (100.0%) | 0 (0.0%) |
| 3 or 4 Unit Apartments | 0 (0.0%) | 0 (0.0%) |
| 5 to 9 Unit Apartments | 0 (0.0%) | 0 (0.0%) |
| 10 or more Apartments | 0 (0.0%) | 0 (0.0%) |
| Mobile Home / Other | 25 (86.2%) | 4 (13.8%) |
| Total | 102 (91.9%) | 9 (8.1%) |
Housing Structures by Number of Rooms in Stuckey
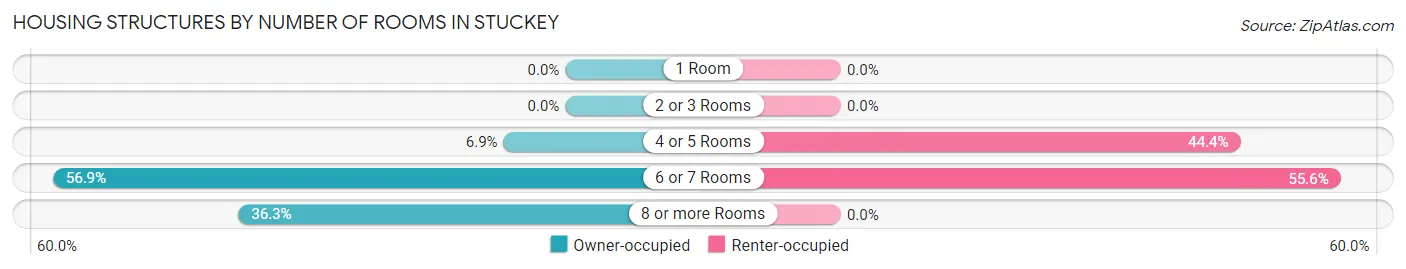
| Number of Rooms | Owner-occupied | Renter-occupied |
| 1 Room | 0 (0.0%) | 0 (0.0%) |
| 2 or 3 Rooms | 0 (0.0%) | 0 (0.0%) |
| 4 or 5 Rooms | 7 (6.9%) | 4 (44.4%) |
| 6 or 7 Rooms | 58 (56.9%) | 5 (55.6%) |
| 8 or more Rooms | 37 (36.3%) | 0 (0.0%) |
| Total | 102 (100.0%) | 9 (100.0%) |
Housing Structure by Heating Type in Stuckey
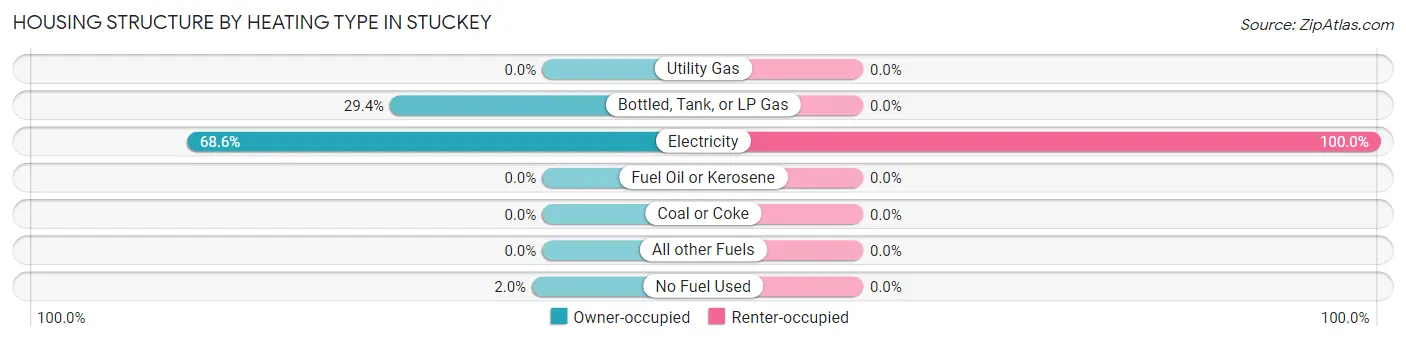
| Heating Type | Owner-occupied | Renter-occupied |
| Utility Gas | 0 (0.0%) | 0 (0.0%) |
| Bottled, Tank, or LP Gas | 30 (29.4%) | 0 (0.0%) |
| Electricity | 70 (68.6%) | 9 (100.0%) |
| Fuel Oil or Kerosene | 0 (0.0%) | 0 (0.0%) |
| Coal or Coke | 0 (0.0%) | 0 (0.0%) |
| All other Fuels | 0 (0.0%) | 0 (0.0%) |
| No Fuel Used | 2 (2.0%) | 0 (0.0%) |
| Total | 102 (100.0%) | 9 (100.0%) |
Household Vehicle Usage in Stuckey
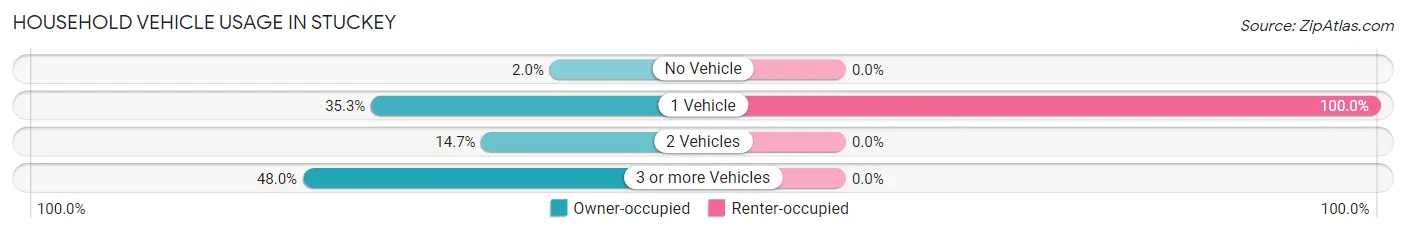
| Vehicles per Household | Owner-occupied | Renter-occupied |
| No Vehicle | 2 (2.0%) | 0 (0.0%) |
| 1 Vehicle | 36 (35.3%) | 9 (100.0%) |
| 2 Vehicles | 15 (14.7%) | 0 (0.0%) |
| 3 or more Vehicles | 49 (48.0%) | 0 (0.0%) |
| Total | 102 (100.0%) | 9 (100.0%) |
Real Estate & Mortgages in Stuckey
Real Estate and Mortgage Overview in Stuckey
| Characteristic | Without Mortgage | With Mortgage |
| Housing Units | 82 | 20 |
| Median Property Value | $87,800 | $96,000 |
| Median Household Income | - | - |
| Monthly Housing Costs | $608 | $0 |
| Real Estate Taxes | - | - |
Property Value by Mortgage Status in Stuckey
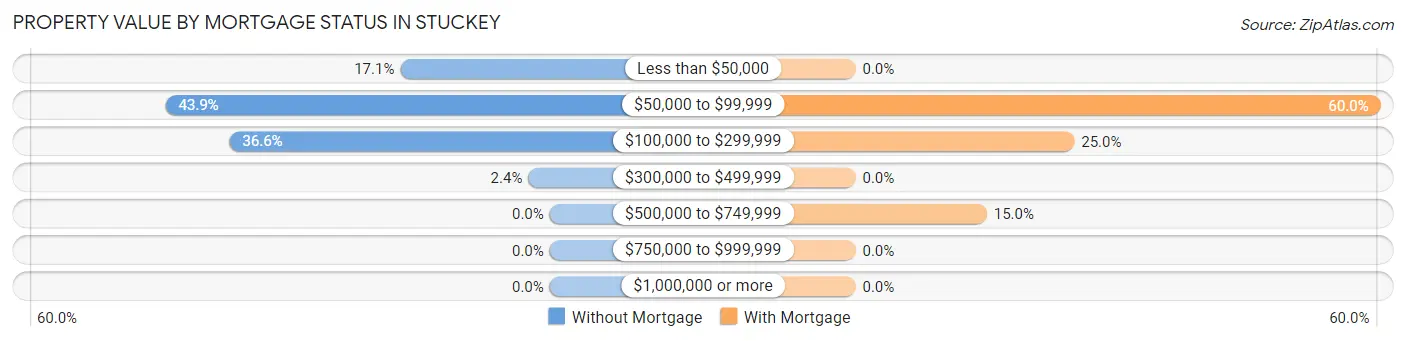
| Property Value | Without Mortgage | With Mortgage |
| Less than $50,000 | 14 (17.1%) | 0 (0.0%) |
| $50,000 to $99,999 | 36 (43.9%) | 12 (60.0%) |
| $100,000 to $299,999 | 30 (36.6%) | 5 (25.0%) |
| $300,000 to $499,999 | 2 (2.4%) | 0 (0.0%) |
| $500,000 to $749,999 | 0 (0.0%) | 3 (15.0%) |
| $750,000 to $999,999 | 0 (0.0%) | 0 (0.0%) |
| $1,000,000 or more | 0 (0.0%) | 0 (0.0%) |
| Total | 82 (100.0%) | 20 (100.0%) |
Household Income by Mortgage Status in Stuckey
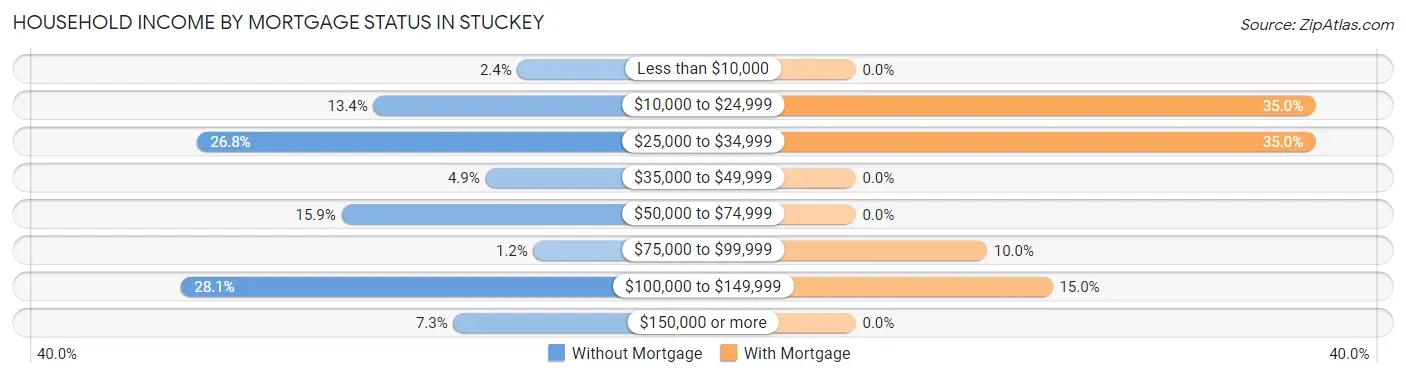
| Household Income | Without Mortgage | With Mortgage |
| Less than $10,000 | 2 (2.4%) | 0 (0.0%) |
| $10,000 to $24,999 | 11 (13.4%) | 7 (35.0%) |
| $25,000 to $34,999 | 22 (26.8%) | 7 (35.0%) |
| $35,000 to $49,999 | 4 (4.9%) | 0 (0.0%) |
| $50,000 to $74,999 | 13 (15.9%) | 0 (0.0%) |
| $75,000 to $99,999 | 1 (1.2%) | 2 (10.0%) |
| $100,000 to $149,999 | 23 (28.1%) | 3 (15.0%) |
| $150,000 or more | 6 (7.3%) | 0 (0.0%) |
| Total | 82 (100.0%) | 20 (100.0%) |
Property Value to Household Income Ratio in Stuckey
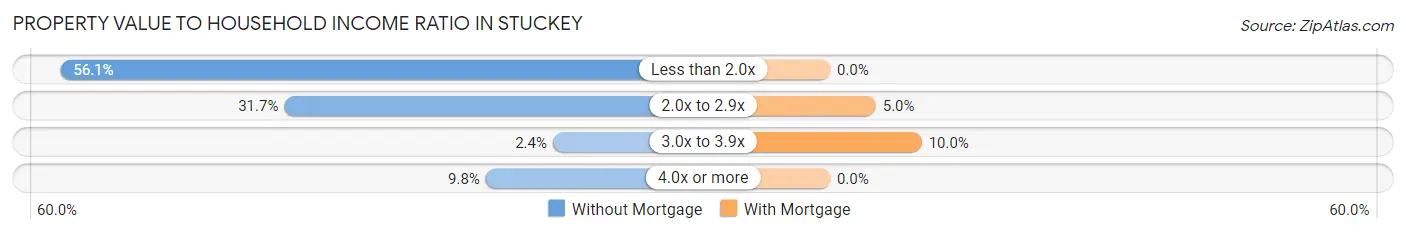
| Value-to-Income Ratio | Without Mortgage | With Mortgage |
| Less than 2.0x | 46 (56.1%) | 0 (0.0%) |
| 2.0x to 2.9x | 26 (31.7%) | 1 (5.0%) |
| 3.0x to 3.9x | 2 (2.4%) | 2 (10.0%) |
| 4.0x or more | 8 (9.8%) | 0 (0.0%) |
| Total | 82 (100.0%) | 20 (100.0%) |
Real Estate Taxes by Mortgage Status in Stuckey
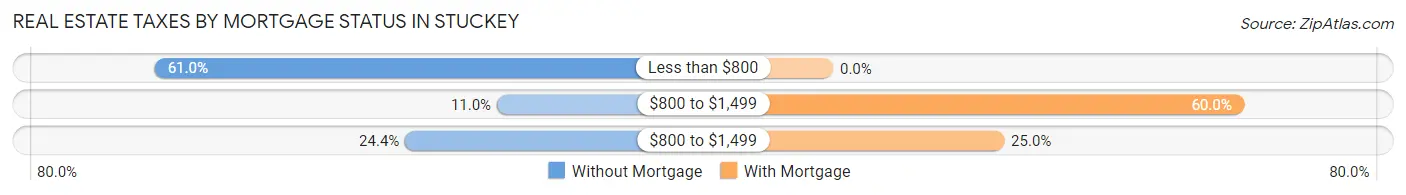
| Property Taxes | Without Mortgage | With Mortgage |
| Less than $800 | 50 (61.0%) | 0 (0.0%) |
| $800 to $1,499 | 9 (11.0%) | 12 (60.0%) |
| $800 to $1,499 | 20 (24.4%) | 5 (25.0%) |
| Total | 82 (100.0%) | 20 (100.0%) |
Health & Disability in Stuckey
Health Insurance Coverage by Age in Stuckey
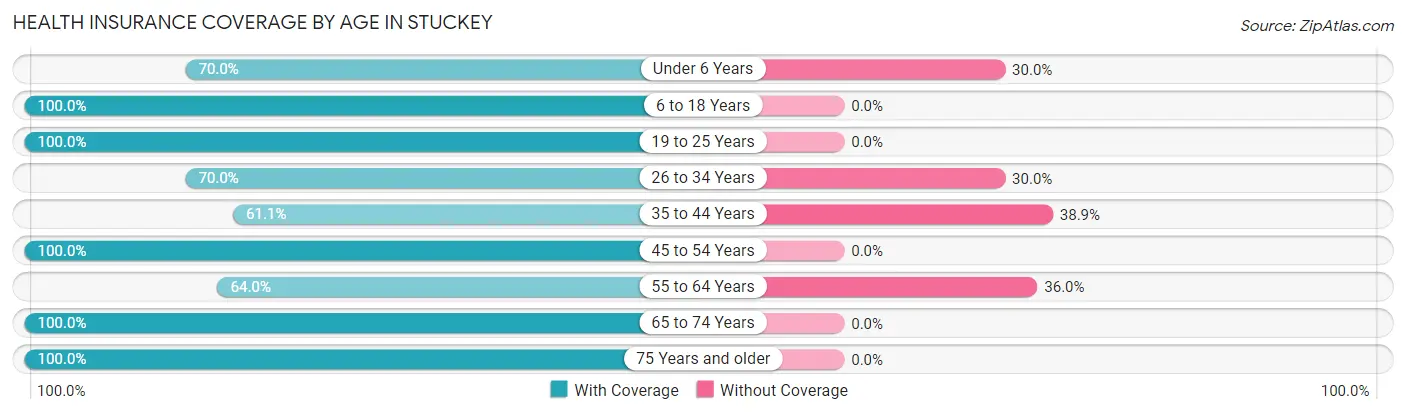
| Age Bracket | With Coverage | Without Coverage |
| Under 6 Years | 7 (70.0%) | 3 (30.0%) |
| 6 to 18 Years | 8 (100.0%) | 0 (0.0%) |
| 19 to 25 Years | 10 (100.0%) | 0 (0.0%) |
| 26 to 34 Years | 7 (70.0%) | 3 (30.0%) |
| 35 to 44 Years | 11 (61.1%) | 7 (38.9%) |
| 45 to 54 Years | 9 (100.0%) | 0 (0.0%) |
| 55 to 64 Years | 16 (64.0%) | 9 (36.0%) |
| 65 to 74 Years | 45 (100.0%) | 0 (0.0%) |
| 75 Years and older | 108 (100.0%) | 0 (0.0%) |
| Total | 221 (90.9%) | 22 (9.0%) |
Health Insurance Coverage by Citizenship Status in Stuckey
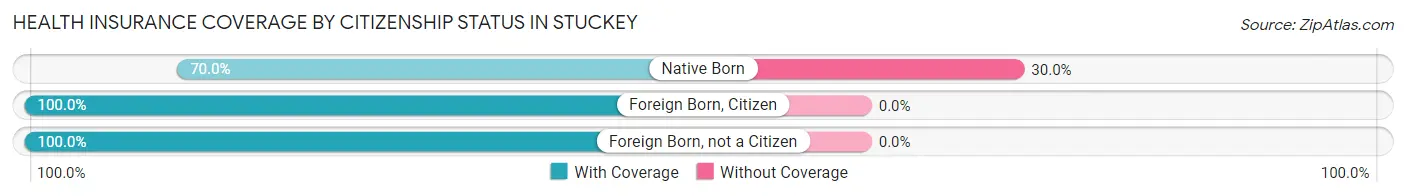
| Citizenship Status | With Coverage | Without Coverage |
| Native Born | 7 (70.0%) | 3 (30.0%) |
| Foreign Born, Citizen | 8 (100.0%) | 0 (0.0%) |
| Foreign Born, not a Citizen | 10 (100.0%) | 0 (0.0%) |
Health Insurance Coverage by Household Income in Stuckey
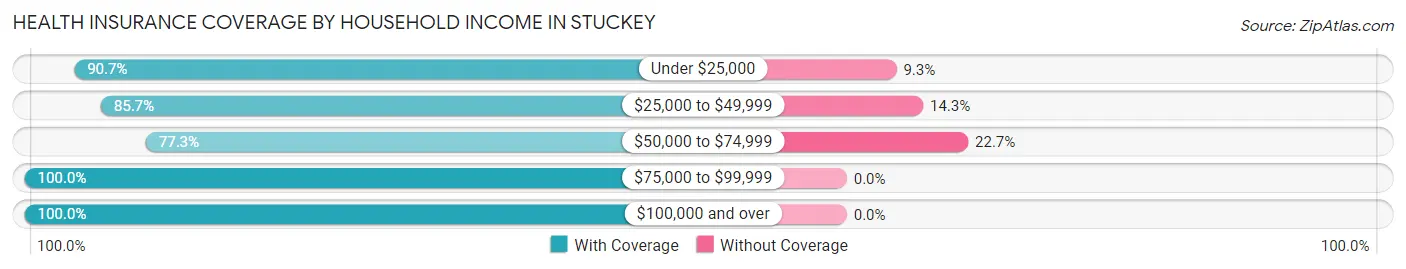
| Household Income | With Coverage | Without Coverage |
| Under $25,000 | 39 (90.7%) | 4 (9.3%) |
| $25,000 to $49,999 | 48 (85.7%) | 8 (14.3%) |
| $50,000 to $74,999 | 34 (77.3%) | 10 (22.7%) |
| $75,000 to $99,999 | 7 (100.0%) | 0 (0.0%) |
| $100,000 and over | 93 (100.0%) | 0 (0.0%) |
Public vs Private Health Insurance Coverage by Age in Stuckey
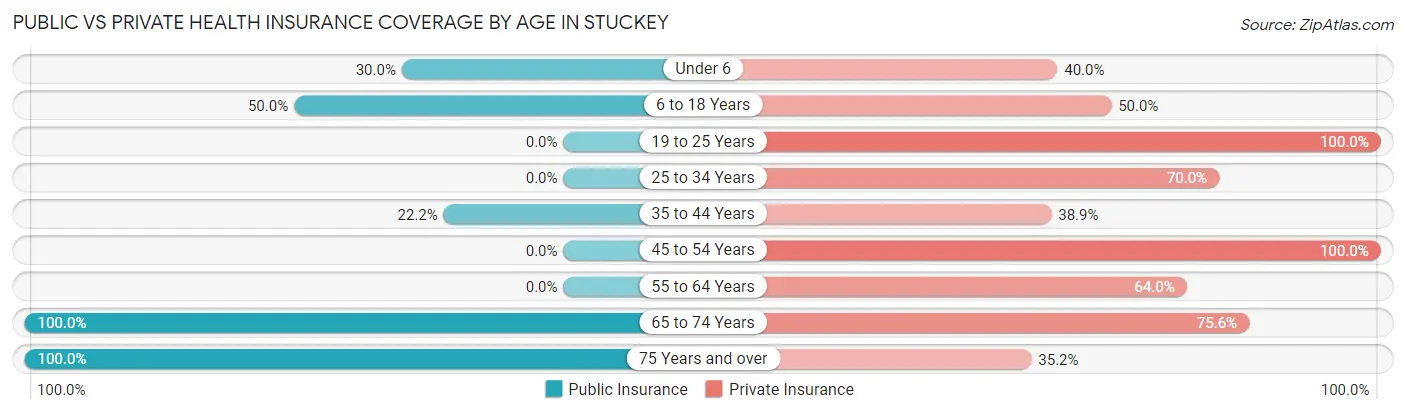
| Age Bracket | Public Insurance | Private Insurance |
| Under 6 | 3 (30.0%) | 4 (40.0%) |
| 6 to 18 Years | 4 (50.0%) | 4 (50.0%) |
| 19 to 25 Years | 0 (0.0%) | 10 (100.0%) |
| 25 to 34 Years | 0 (0.0%) | 7 (70.0%) |
| 35 to 44 Years | 4 (22.2%) | 7 (38.9%) |
| 45 to 54 Years | 0 (0.0%) | 9 (100.0%) |
| 55 to 64 Years | 0 (0.0%) | 16 (64.0%) |
| 65 to 74 Years | 45 (100.0%) | 34 (75.6%) |
| 75 Years and over | 108 (100.0%) | 38 (35.2%) |
| Total | 164 (67.5%) | 129 (53.1%) |
Disability Status by Sex by Age in Stuckey
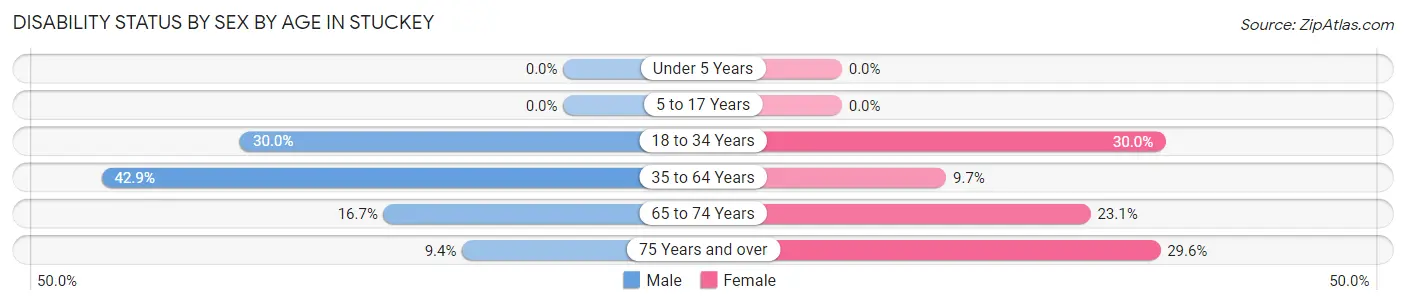
| Age Bracket | Male | Female |
| Under 5 Years | 0 (0.0%) | 0 (0.0%) |
| 5 to 17 Years | 0 (0.0%) | 0 (0.0%) |
| 18 to 34 Years | 3 (30.0%) | 3 (30.0%) |
| 35 to 64 Years | 9 (42.9%) | 3 (9.7%) |
| 65 to 74 Years | 1 (16.7%) | 9 (23.1%) |
| 75 Years and over | 6 (9.4%) | 13 (29.5%) |
Disability Class by Sex by Age in Stuckey
Disability Class: Hearing Difficulty
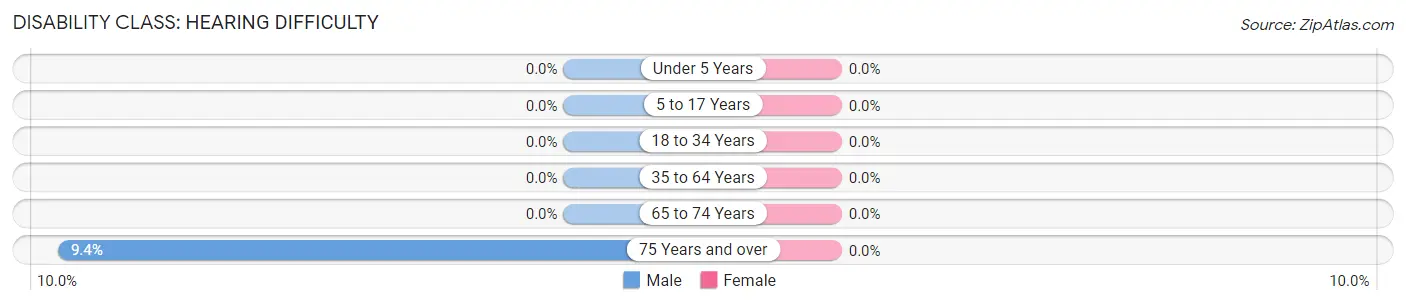
| Age Bracket | Male | Female |
| Under 5 Years | 0 (0.0%) | 0 (0.0%) |
| 5 to 17 Years | 0 (0.0%) | 0 (0.0%) |
| 18 to 34 Years | 0 (0.0%) | 0 (0.0%) |
| 35 to 64 Years | 0 (0.0%) | 0 (0.0%) |
| 65 to 74 Years | 0 (0.0%) | 0 (0.0%) |
| 75 Years and over | 6 (9.4%) | 0 (0.0%) |
Disability Class: Vision Difficulty
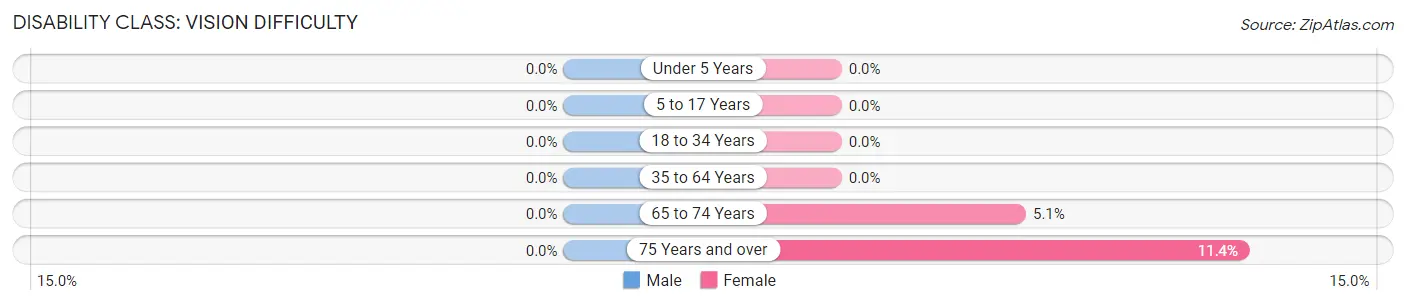
| Age Bracket | Male | Female |
| Under 5 Years | 0 (0.0%) | 0 (0.0%) |
| 5 to 17 Years | 0 (0.0%) | 0 (0.0%) |
| 18 to 34 Years | 0 (0.0%) | 0 (0.0%) |
| 35 to 64 Years | 0 (0.0%) | 0 (0.0%) |
| 65 to 74 Years | 0 (0.0%) | 2 (5.1%) |
| 75 Years and over | 0 (0.0%) | 5 (11.4%) |
Disability Class: Cognitive Difficulty
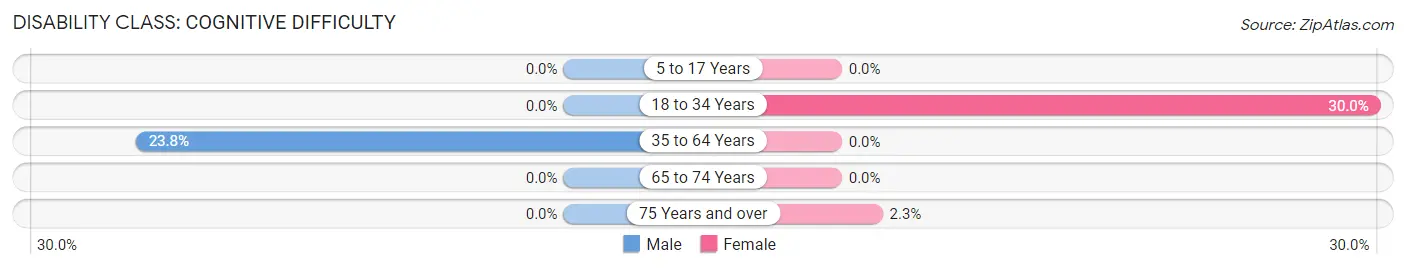
| Age Bracket | Male | Female |
| 5 to 17 Years | 0 (0.0%) | 0 (0.0%) |
| 18 to 34 Years | 0 (0.0%) | 3 (30.0%) |
| 35 to 64 Years | 5 (23.8%) | 0 (0.0%) |
| 65 to 74 Years | 0 (0.0%) | 0 (0.0%) |
| 75 Years and over | 0 (0.0%) | 1 (2.3%) |
Disability Class: Ambulatory Difficulty
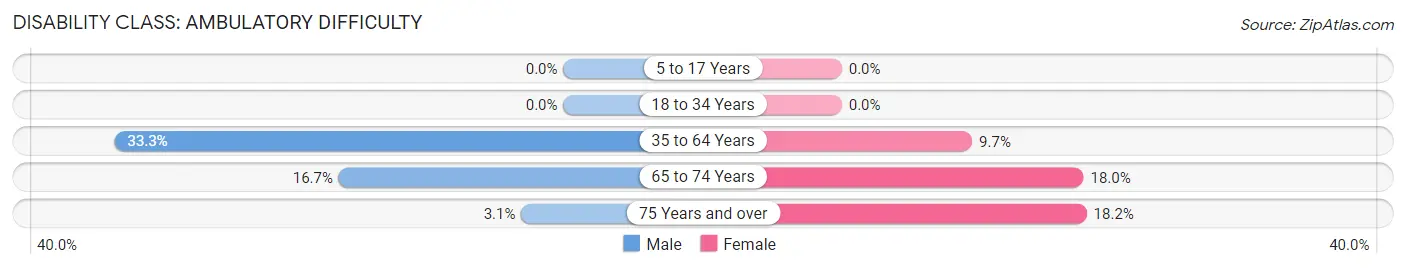
| Age Bracket | Male | Female |
| 5 to 17 Years | 0 (0.0%) | 0 (0.0%) |
| 18 to 34 Years | 0 (0.0%) | 0 (0.0%) |
| 35 to 64 Years | 7 (33.3%) | 3 (9.7%) |
| 65 to 74 Years | 1 (16.7%) | 7 (17.9%) |
| 75 Years and over | 2 (3.1%) | 8 (18.2%) |
Disability Class: Self-Care Difficulty
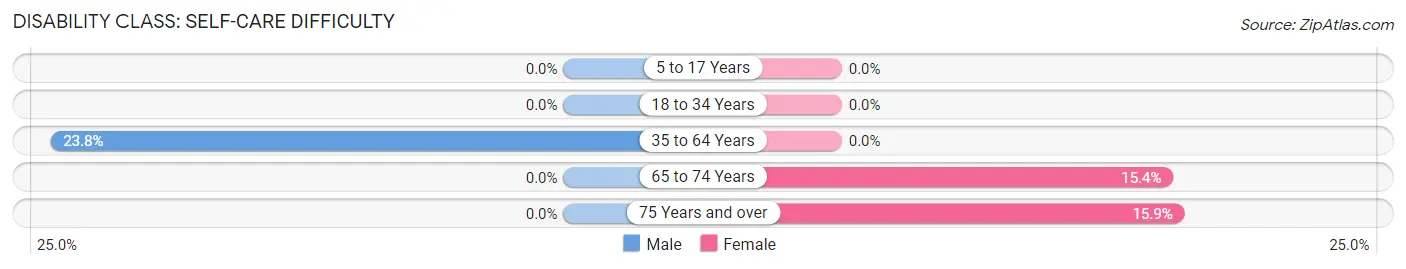
| Age Bracket | Male | Female |
| 5 to 17 Years | 0 (0.0%) | 0 (0.0%) |
| 18 to 34 Years | 0 (0.0%) | 0 (0.0%) |
| 35 to 64 Years | 5 (23.8%) | 0 (0.0%) |
| 65 to 74 Years | 0 (0.0%) | 6 (15.4%) |
| 75 Years and over | 0 (0.0%) | 7 (15.9%) |
Technology Access in Stuckey
Computing Device Access in Stuckey
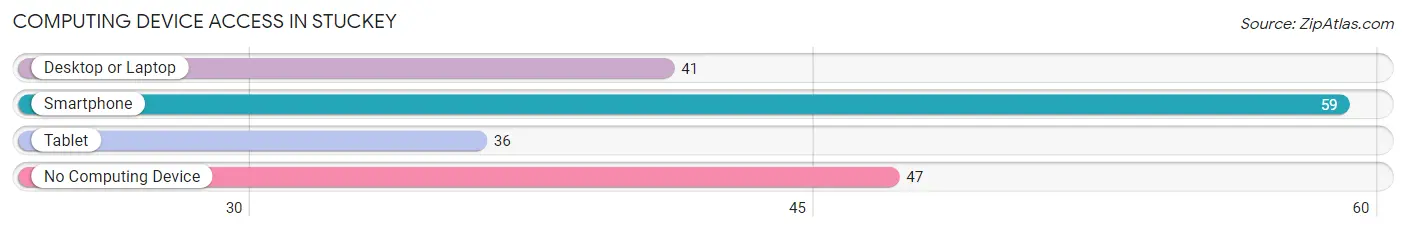
| Device Type | # Households | % Households |
| Desktop or Laptop | 41 | 36.9% |
| Smartphone | 59 | 53.1% |
| Tablet | 36 | 32.4% |
| No Computing Device | 47 | 42.3% |
| Total | 111 | 100.0% |
Internet Access in Stuckey
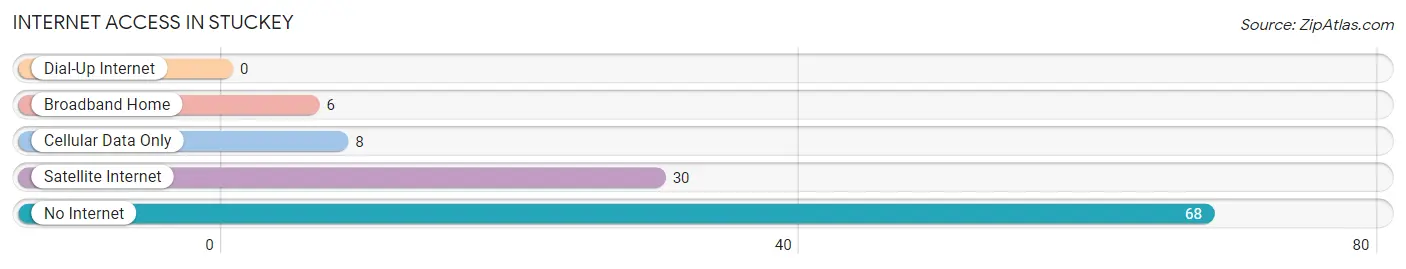
| Internet Type | # Households | % Households |
| Dial-Up Internet | 0 | 0.0% |
| Broadband Home | 6 | 5.4% |
| Cellular Data Only | 8 | 7.2% |
| Satellite Internet | 30 | 27.0% |
| No Internet | 68 | 61.3% |
| Total | 111 | 100.0% |
Stuckey Summary
Stuckey is a small unincorporated community located in the Pee Dee region of South Carolina. It is situated in Florence County, approximately 20 miles east of Florence and 30 miles west of Myrtle Beach. The population of Stuckey was estimated to be around 500 in 2000.
History
Stuckey was founded in the late 1800s by a man named William Stuckey. He was a farmer and a blacksmith who moved to the area from North Carolina. He built a small store and a post office, which served as the center of the community. The store was a popular gathering place for locals and travelers alike.
The town grew slowly over the years, and by the early 1900s, it had become a thriving community. It had a school, a church, a cotton gin, and several other businesses. The town was also home to a number of African-American families who worked in the local cotton fields.
In the 1950s, Stuckey began to decline as the cotton industry moved away from the area. The town’s population dwindled and many of the businesses closed. In the late 1990s, the town was revitalized with the opening of a new grocery store and a gas station.
Geography
Stuckey is located in the Pee Dee region of South Carolina, which is known for its flat terrain and sandy soil. The town is situated in Florence County, approximately 20 miles east of Florence and 30 miles west of Myrtle Beach.
The town is surrounded by farmland and is bordered by the Great Pee Dee River to the east. The town is also located near the Francis Marion National Forest, which is a popular destination for outdoor recreation.
Economy
The economy of Stuckey is largely based on agriculture. The town is home to several farms that produce cotton, soybeans, corn, and other crops. The town also has a few small businesses, including a grocery store, a gas station, and a few restaurants.
Demographics
The population of Stuckey was estimated to be around 500 in 2000. The town is predominantly white, with a small African-American population. The median household income in Stuckey is around $30,000, which is lower than the state average.
Conclusion
Stuckey is a small unincorporated community located in the Pee Dee region of South Carolina. It was founded in the late 1800s by a man named William Stuckey and has since grown into a thriving community. The town’s economy is largely based on agriculture, and the population is predominantly white. Stuckey is a great place to live and work, and it is a great example of the rural South.
Common Questions
What is Per Capita Income in Stuckey?
Per Capita income in Stuckey is $40,646.
What is Income or Wage Gap in Stuckey?
Income or Wage Gap in Stuckey is 51.7%.
Women in Stuckey earn 48.3 cents for every dollar earned by a man.
What is Inequality or Gini Index in Stuckey?
Inequality or Gini Index in Stuckey is 0.54.
What is the Total Population of Stuckey?
Total Population of Stuckey is 243.
What is the Total Male Population of Stuckey?
Total Male Population of Stuckey is 111.
What is the Total Female Population of Stuckey?
Total Female Population of Stuckey is 132.
What is the Ratio of Males per 100 Females in Stuckey?
There are 84.09 Males per 100 Females in Stuckey.
What is the Ratio of Females per 100 Males in Stuckey?
There are 118.92 Females per 100 Males in Stuckey.
What is the Median Population Age in Stuckey?
Median Population Age in Stuckey is 71.7 Years.
What is the Average Family Size in Stuckey
Average Family Size in Stuckey is 2.8 People.
What is the Average Household Size in Stuckey
Average Household Size in Stuckey is 2.2 People.
How Large is the Labor Force in Stuckey?
There are 129 People in the Labor Forcein in Stuckey.
What is the Percentage of People in the Labor Force in Stuckey?
57.3% of People are in the Labor Force in Stuckey.
What is the Unemployment Rate in Stuckey?
Unemployment Rate in Stuckey is 10.9%.