Zip Codes with the Highest Percentage of Population with a Degree in Education in Seneca, SC
RELATED REPORTS & OPTIONS
Education
Seneca
Compare Zip Codes
Map of Zip Codes with the Highest Percentage of Population with a Degree in Education in Seneca
14.7%
15.7%
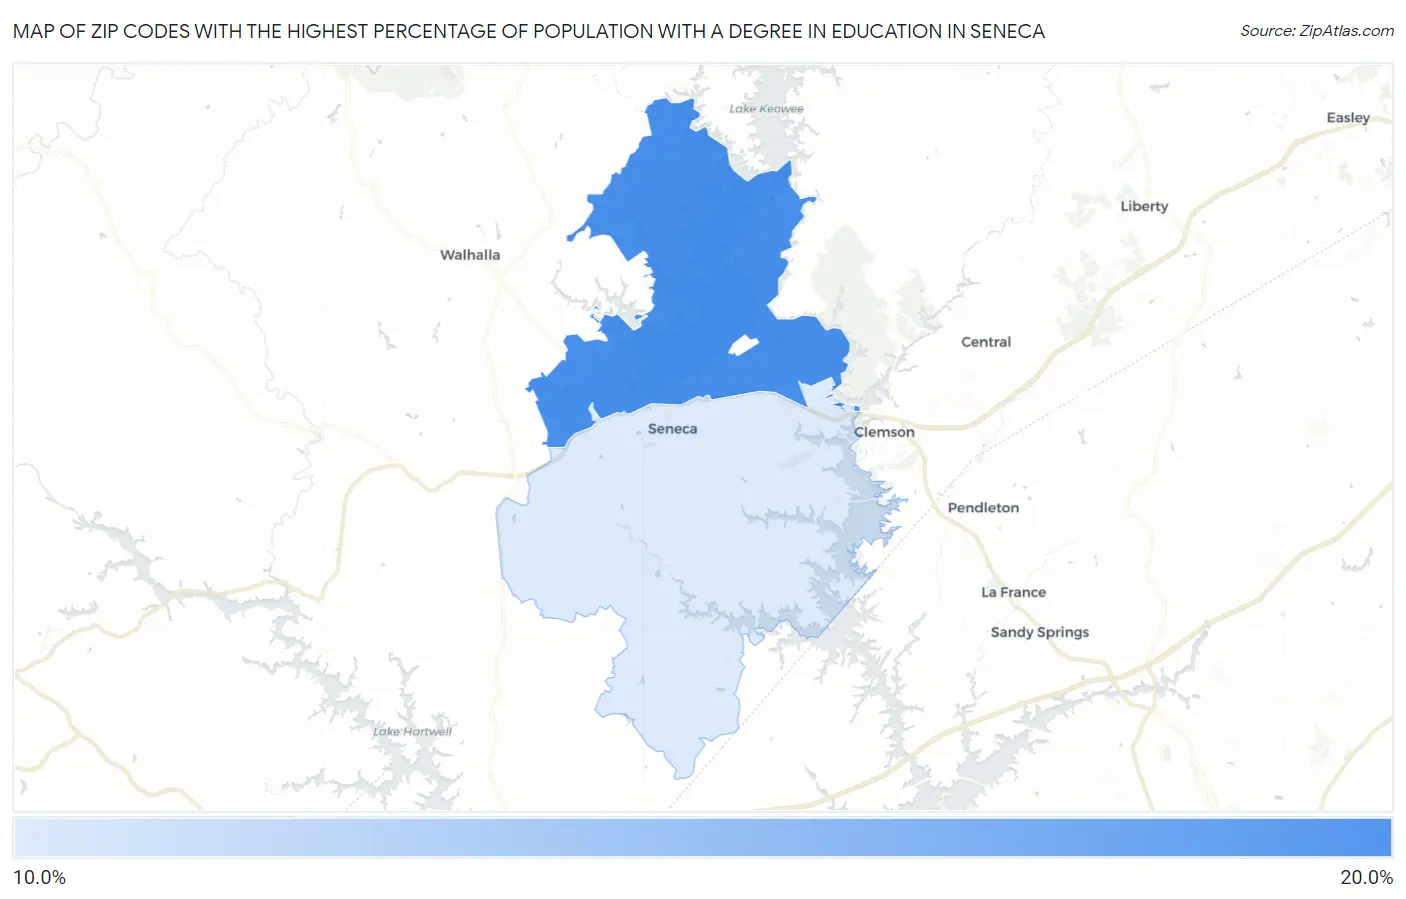
Zip Codes with the Highest Percentage of Population with a Degree in Education in Seneca, SC
| Zip Code | % Graduates | vs State | vs National | |
| 1. | 29672 | 15.7% | 13.7%(+2.07)#202 | 11.1%(+4.69)#14,820 |
| 2. | 29678 | 14.7% | 13.7%(+0.975)#229 | 11.1%(+3.60)#16,141 |
1
Common Questions
What are the Top Zip Codes with the Highest Percentage of Population with a Degree in Education in Seneca, SC?
Top Zip Codes with the Highest Percentage of Population with a Degree in Education in Seneca, SC are:
What zip code has the Highest Percentage of Population with a Degree in Education in Seneca, SC?
29672 has the Highest Percentage of Population with a Degree in Education in Seneca, SC with 15.7%.
What is the Percentage of Population with a Degree in Education in Seneca, SC?
Percentage of Population with a Degree in Education in Seneca is 18.5%.
What is the Percentage of Population with a Degree in Education in South Carolina?
Percentage of Population with a Degree in Education in South Carolina is 13.7%.
What is the Percentage of Population with a Degree in Education in the United States?
Percentage of Population with a Degree in Education in the United States is 11.1%.