Zip Codes with the Highest Percentage of Population Employed in Office & Administration in Fort Mill, SC
RELATED REPORTS & OPTIONS
Office & Administration
Fort Mill
Compare Zip Codes
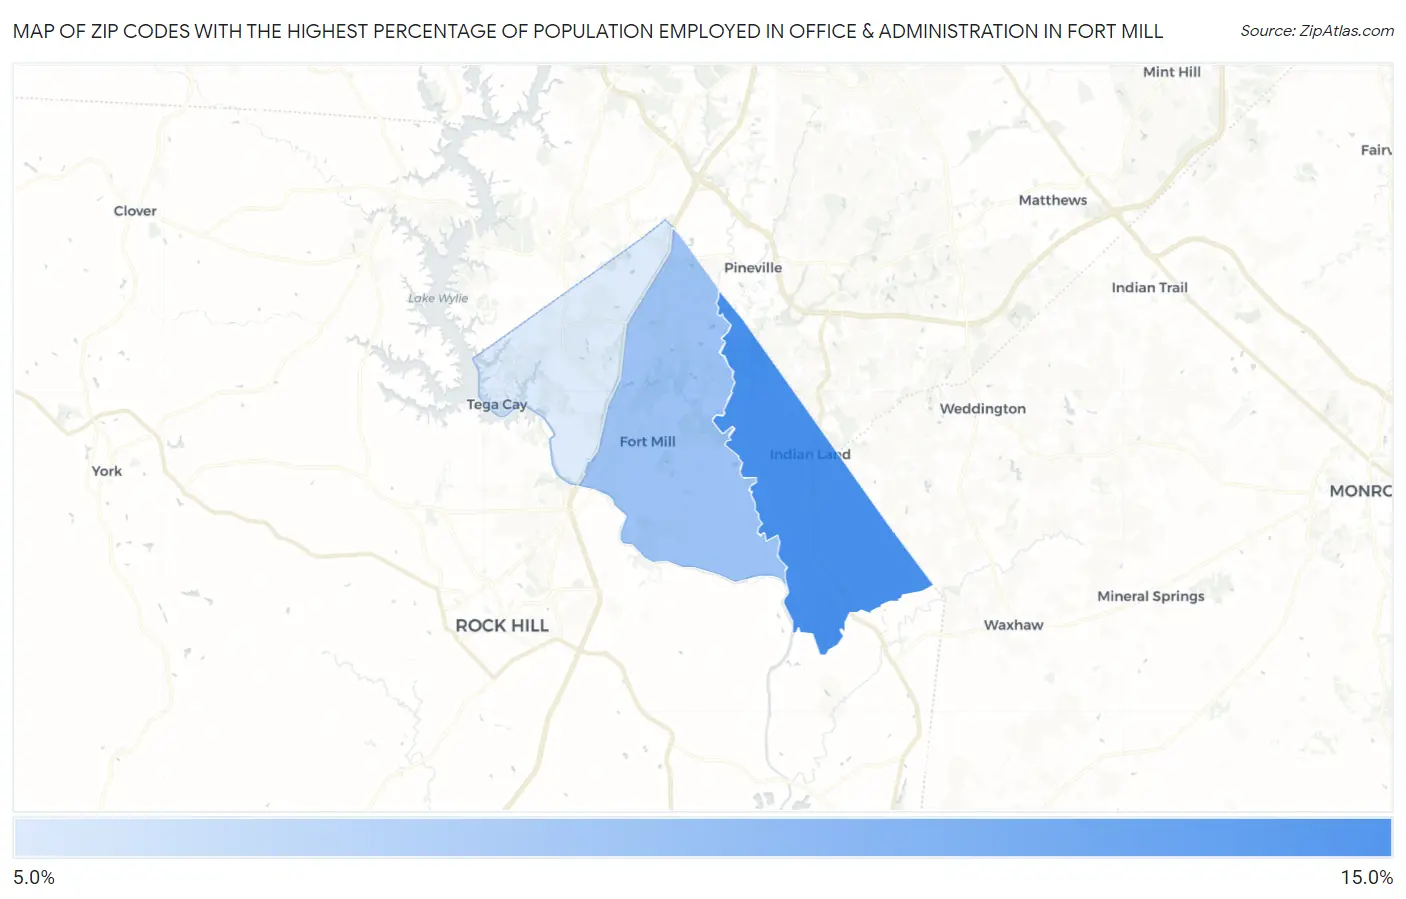
Map of Zip Codes with the Highest Percentage of Population Employed in Office & Administration in Fort Mill
7.8%
13.8%
Zip Codes with the Highest Percentage of Population Employed in Office & Administration in Fort Mill, SC
| Zip Code | % Employed | vs State | vs National | |
| 1. | 29707 | 13.8% | 10.7%(+3.15)#71 | 10.9%(+2.94)#6,367 |
| 2. | 29715 | 10.4% | 10.7%(-0.248)#183 | 10.9%(-0.452)#15,809 |
| 3. | 29708 | 7.8% | 10.7%(-2.87)#304 | 10.9%(-3.08)#23,518 |
1
Common Questions
What are the Top Zip Codes with the Highest Percentage of Population Employed in Office & Administration in Fort Mill, SC?
Top Zip Codes with the Highest Percentage of Population Employed in Office & Administration in Fort Mill, SC are:
What zip code has the Highest Percentage of Population Employed in Office & Administration in Fort Mill, SC?
29707 has the Highest Percentage of Population Employed in Office & Administration in Fort Mill, SC with 13.8%.
What is the Percentage of Population Employed in Office & Administration in Fort Mill, SC?
Percentage of Population Employed in Office & Administration in Fort Mill is 11.2%.
What is the Percentage of Population Employed in Office & Administration in South Carolina?
Percentage of Population Employed in Office & Administration in South Carolina is 10.7%.
What is the Percentage of Population Employed in Office & Administration in the United States?
Percentage of Population Employed in Office & Administration in the United States is 10.9%.