Zip Codes with the Highest Percentage of Population Employed in Office & Administration in Greenwood, SC
RELATED REPORTS & OPTIONS
Office & Administration
Greenwood
Compare Zip Codes
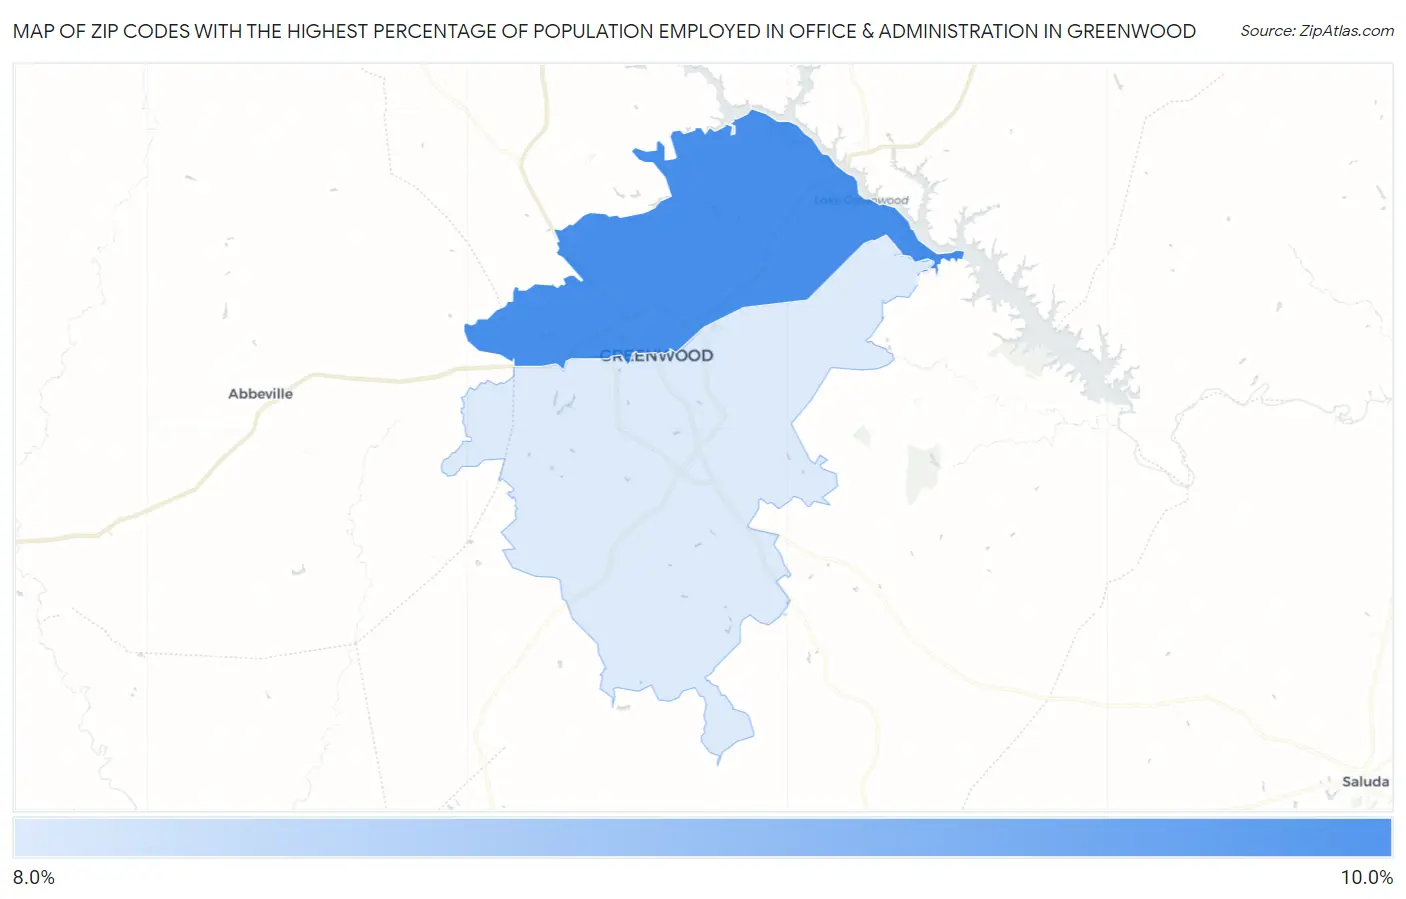
Map of Zip Codes with the Highest Percentage of Population Employed in Office & Administration in Greenwood
8.3%
9.1%
Zip Codes with the Highest Percentage of Population Employed in Office & Administration in Greenwood, SC
| Zip Code | % Employed | vs State | vs National | |
| 1. | 29649 | 9.1% | 10.7%(-1.53)#239 | 10.9%(-1.73)#19,854 |
| 2. | 29646 | 8.3% | 10.7%(-2.39)#285 | 10.9%(-2.59)#22,332 |
1
Common Questions
What are the Top Zip Codes with the Highest Percentage of Population Employed in Office & Administration in Greenwood, SC?
Top Zip Codes with the Highest Percentage of Population Employed in Office & Administration in Greenwood, SC are:
What zip code has the Highest Percentage of Population Employed in Office & Administration in Greenwood, SC?
29649 has the Highest Percentage of Population Employed in Office & Administration in Greenwood, SC with 9.1%.
What is the Percentage of Population Employed in Office & Administration in Greenwood, SC?
Percentage of Population Employed in Office & Administration in Greenwood is 9.3%.
What is the Percentage of Population Employed in Office & Administration in South Carolina?
Percentage of Population Employed in Office & Administration in South Carolina is 10.7%.
What is the Percentage of Population Employed in Office & Administration in the United States?
Percentage of Population Employed in Office & Administration in the United States is 10.9%.