Zip Codes with the Highest Percentage of Population Employed in Office & Administration in Summerville, SC
RELATED REPORTS & OPTIONS
Office & Administration
Summerville
Compare Zip Codes
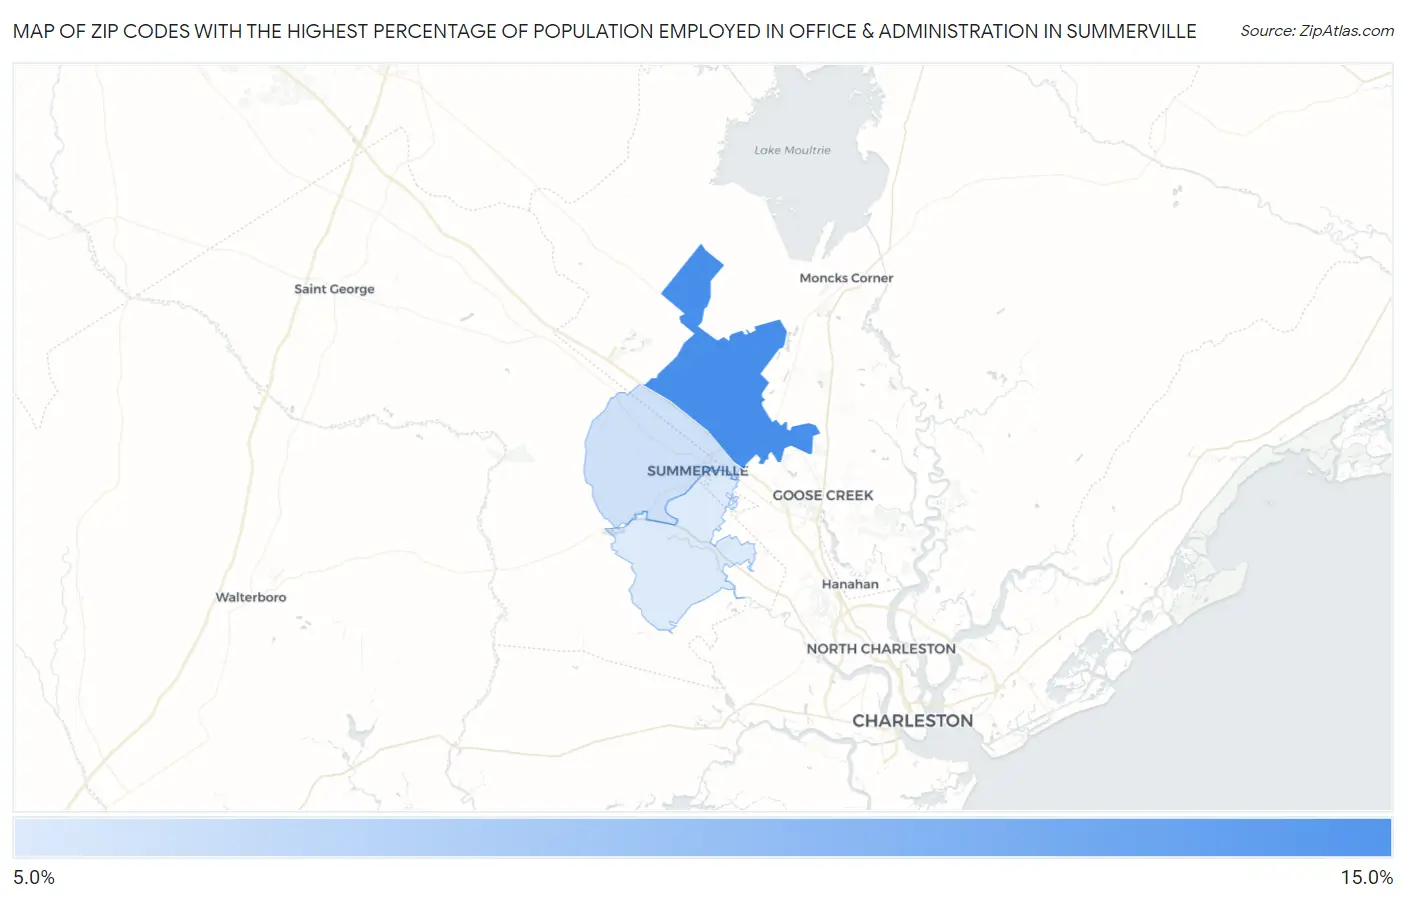
Map of Zip Codes with the Highest Percentage of Population Employed in Office & Administration in Summerville
11.7%
12.5%
Zip Codes with the Highest Percentage of Population Employed in Office & Administration in Summerville, SC
| Zip Code | % Employed | vs State | vs National | |
| 1. | 29486 | 12.5% | 10.7%(+1.84)#107 | 10.9%(+1.64)#9,306 |
| 2. | 29483 | 11.8% | 10.7%(+1.13)#133 | 10.9%(+0.929)#11,384 |
| 3. | 29485 | 11.7% | 10.7%(+1.07)#135 | 10.9%(+0.863)#11,574 |
1
Common Questions
What are the Top Zip Codes with the Highest Percentage of Population Employed in Office & Administration in Summerville, SC?
Top Zip Codes with the Highest Percentage of Population Employed in Office & Administration in Summerville, SC are:
What zip code has the Highest Percentage of Population Employed in Office & Administration in Summerville, SC?
29486 has the Highest Percentage of Population Employed in Office & Administration in Summerville, SC with 12.5%.
What is the Percentage of Population Employed in Office & Administration in Summerville, SC?
Percentage of Population Employed in Office & Administration in Summerville is 13.9%.
What is the Percentage of Population Employed in Office & Administration in South Carolina?
Percentage of Population Employed in Office & Administration in South Carolina is 10.7%.
What is the Percentage of Population Employed in Office & Administration in the United States?
Percentage of Population Employed in Office & Administration in the United States is 10.9%.