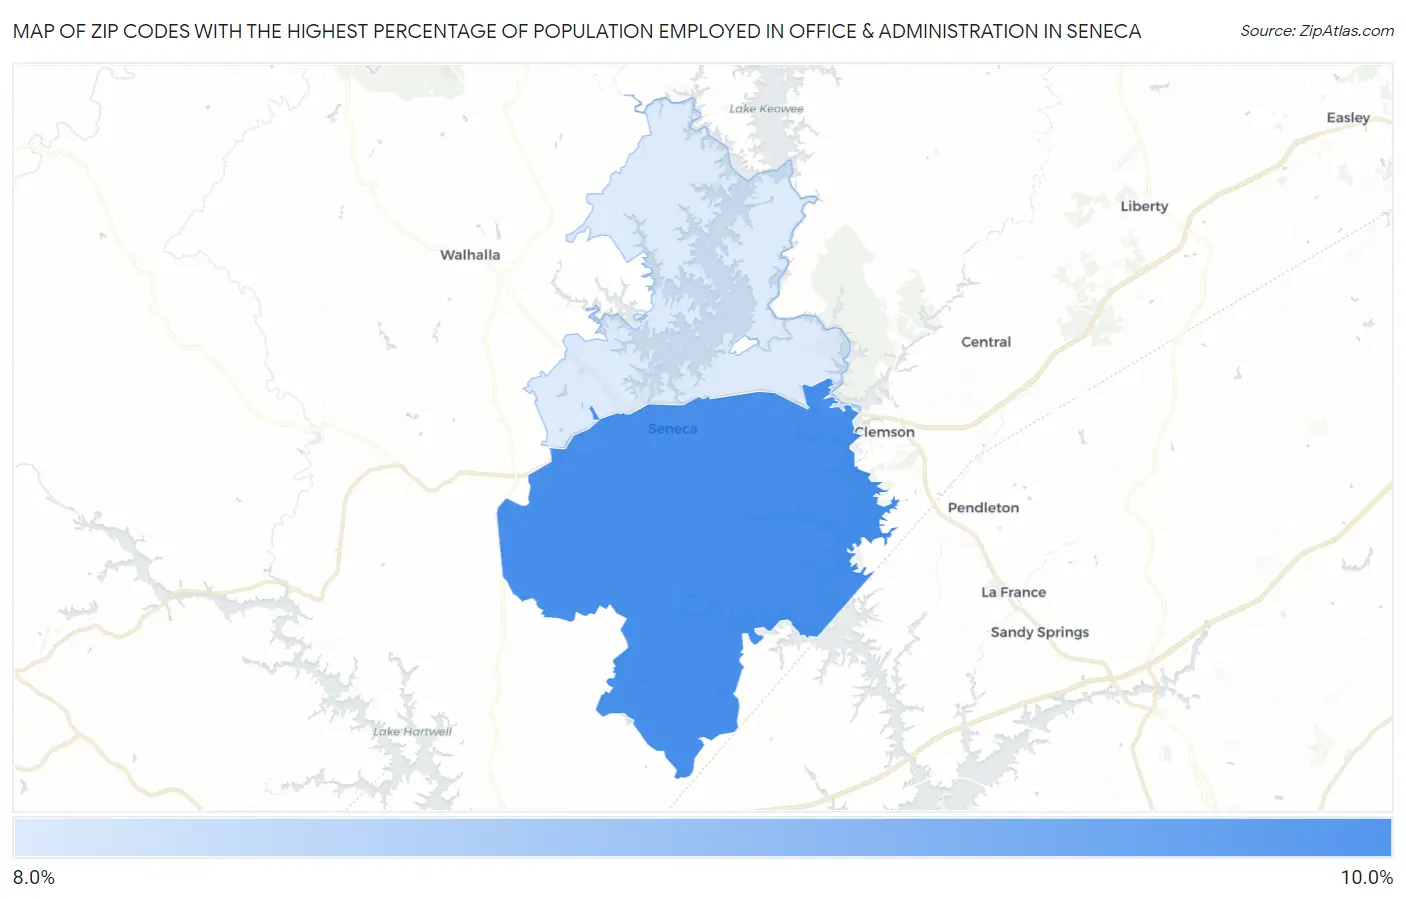
Zip Codes with the Highest Percentage of Population Employed in Office & Administration in Seneca, SC
RELATED REPORTS & OPTIONS
Office & Administration
Seneca
Compare Zip Codes
Map of Zip Codes with the Highest Percentage of Population Employed in Office & Administration in Seneca
8.2%
10.0%
Zip Codes with the Highest Percentage of Population Employed in Office & Administration in Seneca, SC
| Zip Code | % Employed | vs State | vs National | |
| 1. | 29678 | 10.0% | 10.7%(-0.691)#196 | 10.9%(-0.895)#17,251 |
| 2. | 29672 | 8.2% | 10.7%(-2.44)#288 | 10.9%(-2.64)#22,474 |
1
Common Questions
What are the Top Zip Codes with the Highest Percentage of Population Employed in Office & Administration in Seneca, SC?
Top Zip Codes with the Highest Percentage of Population Employed in Office & Administration in Seneca, SC are:
What zip code has the Highest Percentage of Population Employed in Office & Administration in Seneca, SC?
29678 has the Highest Percentage of Population Employed in Office & Administration in Seneca, SC with 10.0%.
What is the Percentage of Population Employed in Office & Administration in Seneca, SC?
Percentage of Population Employed in Office & Administration in Seneca is 10.8%.
What is the Percentage of Population Employed in Office & Administration in South Carolina?
Percentage of Population Employed in Office & Administration in South Carolina is 10.7%.
What is the Percentage of Population Employed in Office & Administration in the United States?
Percentage of Population Employed in Office & Administration in the United States is 10.9%.