Zip Codes with the Highest Percentage of Population Employed in Office & Administration in Charleston, SC
RELATED REPORTS & OPTIONS
Office & Administration
Charleston
Compare Zip Codes
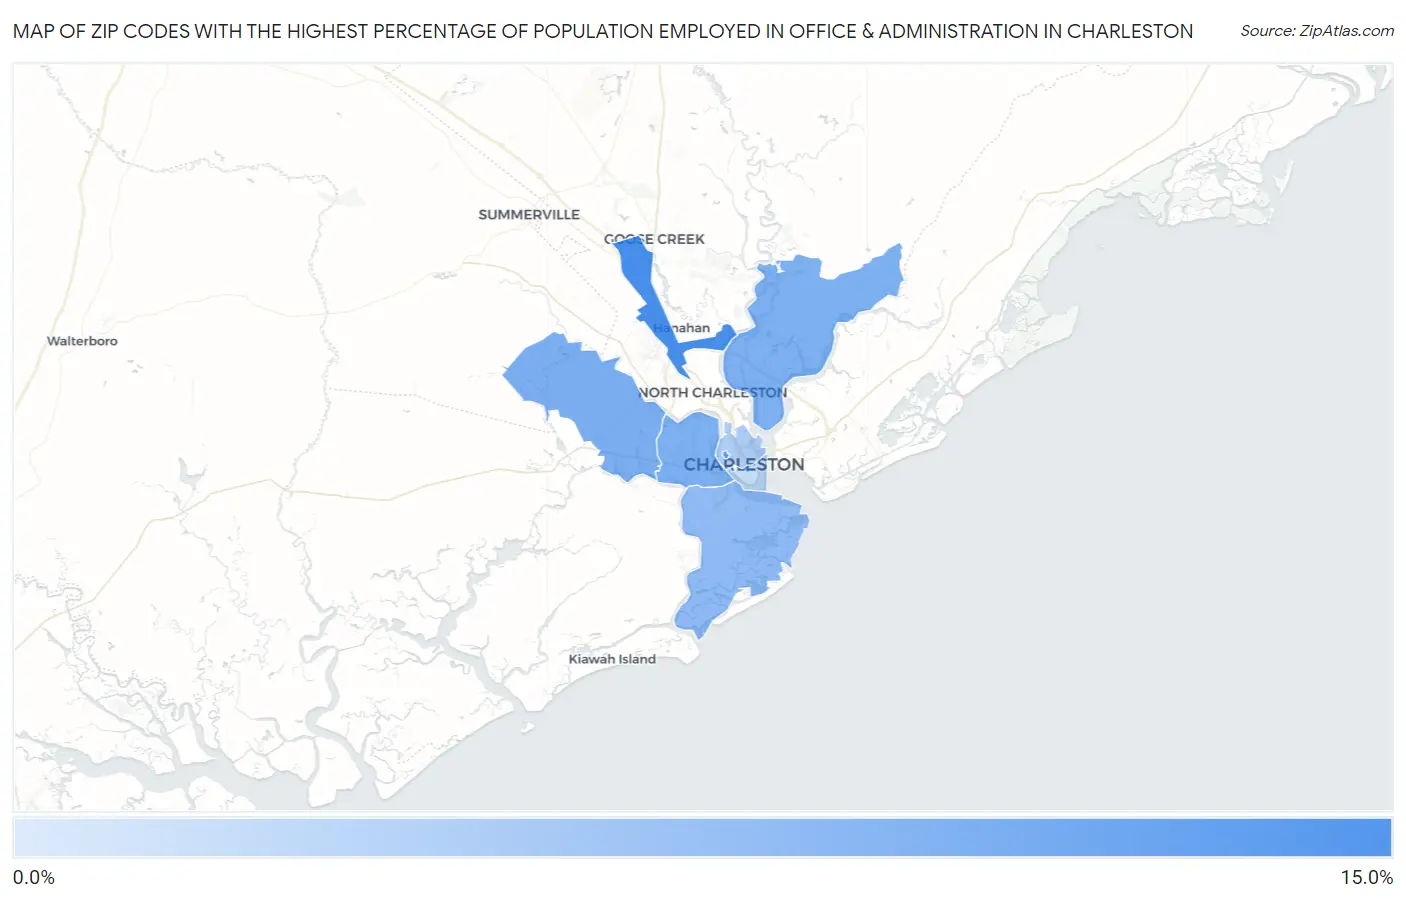
Map of Zip Codes with the Highest Percentage of Population Employed in Office & Administration in Charleston
4.4%
11.3%
Zip Codes with the Highest Percentage of Population Employed in Office & Administration in Charleston, SC
| Zip Code | % Employed | vs State | vs National | |
| 1. | 29406 | 11.3% | 10.7%(+0.601)#149 | 10.9%(+0.398)#13,037 |
| 2. | 29409 | 10.7% | 10.7%(+0.091)#172 | 10.9%(-0.113)#14,661 |
| 3. | 29414 | 8.8% | 10.7%(-1.82)#257 | 10.9%(-2.02)#20,741 |
| 4. | 29407 | 8.7% | 10.7%(-1.94)#264 | 10.9%(-2.14)#21,117 |
| 5. | 29492 | 8.7% | 10.7%(-1.94)#265 | 10.9%(-2.15)#21,123 |
| 6. | 29412 | 7.9% | 10.7%(-2.74)#298 | 10.9%(-2.94)#23,223 |
| 7. | 29403 | 6.5% | 10.7%(-4.16)#347 | 10.9%(-4.36)#26,114 |
| 8. | 29401 | 5.3% | 10.7%(-5.31)#363 | 10.9%(-5.51)#27,729 |
| 9. | 29424 | 4.4% | 10.7%(-6.29)#375 | 10.9%(-6.50)#28,702 |
1
Common Questions
What are the Top 5 Zip Codes with the Highest Percentage of Population Employed in Office & Administration in Charleston, SC?
Top 5 Zip Codes with the Highest Percentage of Population Employed in Office & Administration in Charleston, SC are:
What zip code has the Highest Percentage of Population Employed in Office & Administration in Charleston, SC?
29406 has the Highest Percentage of Population Employed in Office & Administration in Charleston, SC with 11.3%.
What is the Percentage of Population Employed in Office & Administration in Charleston, SC?
Percentage of Population Employed in Office & Administration in Charleston is 8.1%.
What is the Percentage of Population Employed in Office & Administration in South Carolina?
Percentage of Population Employed in Office & Administration in South Carolina is 10.7%.
What is the Percentage of Population Employed in Office & Administration in the United States?
Percentage of Population Employed in Office & Administration in the United States is 10.9%.