Ware Place, SC Map & Demographics
Ware Place Map
Ware Place Overview
$40,831
PER CAPITA INCOME
$97,500
AVG FAMILY INCOME
$88,542
AVG HOUSEHOLD INCOME
0.33
INEQUALITY / GINI INDEX
96
TOTAL POPULATION
37
MALE POPULATION
59
FEMALE POPULATION
62.71
MALES / 100 FEMALES
159.46
FEMALES / 100 MALES
70.9
MEDIAN AGE
2.6
AVG FAMILY SIZE
1.9
AVG HOUSEHOLD SIZE
49
LABOR FORCE [ PEOPLE ]
51.0%
PERCENT IN LABOR FORCE
Income in Ware Place
Income Overview in Ware Place
Per Capita Income in Ware Place is $40,831, while median incomes of families and households are $97,500 and $88,542 respectively.
| Characteristic | Number | Measure |
| Per Capita Income | 96 | $40,831 |
| Median Family Income | 28 | $97,500 |
| Mean Family Income | 28 | $107,714 |
| Median Household Income | 51 | $88,542 |
| Mean Household Income | 51 | $72,796 |
| Income Deficit | 28 | $0 |
| Wage / Income Gap (%) | 96 | 0.00% |
| Wage / Income Gap ($) | 96 | 100.00¢ per $1 |
| Gini / Inequality Index | 96 | 0.33 |
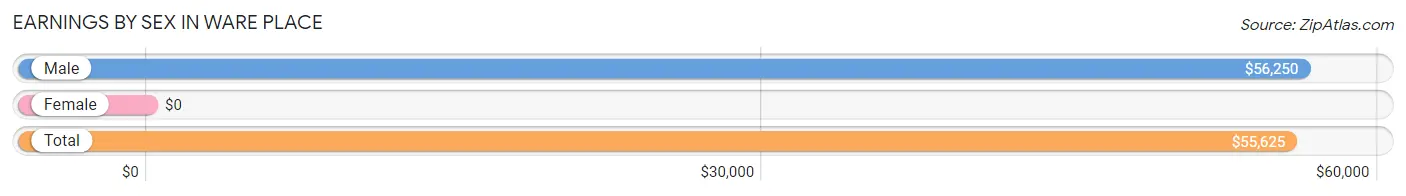
Earnings by Sex in Ware Place
| Sex | Number | Average Earnings |
| Male | 24 (49.0%) | $56,250 |
| Female | 25 (51.0%) | $0 |
| Total | 49 (100.0%) | $55,625 |
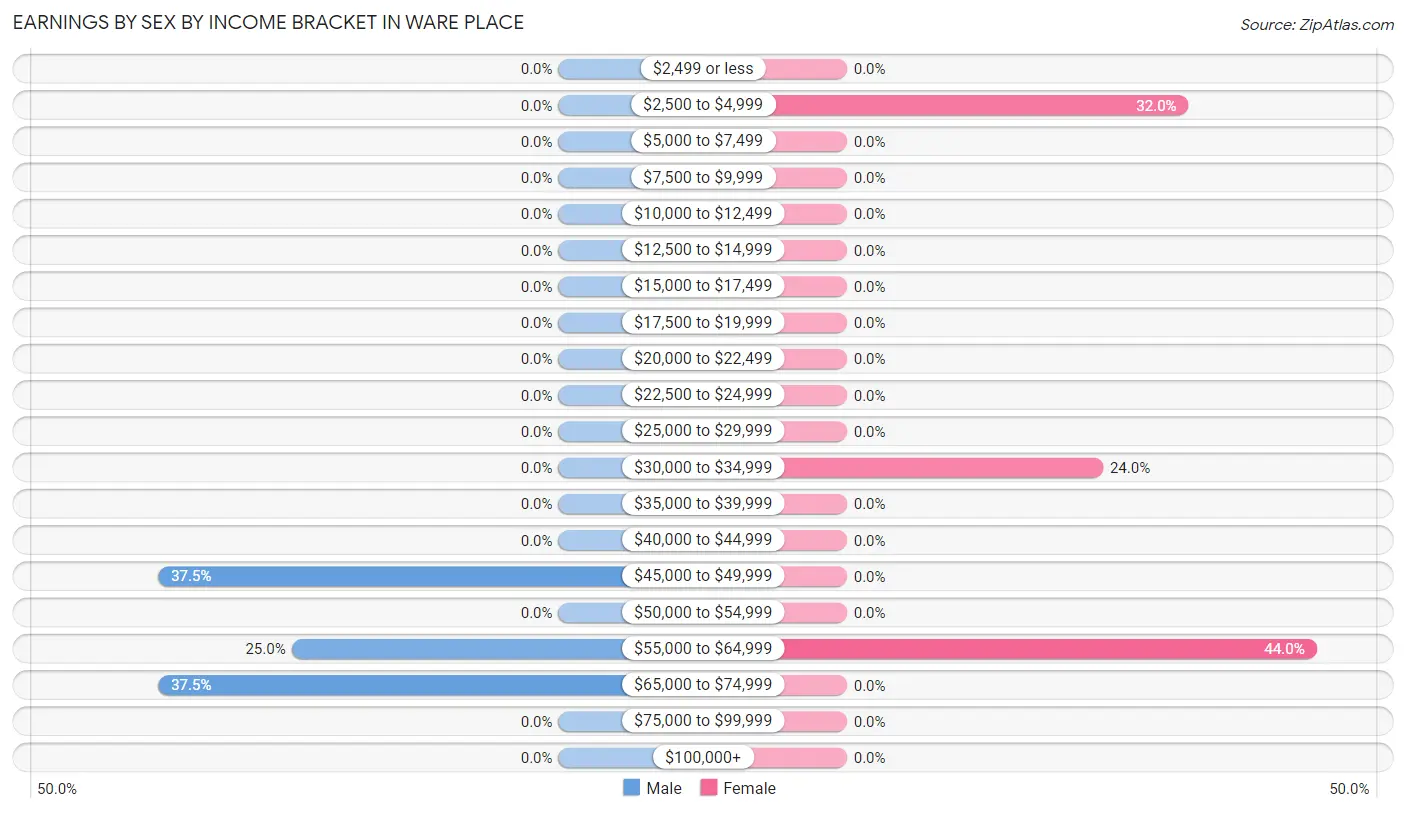
Earnings by Sex by Income Bracket in Ware Place
The most common earnings brackets in Ware Place are $45,000 to $49,999 for men (9 | 37.5%) and $55,000 to $64,999 for women (11 | 44.0%).
| Income | Male | Female |
| $2,499 or less | 0 (0.0%) | 0 (0.0%) |
| $2,500 to $4,999 | 0 (0.0%) | 8 (32.0%) |
| $5,000 to $7,499 | 0 (0.0%) | 0 (0.0%) |
| $7,500 to $9,999 | 0 (0.0%) | 0 (0.0%) |
| $10,000 to $12,499 | 0 (0.0%) | 0 (0.0%) |
| $12,500 to $14,999 | 0 (0.0%) | 0 (0.0%) |
| $15,000 to $17,499 | 0 (0.0%) | 0 (0.0%) |
| $17,500 to $19,999 | 0 (0.0%) | 0 (0.0%) |
| $20,000 to $22,499 | 0 (0.0%) | 0 (0.0%) |
| $22,500 to $24,999 | 0 (0.0%) | 0 (0.0%) |
| $25,000 to $29,999 | 0 (0.0%) | 0 (0.0%) |
| $30,000 to $34,999 | 0 (0.0%) | 6 (24.0%) |
| $35,000 to $39,999 | 0 (0.0%) | 0 (0.0%) |
| $40,000 to $44,999 | 0 (0.0%) | 0 (0.0%) |
| $45,000 to $49,999 | 9 (37.5%) | 0 (0.0%) |
| $50,000 to $54,999 | 0 (0.0%) | 0 (0.0%) |
| $55,000 to $64,999 | 6 (25.0%) | 11 (44.0%) |
| $65,000 to $74,999 | 9 (37.5%) | 0 (0.0%) |
| $75,000 to $99,999 | 0 (0.0%) | 0 (0.0%) |
| $100,000+ | 0 (0.0%) | 0 (0.0%) |
| Total | 24 (100.0%) | 25 (100.0%) |
Earnings by Sex by Educational Attainment in Ware Place
| Educational Attainment | Male Income | Female Income |
| Less than High School | - | - |
| High School Diploma | - | - |
| College or Associate's Degree | - | - |
| Bachelor's Degree | - | - |
| Graduate Degree | - | - |
| Total | $56,250 | $0 |
Family Income in Ware Place
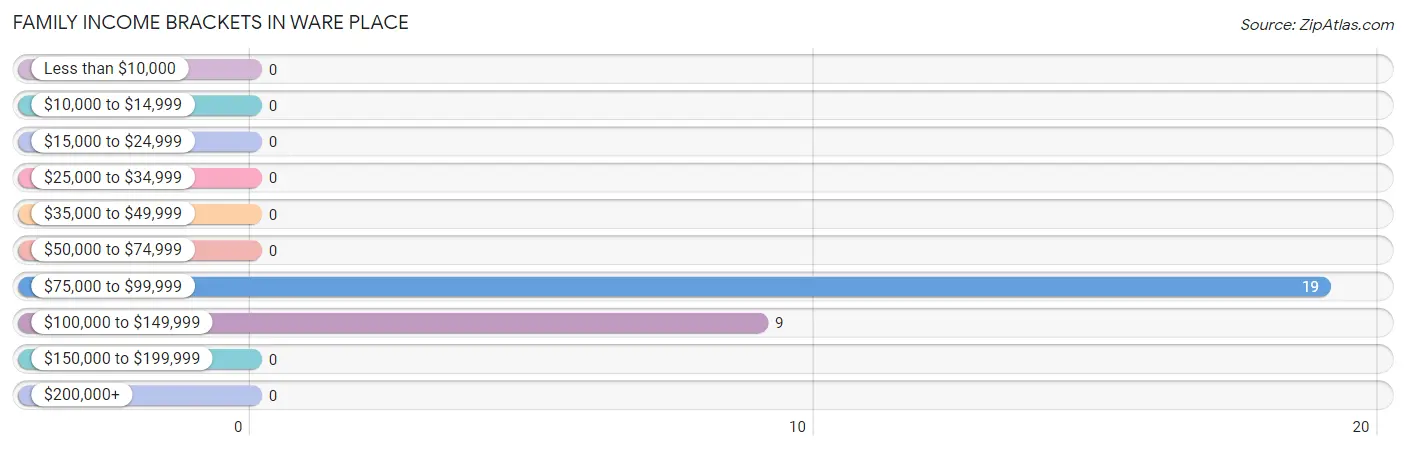
Family Income Brackets in Ware Place
According to the Ware Place family income data, there are 19 families falling into the $75,000 to $99,999 income range, which is the most common income bracket and makes up 67.9% of all families.
| Income Bracket | # Families | % Families |
| Less than $10,000 | 0 | 0.0% |
| $10,000 to $14,999 | 0 | 0.0% |
| $15,000 to $24,999 | 0 | 0.0% |
| $25,000 to $34,999 | 0 | 0.0% |
| $35,000 to $49,999 | 0 | 0.0% |
| $50,000 to $74,999 | 0 | 0.0% |
| $75,000 to $99,999 | 19 | 67.9% |
| $100,000 to $149,999 | 9 | 32.1% |
| $150,000 to $199,999 | 0 | 0.0% |
| $200,000+ | 0 | 0.0% |
Family Income by Famaliy Size in Ware Place
| Income Bracket | # Families | Median Income |
| 2-Person Families | 15 (53.6%) | $0 |
| 3-Person Families | 13 (46.4%) | $0 |
| 4-Person Families | 0 (0.0%) | $0 |
| 5-Person Families | 0 (0.0%) | $0 |
| 6-Person Families | 0 (0.0%) | $0 |
| 7+ Person Families | 0 (0.0%) | $0 |
| Total | 28 (100.0%) | $97,500 |
Family Income by Number of Earners in Ware Place
| Number of Earners | # Families | Median Income |
| No Earners | 5 (17.9%) | $0 |
| 1 Earner | 8 (28.6%) | $0 |
| 2 Earners | 15 (53.6%) | $0 |
| 3+ Earners | 0 (0.0%) | $0 |
| Total | 28 (100.0%) | $97,500 |
Household Income in Ware Place
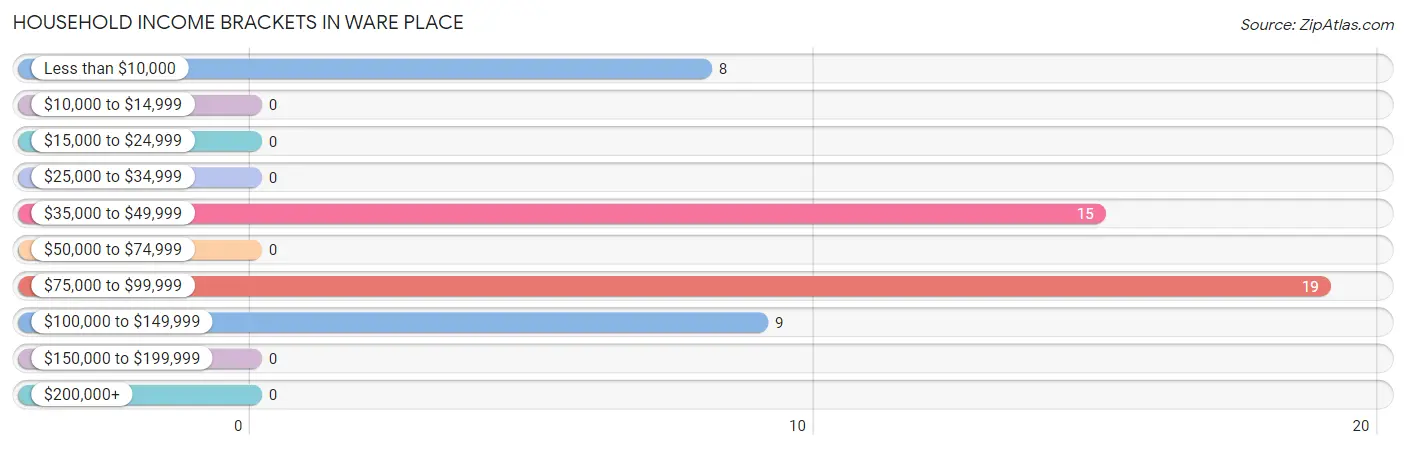
Household Income Brackets in Ware Place
With 19 households falling in the category, the $75,000 to $99,999 income range is the most frequent in Ware Place, accounting for 37.2% of all households.
| Income Bracket | # Households | % Households |
| Less than $10,000 | 8 | 15.7% |
| $10,000 to $14,999 | 0 | 0.0% |
| $15,000 to $24,999 | 0 | 0.0% |
| $25,000 to $34,999 | 0 | 0.0% |
| $35,000 to $49,999 | 15 | 29.4% |
| $50,000 to $74,999 | 0 | 0.0% |
| $75,000 to $99,999 | 19 | 37.3% |
| $100,000 to $149,999 | 9 | 17.6% |
| $150,000 to $199,999 | 0 | 0.0% |
| $200,000+ | 0 | 0.0% |
Household Income by Householder Age in Ware Place
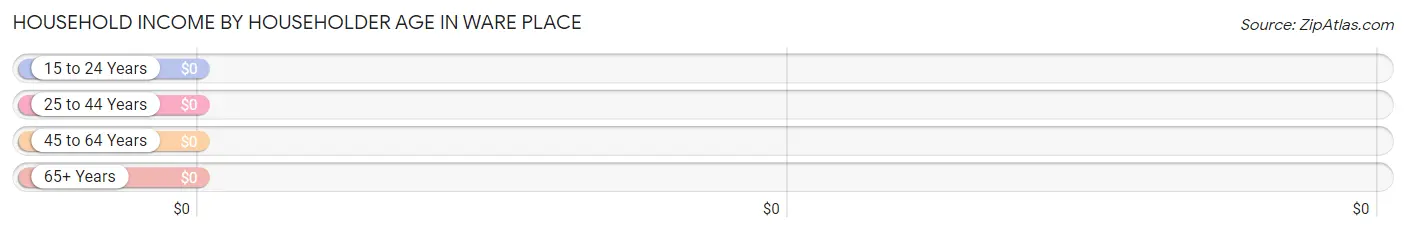
| Income Bracket | # Households | Median Income |
| 15 to 24 Years | 0 (0.0%) | $0 |
| 25 to 44 Years | 0 (0.0%) | $0 |
| 45 to 64 Years | 15 (29.4%) | $0 |
| 65+ Years | 36 (70.6%) | $0 |
| Total | 51 (100.0%) | $88,542 |
Poverty in Ware Place
Income Below Poverty by Sex and Age in Ware Place
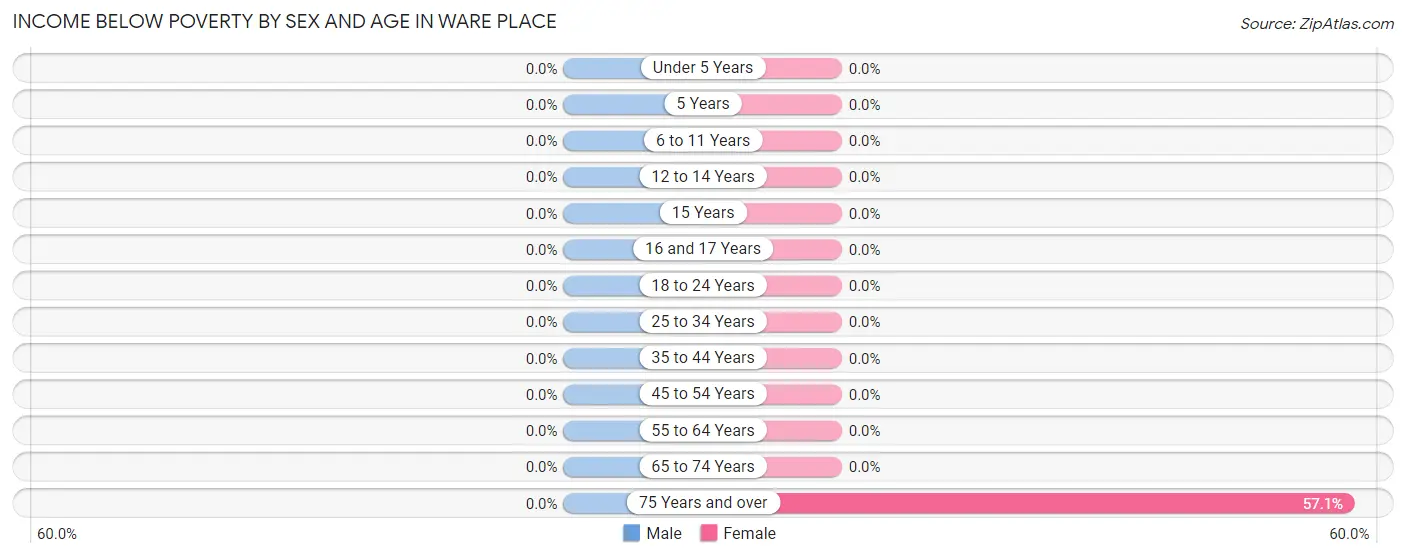
| Age Bracket | Male | Female |
| Under 5 Years | 0 (0.0%) | 0 (0.0%) |
| 5 Years | 0 (0.0%) | 0 (0.0%) |
| 6 to 11 Years | 0 (0.0%) | 0 (0.0%) |
| 12 to 14 Years | 0 (0.0%) | 0 (0.0%) |
| 15 Years | 0 (0.0%) | 0 (0.0%) |
| 16 and 17 Years | 0 (0.0%) | 0 (0.0%) |
| 18 to 24 Years | 0 (0.0%) | 0 (0.0%) |
| 25 to 34 Years | 0 (0.0%) | 0 (0.0%) |
| 35 to 44 Years | 0 (0.0%) | 0 (0.0%) |
| 45 to 54 Years | 0 (0.0%) | 0 (0.0%) |
| 55 to 64 Years | 0 (0.0%) | 0 (0.0%) |
| 65 to 74 Years | 0 (0.0%) | 0 (0.0%) |
| 75 Years and over | 0 (0.0%) | 8 (57.1%) |
| Total | 0 (0.0%) | 8 (13.6%) |
Income Above Poverty by Sex and Age in Ware Place
According to the poverty statistics in Ware Place, males aged 45 to 54 years and females aged 45 to 54 years are the age groups that are most secure financially, with 100.0% of males and 100.0% of females in these age groups living above the poverty line.
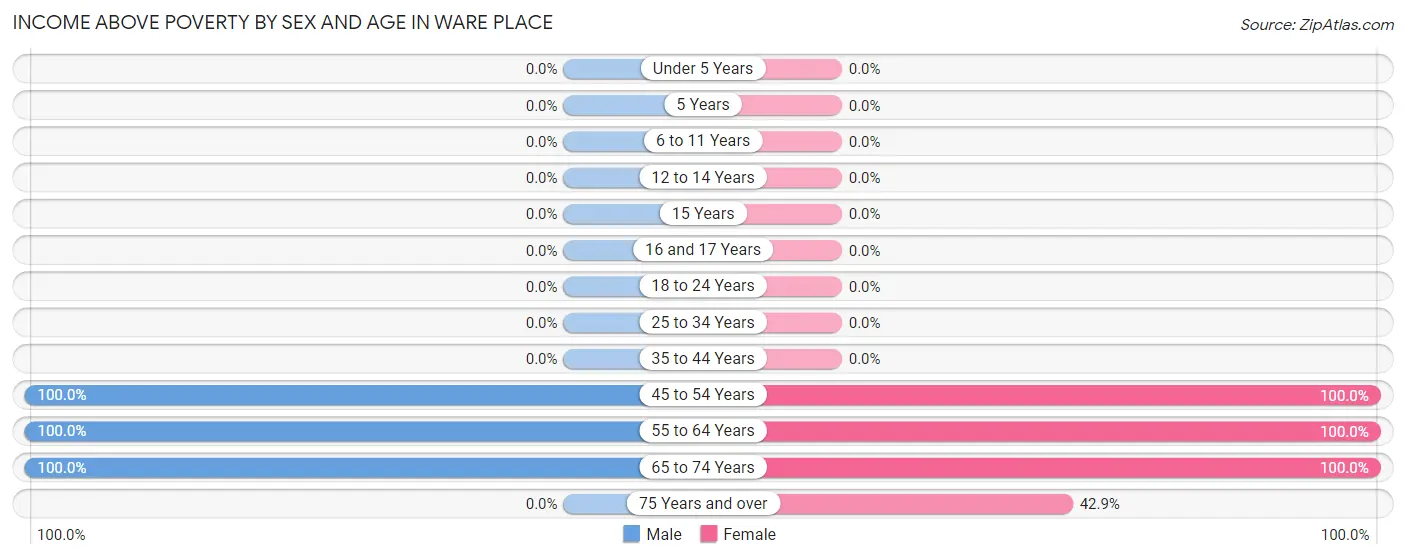
| Age Bracket | Male | Female |
| Under 5 Years | 0 (0.0%) | 0 (0.0%) |
| 5 Years | 0 (0.0%) | 0 (0.0%) |
| 6 to 11 Years | 0 (0.0%) | 0 (0.0%) |
| 12 to 14 Years | 0 (0.0%) | 0 (0.0%) |
| 15 Years | 0 (0.0%) | 0 (0.0%) |
| 16 and 17 Years | 0 (0.0%) | 0 (0.0%) |
| 18 to 24 Years | 0 (0.0%) | 0 (0.0%) |
| 25 to 34 Years | 0 (0.0%) | 0 (0.0%) |
| 35 to 44 Years | 0 (0.0%) | 0 (0.0%) |
| 45 to 54 Years | 15 (100.0%) | 6 (100.0%) |
| 55 to 64 Years | 9 (100.0%) | 11 (100.0%) |
| 65 to 74 Years | 13 (100.0%) | 28 (100.0%) |
| 75 Years and over | 0 (0.0%) | 6 (42.9%) |
| Total | 37 (100.0%) | 51 (86.4%) |
Income Below Poverty Among Married-Couple Families in Ware Place
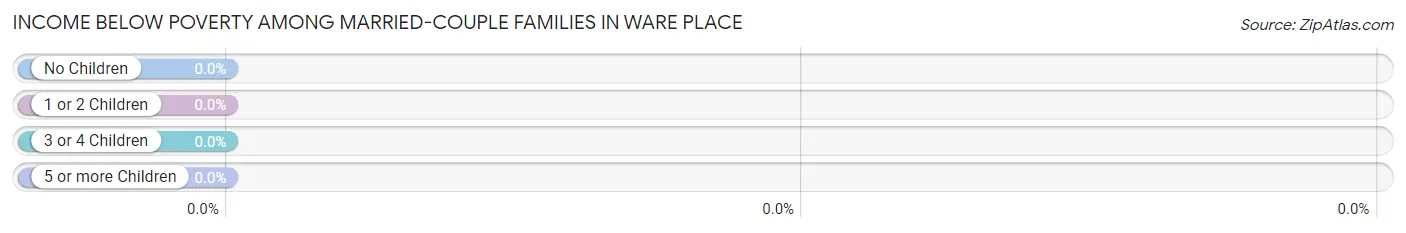
| Children | Above Poverty | Below Poverty |
| No Children | 28 (100.0%) | 0 (0.0%) |
| 1 or 2 Children | 0 (0.0%) | 0 (0.0%) |
| 3 or 4 Children | 0 (0.0%) | 0 (0.0%) |
| 5 or more Children | 0 (0.0%) | 0 (0.0%) |
| Total | 28 (100.0%) | 0 (0.0%) |
Income Below Poverty Among Single-Parent Households in Ware Place
| Children | Single Father | Single Mother |
| No Children | 0 (0.0%) | 0 (0.0%) |
| 1 or 2 Children | 0 (0.0%) | 0 (0.0%) |
| 3 or 4 Children | 0 (0.0%) | 0 (0.0%) |
| 5 or more Children | 0 (0.0%) | 0 (0.0%) |
| Total | 0 (0.0%) | 0 (0.0%) |
Income Below Poverty Among Married-Couple vs Single-Parent Households in Ware Place
| Children | Married-Couple Families | Single-Parent Households |
| No Children | 0 (0.0%) | 0 (0.0%) |
| 1 or 2 Children | 0 (0.0%) | 0 (0.0%) |
| 3 or 4 Children | 0 (0.0%) | 0 (0.0%) |
| 5 or more Children | 0 (0.0%) | 0 (0.0%) |
| Total | 0 (0.0%) | 0 (0.0%) |
Race in Ware Place
The most populous races in Ware Place are White / Caucasian (82 | 85.4%), and Black / African American (14 | 14.6%).
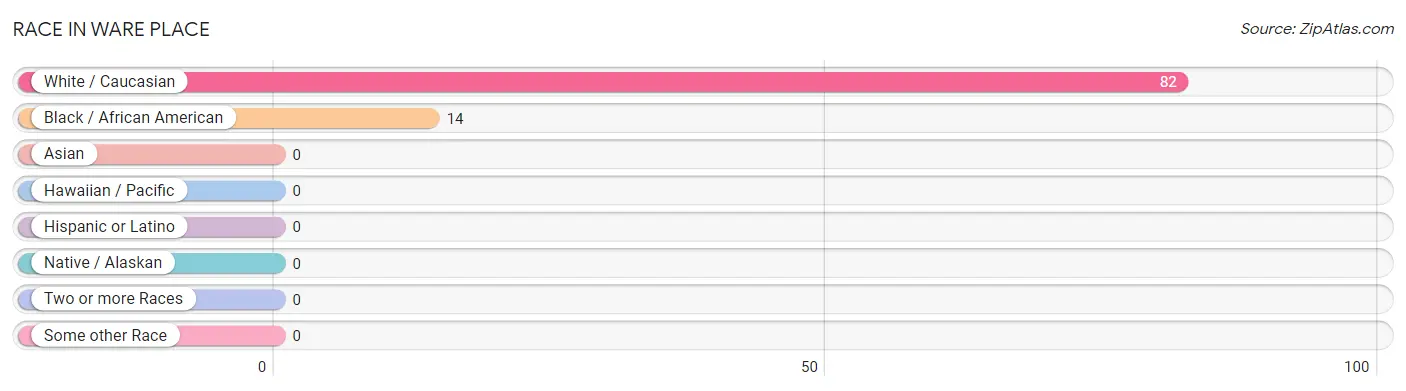
| Race | # Population | % Population |
| Asian | 0 | 0.0% |
| Black / African American | 14 | 14.6% |
| Hawaiian / Pacific | 0 | 0.0% |
| Hispanic or Latino | 0 | 0.0% |
| Native / Alaskan | 0 | 0.0% |
| White / Caucasian | 82 | 85.4% |
| Two or more Races | 0 | 0.0% |
| Some other Race | 0 | 0.0% |
| Total | 96 | 100.0% |
Ancestry in Ware Place
The most populous ancestries reported in Ware Place are English (20 | 20.8%), American (17 | 17.7%), Scandinavian (15 | 15.6%), French (8 | 8.3%), and German (8 | 8.3%), together accounting for 70.8% of all Ware Place residents.
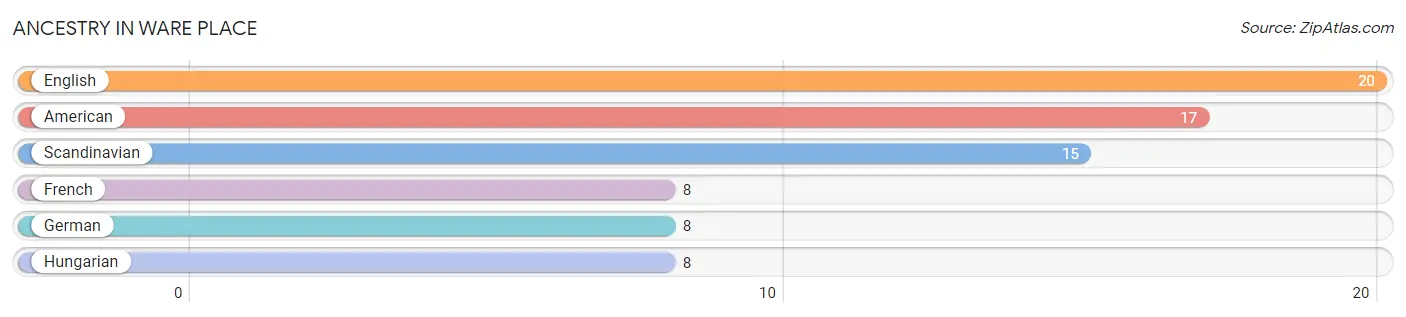
| Ancestry | # Population | % Population |
| American | 17 | 17.7% |
| English | 20 | 20.8% |
| French | 8 | 8.3% |
| German | 8 | 8.3% |
| Hungarian | 8 | 8.3% |
| Scandinavian | 15 | 15.6% | View All 6 Rows |
Immigrants in Ware Place

| Immigration Origin | # Population | % Population | View All 0 Rows |
Sex and Age in Ware Place
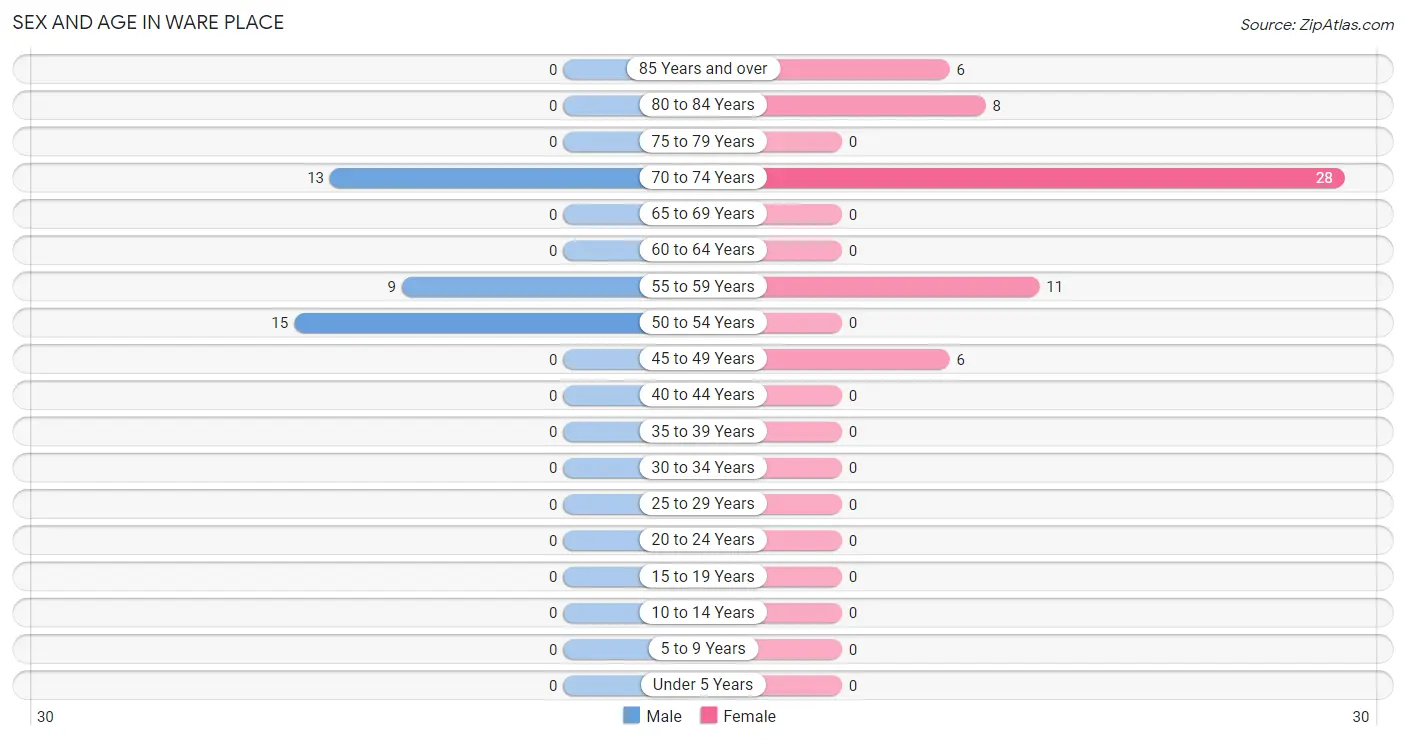
Sex and Age in Ware Place
The most populous age groups in Ware Place are 50 to 54 Years (15 | 40.5%) for men and 70 to 74 Years (28 | 47.5%) for women.
| Age Bracket | Male | Female |
| Under 5 Years | 0 (0.0%) | 0 (0.0%) |
| 5 to 9 Years | 0 (0.0%) | 0 (0.0%) |
| 10 to 14 Years | 0 (0.0%) | 0 (0.0%) |
| 15 to 19 Years | 0 (0.0%) | 0 (0.0%) |
| 20 to 24 Years | 0 (0.0%) | 0 (0.0%) |
| 25 to 29 Years | 0 (0.0%) | 0 (0.0%) |
| 30 to 34 Years | 0 (0.0%) | 0 (0.0%) |
| 35 to 39 Years | 0 (0.0%) | 0 (0.0%) |
| 40 to 44 Years | 0 (0.0%) | 0 (0.0%) |
| 45 to 49 Years | 0 (0.0%) | 6 (10.2%) |
| 50 to 54 Years | 15 (40.5%) | 0 (0.0%) |
| 55 to 59 Years | 9 (24.3%) | 11 (18.6%) |
| 60 to 64 Years | 0 (0.0%) | 0 (0.0%) |
| 65 to 69 Years | 0 (0.0%) | 0 (0.0%) |
| 70 to 74 Years | 13 (35.1%) | 28 (47.5%) |
| 75 to 79 Years | 0 (0.0%) | 0 (0.0%) |
| 80 to 84 Years | 0 (0.0%) | 8 (13.6%) |
| 85 Years and over | 0 (0.0%) | 6 (10.2%) |
| Total | 37 (100.0%) | 59 (100.0%) |
Families and Households in Ware Place
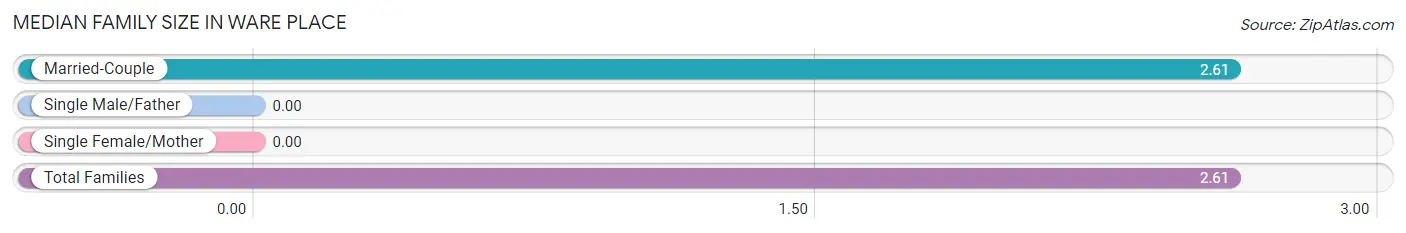
Median Family Size in Ware Place
| Family Type | # Families | Family Size |
| Married-Couple | 28 (100.0%) | 2.61 |
| Single Male/Father | 0 (0.0%) | - |
| Single Female/Mother | 0 (0.0%) | - |
| Total Families | 28 (100.0%) | 2.61 |
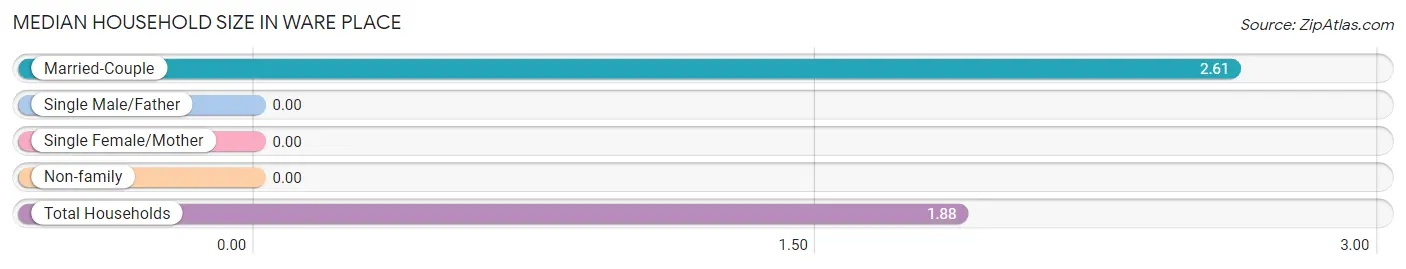
Median Household Size in Ware Place
| Household Type | # Households | Household Size |
| Married-Couple | 28 (54.9%) | 2.61 |
| Single Male/Father | 0 (0.0%) | - |
| Single Female/Mother | 0 (0.0%) | - |
| Non-family | 23 (45.1%) | - |
| Total Households | 51 (100.0%) | 1.88 |
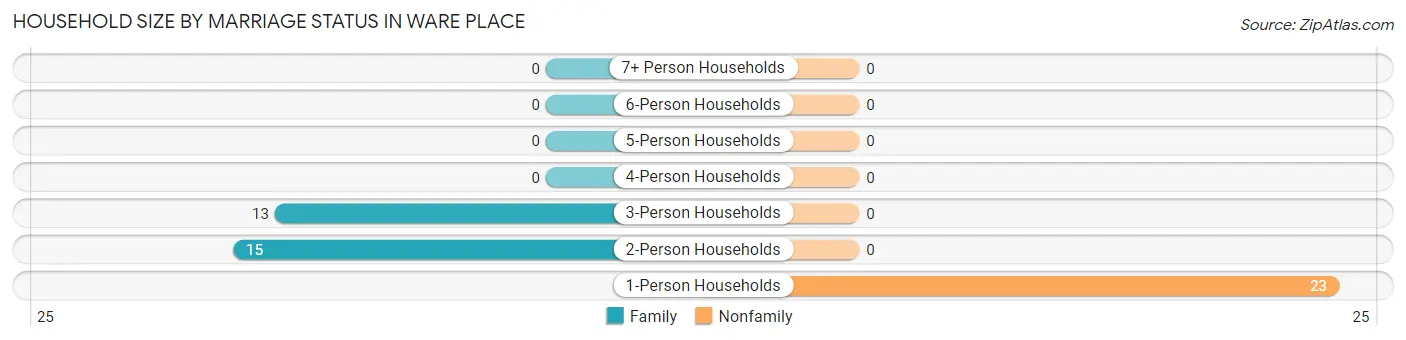
Household Size by Marriage Status in Ware Place
Out of a total of 51 households in Ware Place, 28 (54.9%) are family households, while 23 (45.1%) are nonfamily households. The most numerous type of family households are 2-person households, comprising 15, and the most common type of nonfamily households are 1-person households, comprising 23.
| Household Size | Family Households | Nonfamily Households |
| 1-Person Households | - | 23 (45.1%) |
| 2-Person Households | 15 (29.4%) | 0 (0.0%) |
| 3-Person Households | 13 (25.5%) | 0 (0.0%) |
| 4-Person Households | 0 (0.0%) | 0 (0.0%) |
| 5-Person Households | 0 (0.0%) | 0 (0.0%) |
| 6-Person Households | 0 (0.0%) | 0 (0.0%) |
| 7+ Person Households | 0 (0.0%) | 0 (0.0%) |
| Total | 28 (54.9%) | 23 (45.1%) |
Female Fertility in Ware Place
Fertility by Age in Ware Place
| Age Bracket | Women with Births | Births / 1,000 Women |
| 15 to 19 years | 0 (0.0%) | 0.0 |
| 20 to 34 years | 0 (0.0%) | 0.0 |
| 35 to 50 years | 0 (0.0%) | 0.0 |
| Total | 0 (0.0%) | 0.0 |
Fertility by Age by Marriage Status in Ware Place
| Age Bracket | Married | Unmarried |
| 15 to 19 years | 0 (0.0%) | 0 (0.0%) |
| 20 to 34 years | 0 (0.0%) | 0 (0.0%) |
| 35 to 50 years | 0 (0.0%) | 0 (0.0%) |
| Total | 0 (0.0%) | 0 (0.0%) |
Fertility by Education in Ware Place
| Educational Attainment | Women with Births | Births / 1,000 Women |
| Less than High School | 0 (0.0%) | 0.0 |
| High School Diploma | 0 (0.0%) | 0.0 |
| College or Associate's Degree | 0 (0.0%) | 0.0 |
| Bachelor's Degree | 0 (0.0%) | 0.0 |
| Graduate Degree | 0 (0.0%) | 0.0 |
| Total | 0 (0.0%) | 0.0 |
Fertility by Education by Marriage Status in Ware Place
| Educational Attainment | Married | Unmarried |
| Less than High School | 0 (0.0%) | 0 (0.0%) |
| High School Diploma | 0 (0.0%) | 0 (0.0%) |
| College or Associate's Degree | 0 (0.0%) | 0 (0.0%) |
| Bachelor's Degree | 0 (0.0%) | 0 (0.0%) |
| Graduate Degree | 0 (0.0%) | 0 (0.0%) |
| Total | 0 (0.0%) | 0 (0.0%) |
Employment Characteristics in Ware Place
Employment by Class of Employer in Ware Place
Among the 49 employed individuals in Ware Place, , and private company employees (49 | 100.0%) make up the most common classes of employment.
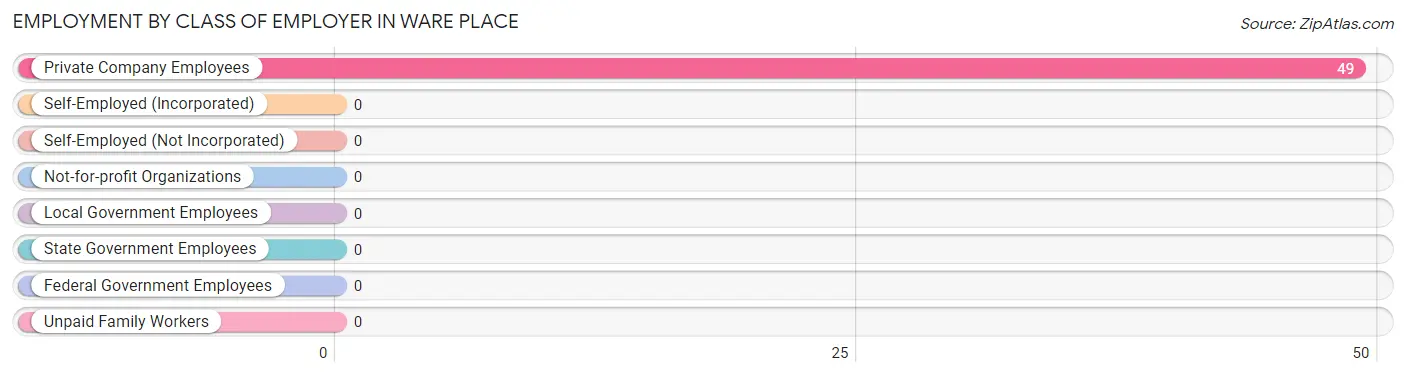
| Employer Class | # Employees | % Employees |
| Private Company Employees | 49 | 100.0% |
| Self-Employed (Incorporated) | 0 | 0.0% |
| Self-Employed (Not Incorporated) | 0 | 0.0% |
| Not-for-profit Organizations | 0 | 0.0% |
| Local Government Employees | 0 | 0.0% |
| State Government Employees | 0 | 0.0% |
| Federal Government Employees | 0 | 0.0% |
| Unpaid Family Workers | 0 | 0.0% |
| Total | 49 | 100.0% |
Employment Status by Age in Ware Place
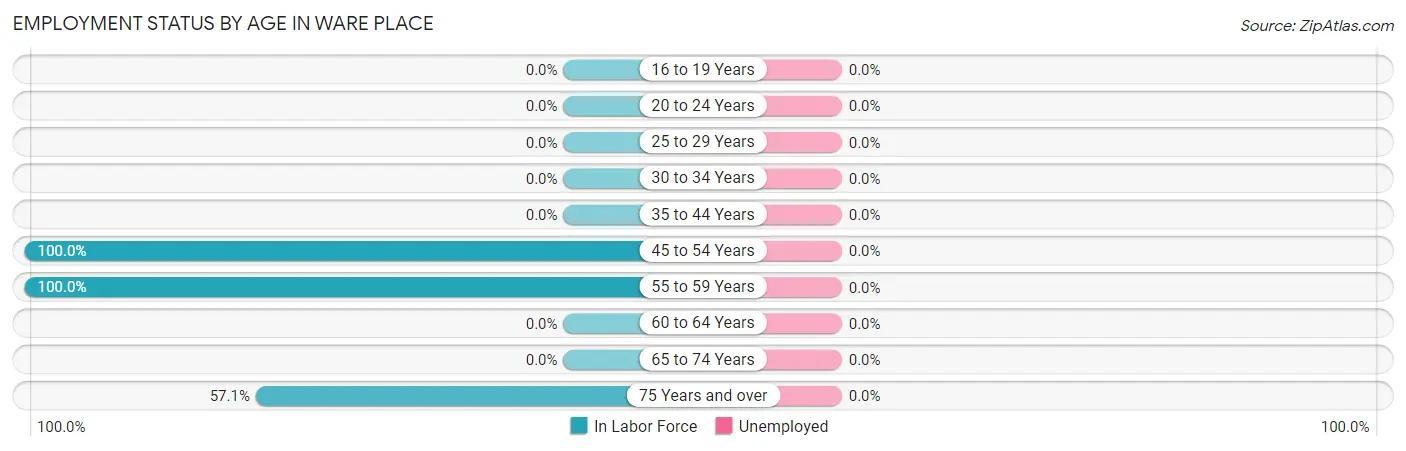
| Age Bracket | In Labor Force | Unemployed |
| 16 to 19 Years | 0 (0.0%) | 0 (0.0%) |
| 20 to 24 Years | 0 (0.0%) | 0 (0.0%) |
| 25 to 29 Years | 0 (0.0%) | 0 (0.0%) |
| 30 to 34 Years | 0 (0.0%) | 0 (0.0%) |
| 35 to 44 Years | 0 (0.0%) | 0 (0.0%) |
| 45 to 54 Years | 21 (100.0%) | 0 (0.0%) |
| 55 to 59 Years | 20 (100.0%) | 0 (0.0%) |
| 60 to 64 Years | 0 (0.0%) | 0 (0.0%) |
| 65 to 74 Years | 0 (0.0%) | 0 (0.0%) |
| 75 Years and over | 8 (57.1%) | 0 (0.0%) |
| Total | 49 (51.0%) | 0 (0.0%) |
Employment Status by Educational Attainment in Ware Place
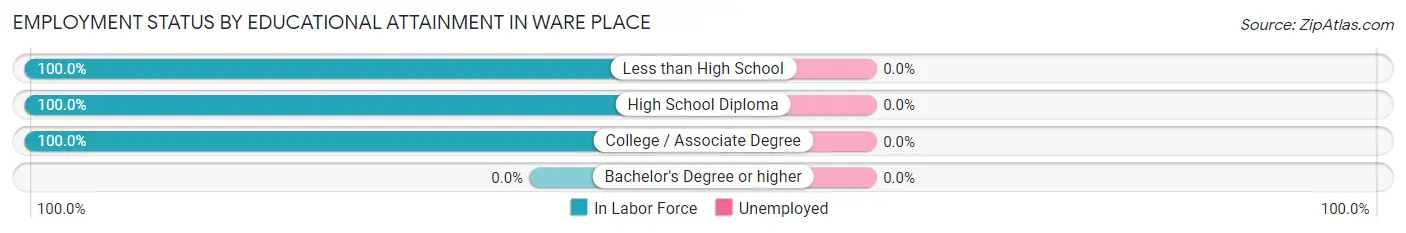
| Educational Attainment | In Labor Force | Unemployed |
| Less than High School | 11 (100.0%) | 0 (0.0%) |
| High School Diploma | 9 (100.0%) | 0 (0.0%) |
| College / Associate Degree | 21 (100.0%) | 0 (0.0%) |
| Bachelor's Degree or higher | 0 (0.0%) | 0 (0.0%) |
| Total | 41 (100.0%) | 0 (0.0%) |
Employment Occupations by Sex in Ware Place
Management, Business, Science and Arts Occupations
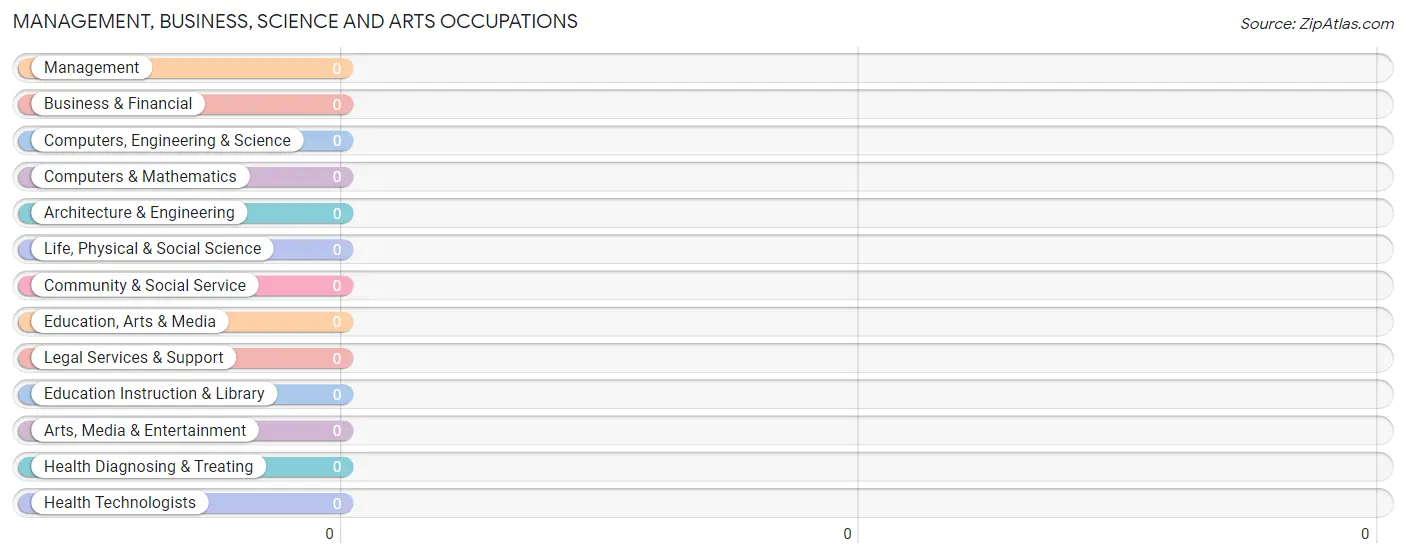
Management, Business, Science and Arts Occupations by Sex
| Occupation | Male | Female |
| Management | 0 (0.0%) | 0 (0.0%) |
| Business & Financial | 0 (0.0%) | 0 (0.0%) |
| Computers, Engineering & Science | 0 (0.0%) | 0 (0.0%) |
| Computers & Mathematics | 0 (0.0%) | 0 (0.0%) |
| Architecture & Engineering | 0 (0.0%) | 0 (0.0%) |
| Life, Physical & Social Science | 0 (0.0%) | 0 (0.0%) |
| Community & Social Service | 0 (0.0%) | 0 (0.0%) |
| Education, Arts & Media | 0 (0.0%) | 0 (0.0%) |
| Legal Services & Support | 0 (0.0%) | 0 (0.0%) |
| Education Instruction & Library | 0 (0.0%) | 0 (0.0%) |
| Arts, Media & Entertainment | 0 (0.0%) | 0 (0.0%) |
| Health Diagnosing & Treating | 0 (0.0%) | 0 (0.0%) |
| Health Technologists | 0 (0.0%) | 0 (0.0%) |
| Total (Category) | 0 (0.0%) | 0 (0.0%) |
| Total (Overall) | 24 (49.0%) | 25 (51.0%) |
Services Occupations
The most common Services occupations in Ware Place are , and Cleaning & Maintenance (6 | 12.2%).
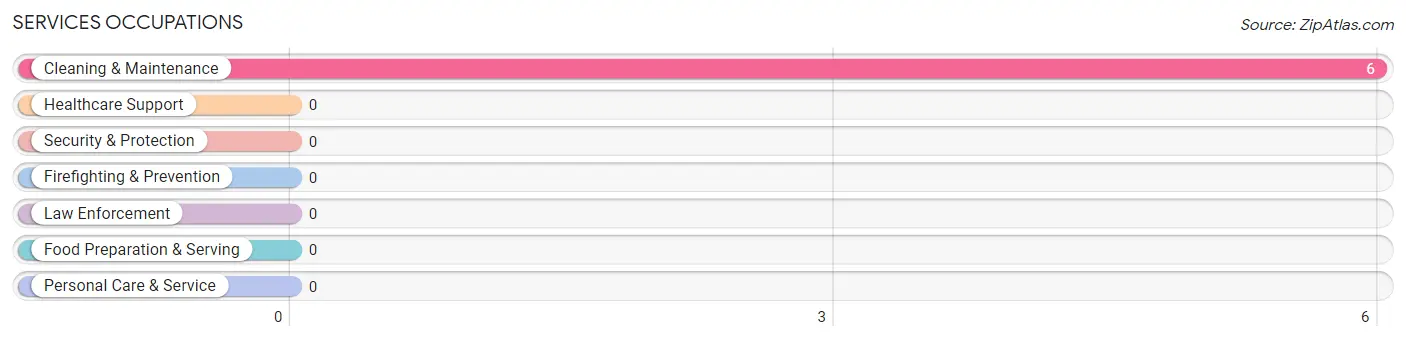
Services Occupations by Sex
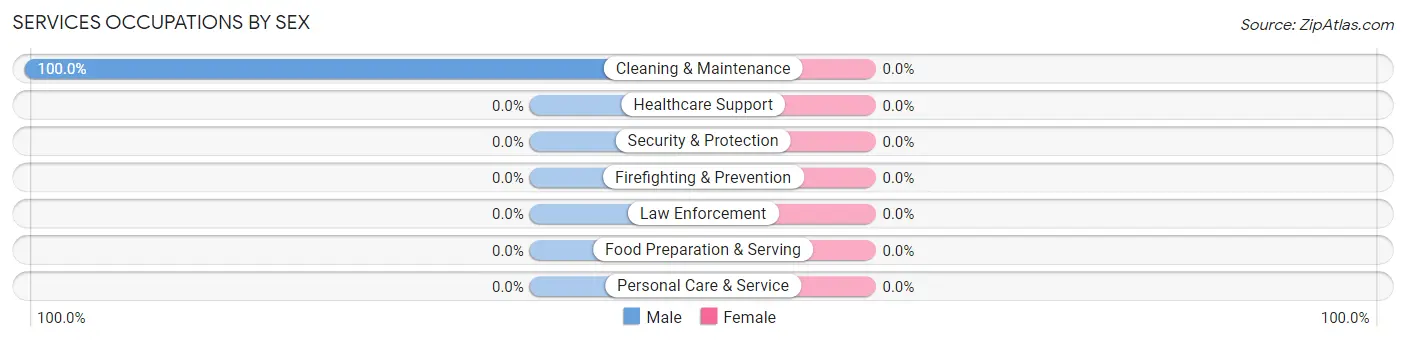
| Occupation | Male | Female |
| Healthcare Support | 0 (0.0%) | 0 (0.0%) |
| Security & Protection | 0 (0.0%) | 0 (0.0%) |
| Firefighting & Prevention | 0 (0.0%) | 0 (0.0%) |
| Law Enforcement | 0 (0.0%) | 0 (0.0%) |
| Food Preparation & Serving | 0 (0.0%) | 0 (0.0%) |
| Cleaning & Maintenance | 6 (100.0%) | 0 (0.0%) |
| Personal Care & Service | 0 (0.0%) | 0 (0.0%) |
| Total (Category) | 6 (100.0%) | 0 (0.0%) |
| Total (Overall) | 24 (49.0%) | 25 (51.0%) |
Sales and Office Occupations
The most common Sales and Office occupations in Ware Place are , and Sales & Related (8 | 16.3%).
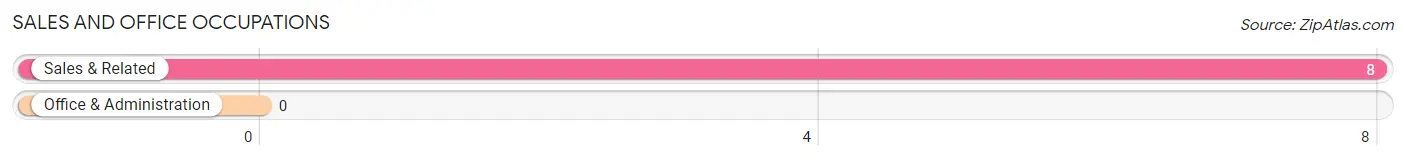
Sales and Office Occupations by Sex
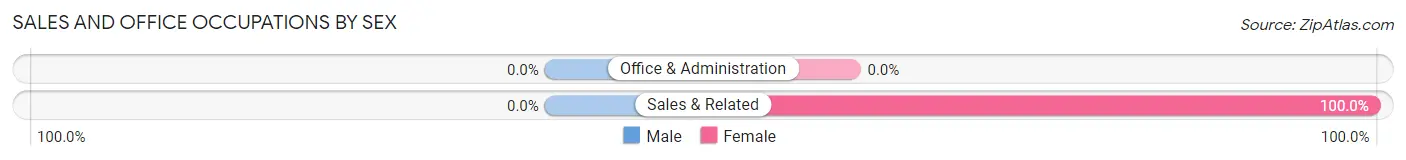
| Occupation | Male | Female |
| Sales & Related | 0 (0.0%) | 8 (100.0%) |
| Office & Administration | 0 (0.0%) | 0 (0.0%) |
| Total (Category) | 0 (0.0%) | 8 (100.0%) |
| Total (Overall) | 24 (49.0%) | 25 (51.0%) |
Natural Resources, Construction and Maintenance Occupations
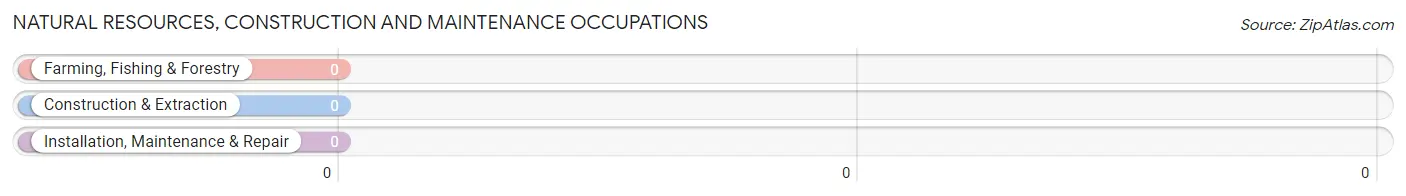
Natural Resources, Construction and Maintenance Occupations by Sex
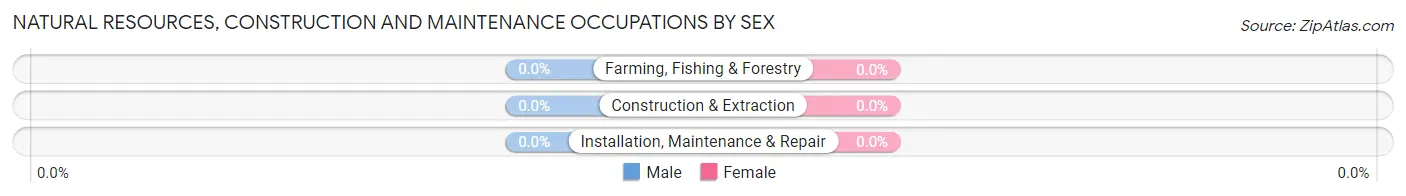
| Occupation | Male | Female |
| Farming, Fishing & Forestry | 0 (0.0%) | 0 (0.0%) |
| Construction & Extraction | 0 (0.0%) | 0 (0.0%) |
| Installation, Maintenance & Repair | 0 (0.0%) | 0 (0.0%) |
| Total (Category) | 0 (0.0%) | 0 (0.0%) |
| Total (Overall) | 24 (49.0%) | 25 (51.0%) |
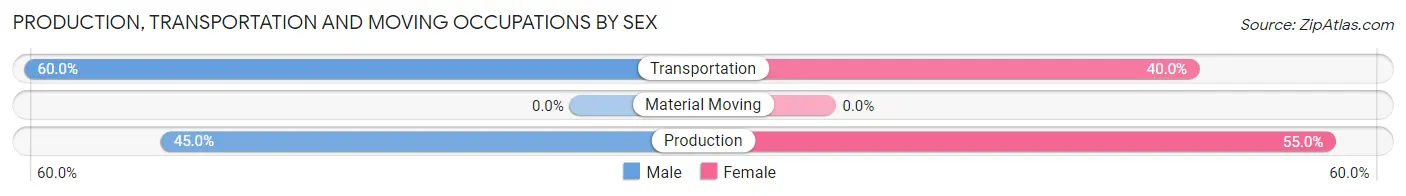
Production, Transportation and Moving Occupations
The most common Production, Transportation and Moving occupations in Ware Place are Production (20 | 40.8%), and Transportation (15 | 30.6%).
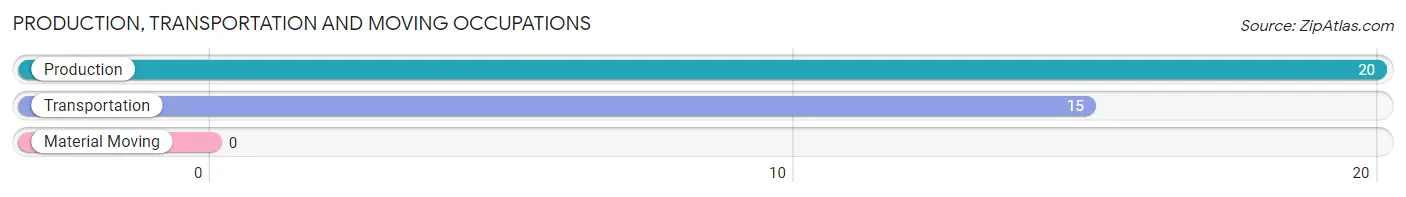
Production, Transportation and Moving Occupations by Sex
| Occupation | Male | Female |
| Production | 9 (45.0%) | 11 (55.0%) |
| Transportation | 9 (60.0%) | 6 (40.0%) |
| Material Moving | 0 (0.0%) | 0 (0.0%) |
| Total (Category) | 18 (51.4%) | 17 (48.6%) |
| Total (Overall) | 24 (49.0%) | 25 (51.0%) |
Employment Industries by Sex in Ware Place
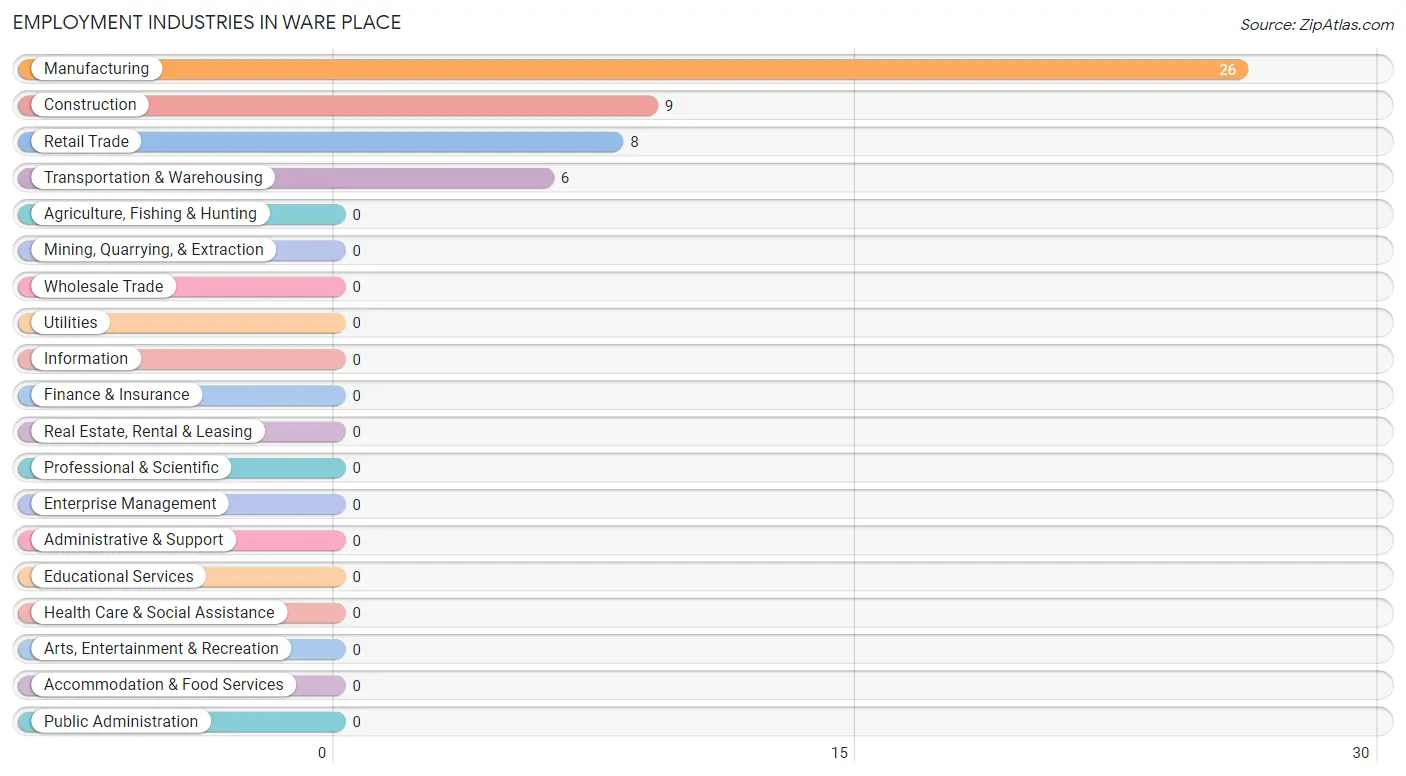
Employment Industries in Ware Place
The major employment industries in Ware Place include Manufacturing (26 | 53.1%), Construction (9 | 18.4%), Retail Trade (8 | 16.3%), and Transportation & Warehousing (6 | 12.2%).
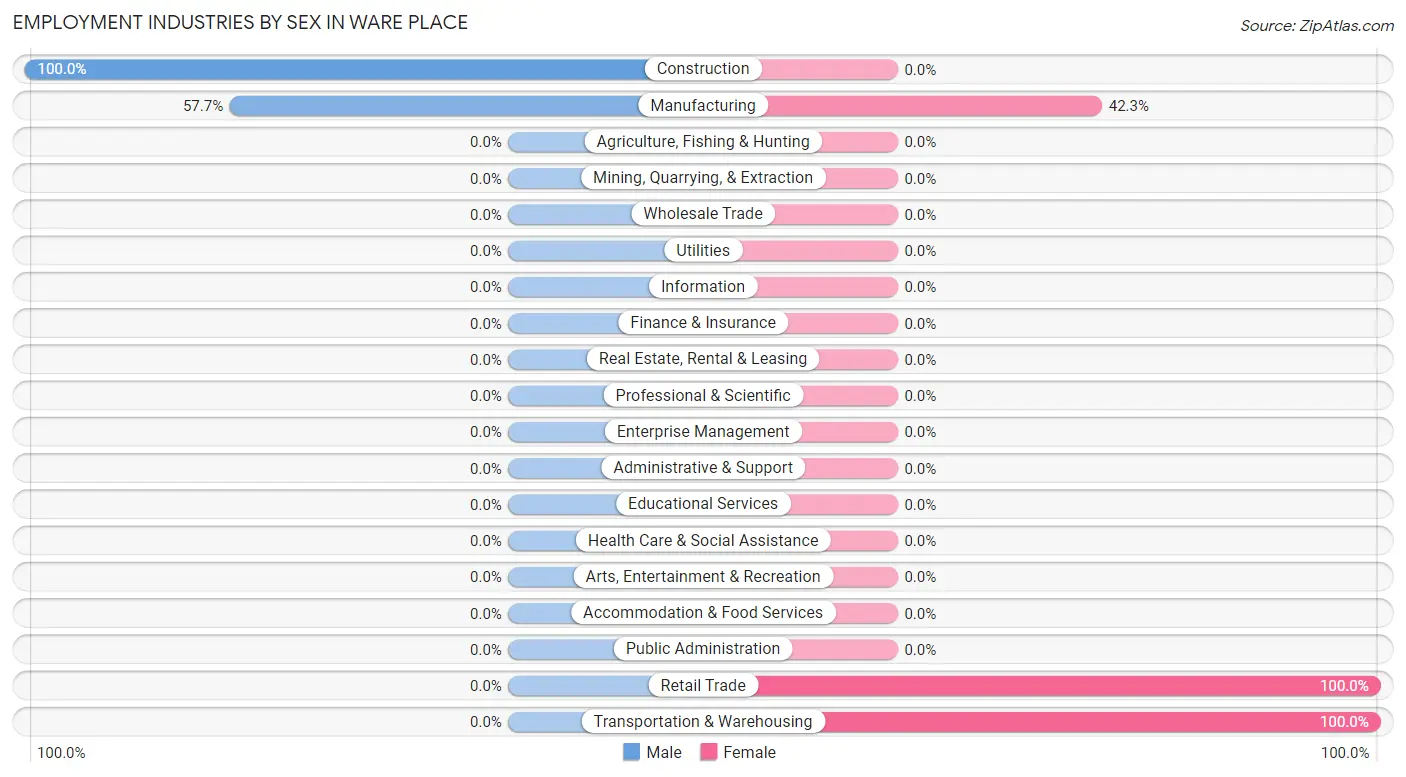
Employment Industries by Sex in Ware Place
The Ware Place industries that see more men than women are Construction (100.0%), and Manufacturing (57.7%), whereas the industries that tend to have a higher number of women are Retail Trade (100.0%), Transportation & Warehousing (100.0%), and Manufacturing (42.3%).
| Industry | Male | Female |
| Agriculture, Fishing & Hunting | 0 (0.0%) | 0 (0.0%) |
| Mining, Quarrying, & Extraction | 0 (0.0%) | 0 (0.0%) |
| Construction | 9 (100.0%) | 0 (0.0%) |
| Manufacturing | 15 (57.7%) | 11 (42.3%) |
| Wholesale Trade | 0 (0.0%) | 0 (0.0%) |
| Retail Trade | 0 (0.0%) | 8 (100.0%) |
| Transportation & Warehousing | 0 (0.0%) | 6 (100.0%) |
| Utilities | 0 (0.0%) | 0 (0.0%) |
| Information | 0 (0.0%) | 0 (0.0%) |
| Finance & Insurance | 0 (0.0%) | 0 (0.0%) |
| Real Estate, Rental & Leasing | 0 (0.0%) | 0 (0.0%) |
| Professional & Scientific | 0 (0.0%) | 0 (0.0%) |
| Enterprise Management | 0 (0.0%) | 0 (0.0%) |
| Administrative & Support | 0 (0.0%) | 0 (0.0%) |
| Educational Services | 0 (0.0%) | 0 (0.0%) |
| Health Care & Social Assistance | 0 (0.0%) | 0 (0.0%) |
| Arts, Entertainment & Recreation | 0 (0.0%) | 0 (0.0%) |
| Accommodation & Food Services | 0 (0.0%) | 0 (0.0%) |
| Public Administration | 0 (0.0%) | 0 (0.0%) |
| Total | 24 (49.0%) | 25 (51.0%) |
Education in Ware Place
School Enrollment in Ware Place
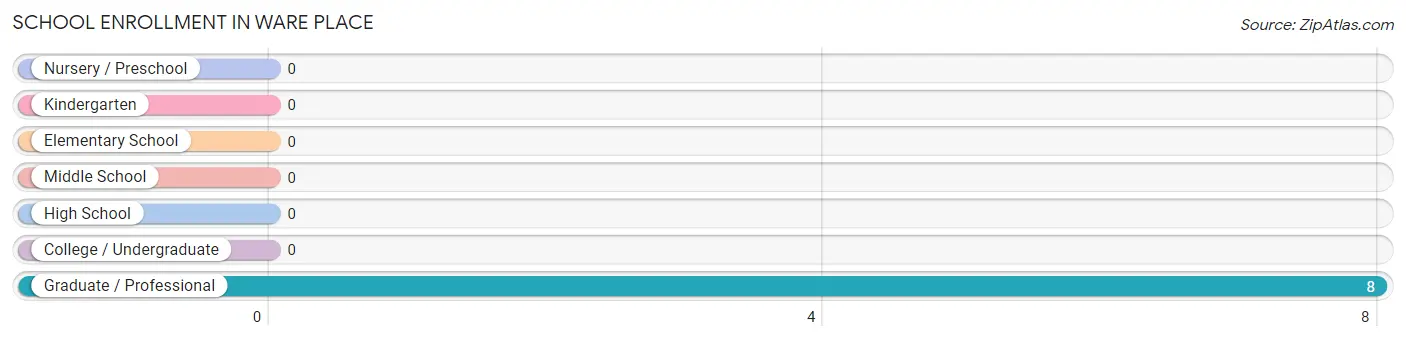
| School Level | # Students | % Students |
| Nursery / Preschool | 0 | 0.0% |
| Kindergarten | 0 | 0.0% |
| Elementary School | 0 | 0.0% |
| Middle School | 0 | 0.0% |
| High School | 0 | 0.0% |
| College / Undergraduate | 0 | 0.0% |
| Graduate / Professional | 8 | 100.0% |
| Total | 8 | 100.0% |
School Enrollment by Age by Funding Source in Ware Place
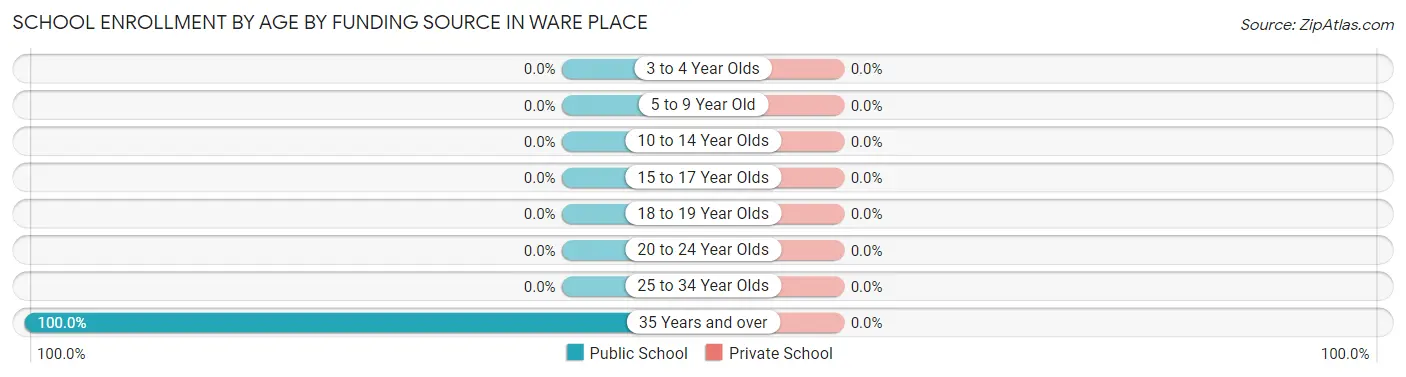
| Age Bracket | Public School | Private School |
| 3 to 4 Year Olds | 0 (0.0%) | 0 (0.0%) |
| 5 to 9 Year Old | 0 (0.0%) | 0 (0.0%) |
| 10 to 14 Year Olds | 0 (0.0%) | 0 (0.0%) |
| 15 to 17 Year Olds | 0 (0.0%) | 0 (0.0%) |
| 18 to 19 Year Olds | 0 (0.0%) | 0 (0.0%) |
| 20 to 24 Year Olds | 0 (0.0%) | 0 (0.0%) |
| 25 to 34 Year Olds | 0 (0.0%) | 0 (0.0%) |
| 35 Years and over | 8 (100.0%) | 0 (0.0%) |
| Total | 8 (100.0%) | 0 (0.0%) |
Educational Attainment by Field of Study in Ware Place
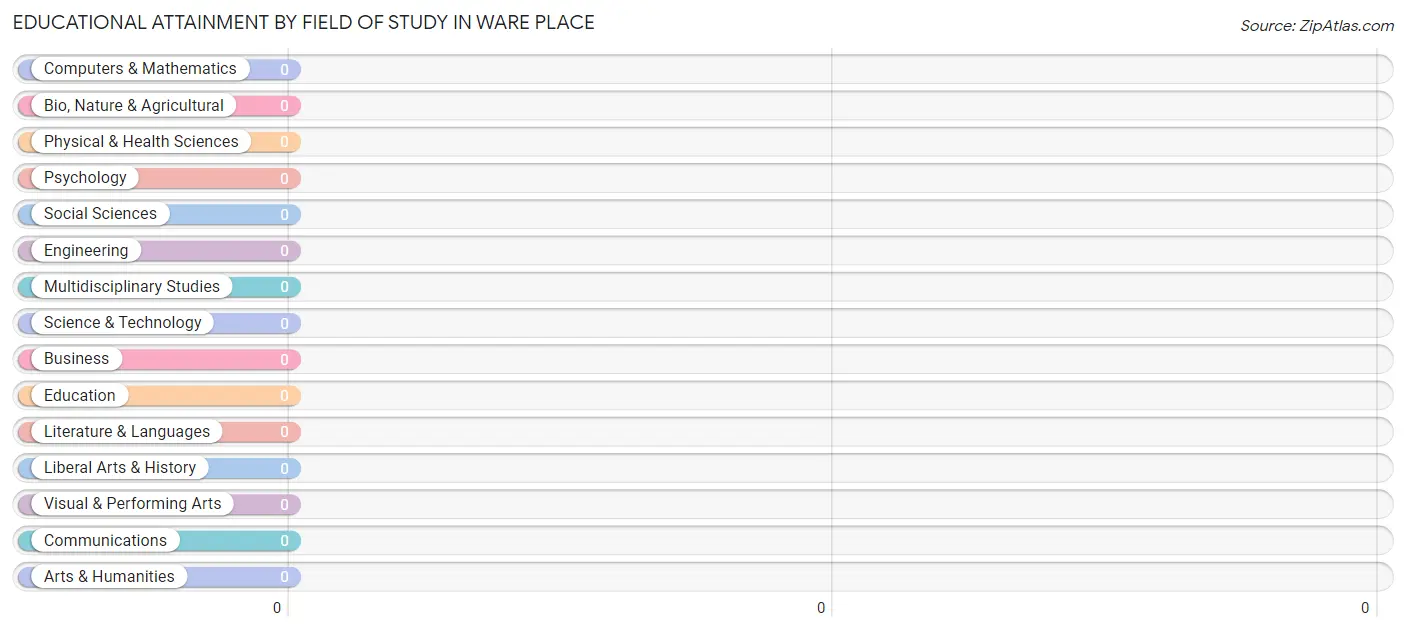
| Field of Study | # Graduates | % Graduates |
| Computers & Mathematics | 0 | 0.0% |
| Bio, Nature & Agricultural | 0 | 0.0% |
| Physical & Health Sciences | 0 | 0.0% |
| Psychology | 0 | 0.0% |
| Social Sciences | 0 | 0.0% |
| Engineering | 0 | 0.0% |
| Multidisciplinary Studies | 0 | 0.0% |
| Science & Technology | 0 | 0.0% |
| Business | 0 | 0.0% |
| Education | 0 | 0.0% |
| Literature & Languages | 0 | 0.0% |
| Liberal Arts & History | 0 | 0.0% |
| Visual & Performing Arts | 0 | 0.0% |
| Communications | 0 | 0.0% |
| Arts & Humanities | 0 | 0.0% |
| Total | 0 | 0.0% |
Transportation & Commute in Ware Place
Vehicle Availability by Sex in Ware Place
The most prevalent vehicle ownership categories in Ware Place are males with 3 vehicles (18, accounting for 75.0%) and females with 3 vehicles (11, making up 72.0%).
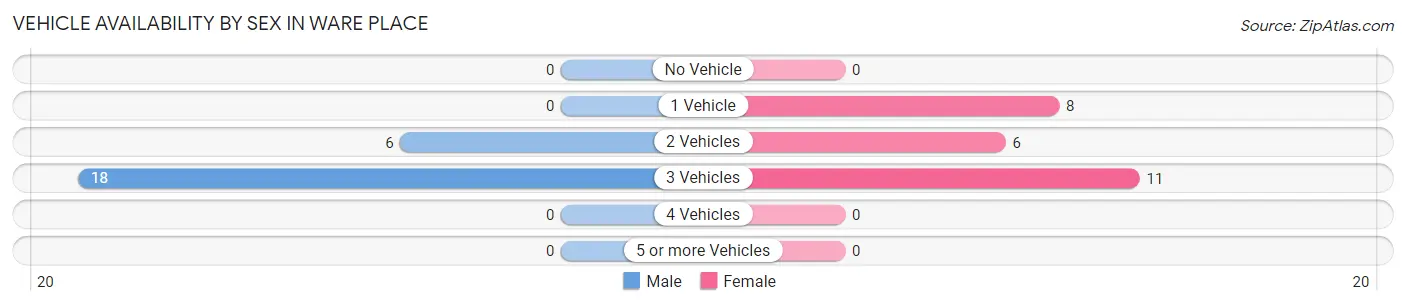
| Vehicles Available | Male | Female |
| No Vehicle | 0 (0.0%) | 0 (0.0%) |
| 1 Vehicle | 0 (0.0%) | 8 (32.0%) |
| 2 Vehicles | 6 (25.0%) | 6 (24.0%) |
| 3 Vehicles | 18 (75.0%) | 11 (44.0%) |
| 4 Vehicles | 0 (0.0%) | 0 (0.0%) |
| 5 or more Vehicles | 0 (0.0%) | 0 (0.0%) |
| Total | 24 (100.0%) | 25 (100.0%) |
Commute Time in Ware Place
The most frequently occuring commute durations in Ware Place are 30 to 34 minutes (17 commuters, 34.7%), 60 to 89 minutes (17 commuters, 34.7%), and 15 to 19 minutes (9 commuters, 18.4%).
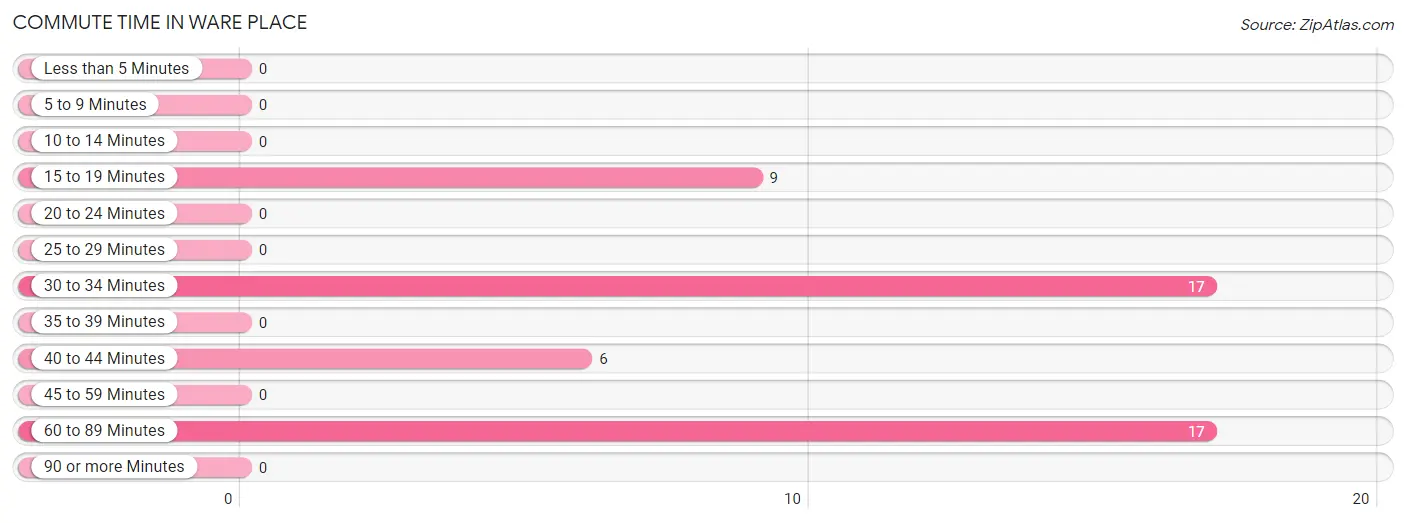
| Commute Time | # Commuters | % Commuters |
| Less than 5 Minutes | 0 | 0.0% |
| 5 to 9 Minutes | 0 | 0.0% |
| 10 to 14 Minutes | 0 | 0.0% |
| 15 to 19 Minutes | 9 | 18.4% |
| 20 to 24 Minutes | 0 | 0.0% |
| 25 to 29 Minutes | 0 | 0.0% |
| 30 to 34 Minutes | 17 | 34.7% |
| 35 to 39 Minutes | 0 | 0.0% |
| 40 to 44 Minutes | 6 | 12.2% |
| 45 to 59 Minutes | 0 | 0.0% |
| 60 to 89 Minutes | 17 | 34.7% |
| 90 or more Minutes | 0 | 0.0% |
Commute Time by Sex in Ware Place
The most common commute times in Ware Place are 15 to 19 minutes (9 commuters, 37.5%) for males and 30 to 34 minutes (17 commuters, 68.0%) for females.
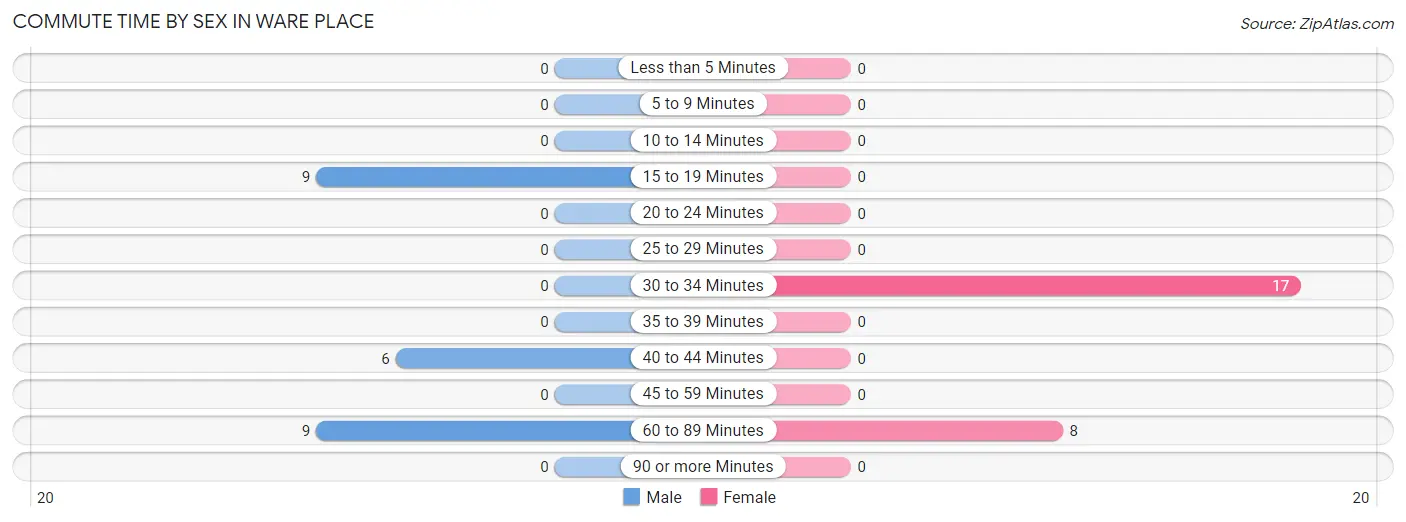
| Commute Time | Male | Female |
| Less than 5 Minutes | 0 (0.0%) | 0 (0.0%) |
| 5 to 9 Minutes | 0 (0.0%) | 0 (0.0%) |
| 10 to 14 Minutes | 0 (0.0%) | 0 (0.0%) |
| 15 to 19 Minutes | 9 (37.5%) | 0 (0.0%) |
| 20 to 24 Minutes | 0 (0.0%) | 0 (0.0%) |
| 25 to 29 Minutes | 0 (0.0%) | 0 (0.0%) |
| 30 to 34 Minutes | 0 (0.0%) | 17 (68.0%) |
| 35 to 39 Minutes | 0 (0.0%) | 0 (0.0%) |
| 40 to 44 Minutes | 6 (25.0%) | 0 (0.0%) |
| 45 to 59 Minutes | 0 (0.0%) | 0 (0.0%) |
| 60 to 89 Minutes | 9 (37.5%) | 8 (32.0%) |
| 90 or more Minutes | 0 (0.0%) | 0 (0.0%) |
Time of Departure to Work by Sex in Ware Place
The most frequent times of departure to work in Ware Place are 12:00 PM to 3:59 PM (15, 62.5%) for males and 12:00 PM to 3:59 PM (11, 44.0%) for females.
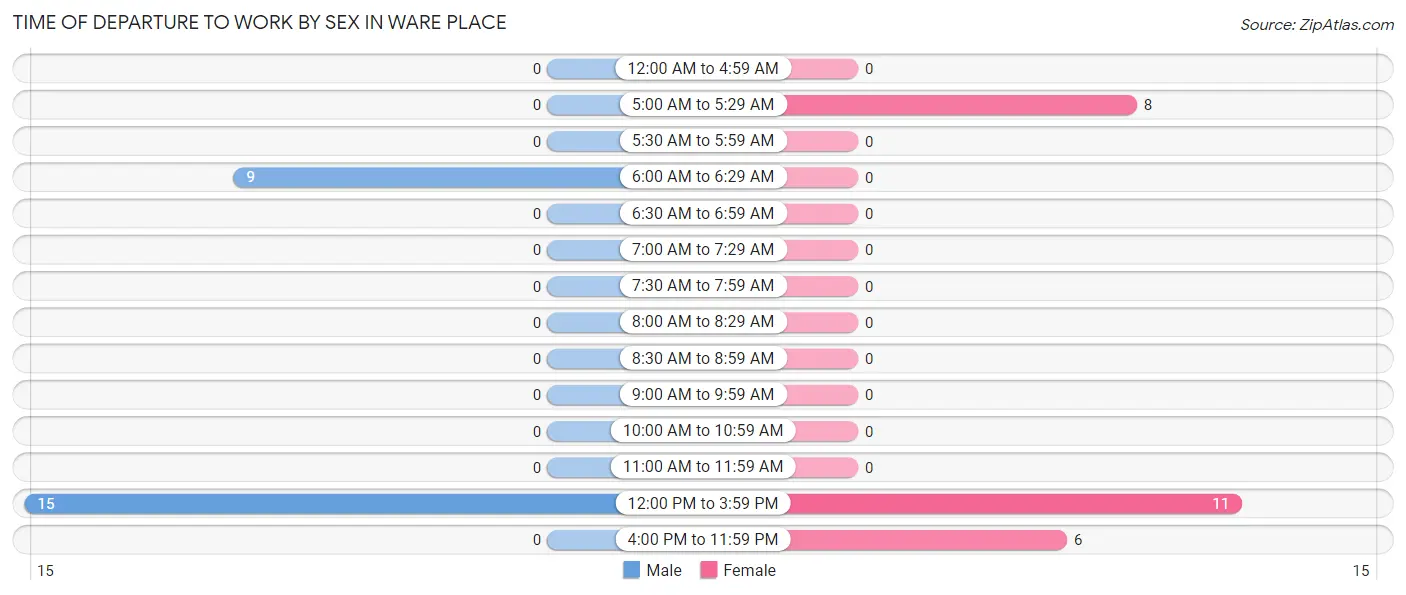
| Time of Departure | Male | Female |
| 12:00 AM to 4:59 AM | 0 (0.0%) | 0 (0.0%) |
| 5:00 AM to 5:29 AM | 0 (0.0%) | 8 (32.0%) |
| 5:30 AM to 5:59 AM | 0 (0.0%) | 0 (0.0%) |
| 6:00 AM to 6:29 AM | 9 (37.5%) | 0 (0.0%) |
| 6:30 AM to 6:59 AM | 0 (0.0%) | 0 (0.0%) |
| 7:00 AM to 7:29 AM | 0 (0.0%) | 0 (0.0%) |
| 7:30 AM to 7:59 AM | 0 (0.0%) | 0 (0.0%) |
| 8:00 AM to 8:29 AM | 0 (0.0%) | 0 (0.0%) |
| 8:30 AM to 8:59 AM | 0 (0.0%) | 0 (0.0%) |
| 9:00 AM to 9:59 AM | 0 (0.0%) | 0 (0.0%) |
| 10:00 AM to 10:59 AM | 0 (0.0%) | 0 (0.0%) |
| 11:00 AM to 11:59 AM | 0 (0.0%) | 0 (0.0%) |
| 12:00 PM to 3:59 PM | 15 (62.5%) | 11 (44.0%) |
| 4:00 PM to 11:59 PM | 0 (0.0%) | 6 (24.0%) |
| Total | 24 (100.0%) | 25 (100.0%) |
Housing Occupancy in Ware Place
Occupancy by Ownership in Ware Place
Of the total 51 dwellings in Ware Place, owner-occupied units account for 42 (82.4%), while renter-occupied units make up 9 (17.6%).
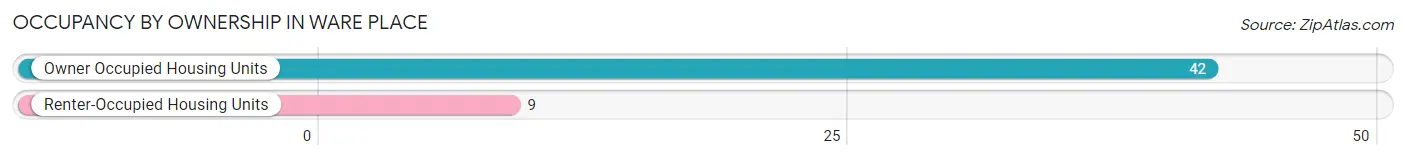
| Occupancy | # Housing Units | % Housing Units |
| Owner Occupied Housing Units | 42 | 82.4% |
| Renter-Occupied Housing Units | 9 | 17.6% |
| Total Occupied Housing Units | 51 | 100.0% |
Occupancy by Household Size in Ware Place
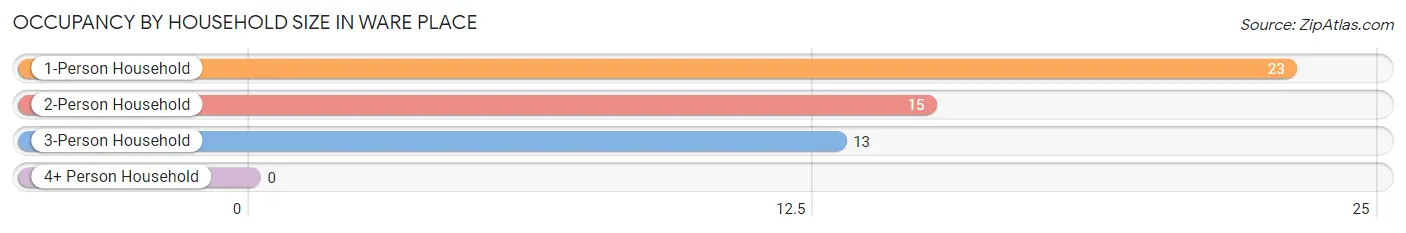
| Household Size | # Housing Units | % Housing Units |
| 1-Person Household | 23 | 45.1% |
| 2-Person Household | 15 | 29.4% |
| 3-Person Household | 13 | 25.5% |
| 4+ Person Household | 0 | 0.0% |
| Total Housing Units | 51 | 100.0% |
Occupancy by Ownership by Household Size in Ware Place
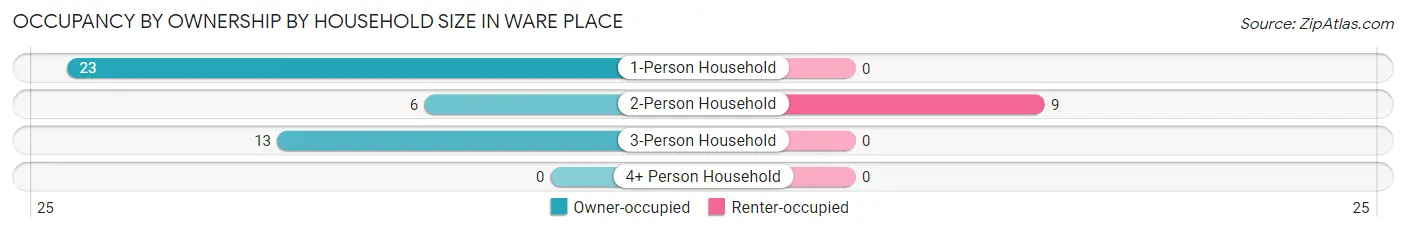
| Household Size | Owner-occupied | Renter-occupied |
| 1-Person Household | 23 (100.0%) | 0 (0.0%) |
| 2-Person Household | 6 (40.0%) | 9 (60.0%) |
| 3-Person Household | 13 (100.0%) | 0 (0.0%) |
| 4+ Person Household | 0 (0.0%) | 0 (0.0%) |
| Total Housing Units | 42 (82.4%) | 9 (17.6%) |
Occupancy by Educational Attainment in Ware Place
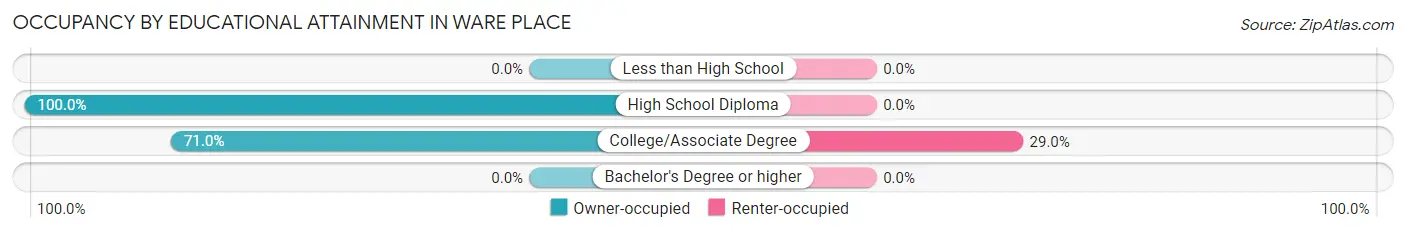
| Household Size | Owner-occupied | Renter-occupied |
| Less than High School | 0 (0.0%) | 0 (0.0%) |
| High School Diploma | 20 (100.0%) | 0 (0.0%) |
| College/Associate Degree | 22 (71.0%) | 9 (29.0%) |
| Bachelor's Degree or higher | 0 (0.0%) | 0 (0.0%) |
Occupancy by Age of Householder in Ware Place
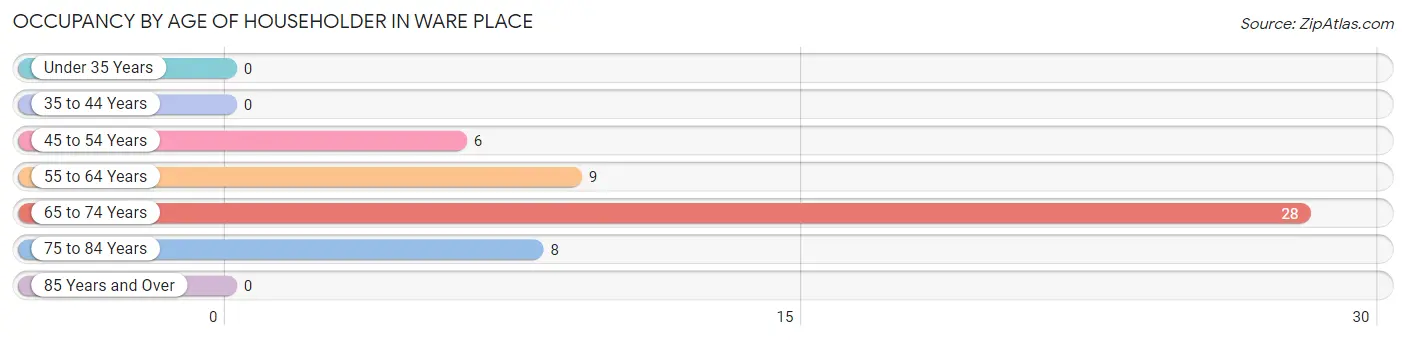
| Age Bracket | # Households | % Households |
| Under 35 Years | 0 | 0.0% |
| 35 to 44 Years | 0 | 0.0% |
| 45 to 54 Years | 6 | 11.8% |
| 55 to 64 Years | 9 | 17.6% |
| 65 to 74 Years | 28 | 54.9% |
| 75 to 84 Years | 8 | 15.7% |
| 85 Years and Over | 0 | 0.0% |
| Total | 51 | 100.0% |
Housing Finances in Ware Place
Median Income by Occupancy in Ware Place
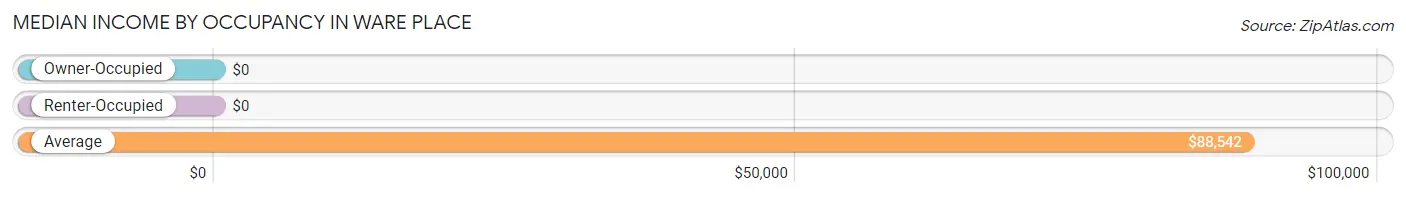
| Occupancy Type | # Households | Median Income |
| Owner-Occupied | 42 (82.4%) | $0 |
| Renter-Occupied | 9 (17.6%) | $0 |
| Average | 51 (100.0%) | $88,542 |
Occupancy by Householder Income Bracket in Ware Place
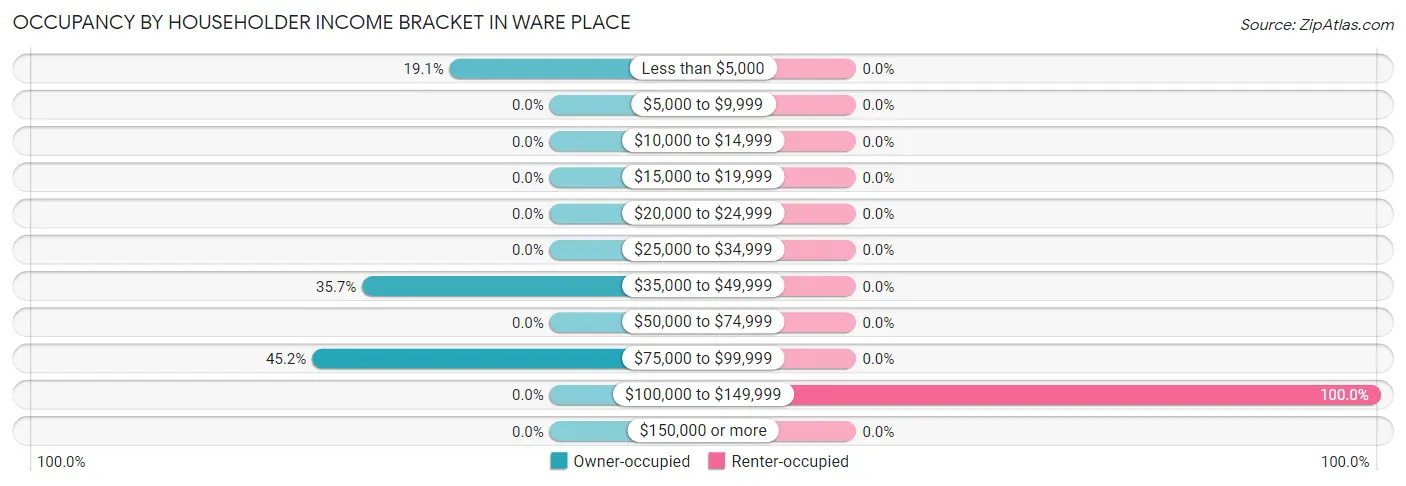
| Income Bracket | Owner-occupied | Renter-occupied |
| Less than $5,000 | 8 (19.1%) | 0 (0.0%) |
| $5,000 to $9,999 | 0 (0.0%) | 0 (0.0%) |
| $10,000 to $14,999 | 0 (0.0%) | 0 (0.0%) |
| $15,000 to $19,999 | 0 (0.0%) | 0 (0.0%) |
| $20,000 to $24,999 | 0 (0.0%) | 0 (0.0%) |
| $25,000 to $34,999 | 0 (0.0%) | 0 (0.0%) |
| $35,000 to $49,999 | 15 (35.7%) | 0 (0.0%) |
| $50,000 to $74,999 | 0 (0.0%) | 0 (0.0%) |
| $75,000 to $99,999 | 19 (45.2%) | 0 (0.0%) |
| $100,000 to $149,999 | 0 (0.0%) | 9 (100.0%) |
| $150,000 or more | 0 (0.0%) | 0 (0.0%) |
| Total | 42 (100.0%) | 9 (100.0%) |
Monthly Housing Cost Tiers in Ware Place
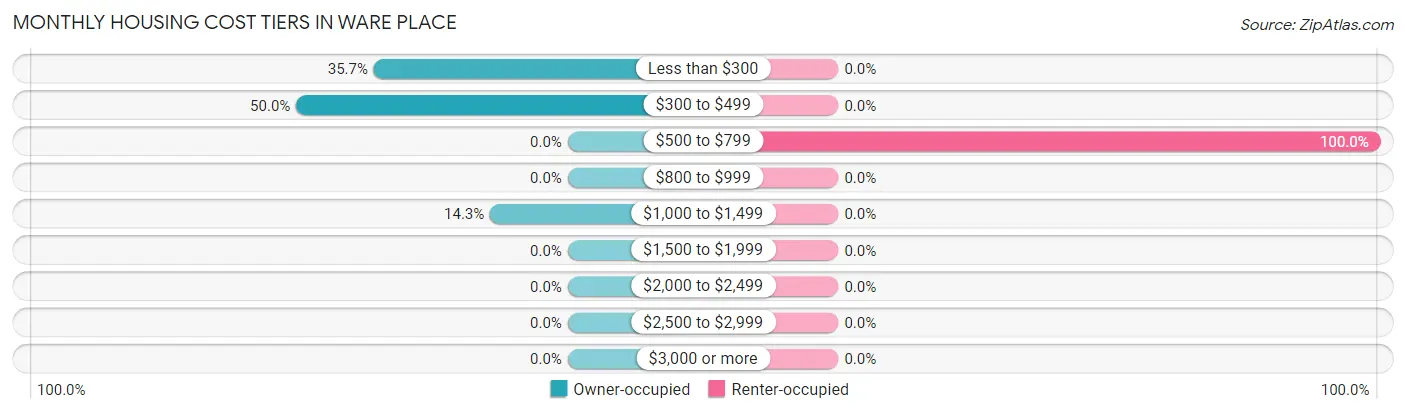
| Monthly Cost | Owner-occupied | Renter-occupied |
| Less than $300 | 15 (35.7%) | 0 (0.0%) |
| $300 to $499 | 21 (50.0%) | 0 (0.0%) |
| $500 to $799 | 0 (0.0%) | 9 (100.0%) |
| $800 to $999 | 0 (0.0%) | 0 (0.0%) |
| $1,000 to $1,499 | 6 (14.3%) | 0 (0.0%) |
| $1,500 to $1,999 | 0 (0.0%) | 0 (0.0%) |
| $2,000 to $2,499 | 0 (0.0%) | 0 (0.0%) |
| $2,500 to $2,999 | 0 (0.0%) | 0 (0.0%) |
| $3,000 or more | 0 (0.0%) | 0 (0.0%) |
| Total | 42 (100.0%) | 9 (100.0%) |
Physical Housing Characteristics in Ware Place
Housing Structures in Ware Place
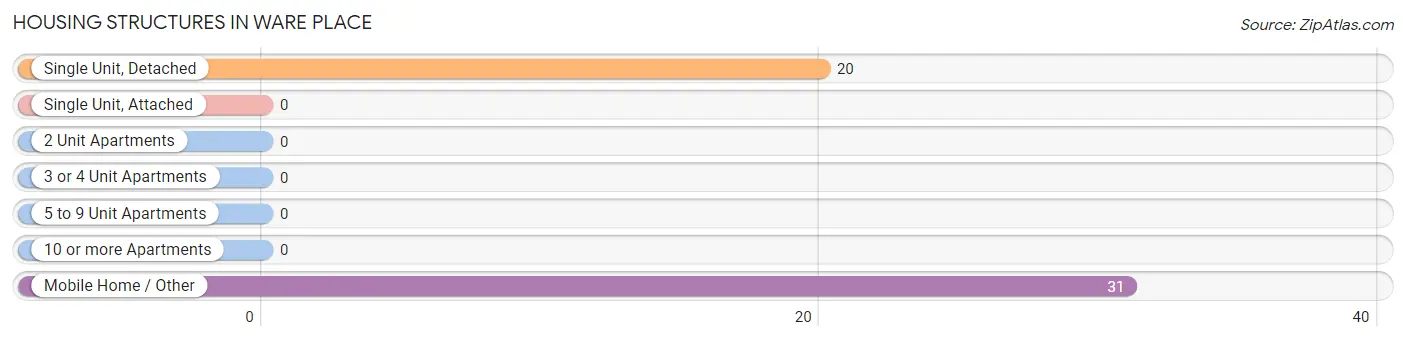
| Structure Type | # Housing Units | % Housing Units |
| Single Unit, Detached | 20 | 39.2% |
| Single Unit, Attached | 0 | 0.0% |
| 2 Unit Apartments | 0 | 0.0% |
| 3 or 4 Unit Apartments | 0 | 0.0% |
| 5 to 9 Unit Apartments | 0 | 0.0% |
| 10 or more Apartments | 0 | 0.0% |
| Mobile Home / Other | 31 | 60.8% |
| Total | 51 | 100.0% |
Housing Structures by Occupancy in Ware Place
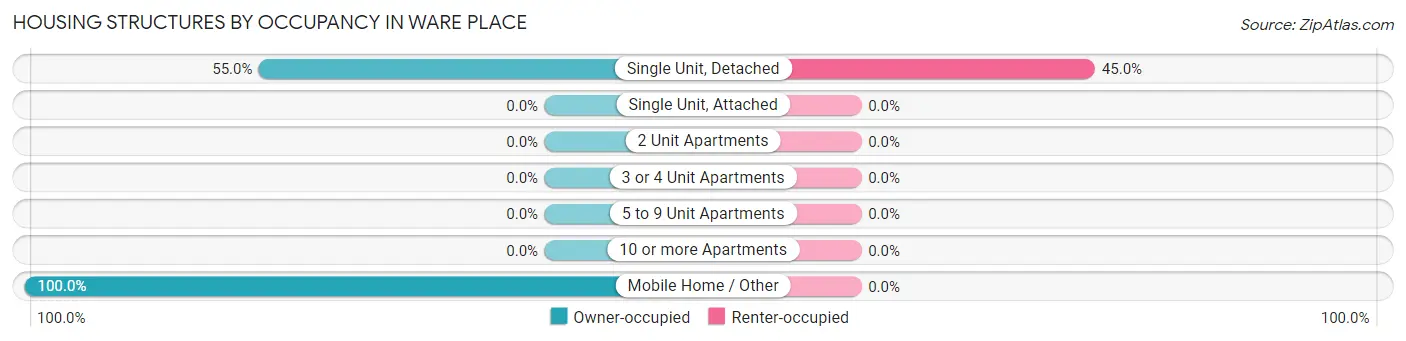
| Structure Type | Owner-occupied | Renter-occupied |
| Single Unit, Detached | 11 (55.0%) | 9 (45.0%) |
| Single Unit, Attached | 0 (0.0%) | 0 (0.0%) |
| 2 Unit Apartments | 0 (0.0%) | 0 (0.0%) |
| 3 or 4 Unit Apartments | 0 (0.0%) | 0 (0.0%) |
| 5 to 9 Unit Apartments | 0 (0.0%) | 0 (0.0%) |
| 10 or more Apartments | 0 (0.0%) | 0 (0.0%) |
| Mobile Home / Other | 31 (100.0%) | 0 (0.0%) |
| Total | 42 (82.4%) | 9 (17.6%) |
Housing Structures by Number of Rooms in Ware Place
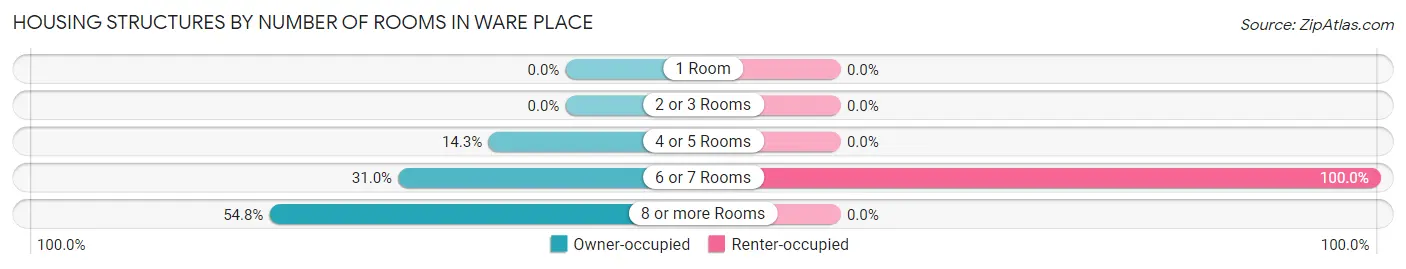
| Number of Rooms | Owner-occupied | Renter-occupied |
| 1 Room | 0 (0.0%) | 0 (0.0%) |
| 2 or 3 Rooms | 0 (0.0%) | 0 (0.0%) |
| 4 or 5 Rooms | 6 (14.3%) | 0 (0.0%) |
| 6 or 7 Rooms | 13 (30.9%) | 9 (100.0%) |
| 8 or more Rooms | 23 (54.8%) | 0 (0.0%) |
| Total | 42 (100.0%) | 9 (100.0%) |
Housing Structure by Heating Type in Ware Place
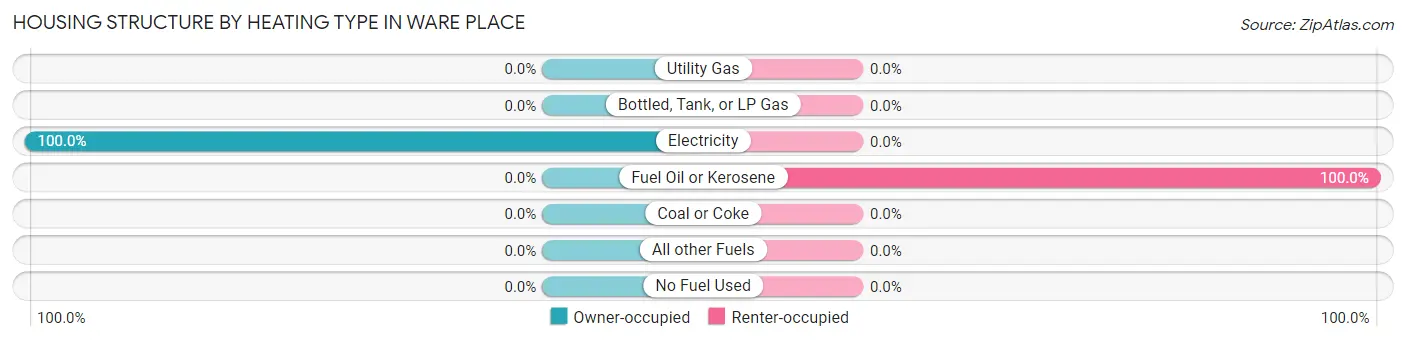
| Heating Type | Owner-occupied | Renter-occupied |
| Utility Gas | 0 (0.0%) | 0 (0.0%) |
| Bottled, Tank, or LP Gas | 0 (0.0%) | 0 (0.0%) |
| Electricity | 42 (100.0%) | 0 (0.0%) |
| Fuel Oil or Kerosene | 0 (0.0%) | 9 (100.0%) |
| Coal or Coke | 0 (0.0%) | 0 (0.0%) |
| All other Fuels | 0 (0.0%) | 0 (0.0%) |
| No Fuel Used | 0 (0.0%) | 0 (0.0%) |
| Total | 42 (100.0%) | 9 (100.0%) |
Household Vehicle Usage in Ware Place
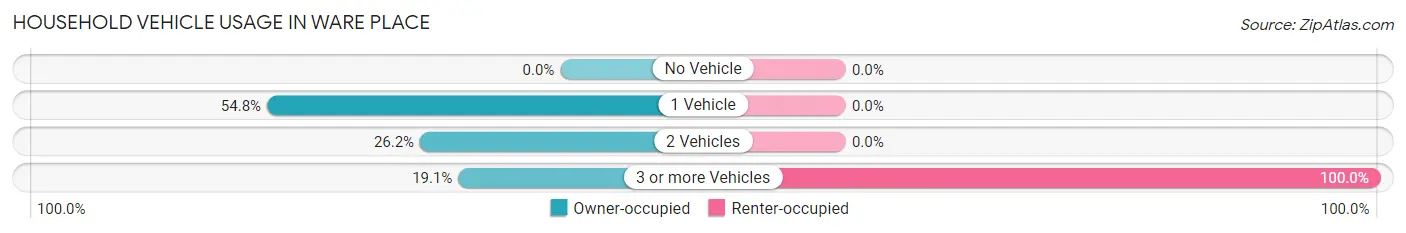
| Vehicles per Household | Owner-occupied | Renter-occupied |
| No Vehicle | 0 (0.0%) | 0 (0.0%) |
| 1 Vehicle | 23 (54.8%) | 0 (0.0%) |
| 2 Vehicles | 11 (26.2%) | 0 (0.0%) |
| 3 or more Vehicles | 8 (19.1%) | 9 (100.0%) |
| Total | 42 (100.0%) | 9 (100.0%) |
Real Estate & Mortgages in Ware Place
Real Estate and Mortgage Overview in Ware Place
| Characteristic | Without Mortgage | With Mortgage |
| Housing Units | 36 | 6 |
| Median Property Value | $76,700 | $0 |
| Median Household Income | - | - |
| Monthly Housing Costs | $312 | $0 |
| Real Estate Taxes | $199 | $0 |
Property Value by Mortgage Status in Ware Place
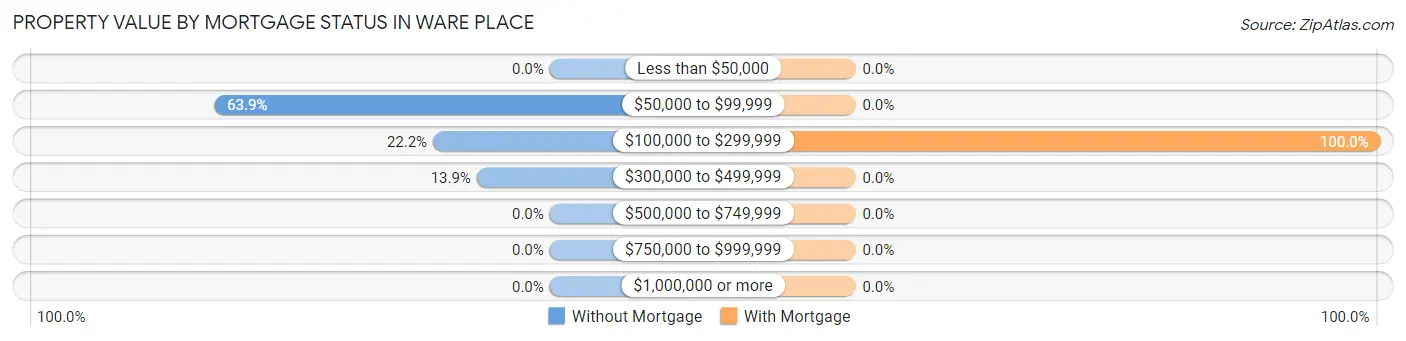
| Property Value | Without Mortgage | With Mortgage |
| Less than $50,000 | 0 (0.0%) | 0 (0.0%) |
| $50,000 to $99,999 | 23 (63.9%) | 0 (0.0%) |
| $100,000 to $299,999 | 8 (22.2%) | 6 (100.0%) |
| $300,000 to $499,999 | 5 (13.9%) | 0 (0.0%) |
| $500,000 to $749,999 | 0 (0.0%) | 0 (0.0%) |
| $750,000 to $999,999 | 0 (0.0%) | 0 (0.0%) |
| $1,000,000 or more | 0 (0.0%) | 0 (0.0%) |
| Total | 36 (100.0%) | 6 (100.0%) |
Household Income by Mortgage Status in Ware Place
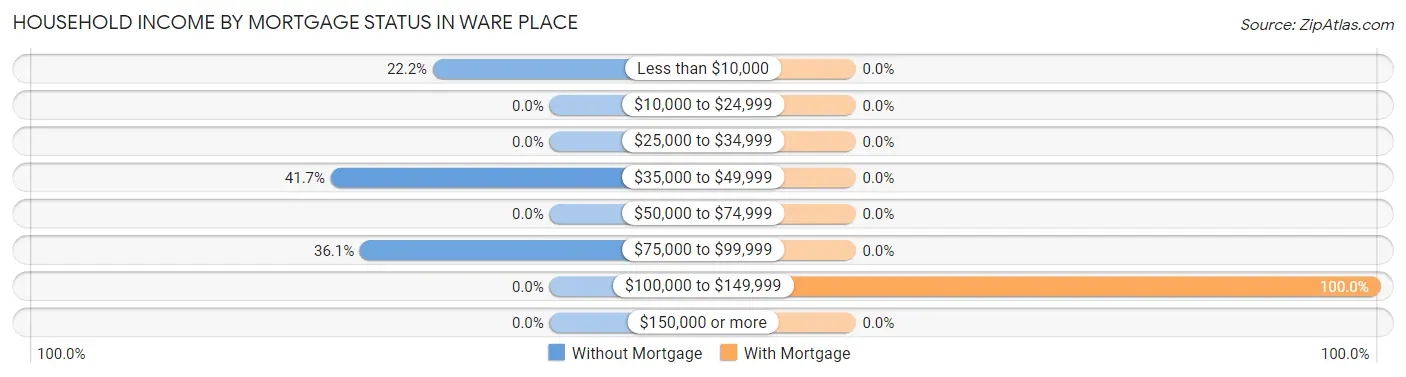
| Household Income | Without Mortgage | With Mortgage |
| Less than $10,000 | 8 (22.2%) | 0 (0.0%) |
| $10,000 to $24,999 | 0 (0.0%) | 0 (0.0%) |
| $25,000 to $34,999 | 0 (0.0%) | 0 (0.0%) |
| $35,000 to $49,999 | 15 (41.7%) | 0 (0.0%) |
| $50,000 to $74,999 | 0 (0.0%) | 0 (0.0%) |
| $75,000 to $99,999 | 13 (36.1%) | 0 (0.0%) |
| $100,000 to $149,999 | 0 (0.0%) | 6 (100.0%) |
| $150,000 or more | 0 (0.0%) | 0 (0.0%) |
| Total | 36 (100.0%) | 6 (100.0%) |
Property Value to Household Income Ratio in Ware Place
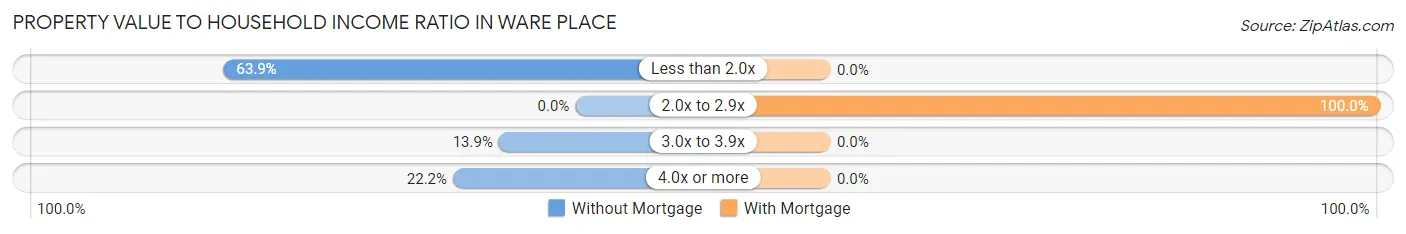
| Value-to-Income Ratio | Without Mortgage | With Mortgage |
| Less than 2.0x | 23 (63.9%) | 0 (0.0%) |
| 2.0x to 2.9x | 0 (0.0%) | 6 (100.0%) |
| 3.0x to 3.9x | 5 (13.9%) | 0 (0.0%) |
| 4.0x or more | 8 (22.2%) | 0 (0.0%) |
| Total | 36 (100.0%) | 6 (100.0%) |
Real Estate Taxes by Mortgage Status in Ware Place
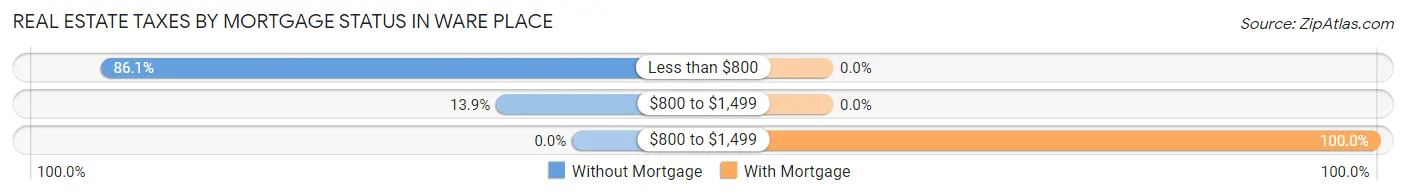
| Property Taxes | Without Mortgage | With Mortgage |
| Less than $800 | 31 (86.1%) | 0 (0.0%) |
| $800 to $1,499 | 5 (13.9%) | 0 (0.0%) |
| $800 to $1,499 | 0 (0.0%) | 6 (100.0%) |
| Total | 36 (100.0%) | 6 (100.0%) |
Health & Disability in Ware Place
Health Insurance Coverage by Age in Ware Place
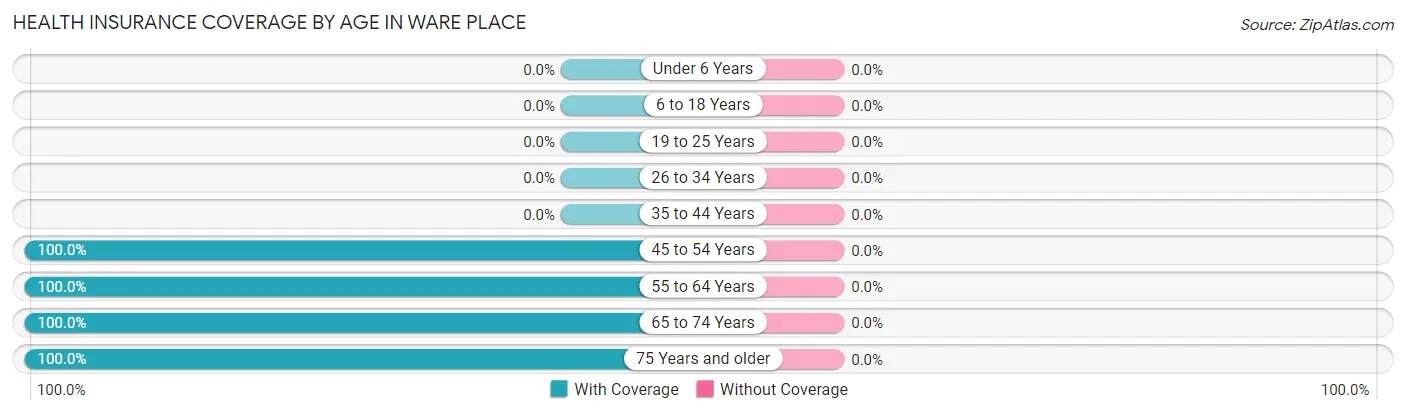
| Age Bracket | With Coverage | Without Coverage |
| Under 6 Years | 0 (0.0%) | 0 (0.0%) |
| 6 to 18 Years | 0 (0.0%) | 0 (0.0%) |
| 19 to 25 Years | 0 (0.0%) | 0 (0.0%) |
| 26 to 34 Years | 0 (0.0%) | 0 (0.0%) |
| 35 to 44 Years | 0 (0.0%) | 0 (0.0%) |
| 45 to 54 Years | 21 (100.0%) | 0 (0.0%) |
| 55 to 64 Years | 20 (100.0%) | 0 (0.0%) |
| 65 to 74 Years | 41 (100.0%) | 0 (0.0%) |
| 75 Years and older | 14 (100.0%) | 0 (0.0%) |
| Total | 96 (100.0%) | 0 (0.0%) |
Health Insurance Coverage by Citizenship Status in Ware Place
| Citizenship Status | With Coverage | Without Coverage |
| Native Born | 0 (0.0%) | 0 (0.0%) |
| Foreign Born, Citizen | 0 (0.0%) | 0 (0.0%) |
| Foreign Born, not a Citizen | 0 (0.0%) | 0 (0.0%) |
Health Insurance Coverage by Household Income in Ware Place
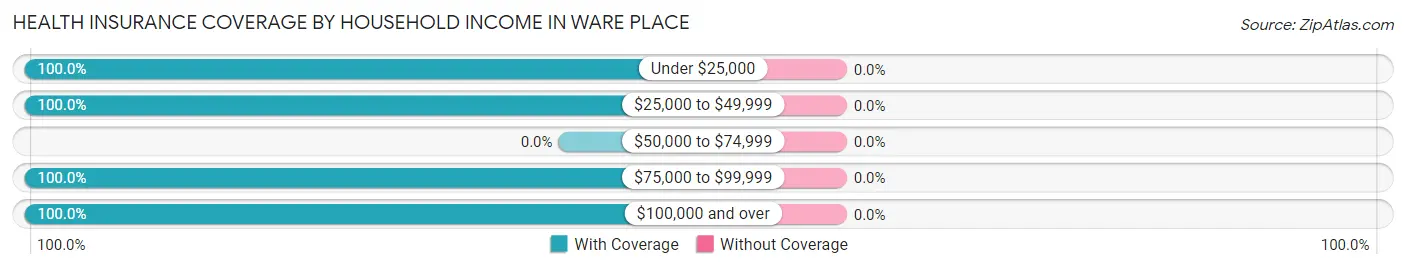
| Household Income | With Coverage | Without Coverage |
| Under $25,000 | 8 (100.0%) | 0 (0.0%) |
| $25,000 to $49,999 | 15 (100.0%) | 0 (0.0%) |
| $50,000 to $74,999 | 0 (0.0%) | 0 (0.0%) |
| $75,000 to $99,999 | 53 (100.0%) | 0 (0.0%) |
| $100,000 and over | 20 (100.0%) | 0 (0.0%) |
Public vs Private Health Insurance Coverage by Age in Ware Place
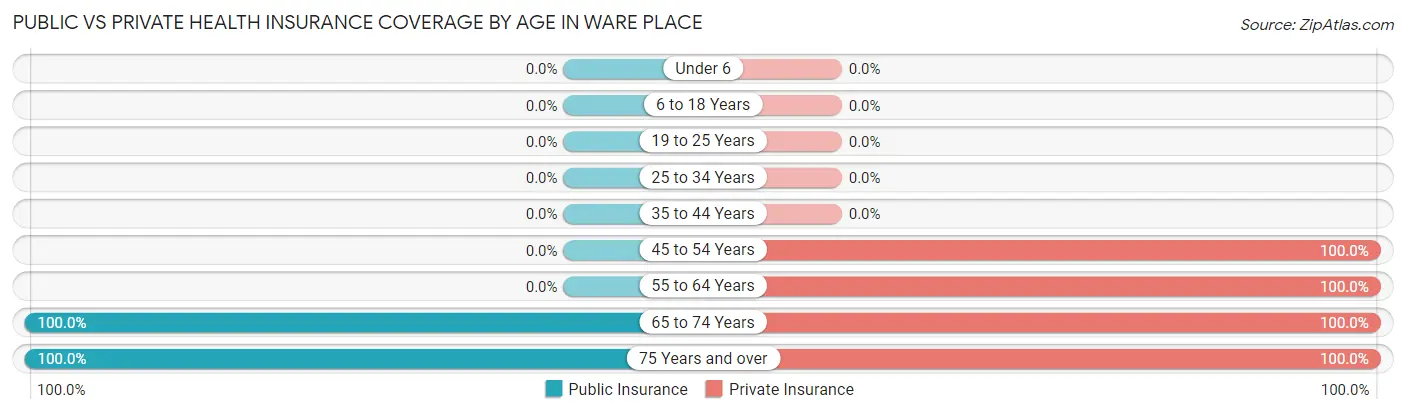
| Age Bracket | Public Insurance | Private Insurance |
| Under 6 | 0 (0.0%) | 0 (0.0%) |
| 6 to 18 Years | 0 (0.0%) | 0 (0.0%) |
| 19 to 25 Years | 0 (0.0%) | 0 (0.0%) |
| 25 to 34 Years | 0 (0.0%) | 0 (0.0%) |
| 35 to 44 Years | 0 (0.0%) | 0 (0.0%) |
| 45 to 54 Years | 0 (0.0%) | 21 (100.0%) |
| 55 to 64 Years | 0 (0.0%) | 20 (100.0%) |
| 65 to 74 Years | 41 (100.0%) | 41 (100.0%) |
| 75 Years and over | 14 (100.0%) | 14 (100.0%) |
| Total | 55 (57.3%) | 96 (100.0%) |
Disability Status by Sex by Age in Ware Place
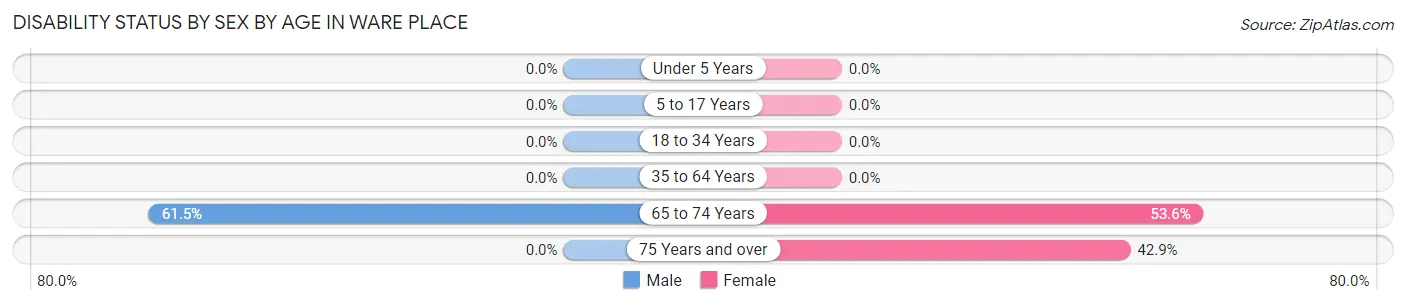
| Age Bracket | Male | Female |
| Under 5 Years | 0 (0.0%) | 0 (0.0%) |
| 5 to 17 Years | 0 (0.0%) | 0 (0.0%) |
| 18 to 34 Years | 0 (0.0%) | 0 (0.0%) |
| 35 to 64 Years | 0 (0.0%) | 0 (0.0%) |
| 65 to 74 Years | 8 (61.5%) | 15 (53.6%) |
| 75 Years and over | 0 (0.0%) | 6 (42.9%) |
Disability Class by Sex by Age in Ware Place
Disability Class: Hearing Difficulty
| Age Bracket | Male | Female |
| Under 5 Years | 0 (0.0%) | 0 (0.0%) |
| 5 to 17 Years | 0 (0.0%) | 0 (0.0%) |
| 18 to 34 Years | 0 (0.0%) | 0 (0.0%) |
| 35 to 64 Years | 0 (0.0%) | 0 (0.0%) |
| 65 to 74 Years | 0 (0.0%) | 0 (0.0%) |
| 75 Years and over | 0 (0.0%) | 0 (0.0%) |
Disability Class: Vision Difficulty
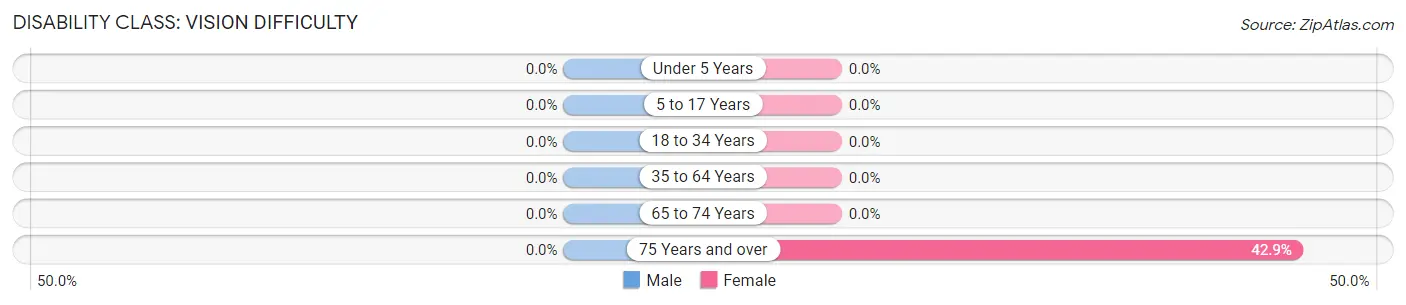
| Age Bracket | Male | Female |
| Under 5 Years | 0 (0.0%) | 0 (0.0%) |
| 5 to 17 Years | 0 (0.0%) | 0 (0.0%) |
| 18 to 34 Years | 0 (0.0%) | 0 (0.0%) |
| 35 to 64 Years | 0 (0.0%) | 0 (0.0%) |
| 65 to 74 Years | 0 (0.0%) | 0 (0.0%) |
| 75 Years and over | 0 (0.0%) | 6 (42.9%) |
Disability Class: Cognitive Difficulty
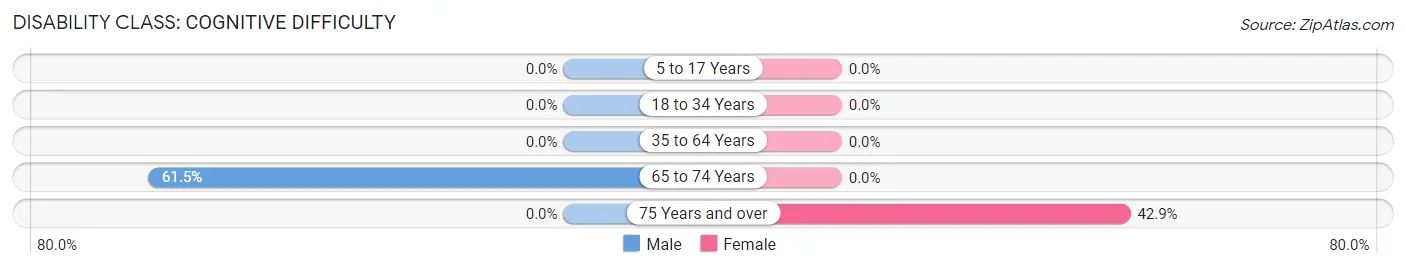
| Age Bracket | Male | Female |
| 5 to 17 Years | 0 (0.0%) | 0 (0.0%) |
| 18 to 34 Years | 0 (0.0%) | 0 (0.0%) |
| 35 to 64 Years | 0 (0.0%) | 0 (0.0%) |
| 65 to 74 Years | 8 (61.5%) | 0 (0.0%) |
| 75 Years and over | 0 (0.0%) | 6 (42.9%) |
Disability Class: Ambulatory Difficulty
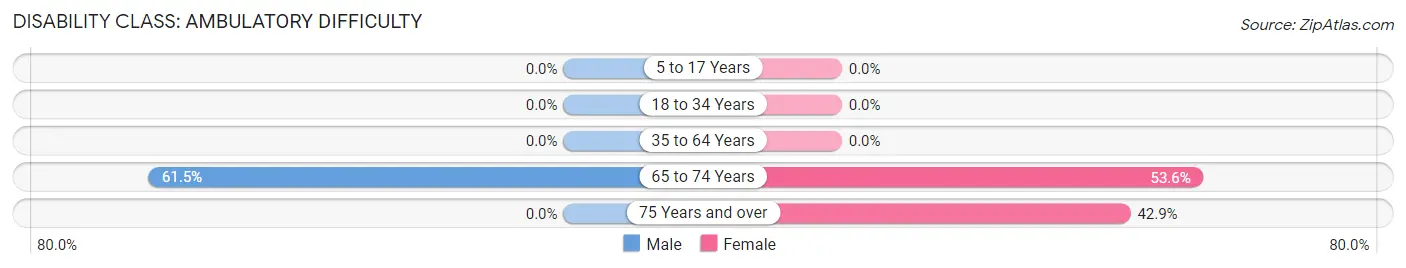
| Age Bracket | Male | Female |
| 5 to 17 Years | 0 (0.0%) | 0 (0.0%) |
| 18 to 34 Years | 0 (0.0%) | 0 (0.0%) |
| 35 to 64 Years | 0 (0.0%) | 0 (0.0%) |
| 65 to 74 Years | 8 (61.5%) | 15 (53.6%) |
| 75 Years and over | 0 (0.0%) | 6 (42.9%) |
Disability Class: Self-Care Difficulty
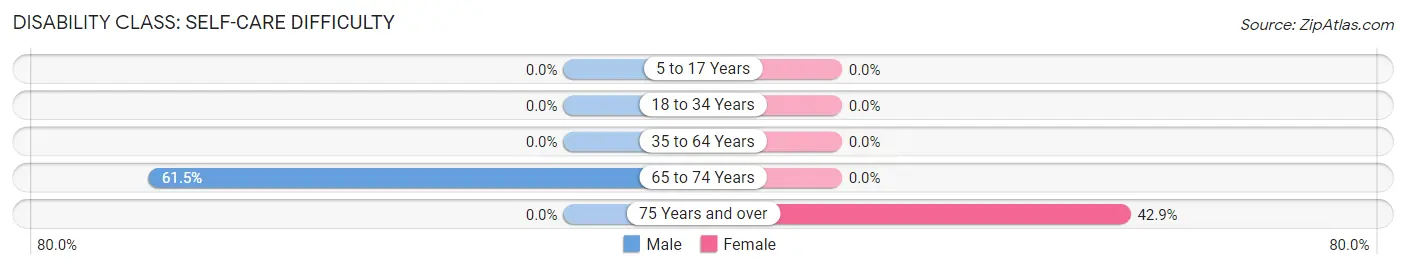
| Age Bracket | Male | Female |
| 5 to 17 Years | 0 (0.0%) | 0 (0.0%) |
| 18 to 34 Years | 0 (0.0%) | 0 (0.0%) |
| 35 to 64 Years | 0 (0.0%) | 0 (0.0%) |
| 65 to 74 Years | 8 (61.5%) | 0 (0.0%) |
| 75 Years and over | 0 (0.0%) | 6 (42.9%) |
Technology Access in Ware Place
Computing Device Access in Ware Place
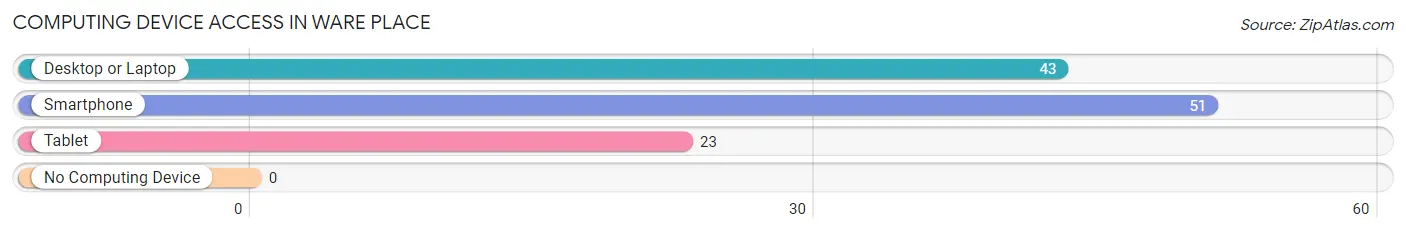
| Device Type | # Households | % Households |
| Desktop or Laptop | 43 | 84.3% |
| Smartphone | 51 | 100.0% |
| Tablet | 23 | 45.1% |
| No Computing Device | 0 | 0.0% |
| Total | 51 | 100.0% |
Internet Access in Ware Place
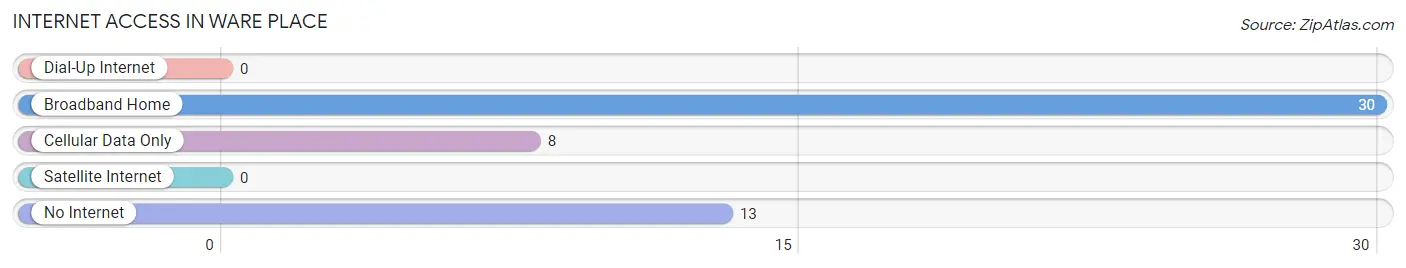
| Internet Type | # Households | % Households |
| Dial-Up Internet | 0 | 0.0% |
| Broadband Home | 30 | 58.8% |
| Cellular Data Only | 8 | 15.7% |
| Satellite Internet | 0 | 0.0% |
| No Internet | 13 | 25.5% |
| Total | 51 | 100.0% |
Ware Place Summary
Ware Place is an unincorporated community located in Spartanburg County, South Carolina. It is situated in the foothills of the Blue Ridge Mountains, approximately 20 miles northwest of Spartanburg. The community is bordered by the towns of Boiling Springs and Inman, and is part of the Spartanburg Metropolitan Statistical Area.
History
The area that is now Ware Place was first settled in the late 1700s by the Ware family, who were among the first settlers in the area. The community was named after the family, and the original settlement was located near the intersection of what is now Highway 9 and Highway 11. The area was largely agricultural, and the Ware family operated a cotton gin and grist mill in the area.
In the late 1800s, the community began to grow as the railroad was extended through the area. The railroad brought new businesses and industries to the area, and Ware Place became a thriving community. The town had a post office, a general store, a blacksmith shop, and several churches.
Geography
Ware Place is located in the foothills of the Blue Ridge Mountains in Spartanburg County, South Carolina. The community is situated at an elevation of 890 feet above sea level. The area is characterized by rolling hills and valleys, and is home to several creeks and streams. The climate is mild, with temperatures ranging from the mid-50s in the winter to the mid-80s in the summer.
Economy
The economy of Ware Place is largely based on agriculture. The area is home to several farms, and the community is known for its production of cotton, corn, soybeans, and other crops. In addition, the area is home to several small businesses, including a general store, a gas station, and a few restaurants.
Demographics
As of the 2010 census, the population of Ware Place was 1,845. The racial makeup of the community was 94.3% White, 3.2% African American, 0.7% Native American, 0.3% Asian, and 1.5% from other races. The median household income was $37,917, and the median home value was $133,000. The median age was 38.7 years.
Conclusion
Ware Place is a small, unincorporated community located in Spartanburg County, South Carolina. The area has a rich history, and was first settled by the Ware family in the late 1700s. The economy of the area is largely based on agriculture, and the community is home to several small businesses. The population of Ware Place is 1,845, and the median household income is $37,917.
Common Questions
What is Per Capita Income in Ware Place?
Per Capita income in Ware Place is $40,831.
What is the Median Family Income in Ware Place?
Median Family Income in Ware Place is $97,500.
What is the Median Household income in Ware Place?
Median Household Income in Ware Place is $88,542.
What is Inequality or Gini Index in Ware Place?
Inequality or Gini Index in Ware Place is 0.33.
What is the Total Population of Ware Place?
Total Population of Ware Place is 96.
What is the Total Male Population of Ware Place?
Total Male Population of Ware Place is 37.
What is the Total Female Population of Ware Place?
Total Female Population of Ware Place is 59.
What is the Ratio of Males per 100 Females in Ware Place?
There are 62.71 Males per 100 Females in Ware Place.
What is the Ratio of Females per 100 Males in Ware Place?
There are 159.46 Females per 100 Males in Ware Place.
What is the Median Population Age in Ware Place?
Median Population Age in Ware Place is 70.9 Years.
What is the Average Family Size in Ware Place
Average Family Size in Ware Place is 2.6 People.
What is the Average Household Size in Ware Place
Average Household Size in Ware Place is 1.9 People.
How Large is the Labor Force in Ware Place?
There are 49 People in the Labor Forcein in Ware Place.
What is the Percentage of People in the Labor Force in Ware Place?
51.0% of People are in the Labor Force in Ware Place.