Zip Codes with the Highest Percentage of Population with a Degree in Physical and Health Sciences in Portland, OR

RELATED REPORTS & OPTIONS

Physical and Health Sciences
Population
Families and Households
Female Fertility
Female Fertility (Unmarried)
Race (Community Size)
Race (Percentage)
Ancestry (Community Size)
AfghanAfricanAlaska NativeAlaskan AthabascanAlbanianAleutAlsatianAmericanApacheArabArgentineanArmenianAustralianAustrianBahamianBangladeshiBasqueBelgianBelizeanBhutaneseBlackfeetBolivianBrazilianBritishBritish West IndianBulgarianBurmeseCajunCambodianCanadianCelticCentral AmericanCentral American IndianCherokeeCheyenneChickasawChileanChineseChippewaChoctawColombianColvilleCosta RicanCreeCreekCroatianCubanCzechCzechoslovakianDanishDelawareDominicanDutchEastern EuropeanEcuadorianEgyptianEnglishEstonianEthiopianEuropeanFijianFilipinoFinnishFrenchFrench American IndianFrench CanadianGermanGerman RussianGhanaianGreekGuamanian / ChamorroGuatemalanGuyaneseHaitianHonduranHopiHungarianIcelanderIndian (Asian)IndonesianInupiatIranianIraqiIrishIroquoisIsraeliItalianJamaicanJapaneseJordanianKenyanKoreanLaotianLatvianLebaneseLiberianLithuanianLumbeeLuxembourgerMacedonianMalaysianMalteseMarshalleseMexicanMexican American IndianMongolianMoroccanNative HawaiianNavajoNepaleseNew ZealanderNicaraguanNigerianNorthern EuropeanNorwegianOkinawanOsagePaiutePakistaniPalestinianPanamanianParaguayanPennsylvania GermanPeruvianPimaPolishPortuguesePotawatomiPuebloPuerto RicanPuget Sound SalishRomanianRussianSalvadoranSamoanScandinavianScotch-IrishScottishSeminoleSenegaleseSerbianShoshoneSierra LeoneanSiouxSlavicSlovakSloveneSomaliSouth AfricanSouth AmericanSouth American IndianSoviet UnionSpaniardSpanishSpanish AmericanSpanish American IndianSri LankanSubsaharan AfricanSwedishSwissSyrianThaiTlingit-HaidaTonganTrinidadian and TobagonianTsimshianTurkishUgandanUkrainianUruguayanUteVenezuelanVietnameseWelshWest IndianYakamaYaquiYugoslavianYup'ik
Ancestry (Percentage)
AfghanAfricanAlaska NativeAlaskan AthabascanAlbanianAleutAlsatianAmericanApacheArabArgentineanArmenianAustralianAustrianBahamianBangladeshiBasqueBelgianBelizeanBhutaneseBlackfeetBolivianBrazilianBritishBritish West IndianBulgarianBurmeseCajunCambodianCanadianCelticCentral AmericanCentral American IndianCherokeeCheyenneChickasawChileanChineseChippewaChoctawColombianColvilleCosta RicanCreeCreekCroatianCubanCzechCzechoslovakianDanishDelawareDominicanDutchEastern EuropeanEcuadorianEgyptianEnglishEstonianEthiopianEuropeanFijianFilipinoFinnishFrenchFrench American IndianFrench CanadianGermanGerman RussianGhanaianGreekGuamanian / ChamorroGuatemalanGuyaneseHaitianHonduranHopiHungarianIcelanderIndian (Asian)IndonesianInupiatIranianIraqiIrishIroquoisIsraeliItalianJamaicanJapaneseJordanianKenyanKoreanLaotianLatvianLebaneseLiberianLithuanianLumbeeLuxembourgerMacedonianMalaysianMalteseMarshalleseMexicanMexican American IndianMongolianMoroccanNative HawaiianNavajoNepaleseNew ZealanderNicaraguanNigerianNorthern EuropeanNorwegianOkinawanOsagePaiutePakistaniPalestinianPanamanianParaguayanPennsylvania GermanPeruvianPimaPolishPortuguesePotawatomiPuebloPuerto RicanPuget Sound SalishRomanianRussianSalvadoranSamoanScandinavianScotch-IrishScottishSeminoleSenegaleseSerbianShoshoneSierra LeoneanSiouxSlavicSlovakSloveneSomaliSouth AfricanSouth AmericanSouth American IndianSoviet UnionSpaniardSpanishSpanish AmericanSpanish American IndianSri LankanSubsaharan AfricanSwedishSwissSyrianThaiTlingit-HaidaTonganTrinidadian and TobagonianTsimshianTurkishUgandanUkrainianUruguayanUteVenezuelanVietnameseWelshWest IndianYakamaYaquiYugoslavianYup'ik
Immigrant Origin (Total)
AfghanistanAfricaArgentinaArmeniaAsiaAustraliaAustriaBahamasBangladeshBarbadosBelarusBelgiumBelizeBosnia and HerzegovinaBrazilBulgariaBurma / MyanmarCambodiaCameroonCanadaCaribbeanCentral AmericaChileChinaColombiaCongoCosta RicaCroatiaCubaCzechoslovakiaDenmarkDominican RepublicEastern AfricaEastern AsiaEastern EuropeEcuadorEgyptEl SalvadorEnglandEritreaEthiopiaEuropeFijiFranceGermanyGhanaGreeceGuatemalaHaitiHondurasHong KongHungaryIndiaIndonesiaIranIraqIrelandIsraelItalyJamaicaJapanJordanKazakhstanKenyaKoreaKuwaitLaosLatin AmericaLatviaLebanonLiberiaLithuaniaMalaysiaMexicoMicronesiaMiddle AfricaMoldovaMoroccoNepalNetherlandsNicaraguaNigeriaNorth MacedoniaNorthern AfricaNorthern EuropeNorwayOceaniaPakistanPanamaPeruPhilippinesPolandPortugalRomaniaRussiaSaudi ArabiaScotlandSerbiaSingaporeSomaliaSouth AfricaSouth AmericaSouth Central AsiaSouth Eastern AsiaSouthern EuropeSpainSri LankaSudanSwedenSwitzerlandSyriaTaiwanThailandTrinidad and TobagoTurkeyUgandaUkraineUruguayUzbekistanVenezuelaVietnamWestern AfricaWestern AsiaWestern EuropeYemen
Immigrant Origin (Percentage)
AfghanistanAfricaArgentinaArmeniaAsiaAustraliaAustriaBahamasBangladeshBarbadosBelarusBelgiumBelizeBosnia and HerzegovinaBrazilBulgariaBurma / MyanmarCambodiaCameroonCanadaCaribbeanCentral AmericaChileChinaColombiaCongoCosta RicaCroatiaCubaCzechoslovakiaDenmarkDominican RepublicEastern AfricaEastern AsiaEastern EuropeEcuadorEgyptEl SalvadorEnglandEritreaEthiopiaEuropeFijiFranceGermanyGhanaGreeceGuatemalaHaitiHondurasHong KongHungaryIndiaIndonesiaIranIraqIrelandIsraelItalyJamaicaJapanJordanKazakhstanKenyaKoreaKuwaitLaosLatin AmericaLatviaLebanonLiberiaLithuaniaMalaysiaMexicoMicronesiaMiddle AfricaMoldovaMoroccoNepalNetherlandsNicaraguaNigeriaNorth MacedoniaNorthern AfricaNorthern EuropeNorwayOceaniaPakistanPanamaPeruPhilippinesPolandPortugalRomaniaRussiaSaudi ArabiaScotlandSerbiaSingaporeSomaliaSouth AfricaSouth AmericaSouth Central AsiaSouth Eastern AsiaSouthern EuropeSpainSri LankaSudanSwedenSwitzerlandSyriaTaiwanThailandTrinidad and TobagoTurkeyUgandaUkraineUruguayUzbekistanVenezuelaVietnamWestern AfricaWestern AsiaWestern EuropeYemen
Income
Income (Families)
Income (Households)
Poverty
Poverty (Families)
Unemployment
Employment Occupations
Employment Industries
Employer Class
Commute Time
Commute Means
School Enrollment
Education by Degree Field
Occupancy
Finances
Physical Characteristics
Portland
Compare Zip Codes
Comparison Subject

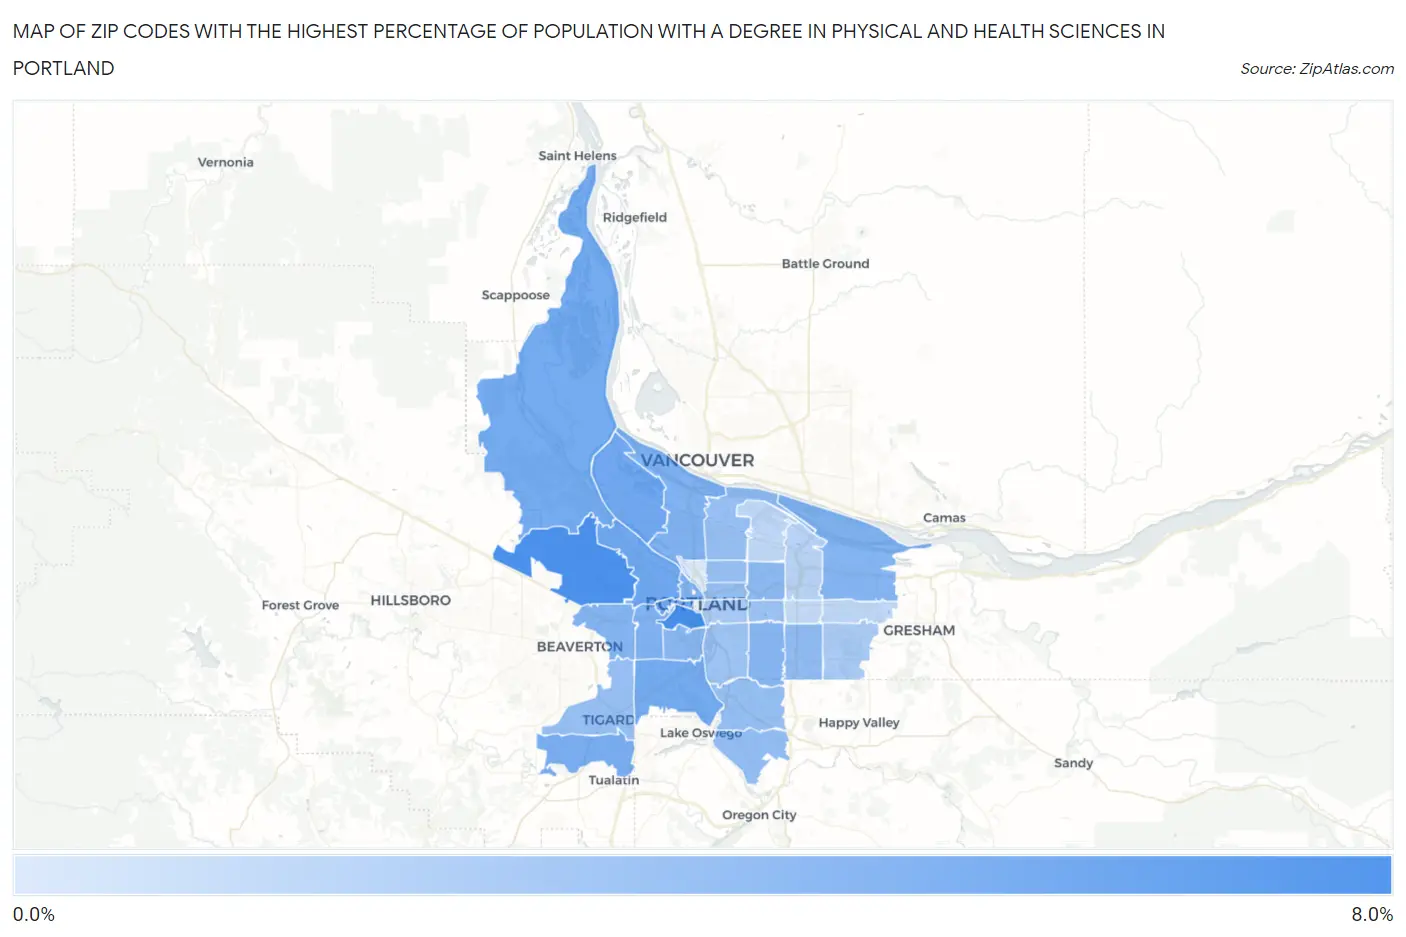
Map of Zip Codes with the Highest Percentage of Population with a Degree in Physical and Health Sciences in Portland

0.0%
8.0%
Zip Codes with the Highest Percentage of Population with a Degree in Physical and Health Sciences in Portland Map

Zip Codes with the Highest Percentage of Population with a Degree in Physical and Health Sciences in Portland, OR

Zip Code % Graduates vs State vs National
1.972016.0%3.9%(+2.11)#703.1%(+2.91)#3,254
2.972295.9%3.9%(+1.98)#743.1%(+2.78)#3,388
3.972104.7%3.9%(+0.754)#1173.1%(+1.55)#5,206
4.972054.6%3.9%(+0.710)#1223.1%(+1.51)#5,297
5.972034.6%3.9%(+0.708)#1233.1%(+1.51)#5,302
6.972194.5%3.9%(+0.609)#1273.1%(+1.41)#5,508
7.972314.5%3.9%(+0.604)#1283.1%(+1.40)#5,527
8.972244.3%3.9%(+0.446)#1323.1%(+1.25)#5,873
9.972214.1%3.9%(+0.202)#1433.1%(+1.00)#6,460
10.972094.1%3.9%(+0.160)#1483.1%(+0.960)#6,576
11.972174.1%3.9%(+0.160)#1493.1%(+0.960)#6,577
12.972304.0%3.9%(+0.079)#1563.1%(+0.879)#6,822
13.972253.9%3.9%(+0.022)#1593.1%(+0.822)#6,967
14.972063.9%3.9%(-0.011)#1633.1%(+0.789)#7,086
15.972393.8%3.9%(-0.101)#1663.1%(+0.699)#7,372
16.972133.6%3.9%(-0.286)#1753.1%(+0.514)#8,016
17.972663.6%3.9%(-0.334)#1793.1%(+0.466)#8,190
18.972673.5%3.9%(-0.376)#1803.1%(+0.424)#8,346
19.972223.4%3.9%(-0.450)#1873.1%(+0.350)#8,615
20.972323.4%3.9%(-0.496)#1883.1%(+0.304)#8,782
21.972123.4%3.9%(-0.530)#1913.1%(+0.270)#8,918
22.972113.4%3.9%(-0.546)#1923.1%(+0.254)#8,985
23.972233.3%3.9%(-0.558)#1933.1%(+0.242)#9,024
24.972153.2%3.9%(-0.679)#1993.1%(+0.121)#9,505
25.972023.1%3.9%(-0.781)#2043.1%(+0.019)#9,913
26.972142.7%3.9%(-1.16)#2153.1%(-0.357)#11,584
27.972362.7%3.9%(-1.18)#2193.1%(-0.376)#11,676
28.972202.3%3.9%(-1.60)#2333.1%(-0.803)#13,696
29.972182.1%3.9%(-1.83)#2433.1%(-1.03)#14,816
30.972332.0%3.9%(-1.86)#2443.1%(-1.06)#14,925
31.972161.9%3.9%(-2.00)#2513.1%(-1.20)#15,552
32.972271.1%3.9%(-2.80)#2723.1%(-2.00)#18,892

Common Questions

What are the Top 10 Zip Codes with the Highest Percentage of Population with a Degree in Physical and Health Sciences in Portland, OR?
Top 10 Zip Codes with the Highest Percentage of Population with a Degree in Physical and Health Sciences in Portland, OR are:
#1
6.0%
#2
5.9%
#3
4.7%
#4
4.6%
#5
4.6%
#6
4.5%
#7
4.5%
#8
4.3%
#9
4.1%
#10
4.1%
What zip code has the Highest Percentage of Population with a Degree in Physical and Health Sciences in Portland, OR?
97201 has the Highest Percentage of Population with a Degree in Physical and Health Sciences in Portland, OR with 6.0%.
What is the Percentage of Population with a Degree in Physical and Health Sciences in Portland, OR?
Percentage of Population with a Degree in Physical and Health Sciences in Portland is 3.6%.
What is the Percentage of Population with a Degree in Physical and Health Sciences in Oregon?
Percentage of Population with a Degree in Physical and Health Sciences in Oregon is 3.9%.
What is the Percentage of Population with a Degree in Physical and Health Sciences in the United States?
Percentage of Population with a Degree in Physical and Health Sciences in the United States is 3.1%.