Mill City, OR Map & Demographics
Mill City Map
Mill City Overview
$25,858
PER CAPITA INCOME
$76,295
AVG FAMILY INCOME
$73,625
AVG HOUSEHOLD INCOME
53.6%
WAGE / INCOME GAP [ % ]
46.4¢/ $1
WAGE / INCOME GAP [ $ ]
0.36
INEQUALITY / GINI INDEX
1,760
TOTAL POPULATION
861
MALE POPULATION
899
FEMALE POPULATION
95.77
MALES / 100 FEMALES
104.41
FEMALES / 100 MALES
35.8
MEDIAN AGE
3.5
AVG FAMILY SIZE
3.0
AVG HOUSEHOLD SIZE
786
LABOR FORCE [ PEOPLE ]
58.3%
PERCENT IN LABOR FORCE
9.9%
UNEMPLOYMENT RATE
Mill City Zip Codes
Income in Mill City
Income Overview in Mill City
Per Capita Income in Mill City is $25,858, while median incomes of families and households are $76,295 and $73,625 respectively.
| Characteristic | Number | Measure |
| Per Capita Income | 1,760 | $25,858 |
| Median Family Income | 419 | $76,295 |
| Mean Family Income | 419 | $82,650 |
| Median Household Income | 597 | $73,625 |
| Mean Household Income | 597 | $75,230 |
| Income Deficit | 419 | $0 |
| Wage / Income Gap (%) | 1,760 | 53.56% |
| Wage / Income Gap ($) | 1,760 | 46.44¢ per $1 |
| Gini / Inequality Index | 1,760 | 0.36 |
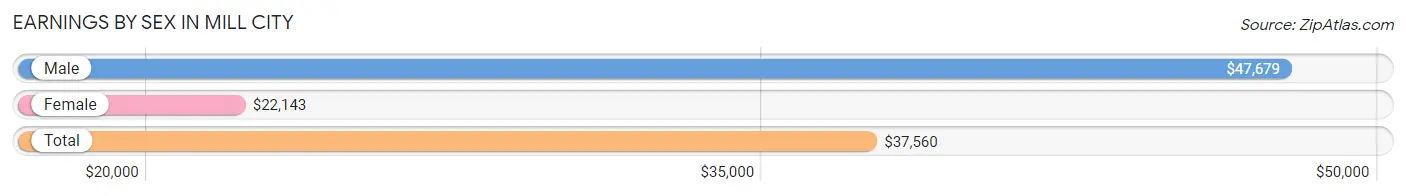
Earnings by Sex in Mill City
Average Earnings in Mill City are $37,560, $47,679 for men and $22,143 for women, a difference of 53.6%.
| Sex | Number | Average Earnings |
| Male | 422 (52.1%) | $47,679 |
| Female | 388 (47.9%) | $22,143 |
| Total | 810 (100.0%) | $37,560 |
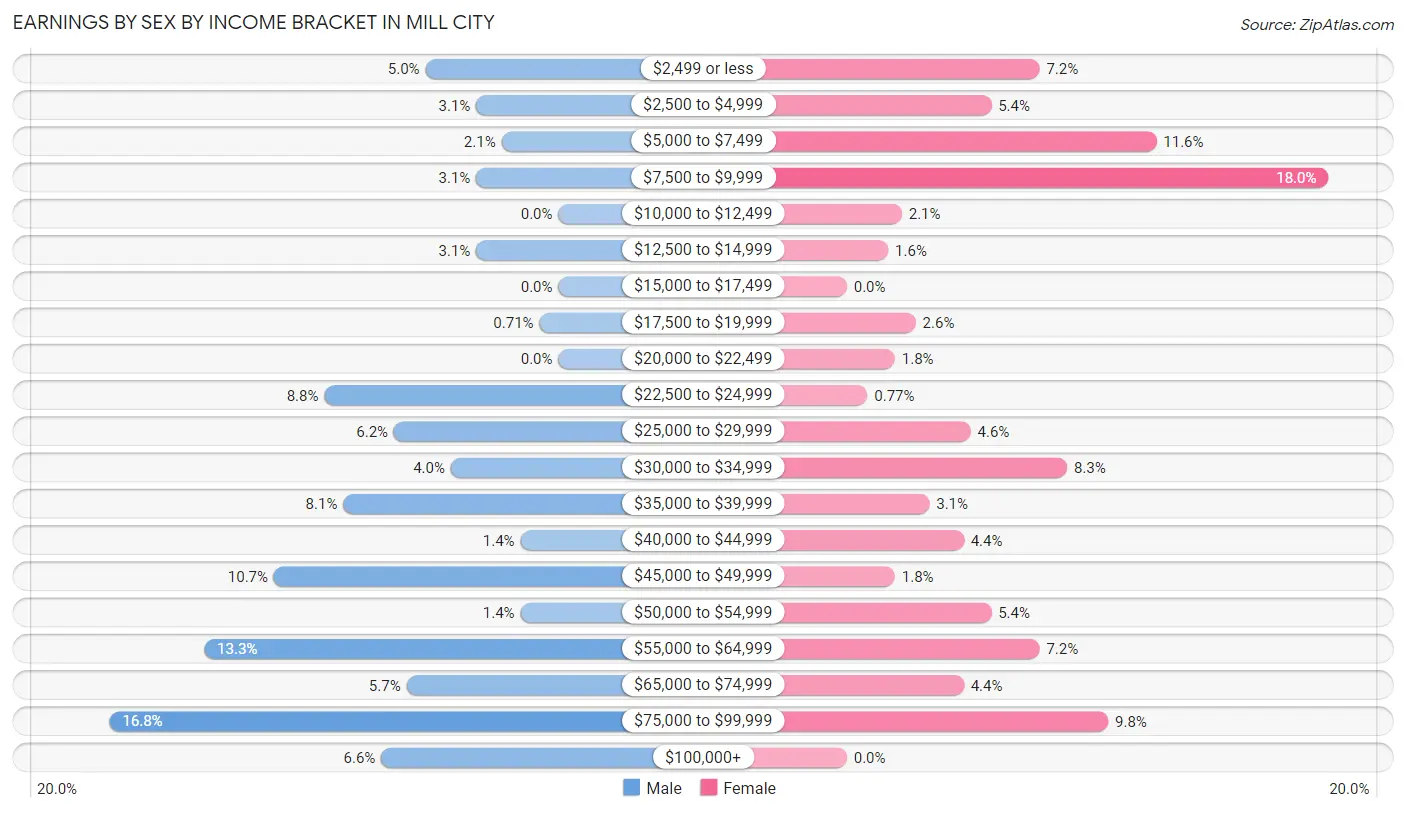
Earnings by Sex by Income Bracket in Mill City
The most common earnings brackets in Mill City are $75,000 to $99,999 for men (71 | 16.8%) and $7,500 to $9,999 for women (70 | 18.0%).
| Income | Male | Female |
| $2,499 or less | 21 (5.0%) | 28 (7.2%) |
| $2,500 to $4,999 | 13 (3.1%) | 21 (5.4%) |
| $5,000 to $7,499 | 9 (2.1%) | 45 (11.6%) |
| $7,500 to $9,999 | 13 (3.1%) | 70 (18.0%) |
| $10,000 to $12,499 | 0 (0.0%) | 8 (2.1%) |
| $12,500 to $14,999 | 13 (3.1%) | 6 (1.5%) |
| $15,000 to $17,499 | 0 (0.0%) | 0 (0.0%) |
| $17,500 to $19,999 | 3 (0.7%) | 10 (2.6%) |
| $20,000 to $22,499 | 0 (0.0%) | 7 (1.8%) |
| $22,500 to $24,999 | 37 (8.8%) | 3 (0.8%) |
| $25,000 to $29,999 | 26 (6.2%) | 18 (4.6%) |
| $30,000 to $34,999 | 17 (4.0%) | 32 (8.3%) |
| $35,000 to $39,999 | 34 (8.1%) | 12 (3.1%) |
| $40,000 to $44,999 | 6 (1.4%) | 17 (4.4%) |
| $45,000 to $49,999 | 45 (10.7%) | 7 (1.8%) |
| $50,000 to $54,999 | 6 (1.4%) | 21 (5.4%) |
| $55,000 to $64,999 | 56 (13.3%) | 28 (7.2%) |
| $65,000 to $74,999 | 24 (5.7%) | 17 (4.4%) |
| $75,000 to $99,999 | 71 (16.8%) | 38 (9.8%) |
| $100,000+ | 28 (6.6%) | 0 (0.0%) |
| Total | 422 (100.0%) | 388 (100.0%) |
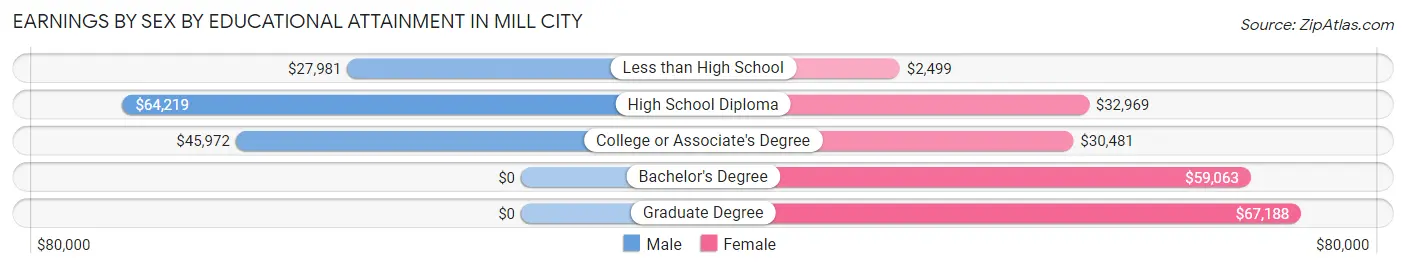
Earnings by Sex by Educational Attainment in Mill City
Average earnings in Mill City are $48,839 for men and $32,697 for women, a difference of 33.1%. Men with an educational attainment of high school diploma enjoy the highest average annual earnings of $64,219, while those with less than high school education earn the least with $27,981. Women with an educational attainment of graduate degree earn the most with the average annual earnings of $67,188, while those with less than high school education have the smallest earnings of $2,499.
| Educational Attainment | Male Income | Female Income |
| Less than High School | $27,981 | $2,499 |
| High School Diploma | $64,219 | $32,969 |
| College or Associate's Degree | $45,972 | $30,481 |
| Bachelor's Degree | - | - |
| Graduate Degree | - | - |
| Total | $48,839 | $32,697 |
Family Income in Mill City
Family Income Brackets in Mill City
According to the Mill City family income data, there are 103 families falling into the $50,000 to $74,999 income range, which is the most common income bracket and makes up 24.6% of all families. Conversely, the less than $10,000 income bracket is the least frequent group with only 6 families (1.4%) belonging to this category.
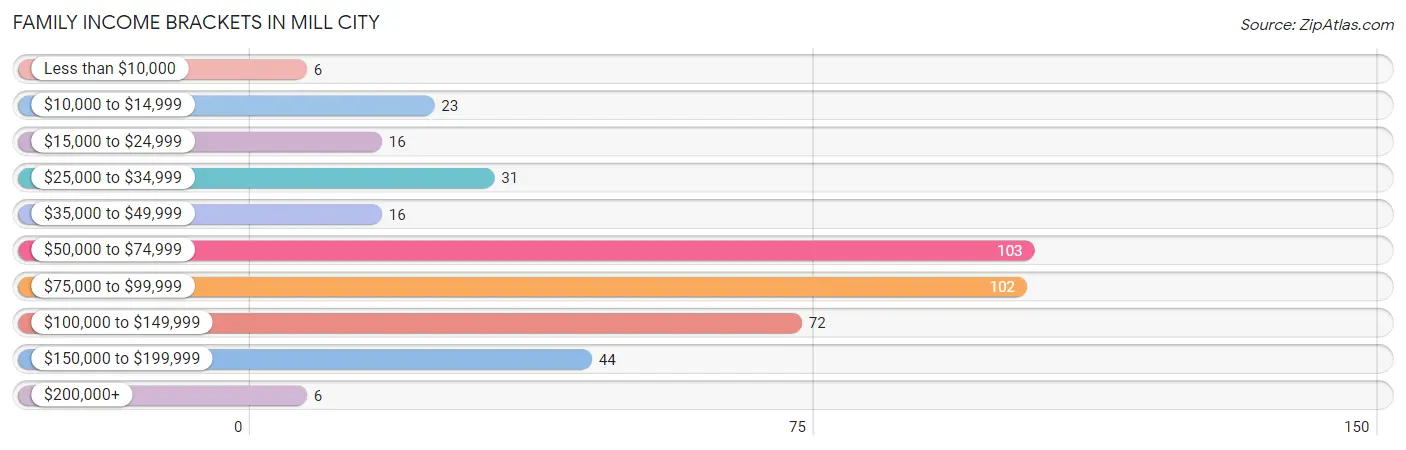
| Income Bracket | # Families | % Families |
| Less than $10,000 | 6 | 1.4% |
| $10,000 to $14,999 | 23 | 5.5% |
| $15,000 to $24,999 | 16 | 3.8% |
| $25,000 to $34,999 | 31 | 7.4% |
| $35,000 to $49,999 | 16 | 3.8% |
| $50,000 to $74,999 | 103 | 24.6% |
| $75,000 to $99,999 | 102 | 24.3% |
| $100,000 to $149,999 | 72 | 17.2% |
| $150,000 to $199,999 | 44 | 10.5% |
| $200,000+ | 6 | 1.4% |
Family Income by Famaliy Size in Mill City
5-person families (43 | 10.3%) account for the highest median family income in Mill City with $121,875 per family, while 2-person families (155 | 37.0%) have the highest median income of $32,812 per family member.
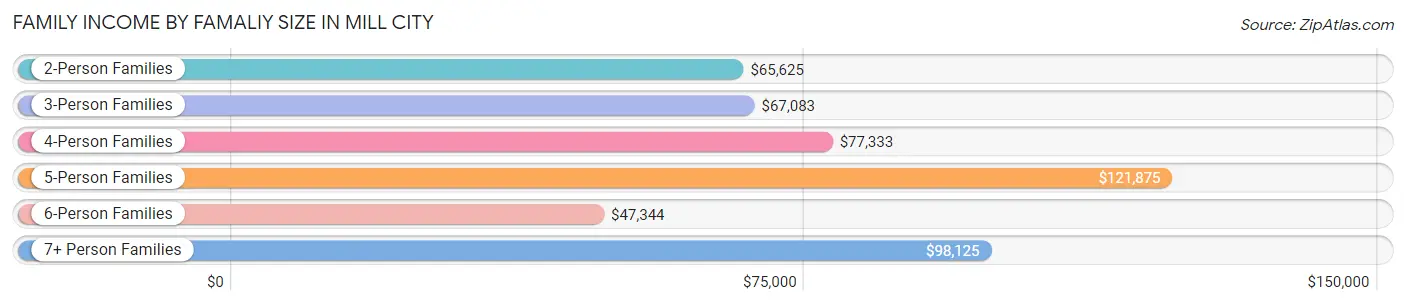
| Income Bracket | # Families | Median Income |
| 2-Person Families | 155 (37.0%) | $65,625 |
| 3-Person Families | 81 (19.3%) | $67,083 |
| 4-Person Families | 102 (24.3%) | $77,333 |
| 5-Person Families | 43 (10.3%) | $121,875 |
| 6-Person Families | 15 (3.6%) | $47,344 |
| 7+ Person Families | 23 (5.5%) | $98,125 |
| Total | 419 (100.0%) | $76,295 |
Family Income by Number of Earners in Mill City
The median family income in Mill City is $76,295, with families comprising 3+ earners (75) having the highest median family income of $163,173, while families with no earners (44) have the lowest median family income of $58,750, accounting for 17.9% and 10.5% of families, respectively.
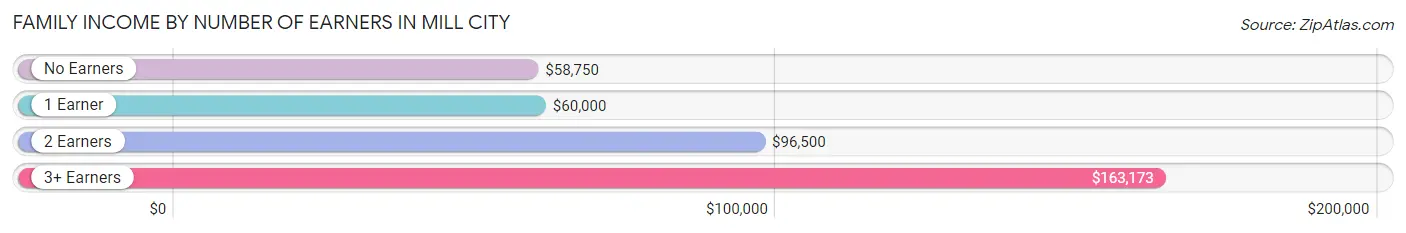
| Number of Earners | # Families | Median Income |
| No Earners | 44 (10.5%) | $58,750 |
| 1 Earner | 174 (41.5%) | $60,000 |
| 2 Earners | 126 (30.1%) | $96,500 |
| 3+ Earners | 75 (17.9%) | $163,173 |
| Total | 419 (100.0%) | $76,295 |
Household Income in Mill City
Household Income Brackets in Mill City
With 126 households falling in the category, the $75,000 to $99,999 income range is the most frequent in Mill City, accounting for 21.1% of all households. In contrast, only 6 households (1.0%) fall into the $200,000+ income bracket, making it the least populous group.
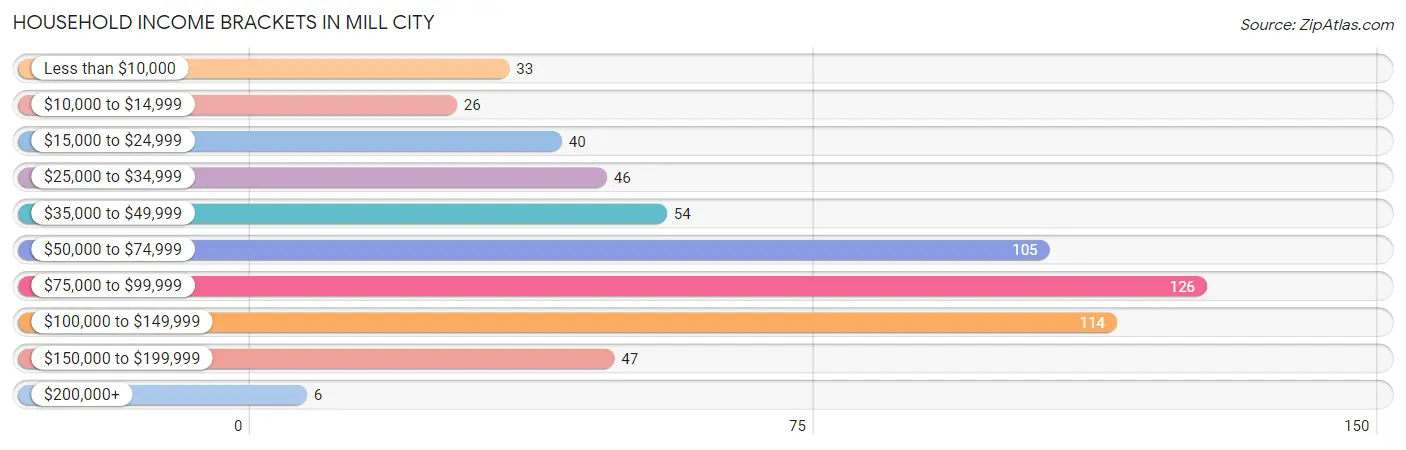
| Income Bracket | # Households | % Households |
| Less than $10,000 | 33 | 5.5% |
| $10,000 to $14,999 | 26 | 4.4% |
| $15,000 to $24,999 | 40 | 6.7% |
| $25,000 to $34,999 | 46 | 7.7% |
| $35,000 to $49,999 | 54 | 9.0% |
| $50,000 to $74,999 | 105 | 17.6% |
| $75,000 to $99,999 | 126 | 21.1% |
| $100,000 to $149,999 | 114 | 19.1% |
| $150,000 to $199,999 | 47 | 7.9% |
| $200,000+ | 6 | 1.0% |
Household Income by Householder Age in Mill City
The median household income in Mill City is $73,625, with the highest median household income of $98,438 found in the 45 to 64 years age bracket for the primary householder. A total of 195 households (32.7%) fall into this category. Meanwhile, the 15 to 24 years age bracket for the primary householder has the lowest median household income of $0, with 6 households (1.0%) in this group.
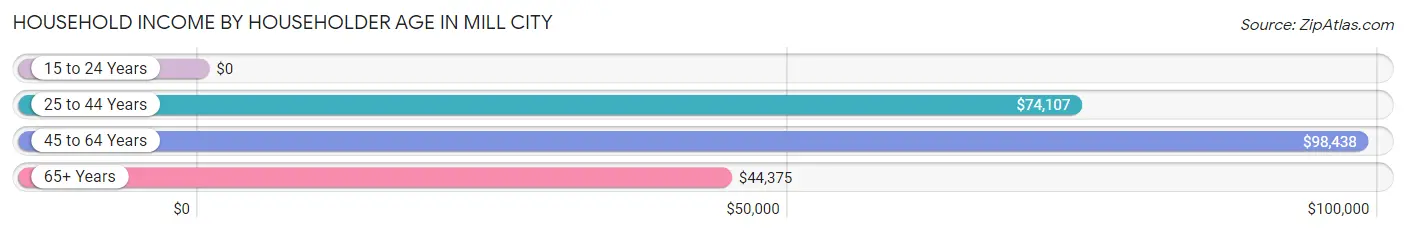
| Income Bracket | # Households | Median Income |
| 15 to 24 Years | 6 (1.0%) | $0 |
| 25 to 44 Years | 193 (32.3%) | $74,107 |
| 45 to 64 Years | 195 (32.7%) | $98,438 |
| 65+ Years | 203 (34.0%) | $44,375 |
| Total | 597 (100.0%) | $73,625 |
Poverty in Mill City
Income Below Poverty by Sex and Age in Mill City
With 9.5% poverty level for males and 15.9% for females among the residents of Mill City, 5 year old males and 25 to 34 year old females are the most vulnerable to poverty, with 17 males (100.0%) and 42 females (43.3%) in their respective age groups living below the poverty level.
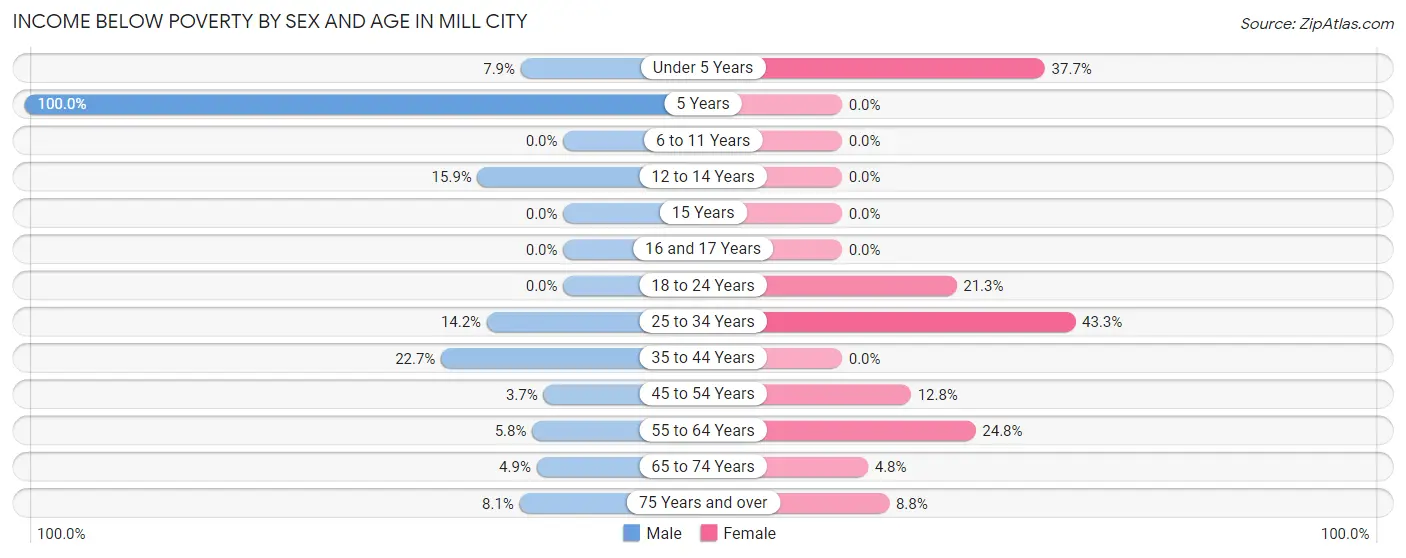
| Age Bracket | Male | Female |
| Under 5 Years | 3 (7.9%) | 32 (37.7%) |
| 5 Years | 17 (100.0%) | 0 (0.0%) |
| 6 to 11 Years | 0 (0.0%) | 0 (0.0%) |
| 12 to 14 Years | 7 (15.9%) | 0 (0.0%) |
| 15 Years | 0 (0.0%) | 0 (0.0%) |
| 16 and 17 Years | 0 (0.0%) | 0 (0.0%) |
| 18 to 24 Years | 0 (0.0%) | 17 (21.2%) |
| 25 to 34 Years | 20 (14.2%) | 42 (43.3%) |
| 35 to 44 Years | 17 (22.7%) | 0 (0.0%) |
| 45 to 54 Years | 4 (3.7%) | 11 (12.8%) |
| 55 to 64 Years | 6 (5.8%) | 30 (24.8%) |
| 65 to 74 Years | 4 (4.9%) | 4 (4.8%) |
| 75 Years and over | 3 (8.1%) | 7 (8.7%) |
| Total | 81 (9.5%) | 143 (15.9%) |
Income Above Poverty by Sex and Age in Mill City
According to the poverty statistics in Mill City, males aged 6 to 11 years and females aged 5 years are the age groups that are most secure financially, with 100.0% of males and 100.0% of females in these age groups living above the poverty line.
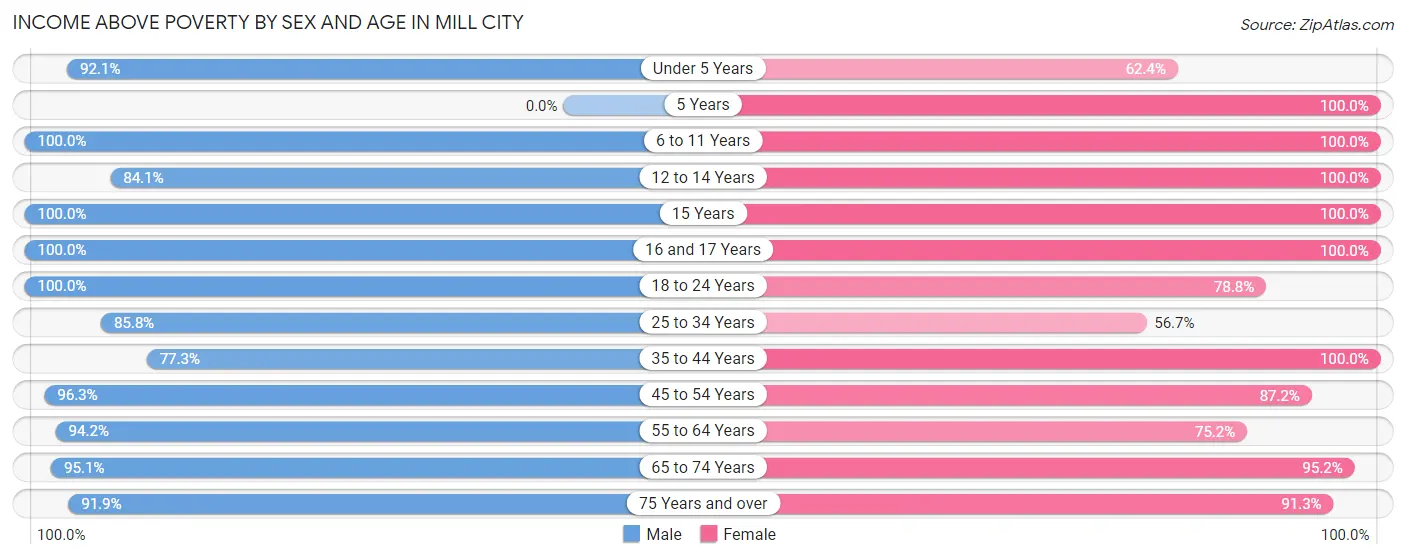
| Age Bracket | Male | Female |
| Under 5 Years | 35 (92.1%) | 53 (62.4%) |
| 5 Years | 0 (0.0%) | 9 (100.0%) |
| 6 to 11 Years | 90 (100.0%) | 48 (100.0%) |
| 12 to 14 Years | 37 (84.1%) | 17 (100.0%) |
| 15 Years | 48 (100.0%) | 6 (100.0%) |
| 16 and 17 Years | 32 (100.0%) | 71 (100.0%) |
| 18 to 24 Years | 36 (100.0%) | 63 (78.7%) |
| 25 to 34 Years | 121 (85.8%) | 55 (56.7%) |
| 35 to 44 Years | 58 (77.3%) | 116 (100.0%) |
| 45 to 54 Years | 105 (96.3%) | 75 (87.2%) |
| 55 to 64 Years | 98 (94.2%) | 91 (75.2%) |
| 65 to 74 Years | 77 (95.1%) | 79 (95.2%) |
| 75 Years and over | 34 (91.9%) | 73 (91.2%) |
| Total | 771 (90.5%) | 756 (84.1%) |
Income Below Poverty Among Married-Couple Families in Mill City
The poverty statistics for married-couple families in Mill City show that 5.1% or 13 of the total 257 families live below the poverty line. Families with no children have the highest poverty rate of 7.7%, comprising of 10 families. On the other hand, families with 3 or 4 children have the lowest poverty rate of 0.0%, which includes 0 families.
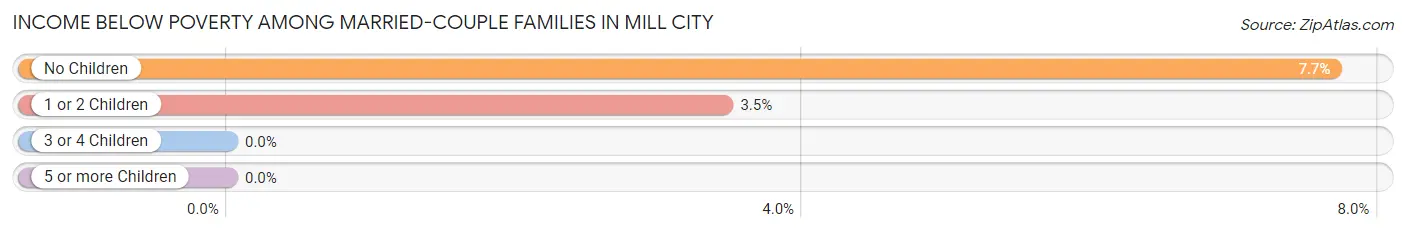
| Children | Above Poverty | Below Poverty |
| No Children | 120 (92.3%) | 10 (7.7%) |
| 1 or 2 Children | 84 (96.6%) | 3 (3.5%) |
| 3 or 4 Children | 36 (100.0%) | 0 (0.0%) |
| 5 or more Children | 4 (100.0%) | 0 (0.0%) |
| Total | 244 (94.9%) | 13 (5.1%) |
Income Below Poverty Among Single-Parent Households in Mill City
According to the poverty data in Mill City, 10.6% or 9 single-father households and 29.9% or 23 single-mother households are living below the poverty line. Among single-father households, those with 3 or 4 children have the highest poverty rate, with 9 households (60.0%) experiencing poverty. Likewise, among single-mother households, those with 1 or 2 children have the highest poverty rate, with 23 households (52.3%) falling below the poverty line.
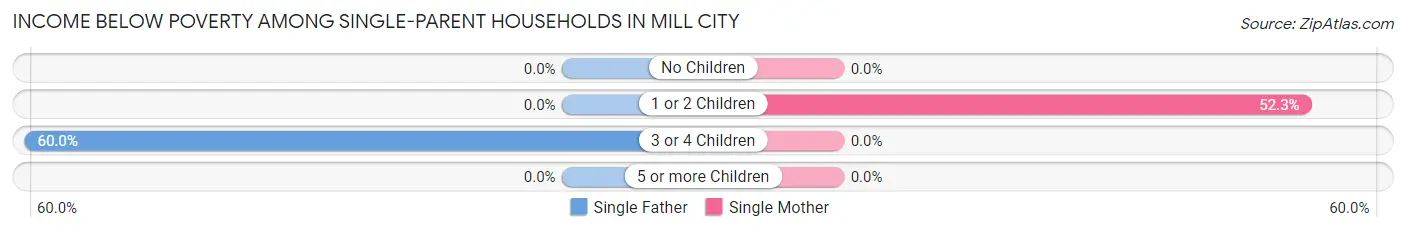
| Children | Single Father | Single Mother |
| No Children | 0 (0.0%) | 0 (0.0%) |
| 1 or 2 Children | 0 (0.0%) | 23 (52.3%) |
| 3 or 4 Children | 9 (60.0%) | 0 (0.0%) |
| 5 or more Children | 0 (0.0%) | 0 (0.0%) |
| Total | 9 (10.6%) | 23 (29.9%) |
Income Below Poverty Among Married-Couple vs Single-Parent Households in Mill City
The poverty data for Mill City shows that 13 of the married-couple family households (5.1%) and 32 of the single-parent households (19.8%) are living below the poverty level. Within the married-couple family households, those with no children have the highest poverty rate, with 10 households (7.7%) falling below the poverty line. Among the single-parent households, those with 3 or 4 children have the highest poverty rate, with 9 household (50.0%) living below poverty.
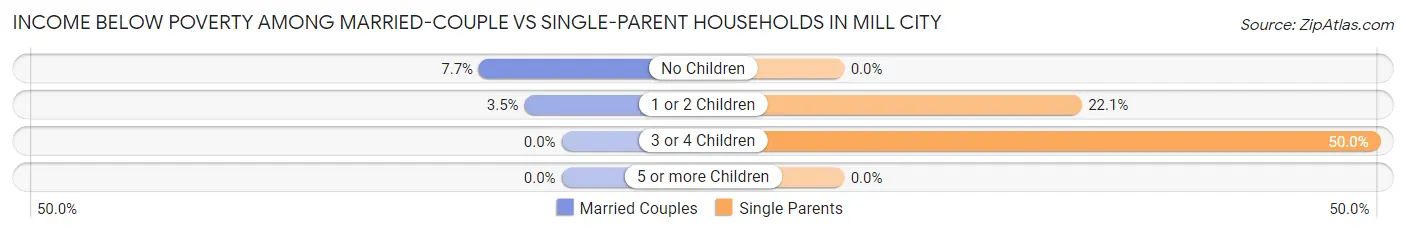
| Children | Married-Couple Families | Single-Parent Households |
| No Children | 10 (7.7%) | 0 (0.0%) |
| 1 or 2 Children | 3 (3.5%) | 23 (22.1%) |
| 3 or 4 Children | 0 (0.0%) | 9 (50.0%) |
| 5 or more Children | 0 (0.0%) | 0 (0.0%) |
| Total | 13 (5.1%) | 32 (19.8%) |
Race in Mill City
The most populous races in Mill City are White / Caucasian (1,444 | 82.1%), Two or more Races (226 | 12.8%), and Hispanic or Latino (89 | 5.1%).
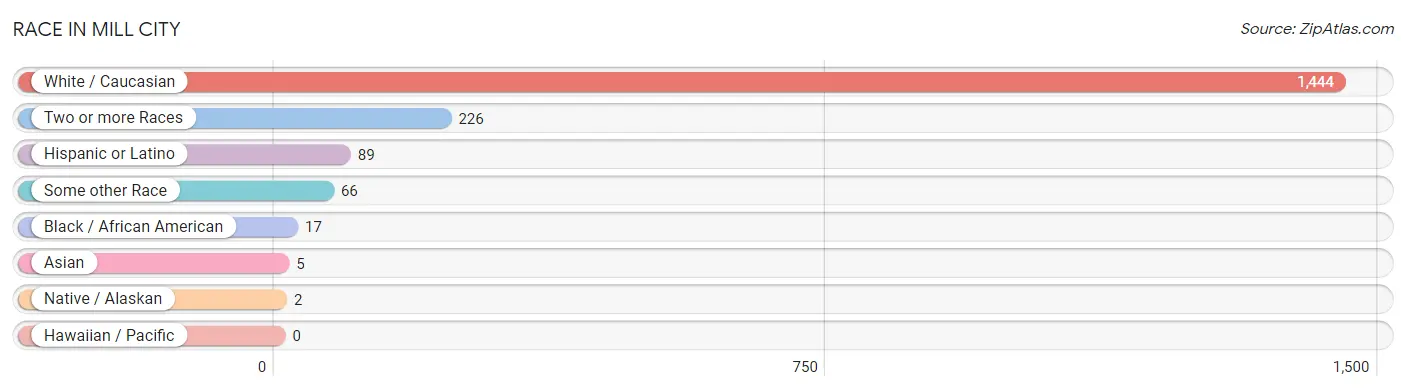
| Race | # Population | % Population |
| Asian | 5 | 0.3% |
| Black / African American | 17 | 1.0% |
| Hawaiian / Pacific | 0 | 0.0% |
| Hispanic or Latino | 89 | 5.1% |
| Native / Alaskan | 2 | 0.1% |
| White / Caucasian | 1,444 | 82.1% |
| Two or more Races | 226 | 12.8% |
| Some other Race | 66 | 3.7% |
| Total | 1,760 | 100.0% |
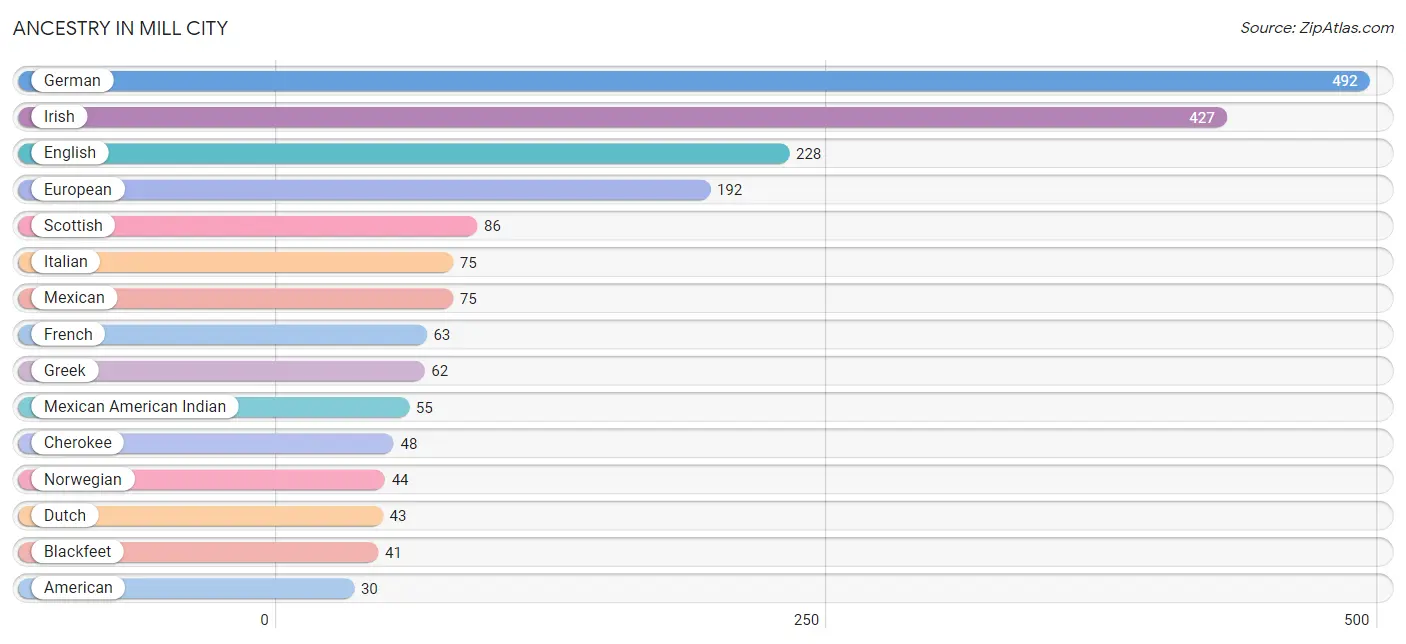
Ancestry in Mill City
The most populous ancestries reported in Mill City are German (492 | 28.0%), Irish (427 | 24.3%), English (228 | 13.0%), European (192 | 10.9%), and Scottish (86 | 4.9%), together accounting for 81.0% of all Mill City residents.
| Ancestry | # Population | % Population |
| American | 30 | 1.7% |
| Apache | 12 | 0.7% |
| Australian | 15 | 0.9% |
| Bhutanese | 10 | 0.6% |
| Blackfeet | 41 | 2.3% |
| British | 14 | 0.8% |
| Bulgarian | 2 | 0.1% |
| Central American | 2 | 0.1% |
| Cherokee | 48 | 2.7% |
| Choctaw | 6 | 0.3% |
| Czech | 4 | 0.2% |
| Danish | 26 | 1.5% |
| Dutch | 43 | 2.4% |
| English | 228 | 13.0% |
| European | 192 | 10.9% |
| Fijian | 19 | 1.1% |
| Finnish | 10 | 0.6% |
| French | 63 | 3.6% |
| French Canadian | 10 | 0.6% |
| German | 492 | 28.0% |
| Greek | 62 | 3.5% |
| Hungarian | 4 | 0.2% |
| Indian (Asian) | 10 | 0.6% |
| Irish | 427 | 24.3% |
| Italian | 75 | 4.3% |
| Korean | 10 | 0.6% |
| Mexican | 75 | 4.3% |
| Mexican American Indian | 55 | 3.1% |
| Native Hawaiian | 10 | 0.6% |
| Norwegian | 44 | 2.5% |
| Pakistani | 7 | 0.4% |
| Polish | 3 | 0.2% |
| Portuguese | 12 | 0.7% |
| Puerto Rican | 12 | 0.7% |
| Salvadoran | 2 | 0.1% |
| Scotch-Irish | 7 | 0.4% |
| Scottish | 86 | 4.9% |
| Swedish | 24 | 1.4% |
| Swiss | 4 | 0.2% |
| Welsh | 10 | 0.6% | View All 40 Rows |
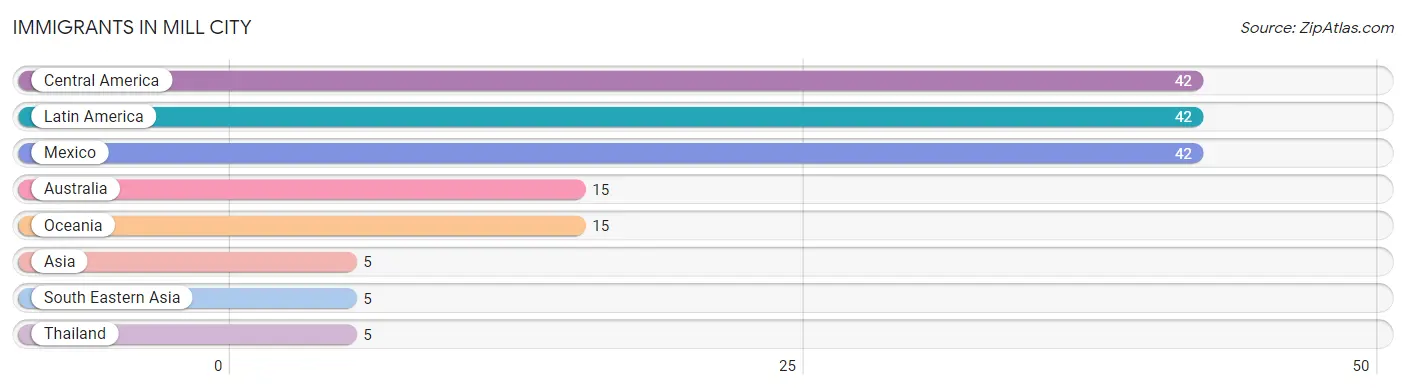
Immigrants in Mill City
The most numerous immigrant groups reported in Mill City came from Central America (42 | 2.4%), Latin America (42 | 2.4%), Mexico (42 | 2.4%), Australia (15 | 0.9%), and Oceania (15 | 0.9%), together accounting for 8.9% of all Mill City residents.
| Immigration Origin | # Population | % Population |
| Asia | 5 | 0.3% |
| Australia | 15 | 0.9% |
| Central America | 42 | 2.4% |
| Latin America | 42 | 2.4% |
| Mexico | 42 | 2.4% |
| Oceania | 15 | 0.9% |
| South Eastern Asia | 5 | 0.3% |
| Thailand | 5 | 0.3% | View All 8 Rows |
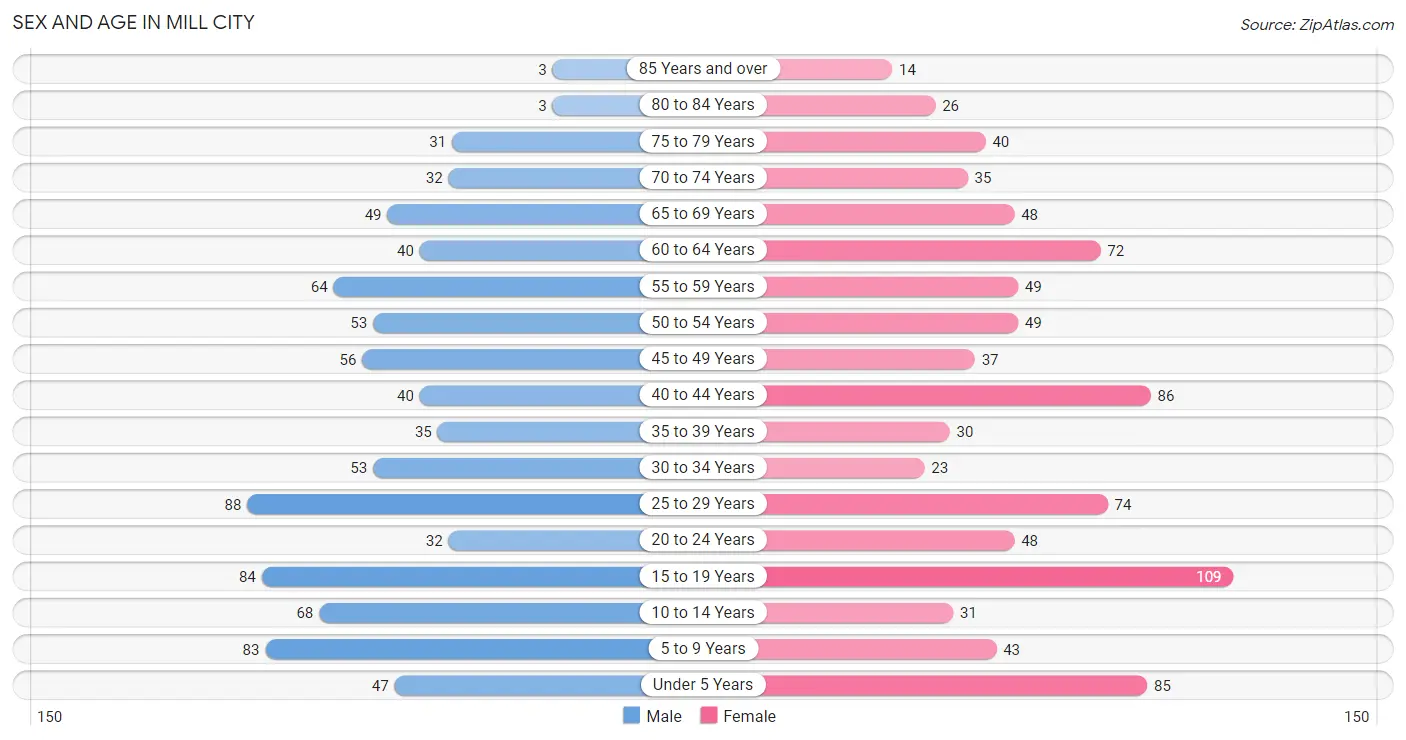
Sex and Age in Mill City
Sex and Age in Mill City
The most populous age groups in Mill City are 25 to 29 Years (88 | 10.2%) for men and 15 to 19 Years (109 | 12.1%) for women.
| Age Bracket | Male | Female |
| Under 5 Years | 47 (5.5%) | 85 (9.5%) |
| 5 to 9 Years | 83 (9.6%) | 43 (4.8%) |
| 10 to 14 Years | 68 (7.9%) | 31 (3.5%) |
| 15 to 19 Years | 84 (9.8%) | 109 (12.1%) |
| 20 to 24 Years | 32 (3.7%) | 48 (5.3%) |
| 25 to 29 Years | 88 (10.2%) | 74 (8.2%) |
| 30 to 34 Years | 53 (6.2%) | 23 (2.6%) |
| 35 to 39 Years | 35 (4.1%) | 30 (3.3%) |
| 40 to 44 Years | 40 (4.6%) | 86 (9.6%) |
| 45 to 49 Years | 56 (6.5%) | 37 (4.1%) |
| 50 to 54 Years | 53 (6.2%) | 49 (5.4%) |
| 55 to 59 Years | 64 (7.4%) | 49 (5.4%) |
| 60 to 64 Years | 40 (4.6%) | 72 (8.0%) |
| 65 to 69 Years | 49 (5.7%) | 48 (5.3%) |
| 70 to 74 Years | 32 (3.7%) | 35 (3.9%) |
| 75 to 79 Years | 31 (3.6%) | 40 (4.4%) |
| 80 to 84 Years | 3 (0.4%) | 26 (2.9%) |
| 85 Years and over | 3 (0.4%) | 14 (1.6%) |
| Total | 861 (100.0%) | 899 (100.0%) |
Families and Households in Mill City
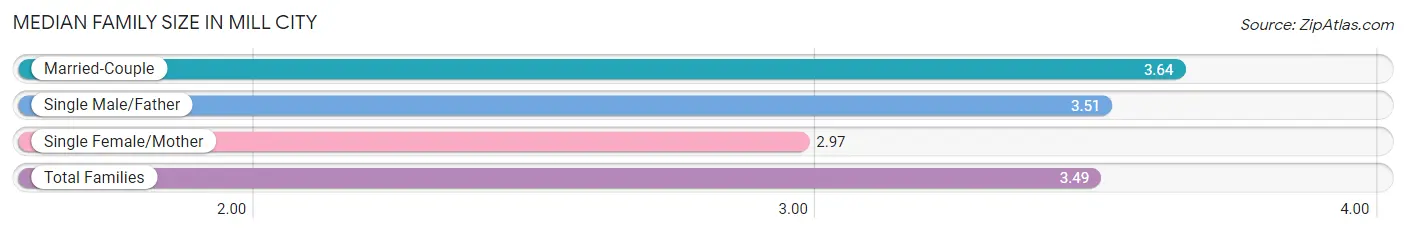
Median Family Size in Mill City
The median family size in Mill City is 3.49 persons per family, with married-couple families (257 | 61.3%) accounting for the largest median family size of 3.64 persons per family. On the other hand, single female/mother families (77 | 18.4%) represent the smallest median family size with 2.97 persons per family.
| Family Type | # Families | Family Size |
| Married-Couple | 257 (61.3%) | 3.64 |
| Single Male/Father | 85 (20.3%) | 3.51 |
| Single Female/Mother | 77 (18.4%) | 2.97 |
| Total Families | 419 (100.0%) | 3.49 |
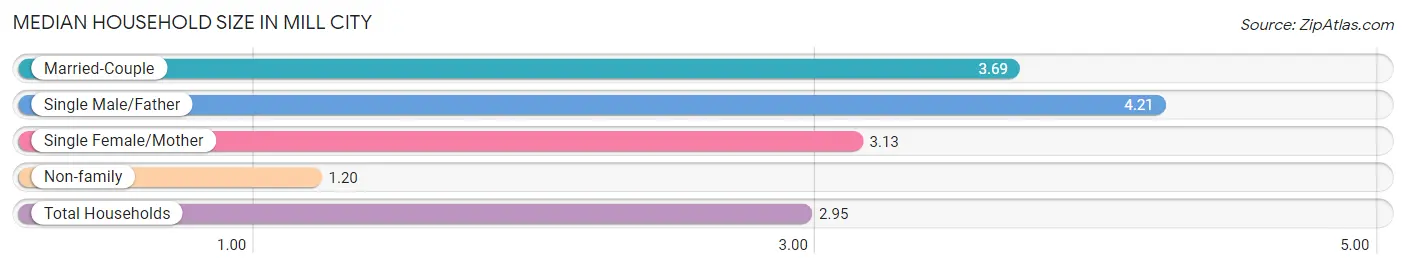
Median Household Size in Mill City
The median household size in Mill City is 2.95 persons per household, with single male/father households (85 | 14.2%) accounting for the largest median household size of 4.21 persons per household. non-family households (178 | 29.8%) represent the smallest median household size with 1.20 persons per household.
| Household Type | # Households | Household Size |
| Married-Couple | 257 (43.0%) | 3.69 |
| Single Male/Father | 85 (14.2%) | 4.21 |
| Single Female/Mother | 77 (12.9%) | 3.13 |
| Non-family | 178 (29.8%) | 1.20 |
| Total Households | 597 (100.0%) | 2.95 |
Household Size by Marriage Status in Mill City
Out of a total of 597 households in Mill City, 419 (70.2%) are family households, while 178 (29.8%) are nonfamily households. The most numerous type of family households are 2-person households, comprising 155, and the most common type of nonfamily households are 1-person households, comprising 134.
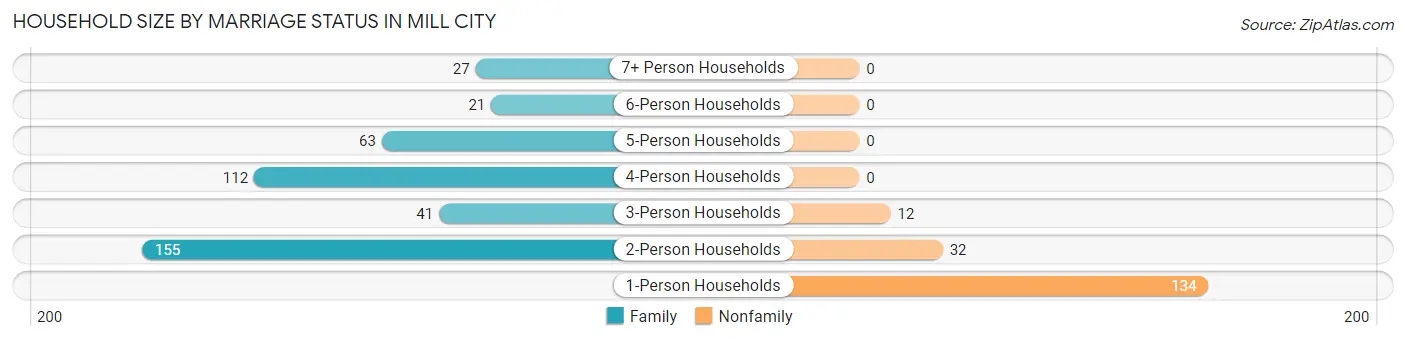
| Household Size | Family Households | Nonfamily Households |
| 1-Person Households | - | 134 (22.5%) |
| 2-Person Households | 155 (26.0%) | 32 (5.4%) |
| 3-Person Households | 41 (6.9%) | 12 (2.0%) |
| 4-Person Households | 112 (18.8%) | 0 (0.0%) |
| 5-Person Households | 63 (10.5%) | 0 (0.0%) |
| 6-Person Households | 21 (3.5%) | 0 (0.0%) |
| 7+ Person Households | 27 (4.5%) | 0 (0.0%) |
| Total | 419 (70.2%) | 178 (29.8%) |
Female Fertility in Mill City
Fertility by Age in Mill City
Average fertility rate in Mill City is 66.0 births per 1,000 women. Women in the age bracket of 20 to 34 years have the highest fertility rate with 166.0 births per 1,000 women. Women in the age bracket of 20 to 34 years acount for 85.7% of all women with births.
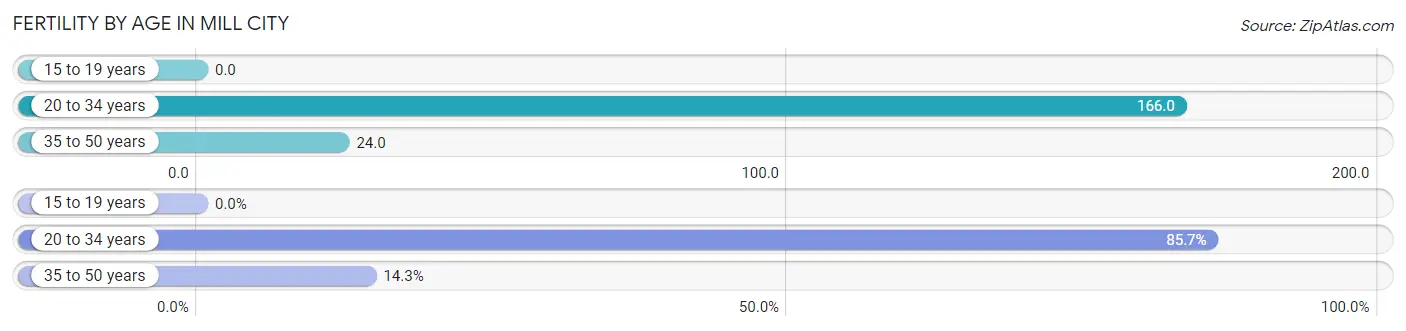
| Age Bracket | Women with Births | Births / 1,000 Women |
| 15 to 19 years | 0 (0.0%) | 0.0 |
| 20 to 34 years | 24 (85.7%) | 166.0 |
| 35 to 50 years | 4 (14.3%) | 24.0 |
| Total | 28 (100.0%) | 66.0 |
Fertility by Age by Marriage Status in Mill City
32.1% of women with births (28) in Mill City are married. The highest percentage of unmarried women with births falls into 20 to 34 years age bracket with 79.2% of them unmarried at the time of birth, while the lowest percentage of unmarried women with births belong to 35 to 50 years age bracket with 0.0% of them unmarried.
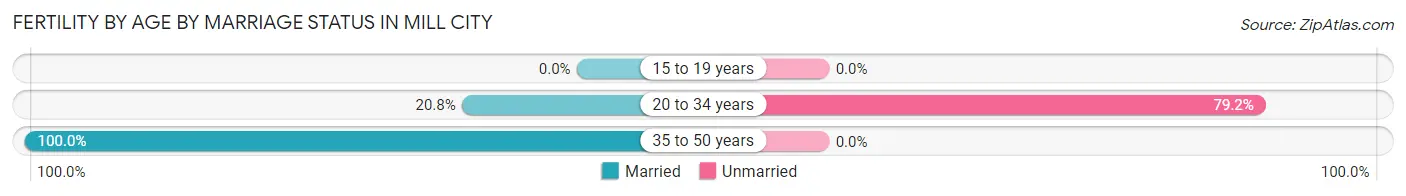
| Age Bracket | Married | Unmarried |
| 15 to 19 years | 0 (0.0%) | 0 (0.0%) |
| 20 to 34 years | 5 (20.8%) | 19 (79.2%) |
| 35 to 50 years | 4 (100.0%) | 0 (0.0%) |
| Total | 9 (32.1%) | 19 (67.9%) |
Fertility by Education in Mill City
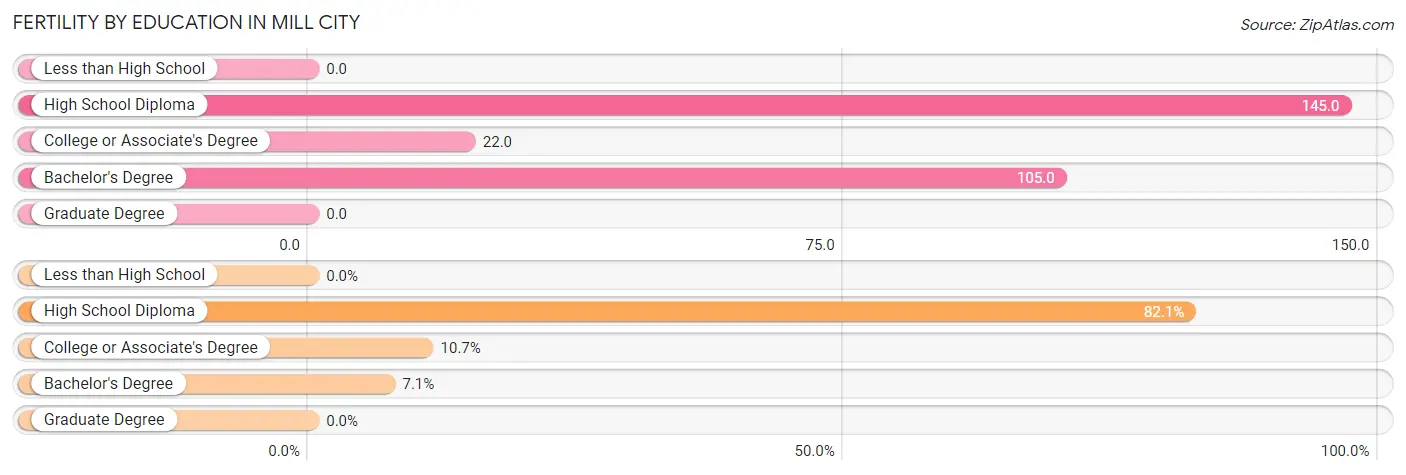
| Educational Attainment | Women with Births | Births / 1,000 Women |
| Less than High School | 0 (0.0%) | 0.0 |
| High School Diploma | 23 (82.1%) | 145.0 |
| College or Associate's Degree | 3 (10.7%) | 22.0 |
| Bachelor's Degree | 2 (7.1%) | 105.0 |
| Graduate Degree | 0 (0.0%) | 0.0 |
| Total | 28 (100.0%) | 66.0 |
Fertility by Education by Marriage Status in Mill City
67.9% of women with births in Mill City are unmarried. Women with the educational attainment of college or associate's degree are most likely to be married with 100.0% of them married at childbirth, while women with the educational attainment of high school diploma are least likely to be married with 82.6% of them unmarried at childbirth.
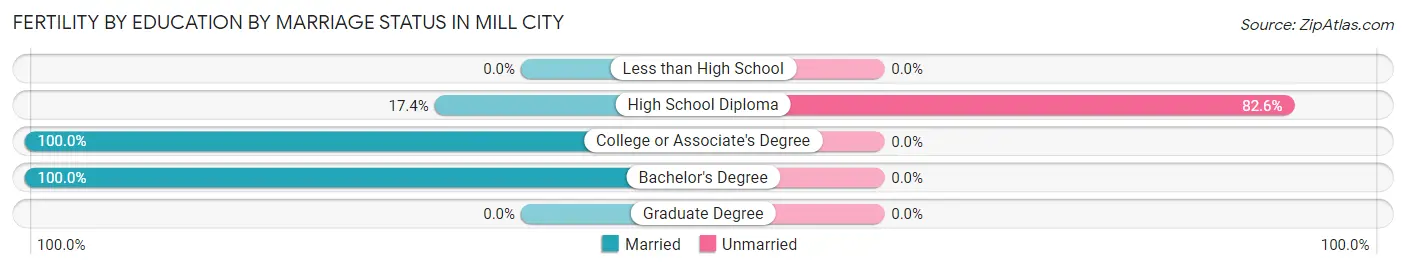
| Educational Attainment | Married | Unmarried |
| Less than High School | 0 (0.0%) | 0 (0.0%) |
| High School Diploma | 4 (17.4%) | 19 (82.6%) |
| College or Associate's Degree | 3 (100.0%) | 0 (0.0%) |
| Bachelor's Degree | 2 (100.0%) | 0 (0.0%) |
| Graduate Degree | 0 (0.0%) | 0 (0.0%) |
| Total | 9 (32.1%) | 19 (67.9%) |
Employment Characteristics in Mill City
Employment by Class of Employer in Mill City
Among the 693 employed individuals in Mill City, private company employees (532 | 76.8%), state government employees (50 | 7.2%), and not-for-profit organizations (38 | 5.5%) make up the most common classes of employment.
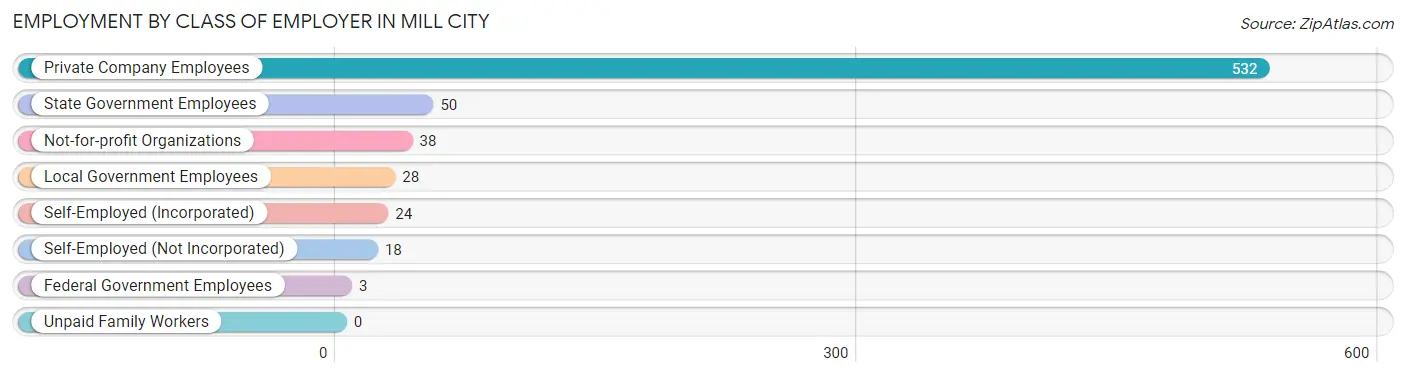
| Employer Class | # Employees | % Employees |
| Private Company Employees | 532 | 76.8% |
| Self-Employed (Incorporated) | 24 | 3.5% |
| Self-Employed (Not Incorporated) | 18 | 2.6% |
| Not-for-profit Organizations | 38 | 5.5% |
| Local Government Employees | 28 | 4.0% |
| State Government Employees | 50 | 7.2% |
| Federal Government Employees | 3 | 0.4% |
| Unpaid Family Workers | 0 | 0.0% |
| Total | 693 | 100.0% |
Employment Status by Age in Mill City
According to the labor force statistics for Mill City, out of the total population over 16 years of age (1,349), 58.3% or 786 individuals are in the labor force, with 9.9% or 78 of them unemployed. The age group with the highest labor force participation rate is 30 to 34 years, with 100.0% or 76 individuals in the labor force. Within the labor force, the 55 to 59 years age range has the highest percentage of unemployed individuals, with 52.6% or 41 of them being unemployed.
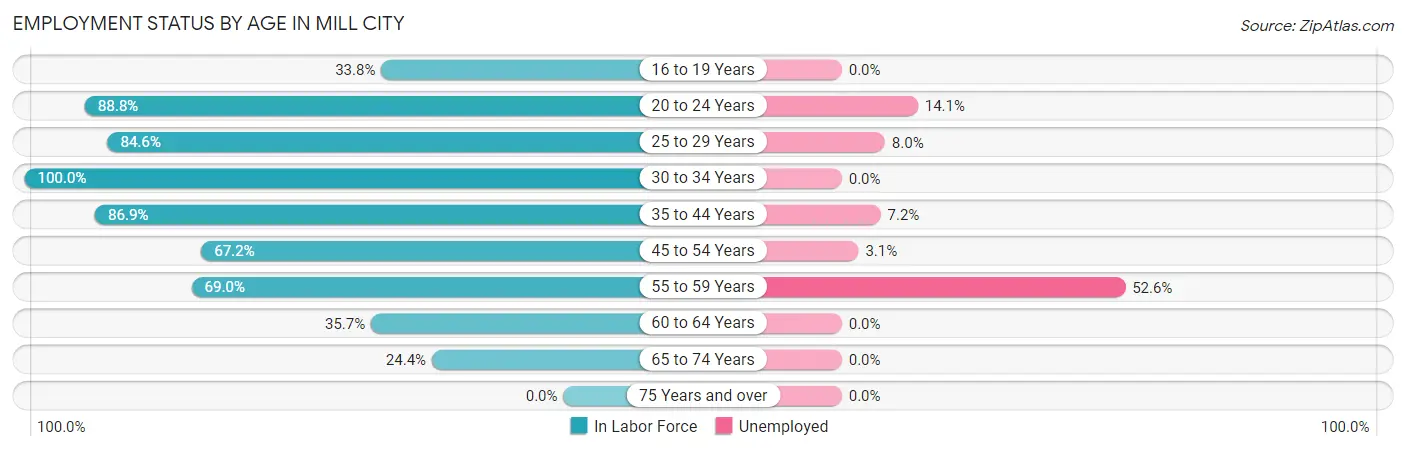
| Age Bracket | In Labor Force | Unemployed |
| 16 to 19 Years | 47 (33.8%) | 0 (0.0%) |
| 20 to 24 Years | 71 (88.8%) | 10 (14.1%) |
| 25 to 29 Years | 137 (84.6%) | 11 (8.0%) |
| 30 to 34 Years | 76 (100.0%) | 0 (0.0%) |
| 35 to 44 Years | 166 (86.9%) | 12 (7.2%) |
| 45 to 54 Years | 131 (67.2%) | 4 (3.1%) |
| 55 to 59 Years | 78 (69.0%) | 41 (52.6%) |
| 60 to 64 Years | 40 (35.7%) | 0 (0.0%) |
| 65 to 74 Years | 40 (24.4%) | 0 (0.0%) |
| 75 Years and over | 0 (0.0%) | 0 (0.0%) |
| Total | 786 (58.3%) | 78 (9.9%) |
Employment Status by Educational Attainment in Mill City
According to labor force statistics for Mill City, 74.0% of individuals (628) out of the total population between 25 and 64 years of age (849) are in the labor force, with 10.8% or 68 of them being unemployed. The group with the highest labor force participation rate are those with the educational attainment of high school diploma, with 79.3% or 253 individuals in the labor force. Within the labor force, individuals with college / associate degree education have the highest percentage of unemployment, with 25.8% or 59 of them being unemployed.
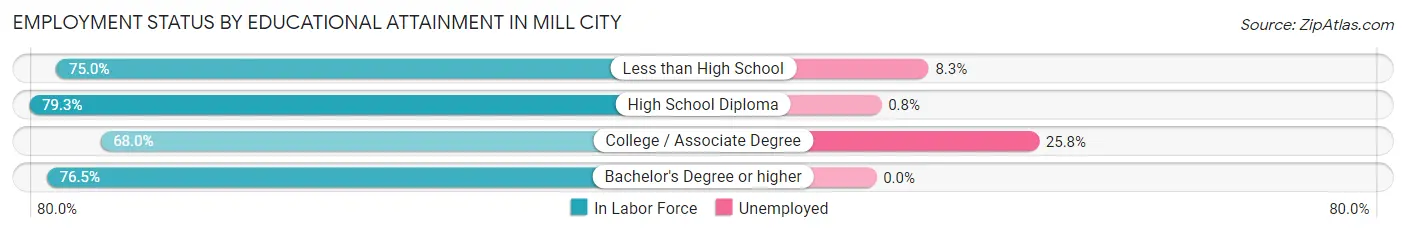
| Educational Attainment | In Labor Force | Unemployed |
| Less than High School | 84 (75.0%) | 9 (8.3%) |
| High School Diploma | 253 (79.3%) | 3 (0.8%) |
| College / Associate Degree | 229 (68.0%) | 87 (25.8%) |
| Bachelor's Degree or higher | 62 (76.5%) | 0 (0.0%) |
| Total | 628 (74.0%) | 92 (10.8%) |
Employment Occupations by Sex in Mill City
Management, Business, Science and Arts Occupations
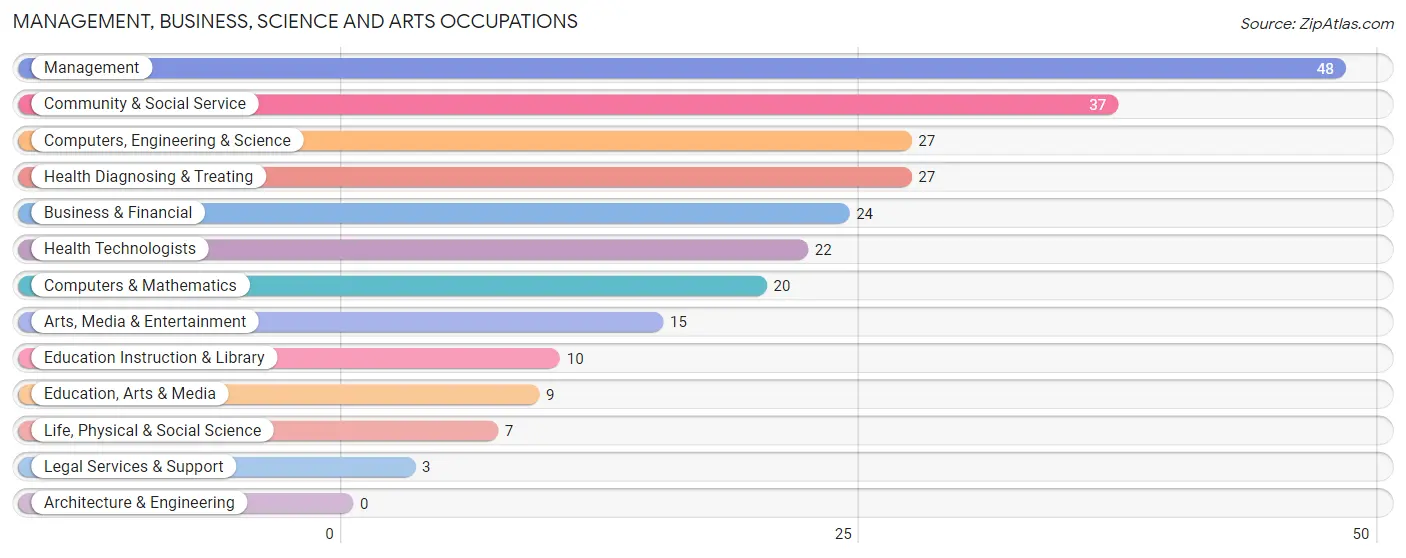
The most common Management, Business, Science and Arts occupations in Mill City are Management (48 | 6.8%), Community & Social Service (37 | 5.2%), Computers, Engineering & Science (27 | 3.8%), Health Diagnosing & Treating (27 | 3.8%), and Business & Financial (24 | 3.4%).
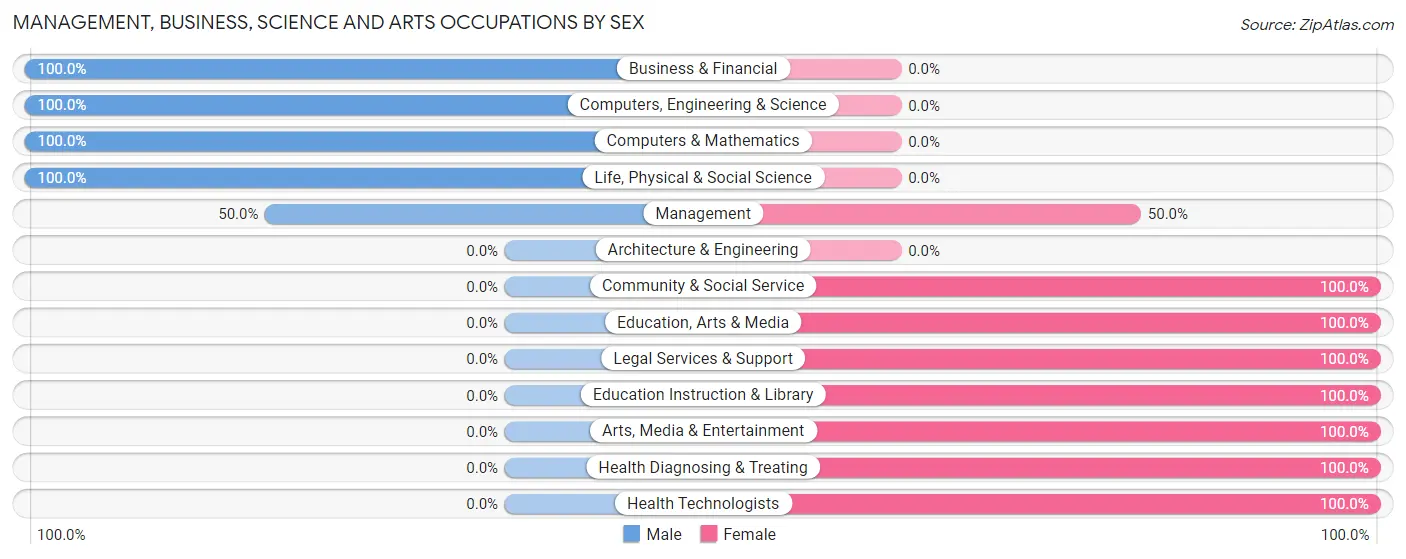
Management, Business, Science and Arts Occupations by Sex
Within the Management, Business, Science and Arts occupations in Mill City, the most male-oriented occupations are Business & Financial (100.0%), Computers, Engineering & Science (100.0%), and Computers & Mathematics (100.0%), while the most female-oriented occupations are Community & Social Service (100.0%), Education, Arts & Media (100.0%), and Legal Services & Support (100.0%).
| Occupation | Male | Female |
| Management | 24 (50.0%) | 24 (50.0%) |
| Business & Financial | 24 (100.0%) | 0 (0.0%) |
| Computers, Engineering & Science | 27 (100.0%) | 0 (0.0%) |
| Computers & Mathematics | 20 (100.0%) | 0 (0.0%) |
| Architecture & Engineering | 0 (0.0%) | 0 (0.0%) |
| Life, Physical & Social Science | 7 (100.0%) | 0 (0.0%) |
| Community & Social Service | 0 (0.0%) | 37 (100.0%) |
| Education, Arts & Media | 0 (0.0%) | 9 (100.0%) |
| Legal Services & Support | 0 (0.0%) | 3 (100.0%) |
| Education Instruction & Library | 0 (0.0%) | 10 (100.0%) |
| Arts, Media & Entertainment | 0 (0.0%) | 15 (100.0%) |
| Health Diagnosing & Treating | 0 (0.0%) | 27 (100.0%) |
| Health Technologists | 0 (0.0%) | 22 (100.0%) |
| Total (Category) | 75 (46.0%) | 88 (54.0%) |
| Total (Overall) | 379 (53.5%) | 329 (46.5%) |
Services Occupations
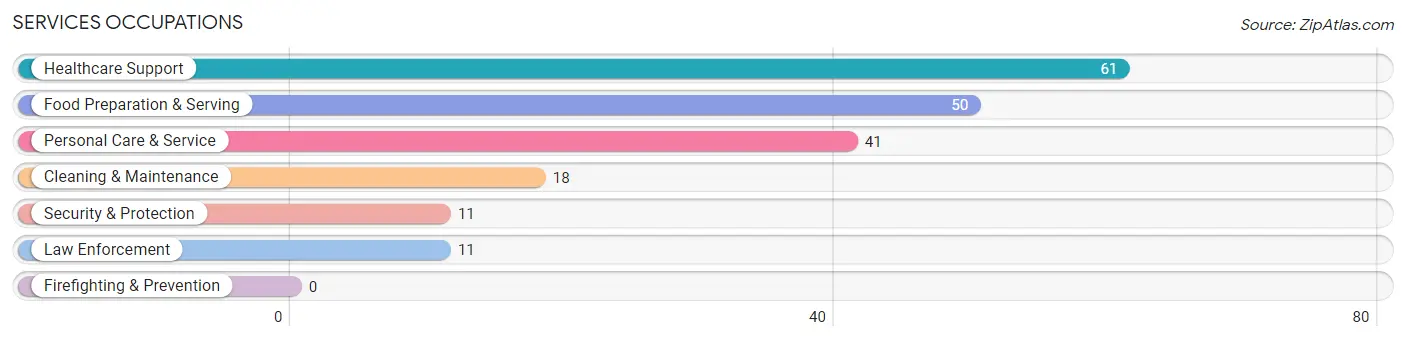
The most common Services occupations in Mill City are Healthcare Support (61 | 8.6%), Food Preparation & Serving (50 | 7.1%), Personal Care & Service (41 | 5.8%), Cleaning & Maintenance (18 | 2.5%), and Security & Protection (11 | 1.5%).
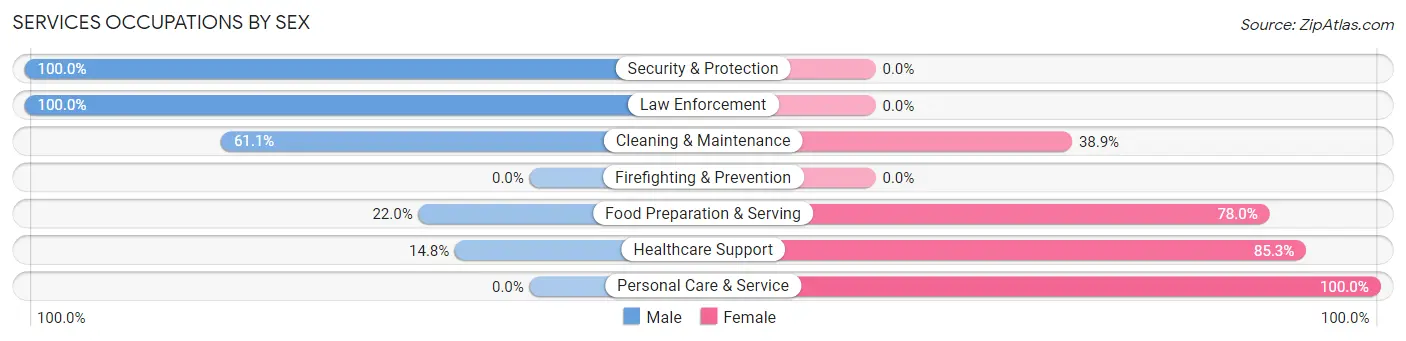
Services Occupations by Sex
Within the Services occupations in Mill City, the most male-oriented occupations are Security & Protection (100.0%), Law Enforcement (100.0%), and Cleaning & Maintenance (61.1%), while the most female-oriented occupations are Personal Care & Service (100.0%), Healthcare Support (85.3%), and Food Preparation & Serving (78.0%).
| Occupation | Male | Female |
| Healthcare Support | 9 (14.7%) | 52 (85.3%) |
| Security & Protection | 11 (100.0%) | 0 (0.0%) |
| Firefighting & Prevention | 0 (0.0%) | 0 (0.0%) |
| Law Enforcement | 11 (100.0%) | 0 (0.0%) |
| Food Preparation & Serving | 11 (22.0%) | 39 (78.0%) |
| Cleaning & Maintenance | 11 (61.1%) | 7 (38.9%) |
| Personal Care & Service | 0 (0.0%) | 41 (100.0%) |
| Total (Category) | 42 (23.2%) | 139 (76.8%) |
| Total (Overall) | 379 (53.5%) | 329 (46.5%) |
Sales and Office Occupations
The most common Sales and Office occupations in Mill City are Office & Administration (39 | 5.5%), and Sales & Related (31 | 4.4%).
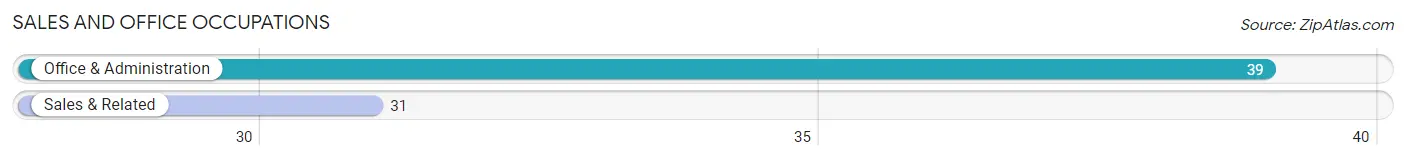
Sales and Office Occupations by Sex
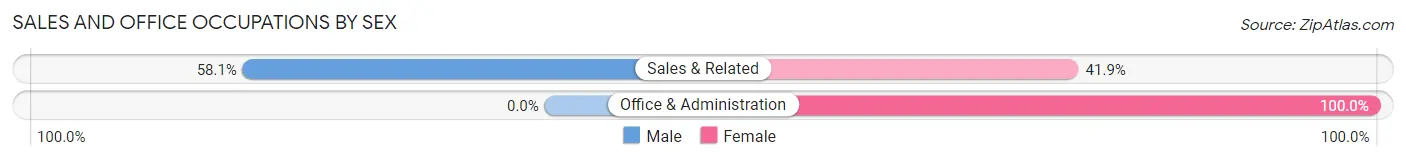
| Occupation | Male | Female |
| Sales & Related | 18 (58.1%) | 13 (41.9%) |
| Office & Administration | 0 (0.0%) | 39 (100.0%) |
| Total (Category) | 18 (25.7%) | 52 (74.3%) |
| Total (Overall) | 379 (53.5%) | 329 (46.5%) |
Natural Resources, Construction and Maintenance Occupations
The most common Natural Resources, Construction and Maintenance occupations in Mill City are Construction & Extraction (83 | 11.7%), Farming, Fishing & Forestry (28 | 4.0%), and Installation, Maintenance & Repair (13 | 1.8%).
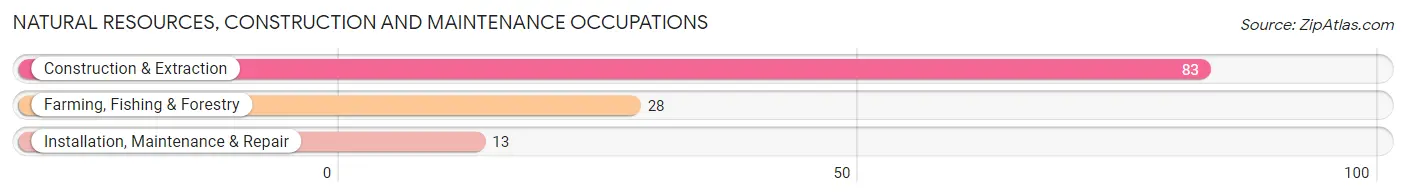
Natural Resources, Construction and Maintenance Occupations by Sex
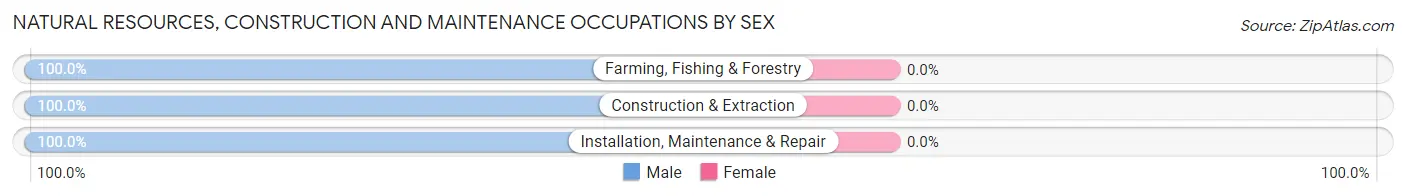
| Occupation | Male | Female |
| Farming, Fishing & Forestry | 28 (100.0%) | 0 (0.0%) |
| Construction & Extraction | 83 (100.0%) | 0 (0.0%) |
| Installation, Maintenance & Repair | 13 (100.0%) | 0 (0.0%) |
| Total (Category) | 124 (100.0%) | 0 (0.0%) |
| Total (Overall) | 379 (53.5%) | 329 (46.5%) |
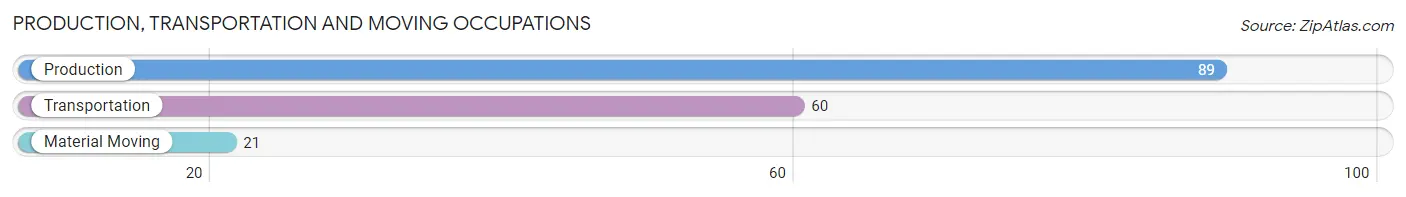
Production, Transportation and Moving Occupations
The most common Production, Transportation and Moving occupations in Mill City are Production (89 | 12.6%), Transportation (60 | 8.5%), and Material Moving (21 | 3.0%).
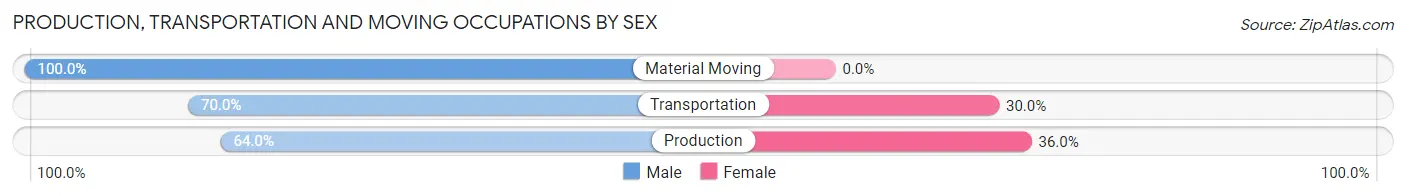
Production, Transportation and Moving Occupations by Sex
| Occupation | Male | Female |
| Production | 57 (64.0%) | 32 (36.0%) |
| Transportation | 42 (70.0%) | 18 (30.0%) |
| Material Moving | 21 (100.0%) | 0 (0.0%) |
| Total (Category) | 120 (70.6%) | 50 (29.4%) |
| Total (Overall) | 379 (53.5%) | 329 (46.5%) |
Employment Industries by Sex in Mill City
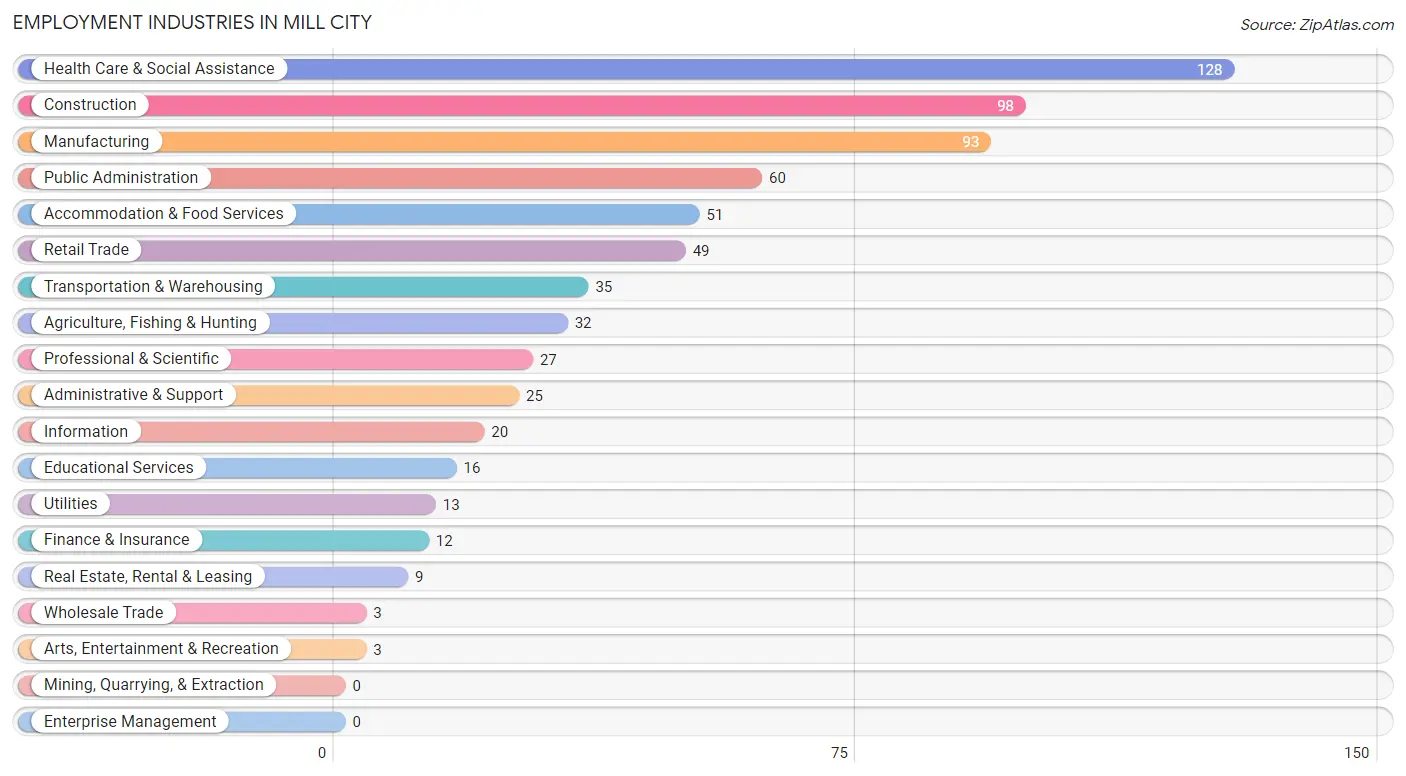
Employment Industries in Mill City
The major employment industries in Mill City include Health Care & Social Assistance (128 | 18.1%), Construction (98 | 13.8%), Manufacturing (93 | 13.1%), Public Administration (60 | 8.5%), and Accommodation & Food Services (51 | 7.2%).
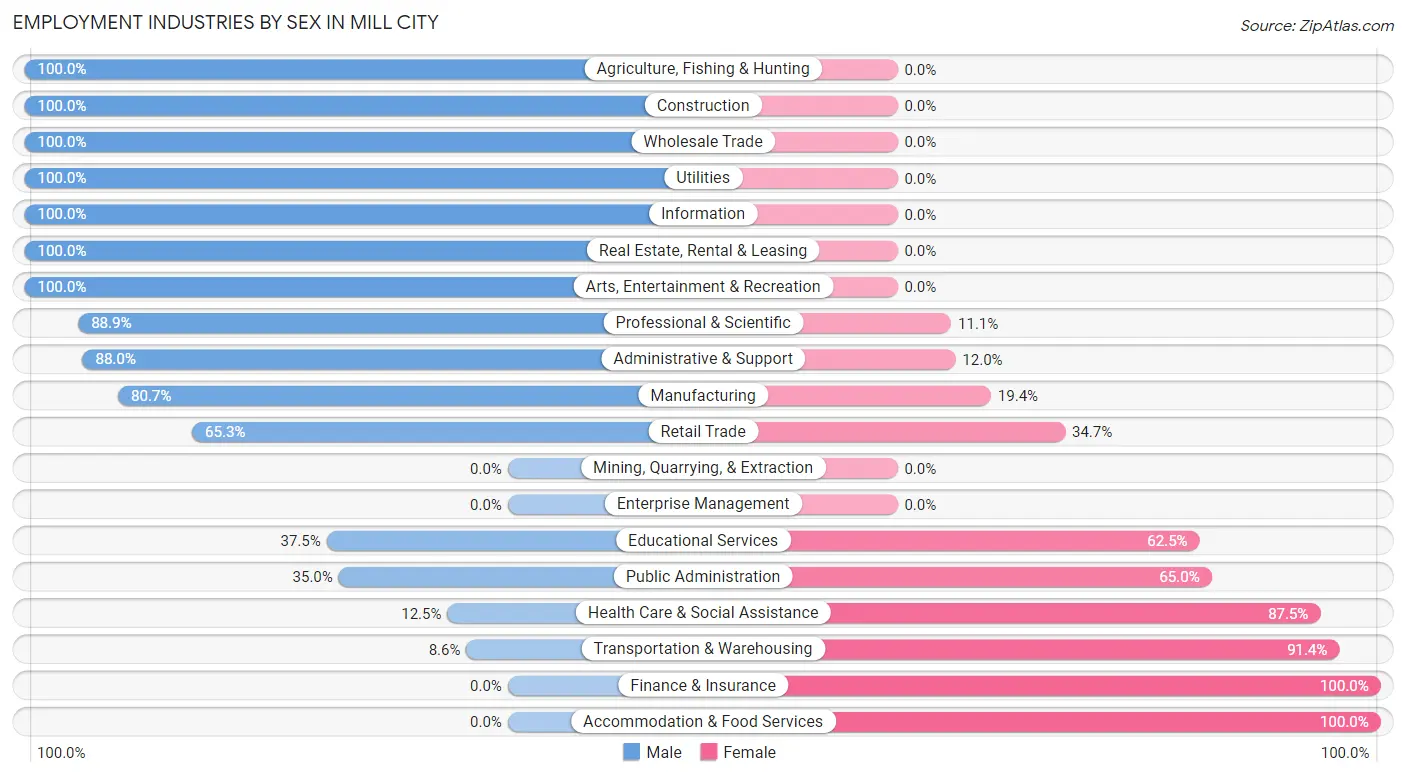
Employment Industries by Sex in Mill City
The Mill City industries that see more men than women are Agriculture, Fishing & Hunting (100.0%), Construction (100.0%), and Wholesale Trade (100.0%), whereas the industries that tend to have a higher number of women are Finance & Insurance (100.0%), Accommodation & Food Services (100.0%), and Transportation & Warehousing (91.4%).
| Industry | Male | Female |
| Agriculture, Fishing & Hunting | 32 (100.0%) | 0 (0.0%) |
| Mining, Quarrying, & Extraction | 0 (0.0%) | 0 (0.0%) |
| Construction | 98 (100.0%) | 0 (0.0%) |
| Manufacturing | 75 (80.6%) | 18 (19.4%) |
| Wholesale Trade | 3 (100.0%) | 0 (0.0%) |
| Retail Trade | 32 (65.3%) | 17 (34.7%) |
| Transportation & Warehousing | 3 (8.6%) | 32 (91.4%) |
| Utilities | 13 (100.0%) | 0 (0.0%) |
| Information | 20 (100.0%) | 0 (0.0%) |
| Finance & Insurance | 0 (0.0%) | 12 (100.0%) |
| Real Estate, Rental & Leasing | 9 (100.0%) | 0 (0.0%) |
| Professional & Scientific | 24 (88.9%) | 3 (11.1%) |
| Enterprise Management | 0 (0.0%) | 0 (0.0%) |
| Administrative & Support | 22 (88.0%) | 3 (12.0%) |
| Educational Services | 6 (37.5%) | 10 (62.5%) |
| Health Care & Social Assistance | 16 (12.5%) | 112 (87.5%) |
| Arts, Entertainment & Recreation | 3 (100.0%) | 0 (0.0%) |
| Accommodation & Food Services | 0 (0.0%) | 51 (100.0%) |
| Public Administration | 21 (35.0%) | 39 (65.0%) |
| Total | 379 (53.5%) | 329 (46.5%) |
Education in Mill City
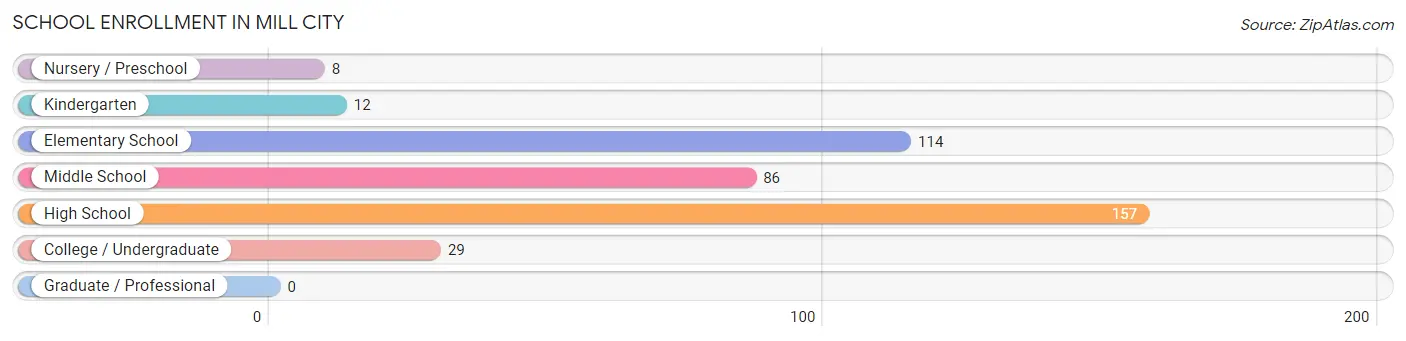
School Enrollment in Mill City
The most common levels of schooling among the 406 students in Mill City are high school (157 | 38.7%), elementary school (114 | 28.1%), and middle school (86 | 21.2%).
| School Level | # Students | % Students |
| Nursery / Preschool | 8 | 2.0% |
| Kindergarten | 12 | 3.0% |
| Elementary School | 114 | 28.1% |
| Middle School | 86 | 21.2% |
| High School | 157 | 38.7% |
| College / Undergraduate | 29 | 7.1% |
| Graduate / Professional | 0 | 0.0% |
| Total | 406 | 100.0% |
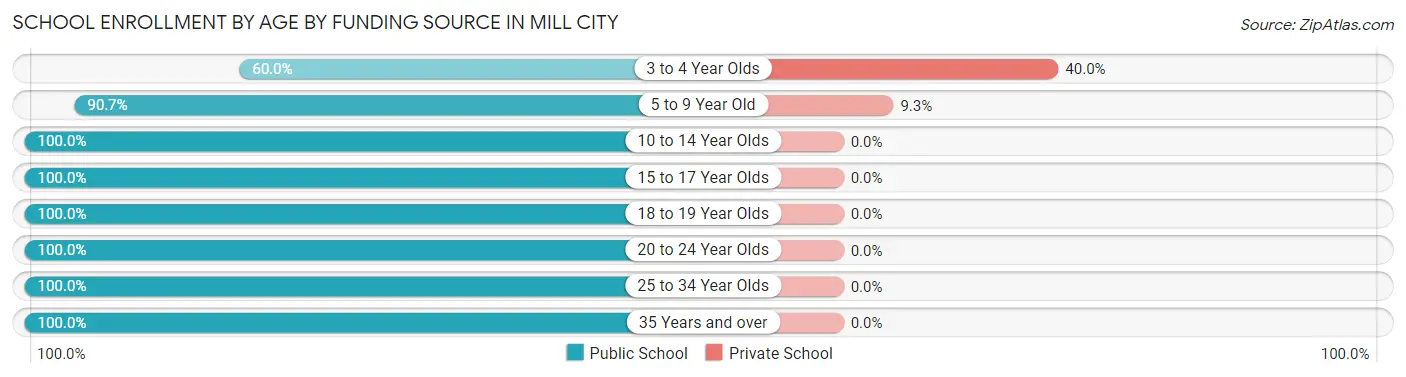
School Enrollment by Age by Funding Source in Mill City
Out of a total of 406 students who are enrolled in schools in Mill City, 17 (4.2%) attend a private institution, while the remaining 389 (95.8%) are enrolled in public schools. The age group of 3 to 4 year olds has the highest likelihood of being enrolled in private schools, with 8 (40.0% in the age bracket) enrolled. Conversely, the age group of 10 to 14 year olds has the lowest likelihood of being enrolled in a private school, with 99 (100.0% in the age bracket) attending a public institution.
| Age Bracket | Public School | Private School |
| 3 to 4 Year Olds | 12 (60.0%) | 8 (40.0%) |
| 5 to 9 Year Old | 88 (90.7%) | 9 (9.3%) |
| 10 to 14 Year Olds | 99 (100.0%) | 0 (0.0%) |
| 15 to 17 Year Olds | 150 (100.0%) | 0 (0.0%) |
| 18 to 19 Year Olds | 14 (100.0%) | 0 (0.0%) |
| 20 to 24 Year Olds | 17 (100.0%) | 0 (0.0%) |
| 25 to 34 Year Olds | 6 (100.0%) | 0 (0.0%) |
| 35 Years and over | 3 (100.0%) | 0 (0.0%) |
| Total | 389 (95.8%) | 17 (4.2%) |
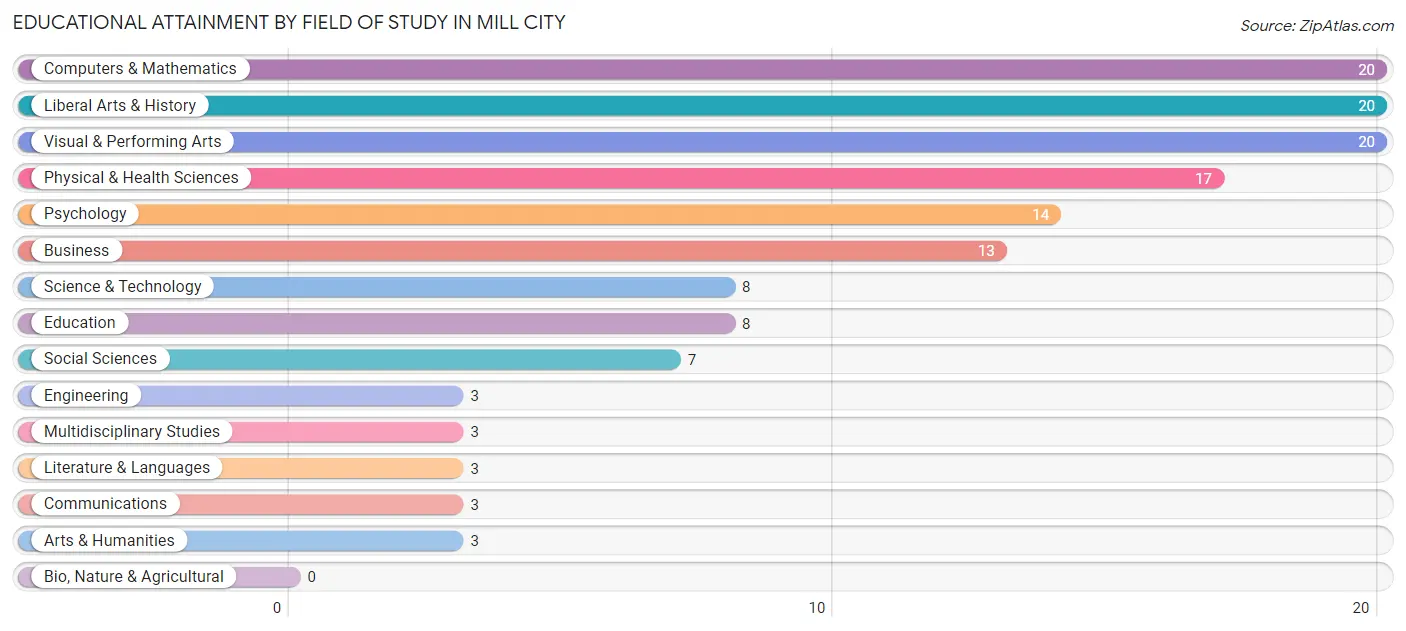
Educational Attainment by Field of Study in Mill City
Computers & mathematics (20 | 14.1%), liberal arts & history (20 | 14.1%), visual & performing arts (20 | 14.1%), physical & health sciences (17 | 12.0%), and psychology (14 | 9.9%) are the most common fields of study among 142 individuals in Mill City who have obtained a bachelor's degree or higher.
| Field of Study | # Graduates | % Graduates |
| Computers & Mathematics | 20 | 14.1% |
| Bio, Nature & Agricultural | 0 | 0.0% |
| Physical & Health Sciences | 17 | 12.0% |
| Psychology | 14 | 9.9% |
| Social Sciences | 7 | 4.9% |
| Engineering | 3 | 2.1% |
| Multidisciplinary Studies | 3 | 2.1% |
| Science & Technology | 8 | 5.6% |
| Business | 13 | 9.1% |
| Education | 8 | 5.6% |
| Literature & Languages | 3 | 2.1% |
| Liberal Arts & History | 20 | 14.1% |
| Visual & Performing Arts | 20 | 14.1% |
| Communications | 3 | 2.1% |
| Arts & Humanities | 3 | 2.1% |
| Total | 142 | 100.0% |
Transportation & Commute in Mill City
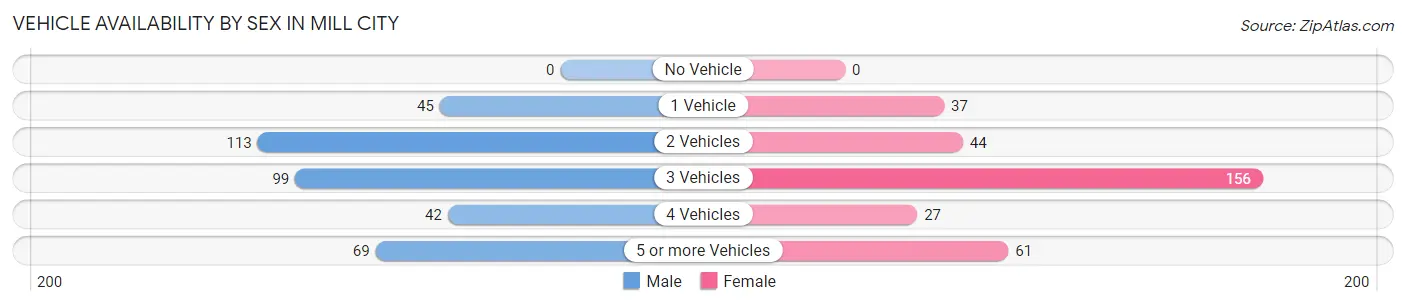
Vehicle Availability by Sex in Mill City
The most prevalent vehicle ownership categories in Mill City are males with 2 vehicles (113, accounting for 30.7%) and females with 2 vehicles (44, making up 34.8%).
| Vehicles Available | Male | Female |
| No Vehicle | 0 (0.0%) | 0 (0.0%) |
| 1 Vehicle | 45 (12.2%) | 37 (11.4%) |
| 2 Vehicles | 113 (30.7%) | 44 (13.5%) |
| 3 Vehicles | 99 (26.9%) | 156 (48.0%) |
| 4 Vehicles | 42 (11.4%) | 27 (8.3%) |
| 5 or more Vehicles | 69 (18.8%) | 61 (18.8%) |
| Total | 368 (100.0%) | 325 (100.0%) |
Commute Time in Mill City
The most frequently occuring commute durations in Mill City are 45 to 59 minutes (97 commuters, 15.0%), 5 to 9 minutes (79 commuters, 12.2%), and 40 to 44 minutes (76 commuters, 11.7%).
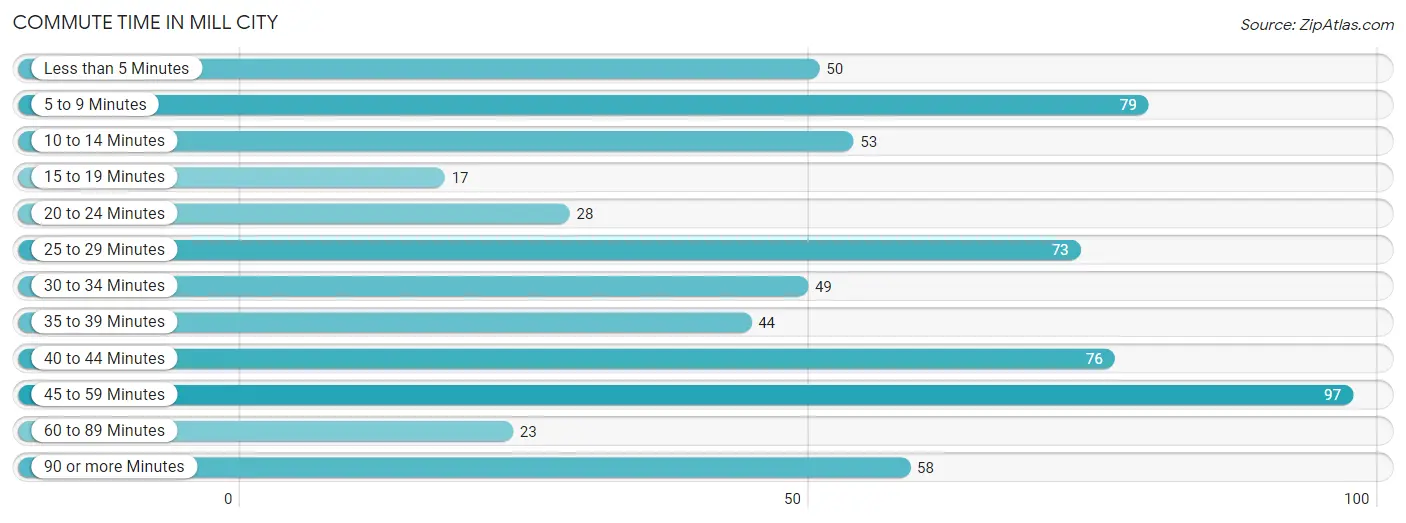
| Commute Time | # Commuters | % Commuters |
| Less than 5 Minutes | 50 | 7.7% |
| 5 to 9 Minutes | 79 | 12.2% |
| 10 to 14 Minutes | 53 | 8.2% |
| 15 to 19 Minutes | 17 | 2.6% |
| 20 to 24 Minutes | 28 | 4.3% |
| 25 to 29 Minutes | 73 | 11.3% |
| 30 to 34 Minutes | 49 | 7.6% |
| 35 to 39 Minutes | 44 | 6.8% |
| 40 to 44 Minutes | 76 | 11.7% |
| 45 to 59 Minutes | 97 | 15.0% |
| 60 to 89 Minutes | 23 | 3.5% |
| 90 or more Minutes | 58 | 9.0% |
Commute Time by Sex in Mill City
The most common commute times in Mill City are 90 or more minutes (54 commuters, 15.2%) for males and 40 to 44 minutes (48 commuters, 16.5%) for females.
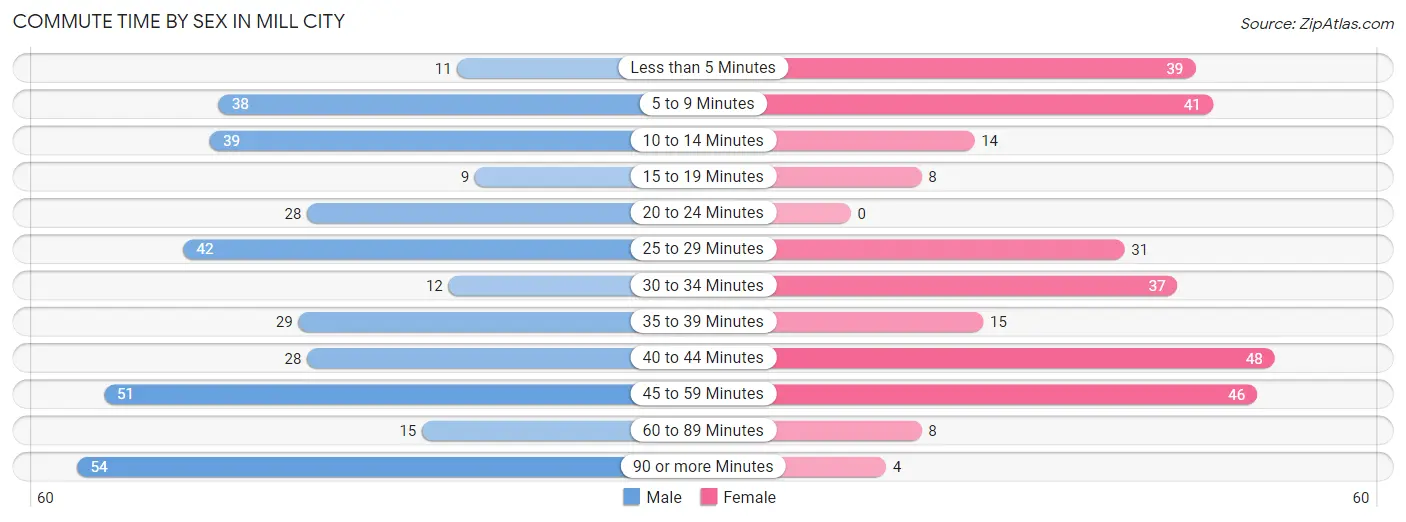
| Commute Time | Male | Female |
| Less than 5 Minutes | 11 (3.1%) | 39 (13.4%) |
| 5 to 9 Minutes | 38 (10.7%) | 41 (14.1%) |
| 10 to 14 Minutes | 39 (11.0%) | 14 (4.8%) |
| 15 to 19 Minutes | 9 (2.5%) | 8 (2.8%) |
| 20 to 24 Minutes | 28 (7.9%) | 0 (0.0%) |
| 25 to 29 Minutes | 42 (11.8%) | 31 (10.6%) |
| 30 to 34 Minutes | 12 (3.4%) | 37 (12.7%) |
| 35 to 39 Minutes | 29 (8.2%) | 15 (5.1%) |
| 40 to 44 Minutes | 28 (7.9%) | 48 (16.5%) |
| 45 to 59 Minutes | 51 (14.3%) | 46 (15.8%) |
| 60 to 89 Minutes | 15 (4.2%) | 8 (2.8%) |
| 90 or more Minutes | 54 (15.2%) | 4 (1.4%) |
Time of Departure to Work by Sex in Mill City
The most frequent times of departure to work in Mill City are 6:30 AM to 6:59 AM (67, 18.8%) for males and 4:00 PM to 11:59 PM (52, 17.9%) for females.
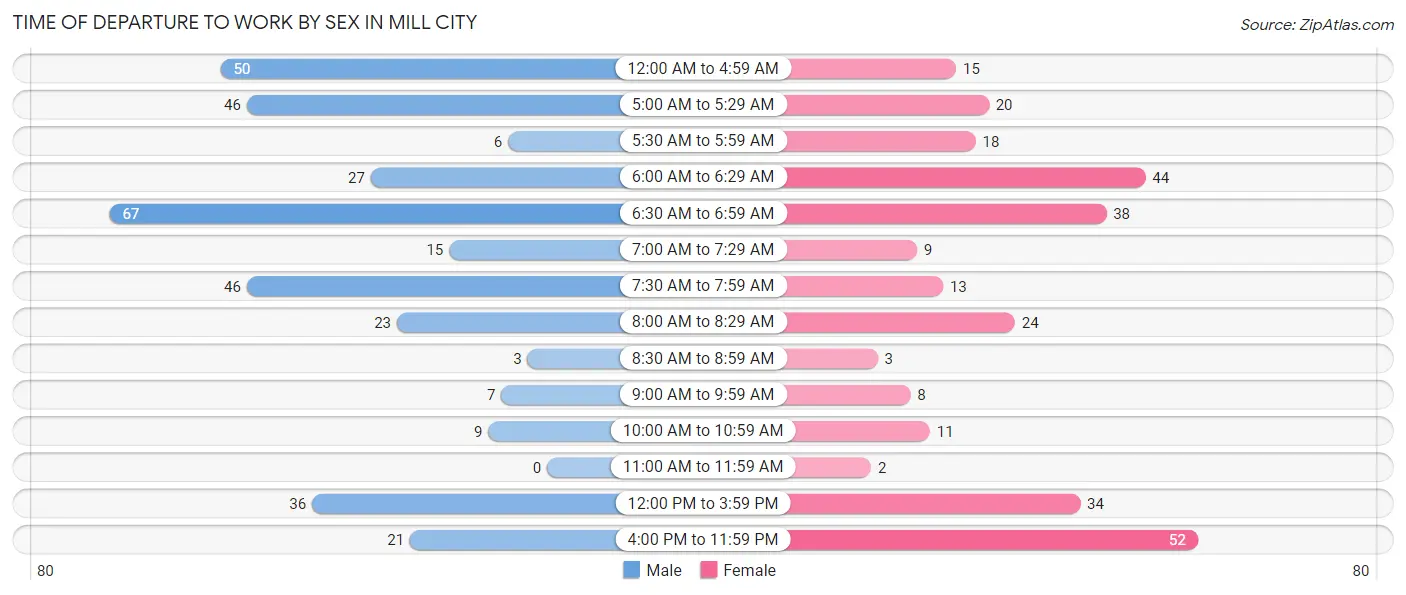
| Time of Departure | Male | Female |
| 12:00 AM to 4:59 AM | 50 (14.0%) | 15 (5.1%) |
| 5:00 AM to 5:29 AM | 46 (12.9%) | 20 (6.9%) |
| 5:30 AM to 5:59 AM | 6 (1.7%) | 18 (6.2%) |
| 6:00 AM to 6:29 AM | 27 (7.6%) | 44 (15.1%) |
| 6:30 AM to 6:59 AM | 67 (18.8%) | 38 (13.1%) |
| 7:00 AM to 7:29 AM | 15 (4.2%) | 9 (3.1%) |
| 7:30 AM to 7:59 AM | 46 (12.9%) | 13 (4.5%) |
| 8:00 AM to 8:29 AM | 23 (6.5%) | 24 (8.3%) |
| 8:30 AM to 8:59 AM | 3 (0.8%) | 3 (1.0%) |
| 9:00 AM to 9:59 AM | 7 (2.0%) | 8 (2.8%) |
| 10:00 AM to 10:59 AM | 9 (2.5%) | 11 (3.8%) |
| 11:00 AM to 11:59 AM | 0 (0.0%) | 2 (0.7%) |
| 12:00 PM to 3:59 PM | 36 (10.1%) | 34 (11.7%) |
| 4:00 PM to 11:59 PM | 21 (5.9%) | 52 (17.9%) |
| Total | 356 (100.0%) | 291 (100.0%) |
Housing Occupancy in Mill City
Occupancy by Ownership in Mill City
Of the total 597 dwellings in Mill City, owner-occupied units account for 442 (74.0%), while renter-occupied units make up 155 (26.0%).
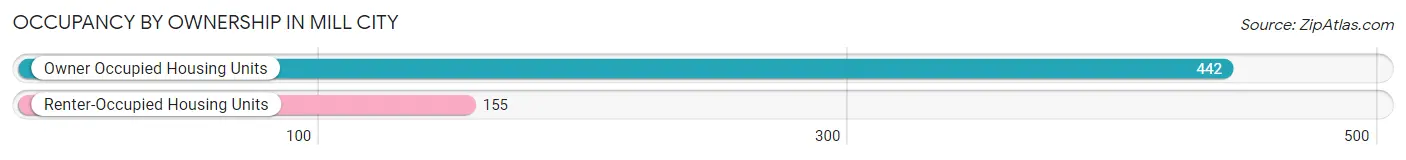
| Occupancy | # Housing Units | % Housing Units |
| Owner Occupied Housing Units | 442 | 74.0% |
| Renter-Occupied Housing Units | 155 | 26.0% |
| Total Occupied Housing Units | 597 | 100.0% |
Occupancy by Household Size in Mill City
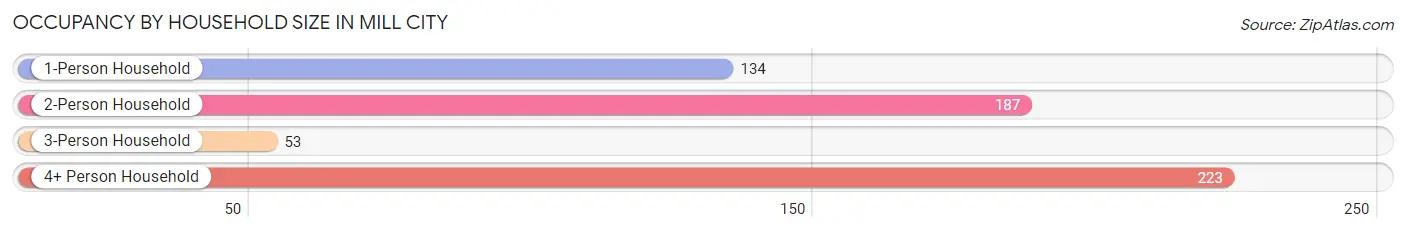
| Household Size | # Housing Units | % Housing Units |
| 1-Person Household | 134 | 22.5% |
| 2-Person Household | 187 | 31.3% |
| 3-Person Household | 53 | 8.9% |
| 4+ Person Household | 223 | 37.3% |
| Total Housing Units | 597 | 100.0% |
Occupancy by Ownership by Household Size in Mill City
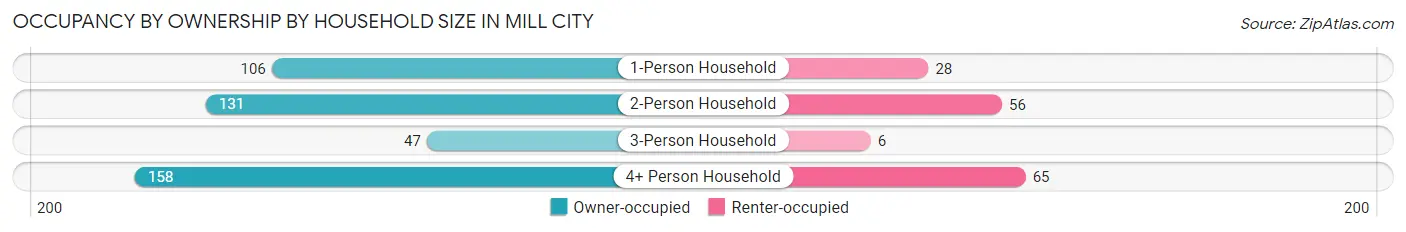
| Household Size | Owner-occupied | Renter-occupied |
| 1-Person Household | 106 (79.1%) | 28 (20.9%) |
| 2-Person Household | 131 (70.1%) | 56 (29.9%) |
| 3-Person Household | 47 (88.7%) | 6 (11.3%) |
| 4+ Person Household | 158 (70.9%) | 65 (29.1%) |
| Total Housing Units | 442 (74.0%) | 155 (26.0%) |
Occupancy by Educational Attainment in Mill City
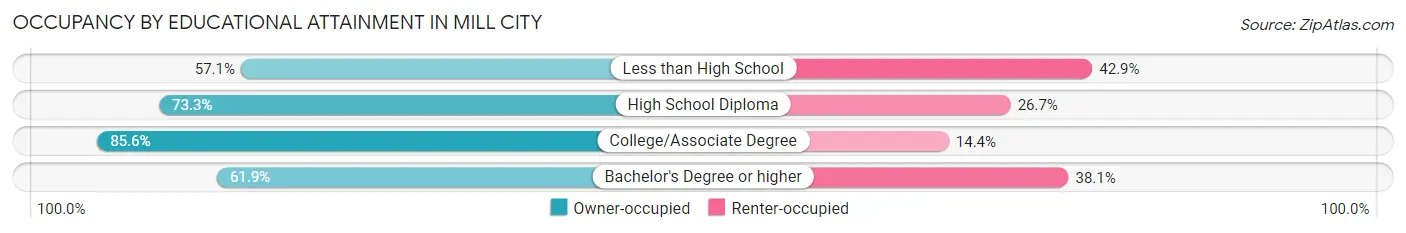
| Household Size | Owner-occupied | Renter-occupied |
| Less than High School | 48 (57.1%) | 36 (42.9%) |
| High School Diploma | 132 (73.3%) | 48 (26.7%) |
| College/Associate Degree | 202 (85.6%) | 34 (14.4%) |
| Bachelor's Degree or higher | 60 (61.9%) | 37 (38.1%) |
Occupancy by Age of Householder in Mill City
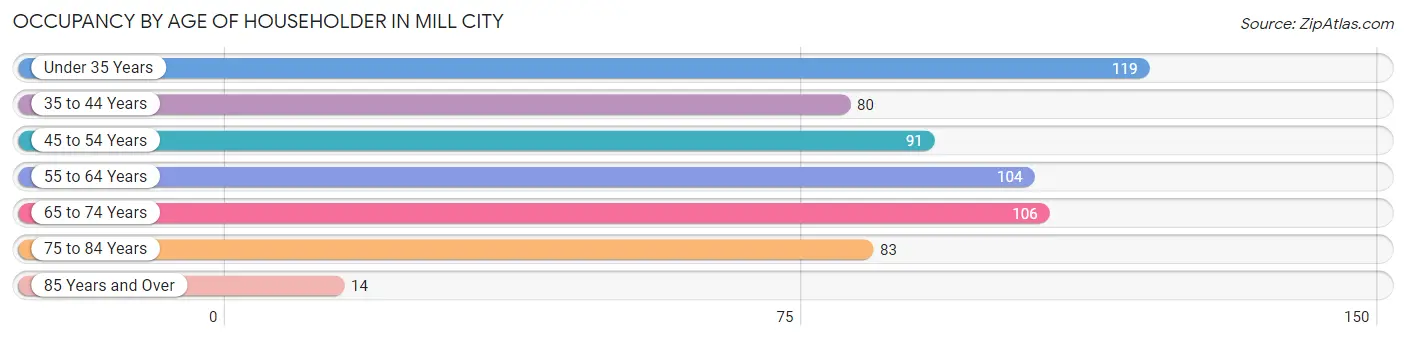
| Age Bracket | # Households | % Households |
| Under 35 Years | 119 | 19.9% |
| 35 to 44 Years | 80 | 13.4% |
| 45 to 54 Years | 91 | 15.2% |
| 55 to 64 Years | 104 | 17.4% |
| 65 to 74 Years | 106 | 17.8% |
| 75 to 84 Years | 83 | 13.9% |
| 85 Years and Over | 14 | 2.4% |
| Total | 597 | 100.0% |
Housing Finances in Mill City
Median Income by Occupancy in Mill City
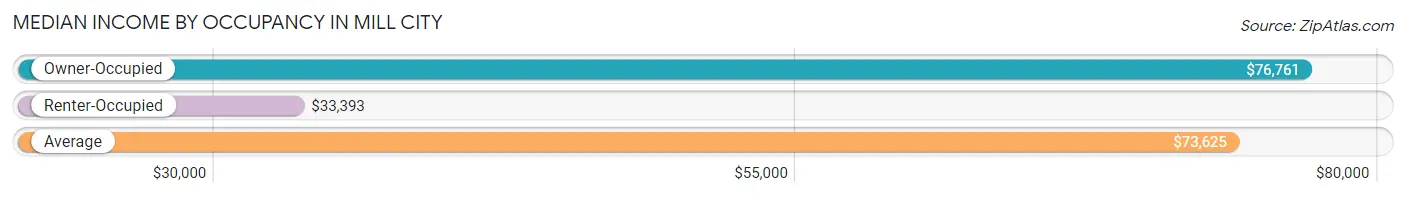
| Occupancy Type | # Households | Median Income |
| Owner-Occupied | 442 (74.0%) | $76,761 |
| Renter-Occupied | 155 (26.0%) | $33,393 |
| Average | 597 (100.0%) | $73,625 |
Occupancy by Householder Income Bracket in Mill City
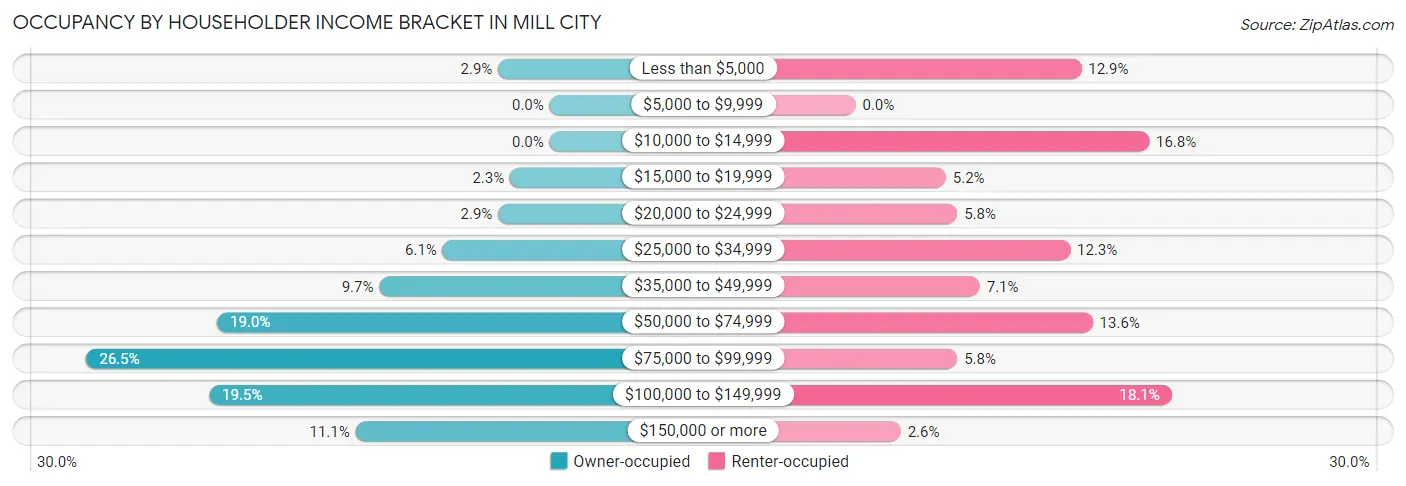
| Income Bracket | Owner-occupied | Renter-occupied |
| Less than $5,000 | 13 (2.9%) | 20 (12.9%) |
| $5,000 to $9,999 | 0 (0.0%) | 0 (0.0%) |
| $10,000 to $14,999 | 0 (0.0%) | 26 (16.8%) |
| $15,000 to $19,999 | 10 (2.3%) | 8 (5.2%) |
| $20,000 to $24,999 | 13 (2.9%) | 9 (5.8%) |
| $25,000 to $34,999 | 27 (6.1%) | 19 (12.3%) |
| $35,000 to $49,999 | 43 (9.7%) | 11 (7.1%) |
| $50,000 to $74,999 | 84 (19.0%) | 21 (13.6%) |
| $75,000 to $99,999 | 117 (26.5%) | 9 (5.8%) |
| $100,000 to $149,999 | 86 (19.5%) | 28 (18.1%) |
| $150,000 or more | 49 (11.1%) | 4 (2.6%) |
| Total | 442 (100.0%) | 155 (100.0%) |
Monthly Housing Cost Tiers in Mill City
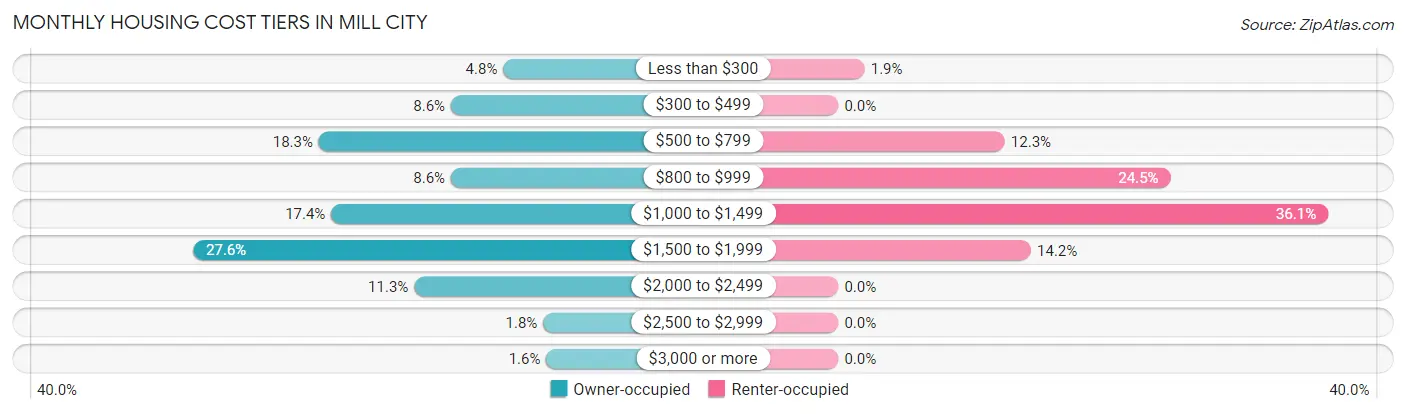
| Monthly Cost | Owner-occupied | Renter-occupied |
| Less than $300 | 21 (4.8%) | 3 (1.9%) |
| $300 to $499 | 38 (8.6%) | 0 (0.0%) |
| $500 to $799 | 81 (18.3%) | 19 (12.3%) |
| $800 to $999 | 38 (8.6%) | 38 (24.5%) |
| $1,000 to $1,499 | 77 (17.4%) | 56 (36.1%) |
| $1,500 to $1,999 | 122 (27.6%) | 22 (14.2%) |
| $2,000 to $2,499 | 50 (11.3%) | 0 (0.0%) |
| $2,500 to $2,999 | 8 (1.8%) | 0 (0.0%) |
| $3,000 or more | 7 (1.6%) | 0 (0.0%) |
| Total | 442 (100.0%) | 155 (100.0%) |
Physical Housing Characteristics in Mill City
Housing Structures in Mill City
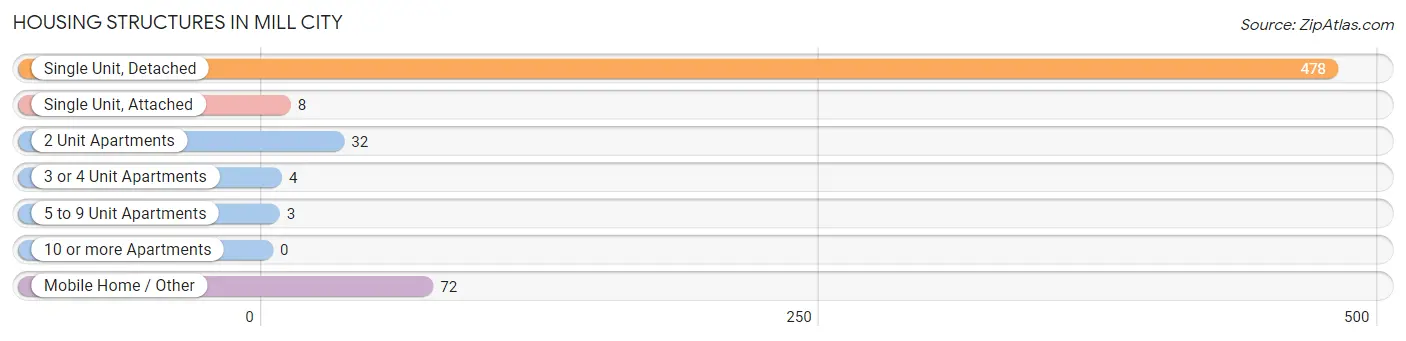
| Structure Type | # Housing Units | % Housing Units |
| Single Unit, Detached | 478 | 80.1% |
| Single Unit, Attached | 8 | 1.3% |
| 2 Unit Apartments | 32 | 5.4% |
| 3 or 4 Unit Apartments | 4 | 0.7% |
| 5 to 9 Unit Apartments | 3 | 0.5% |
| 10 or more Apartments | 0 | 0.0% |
| Mobile Home / Other | 72 | 12.1% |
| Total | 597 | 100.0% |
Housing Structures by Occupancy in Mill City
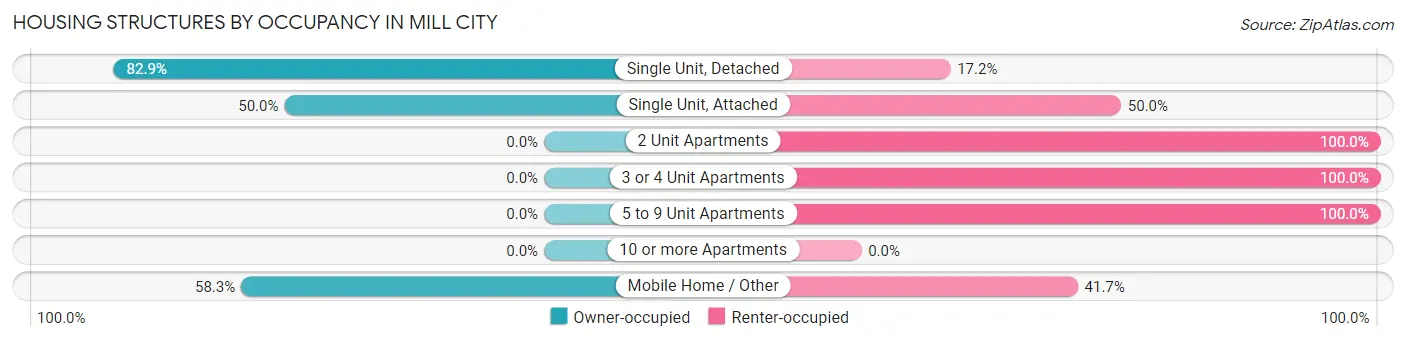
| Structure Type | Owner-occupied | Renter-occupied |
| Single Unit, Detached | 396 (82.9%) | 82 (17.2%) |
| Single Unit, Attached | 4 (50.0%) | 4 (50.0%) |
| 2 Unit Apartments | 0 (0.0%) | 32 (100.0%) |
| 3 or 4 Unit Apartments | 0 (0.0%) | 4 (100.0%) |
| 5 to 9 Unit Apartments | 0 (0.0%) | 3 (100.0%) |
| 10 or more Apartments | 0 (0.0%) | 0 (0.0%) |
| Mobile Home / Other | 42 (58.3%) | 30 (41.7%) |
| Total | 442 (74.0%) | 155 (26.0%) |
Housing Structures by Number of Rooms in Mill City
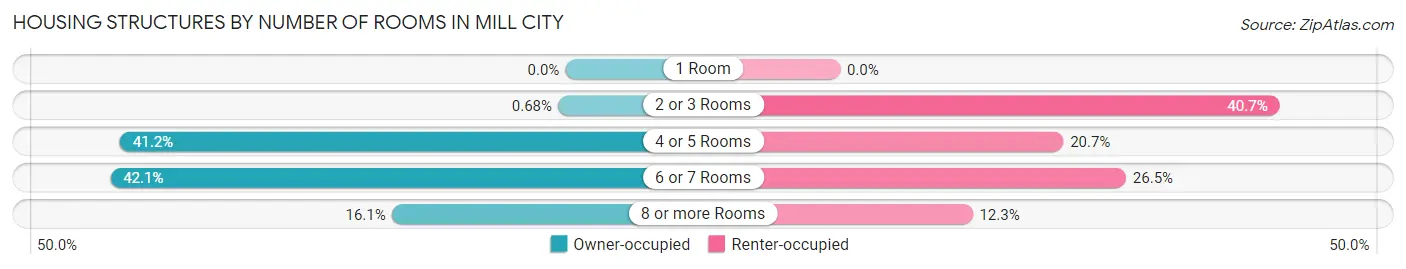
| Number of Rooms | Owner-occupied | Renter-occupied |
| 1 Room | 0 (0.0%) | 0 (0.0%) |
| 2 or 3 Rooms | 3 (0.7%) | 63 (40.6%) |
| 4 or 5 Rooms | 182 (41.2%) | 32 (20.6%) |
| 6 or 7 Rooms | 186 (42.1%) | 41 (26.5%) |
| 8 or more Rooms | 71 (16.1%) | 19 (12.3%) |
| Total | 442 (100.0%) | 155 (100.0%) |
Housing Structure by Heating Type in Mill City
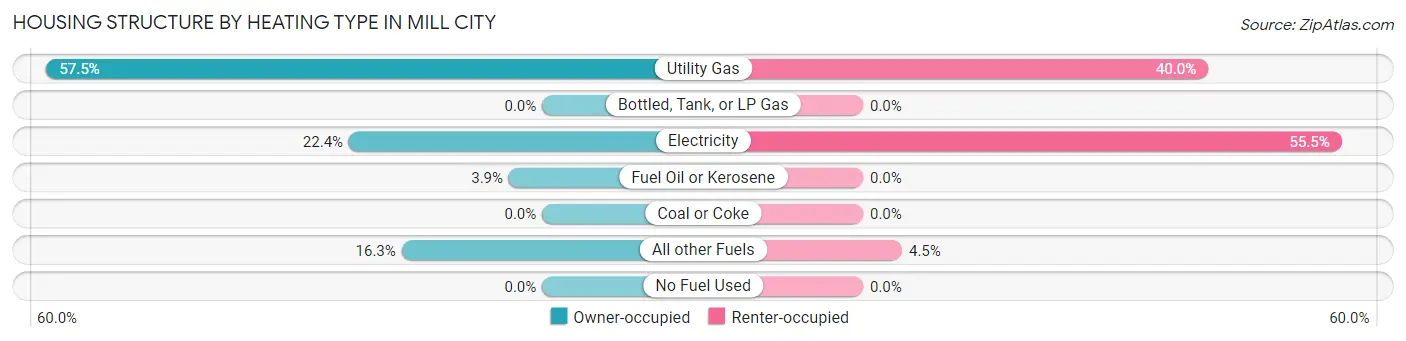
| Heating Type | Owner-occupied | Renter-occupied |
| Utility Gas | 254 (57.5%) | 62 (40.0%) |
| Bottled, Tank, or LP Gas | 0 (0.0%) | 0 (0.0%) |
| Electricity | 99 (22.4%) | 86 (55.5%) |
| Fuel Oil or Kerosene | 17 (3.8%) | 0 (0.0%) |
| Coal or Coke | 0 (0.0%) | 0 (0.0%) |
| All other Fuels | 72 (16.3%) | 7 (4.5%) |
| No Fuel Used | 0 (0.0%) | 0 (0.0%) |
| Total | 442 (100.0%) | 155 (100.0%) |
Household Vehicle Usage in Mill City
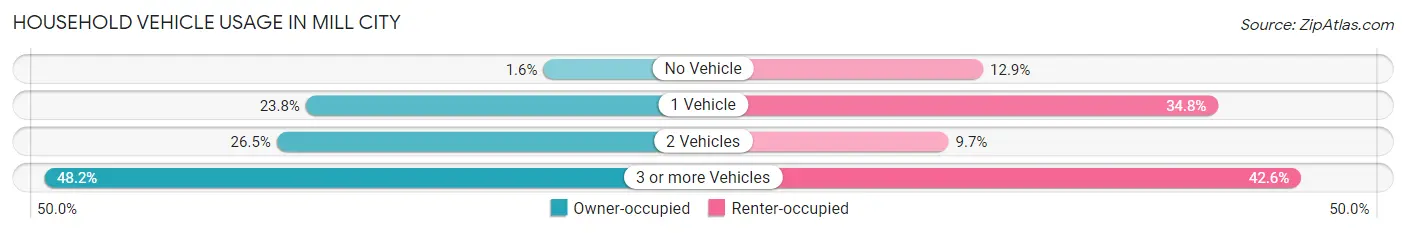
| Vehicles per Household | Owner-occupied | Renter-occupied |
| No Vehicle | 7 (1.6%) | 20 (12.9%) |
| 1 Vehicle | 105 (23.8%) | 54 (34.8%) |
| 2 Vehicles | 117 (26.5%) | 15 (9.7%) |
| 3 or more Vehicles | 213 (48.2%) | 66 (42.6%) |
| Total | 442 (100.0%) | 155 (100.0%) |
Real Estate & Mortgages in Mill City
Real Estate and Mortgage Overview in Mill City
| Characteristic | Without Mortgage | With Mortgage |
| Housing Units | 126 | 316 |
| Median Property Value | $215,300 | $284,800 |
| Median Household Income | - | - |
| Monthly Housing Costs | $510 | $7 |
| Real Estate Taxes | $2,385 | $0 |
Property Value by Mortgage Status in Mill City

| Property Value | Without Mortgage | With Mortgage |
| Less than $50,000 | 0 (0.0%) | 2 (0.6%) |
| $50,000 to $99,999 | 13 (10.3%) | 14 (4.4%) |
| $100,000 to $299,999 | 81 (64.3%) | 174 (55.1%) |
| $300,000 to $499,999 | 26 (20.6%) | 116 (36.7%) |
| $500,000 to $749,999 | 6 (4.8%) | 10 (3.2%) |
| $750,000 to $999,999 | 0 (0.0%) | 0 (0.0%) |
| $1,000,000 or more | 0 (0.0%) | 0 (0.0%) |
| Total | 126 (100.0%) | 316 (100.0%) |
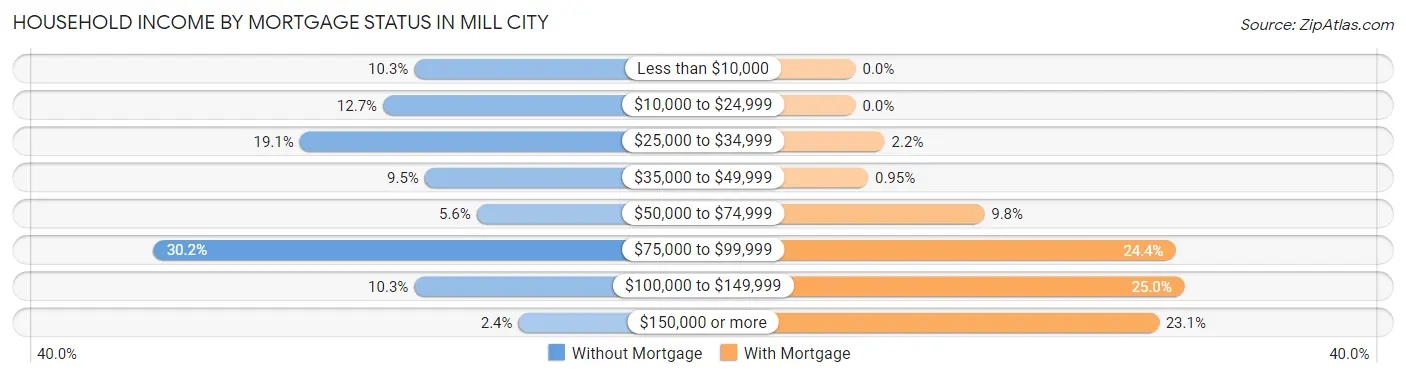
Household Income by Mortgage Status in Mill City
| Household Income | Without Mortgage | With Mortgage |
| Less than $10,000 | 13 (10.3%) | 0 (0.0%) |
| $10,000 to $24,999 | 16 (12.7%) | 0 (0.0%) |
| $25,000 to $34,999 | 24 (19.1%) | 7 (2.2%) |
| $35,000 to $49,999 | 12 (9.5%) | 3 (0.9%) |
| $50,000 to $74,999 | 7 (5.6%) | 31 (9.8%) |
| $75,000 to $99,999 | 38 (30.2%) | 77 (24.4%) |
| $100,000 to $149,999 | 13 (10.3%) | 79 (25.0%) |
| $150,000 or more | 3 (2.4%) | 73 (23.1%) |
| Total | 126 (100.0%) | 316 (100.0%) |
Property Value to Household Income Ratio in Mill City
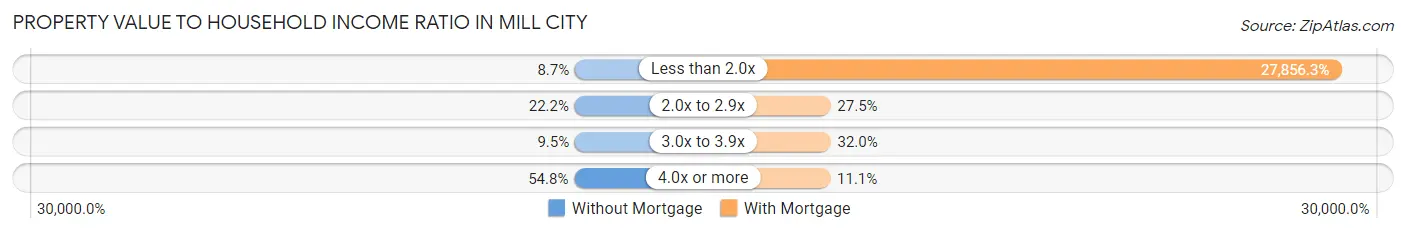
| Value-to-Income Ratio | Without Mortgage | With Mortgage |
| Less than 2.0x | 11 (8.7%) | 88,026 (27,856.3%) |
| 2.0x to 2.9x | 28 (22.2%) | 87 (27.5%) |
| 3.0x to 3.9x | 12 (9.5%) | 101 (32.0%) |
| 4.0x or more | 69 (54.8%) | 35 (11.1%) |
| Total | 126 (100.0%) | 316 (100.0%) |
Real Estate Taxes by Mortgage Status in Mill City
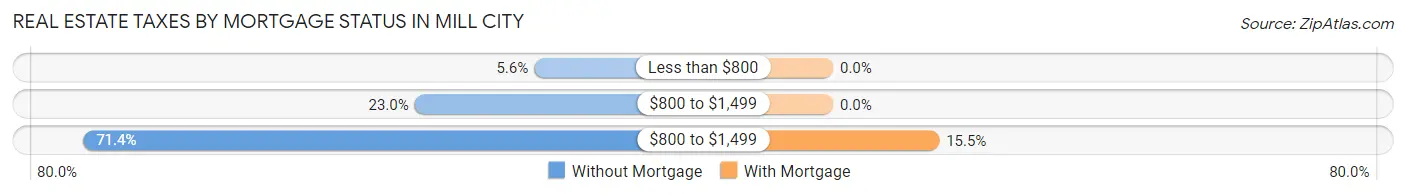
| Property Taxes | Without Mortgage | With Mortgage |
| Less than $800 | 7 (5.6%) | 0 (0.0%) |
| $800 to $1,499 | 29 (23.0%) | 0 (0.0%) |
| $800 to $1,499 | 90 (71.4%) | 49 (15.5%) |
| Total | 126 (100.0%) | 316 (100.0%) |
Health & Disability in Mill City
Health Insurance Coverage by Age in Mill City
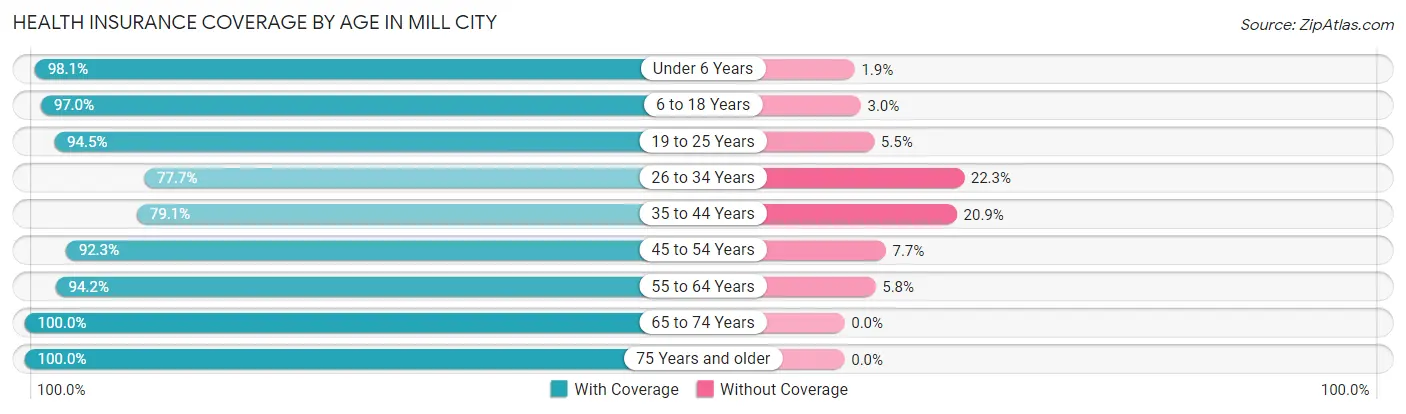
| Age Bracket | With Coverage | Without Coverage |
| Under 6 Years | 155 (98.1%) | 3 (1.9%) |
| 6 to 18 Years | 352 (97.0%) | 11 (3.0%) |
| 19 to 25 Years | 137 (94.5%) | 8 (5.5%) |
| 26 to 34 Years | 157 (77.7%) | 45 (22.3%) |
| 35 to 44 Years | 151 (79.1%) | 40 (20.9%) |
| 45 to 54 Years | 180 (92.3%) | 15 (7.7%) |
| 55 to 64 Years | 212 (94.2%) | 13 (5.8%) |
| 65 to 74 Years | 164 (100.0%) | 0 (0.0%) |
| 75 Years and older | 117 (100.0%) | 0 (0.0%) |
| Total | 1,625 (92.3%) | 135 (7.7%) |
Health Insurance Coverage by Citizenship Status in Mill City
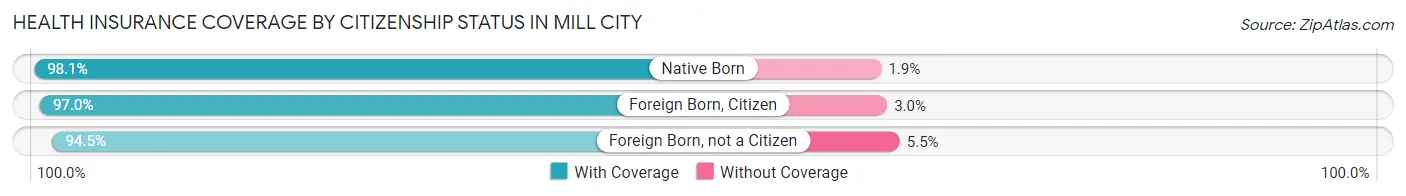
| Citizenship Status | With Coverage | Without Coverage |
| Native Born | 155 (98.1%) | 3 (1.9%) |
| Foreign Born, Citizen | 352 (97.0%) | 11 (3.0%) |
| Foreign Born, not a Citizen | 137 (94.5%) | 8 (5.5%) |
Health Insurance Coverage by Household Income in Mill City
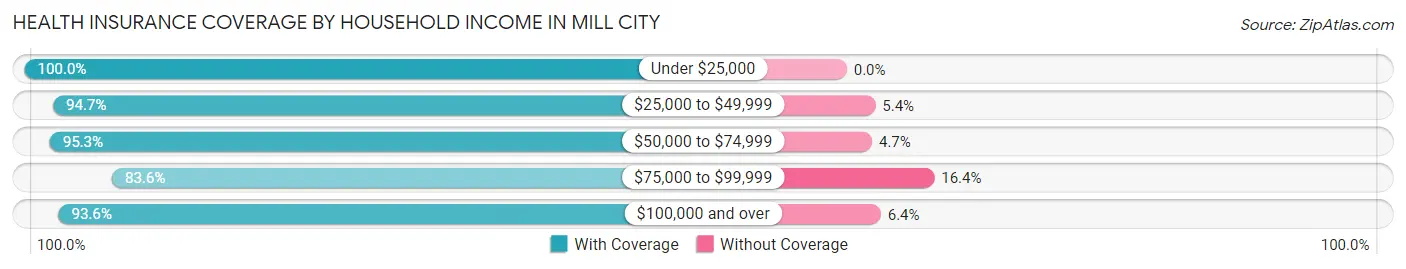
| Household Income | With Coverage | Without Coverage |
| Under $25,000 | 182 (100.0%) | 0 (0.0%) |
| $25,000 to $49,999 | 177 (94.7%) | 10 (5.3%) |
| $50,000 to $74,999 | 302 (95.3%) | 15 (4.7%) |
| $75,000 to $99,999 | 347 (83.6%) | 68 (16.4%) |
| $100,000 and over | 617 (93.6%) | 42 (6.4%) |
Public vs Private Health Insurance Coverage by Age in Mill City
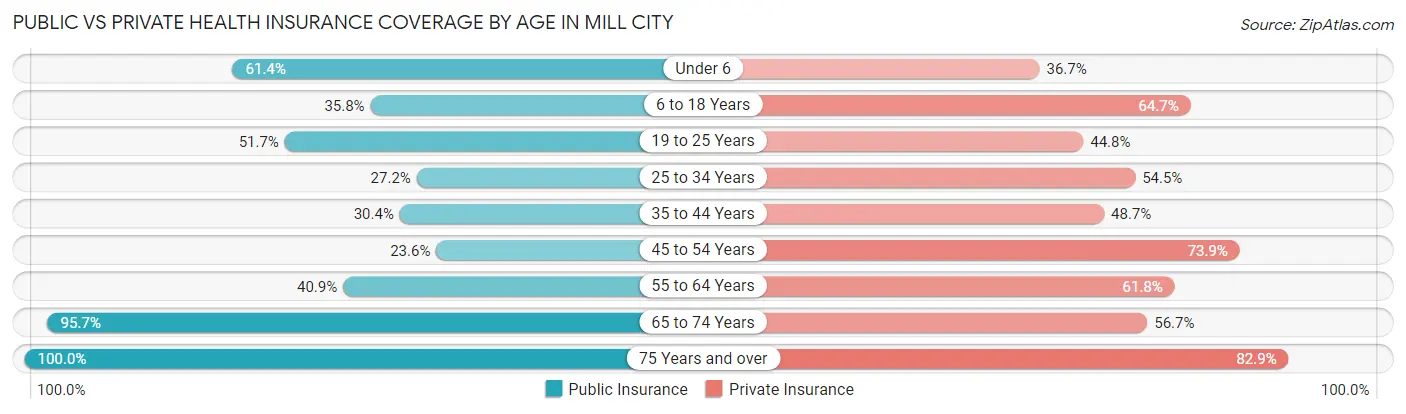
| Age Bracket | Public Insurance | Private Insurance |
| Under 6 | 97 (61.4%) | 58 (36.7%) |
| 6 to 18 Years | 130 (35.8%) | 235 (64.7%) |
| 19 to 25 Years | 75 (51.7%) | 65 (44.8%) |
| 25 to 34 Years | 55 (27.2%) | 110 (54.5%) |
| 35 to 44 Years | 58 (30.4%) | 93 (48.7%) |
| 45 to 54 Years | 46 (23.6%) | 144 (73.9%) |
| 55 to 64 Years | 92 (40.9%) | 139 (61.8%) |
| 65 to 74 Years | 157 (95.7%) | 93 (56.7%) |
| 75 Years and over | 117 (100.0%) | 97 (82.9%) |
| Total | 827 (47.0%) | 1,034 (58.8%) |
Disability Status by Sex by Age in Mill City
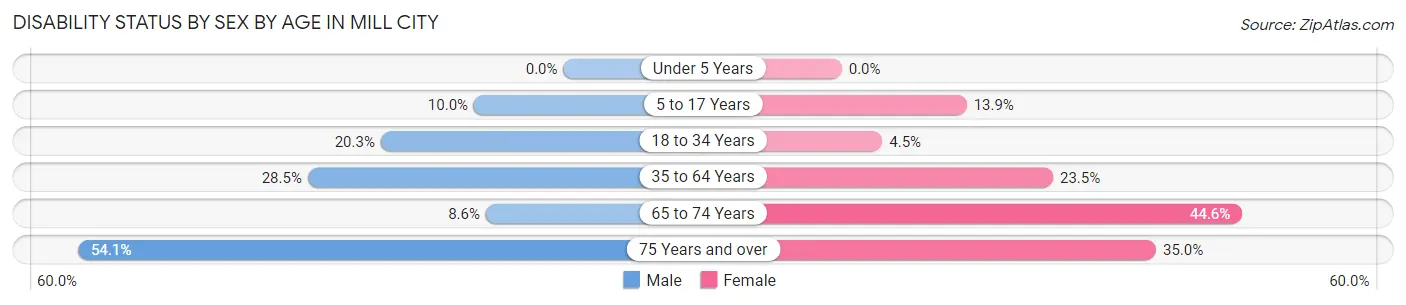
| Age Bracket | Male | Female |
| Under 5 Years | 0 (0.0%) | 0 (0.0%) |
| 5 to 17 Years | 23 (10.0%) | 21 (13.9%) |
| 18 to 34 Years | 36 (20.3%) | 8 (4.5%) |
| 35 to 64 Years | 82 (28.5%) | 76 (23.5%) |
| 65 to 74 Years | 7 (8.6%) | 37 (44.6%) |
| 75 Years and over | 20 (54.0%) | 28 (35.0%) |
Disability Class by Sex by Age in Mill City
Disability Class: Hearing Difficulty
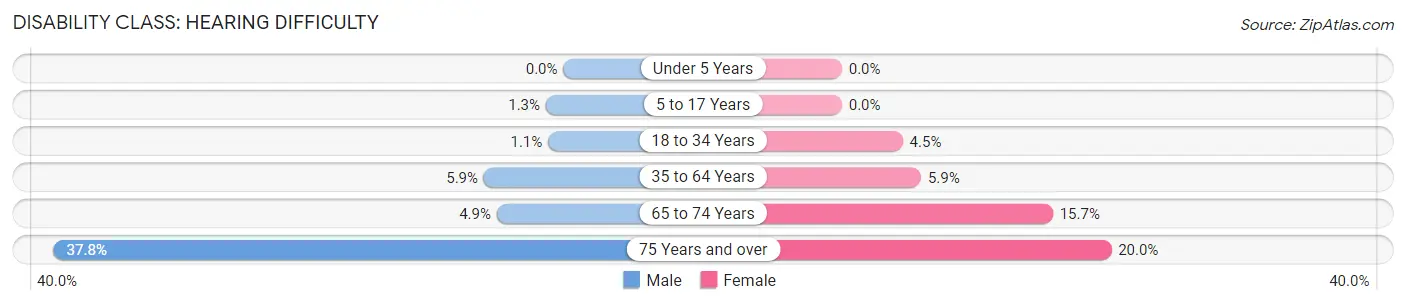
| Age Bracket | Male | Female |
| Under 5 Years | 0 (0.0%) | 0 (0.0%) |
| 5 to 17 Years | 3 (1.3%) | 0 (0.0%) |
| 18 to 34 Years | 2 (1.1%) | 8 (4.5%) |
| 35 to 64 Years | 17 (5.9%) | 19 (5.9%) |
| 65 to 74 Years | 4 (4.9%) | 13 (15.7%) |
| 75 Years and over | 14 (37.8%) | 16 (20.0%) |
Disability Class: Vision Difficulty
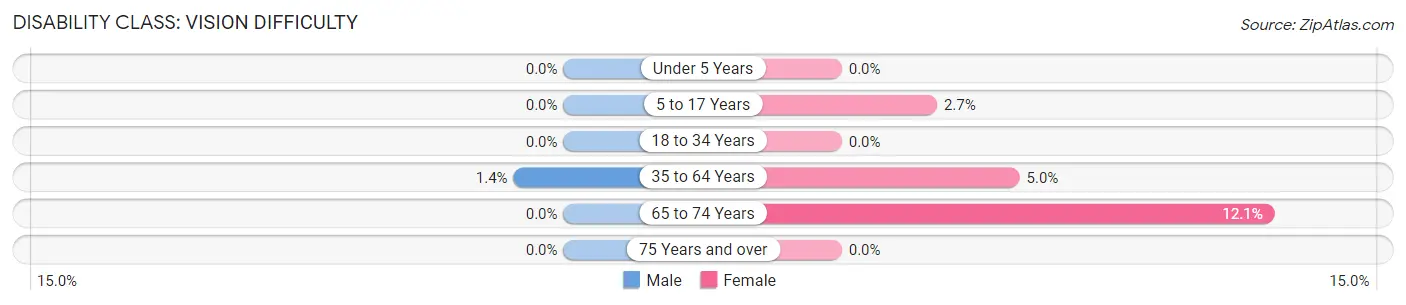
| Age Bracket | Male | Female |
| Under 5 Years | 0 (0.0%) | 0 (0.0%) |
| 5 to 17 Years | 0 (0.0%) | 4 (2.6%) |
| 18 to 34 Years | 0 (0.0%) | 0 (0.0%) |
| 35 to 64 Years | 4 (1.4%) | 16 (5.0%) |
| 65 to 74 Years | 0 (0.0%) | 10 (12.0%) |
| 75 Years and over | 0 (0.0%) | 0 (0.0%) |
Disability Class: Cognitive Difficulty
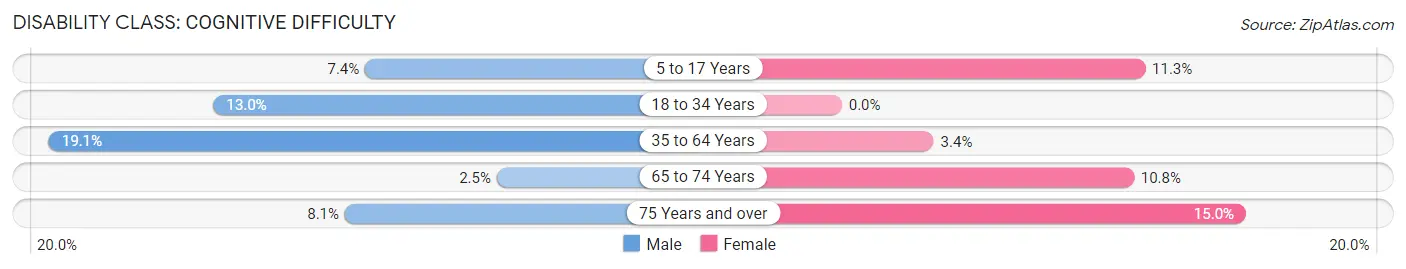
| Age Bracket | Male | Female |
| 5 to 17 Years | 17 (7.4%) | 17 (11.3%) |
| 18 to 34 Years | 23 (13.0%) | 0 (0.0%) |
| 35 to 64 Years | 55 (19.1%) | 11 (3.4%) |
| 65 to 74 Years | 2 (2.5%) | 9 (10.8%) |
| 75 Years and over | 3 (8.1%) | 12 (15.0%) |
Disability Class: Ambulatory Difficulty
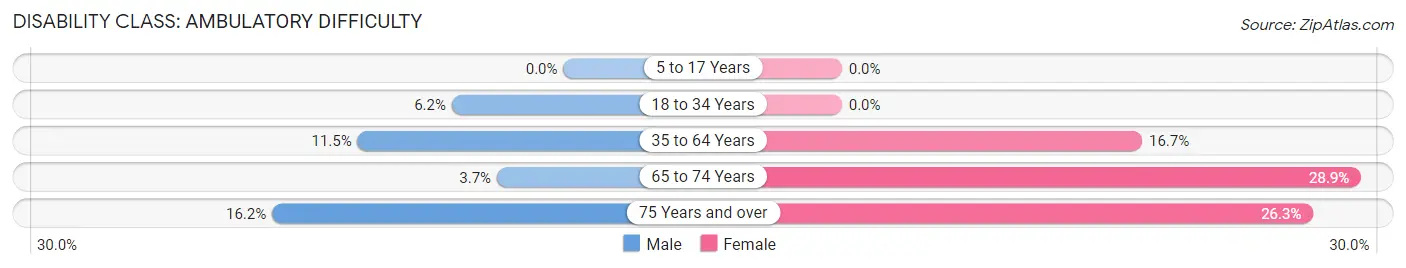
| Age Bracket | Male | Female |
| 5 to 17 Years | 0 (0.0%) | 0 (0.0%) |
| 18 to 34 Years | 11 (6.2%) | 0 (0.0%) |
| 35 to 64 Years | 33 (11.5%) | 54 (16.7%) |
| 65 to 74 Years | 3 (3.7%) | 24 (28.9%) |
| 75 Years and over | 6 (16.2%) | 21 (26.3%) |
Disability Class: Self-Care Difficulty
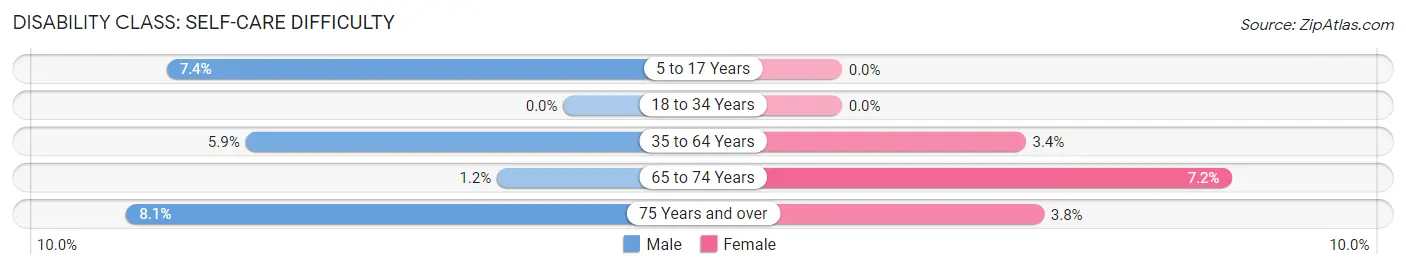
| Age Bracket | Male | Female |
| 5 to 17 Years | 17 (7.4%) | 0 (0.0%) |
| 18 to 34 Years | 0 (0.0%) | 0 (0.0%) |
| 35 to 64 Years | 17 (5.9%) | 11 (3.4%) |
| 65 to 74 Years | 1 (1.2%) | 6 (7.2%) |
| 75 Years and over | 3 (8.1%) | 3 (3.7%) |
Technology Access in Mill City
Computing Device Access in Mill City
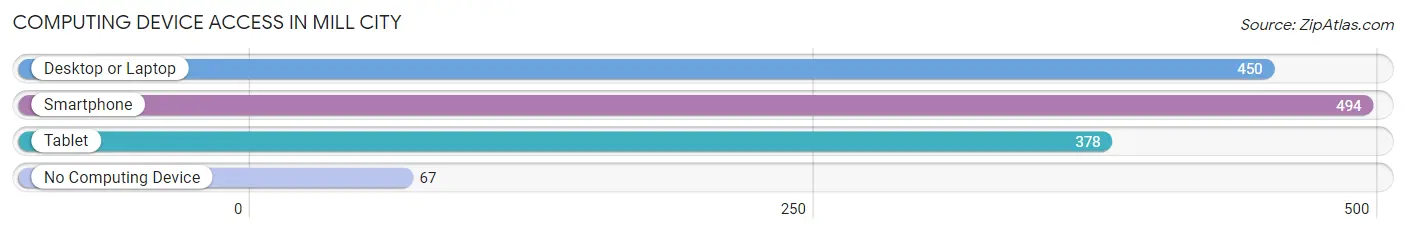
| Device Type | # Households | % Households |
| Desktop or Laptop | 450 | 75.4% |
| Smartphone | 494 | 82.8% |
| Tablet | 378 | 63.3% |
| No Computing Device | 67 | 11.2% |
| Total | 597 | 100.0% |
Internet Access in Mill City
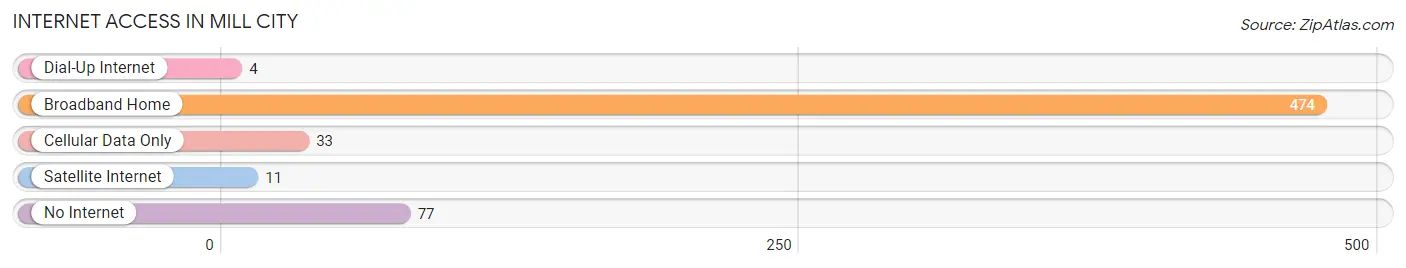
| Internet Type | # Households | % Households |
| Dial-Up Internet | 4 | 0.7% |
| Broadband Home | 474 | 79.4% |
| Cellular Data Only | 33 | 5.5% |
| Satellite Internet | 11 | 1.8% |
| No Internet | 77 | 12.9% |
| Total | 597 | 100.0% |
Mill City Summary
History
The city of Mill City, Oregon is located in the foothills of the Cascade Mountains in the Santiam Canyon. It is situated along the North Santiam River, which is a tributary of the Willamette River. The city was founded in 1872 by a group of settlers who were looking for a place to build a sawmill. The sawmill was built on the banks of the North Santiam River and the city was named after it.
The first settlers in Mill City were mostly loggers and farmers who were looking to make a living off of the abundant timber in the area. The sawmill provided the lumber for the construction of homes and businesses in the area. The city quickly grew and by the early 1900s, it had become a bustling community with a population of over 1,000 people.
The city was also home to a number of other industries, including a flour mill, a woolen mill, a cannery, and a brickyard. The city was also home to a number of churches, schools, and other businesses.
In the early 1900s, the city was also home to a number of saloons and gambling halls. This led to a period of lawlessness in the city, which was eventually brought under control by the local sheriff.
In the 1920s, the city began to experience a decline in population as people moved away to larger cities. This decline continued until the 1950s when the city began to experience a resurgence in population. This was due to the construction of the Detroit Dam, which provided hydroelectric power to the area.
The city has continued to grow since then and is now home to over 2 000 people
Geography
Mill City is located in the foothills of the Cascade Mountains in the Santiam Canyon. It is situated along the North Santiam River, which is a tributary of the Willamette River. The city is located in Marion County and is about 40 miles southeast of Salem, the state capital.
The city is surrounded by the Cascade Mountains to the east and the Willamette Valley to the west. The city is located at an elevation of about 1,000 feet and has a total area of 1.3 square miles.
The climate in Mill City is generally mild and temperate. The average high temperature in the summer is around 80 degrees Fahrenheit and the average low temperature in the winter is around 40 degrees Fahrenheit.
Economy
The economy of Mill City is largely based on the timber industry. The city is home to a number of sawmills and lumber companies that provide jobs for many of the city’s residents. The city is also home to a number of other businesses, including a flour mill, a woolen mill, a cannery, and a brickyard.
The city is also home to a number of retail stores, restaurants, and other businesses. The city is also home to a number of churches, schools, and other organizations.
Demographics
As of the 2010 census, the population of Mill City was 2,093. The racial makeup of the city was 95.3% White, 0.7% African American, 0.3% Native American, 0.7% Asian, 0.1% Pacific Islander, 0.7% from other races, and 2.1% from two or more races. Hispanic or Latino of any race were 2.3% of the population.
The median income for a household in the city was $37,917 and the median income for a family was $45,625. The per capita income for the city was $19,945. About 11.3% of families and 14.2% of the population were below the poverty line, including 19.2% of those under age 18 and 8.3% of those age 65 or over.
Common Questions
What is Per Capita Income in Mill City?
Per Capita income in Mill City is $25,858.
What is the Median Family Income in Mill City?
Median Family Income in Mill City is $76,295.
What is the Median Household income in Mill City?
Median Household Income in Mill City is $73,625.
What is Income or Wage Gap in Mill City?
Income or Wage Gap in Mill City is 53.6%.
Women in Mill City earn 46.4 cents for every dollar earned by a man.
What is Inequality or Gini Index in Mill City?
Inequality or Gini Index in Mill City is 0.36.
What is the Total Population of Mill City?
Total Population of Mill City is 1,760.
What is the Total Male Population of Mill City?
Total Male Population of Mill City is 861.
What is the Total Female Population of Mill City?
Total Female Population of Mill City is 899.
What is the Ratio of Males per 100 Females in Mill City?
There are 95.77 Males per 100 Females in Mill City.
What is the Ratio of Females per 100 Males in Mill City?
There are 104.41 Females per 100 Males in Mill City.
What is the Median Population Age in Mill City?
Median Population Age in Mill City is 35.8 Years.
What is the Average Family Size in Mill City
Average Family Size in Mill City is 3.5 People.
What is the Average Household Size in Mill City
Average Household Size in Mill City is 3.0 People.
How Large is the Labor Force in Mill City?
There are 786 People in the Labor Forcein in Mill City.
What is the Percentage of People in the Labor Force in Mill City?
58.3% of People are in the Labor Force in Mill City.
What is the Unemployment Rate in Mill City?
Unemployment Rate in Mill City is 9.9%.