Zip Codes with the Highest Percentage of Population with a Degree in Physical and Health Sciences in Oregon
RELATED REPORTS & OPTIONS
Physical and Health Sciences
Oregon
Compare Zip Codes
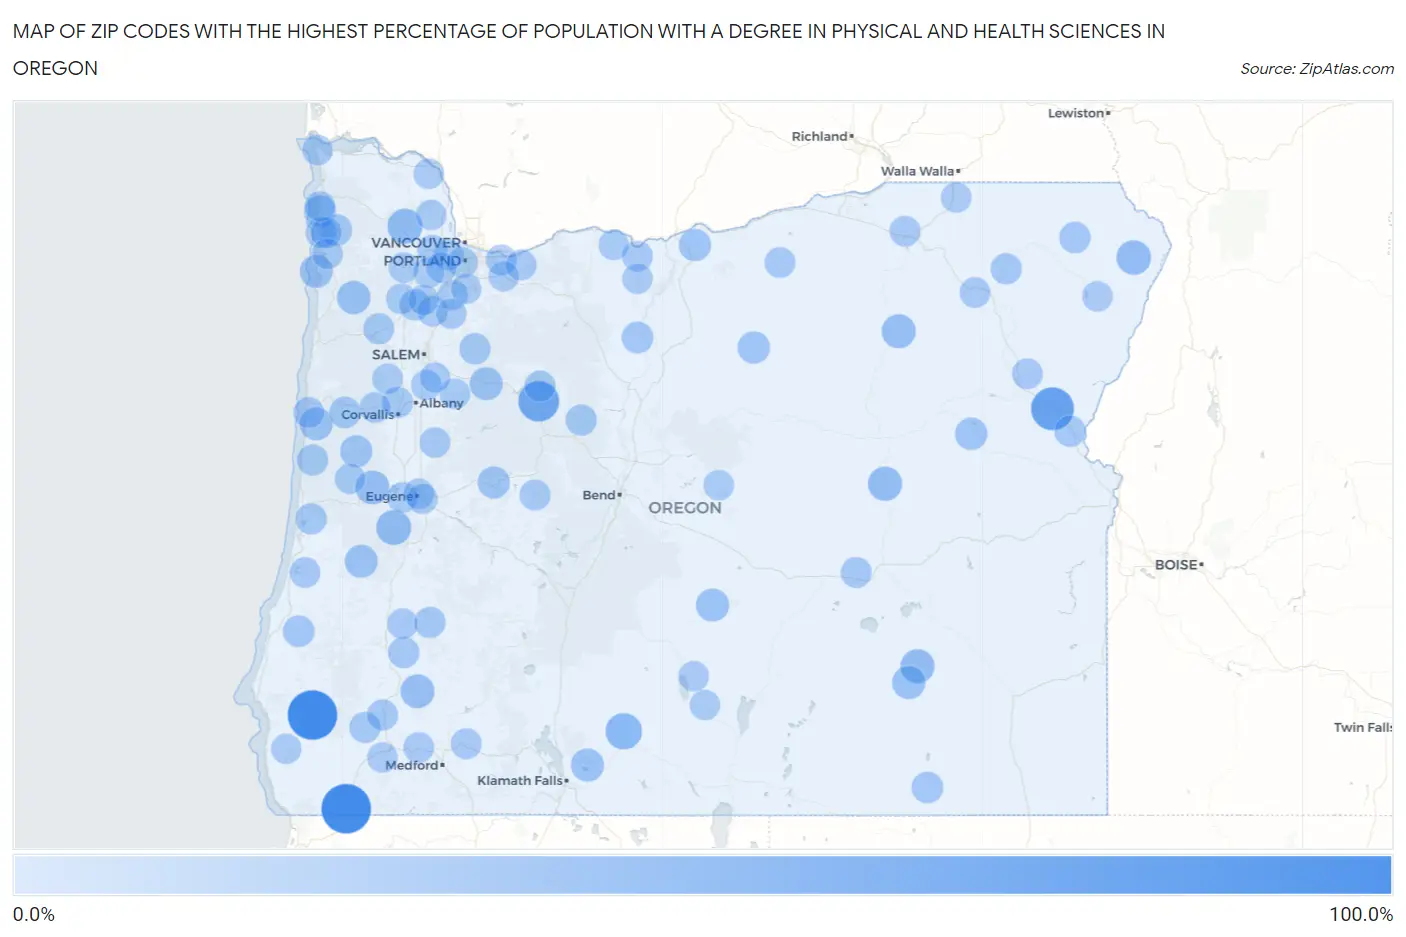
Map of Zip Codes with the Highest Percentage of Population with a Degree in Physical and Health Sciences in Oregon
0.0%
100.0%
Zip Codes with the Highest Percentage of Population with a Degree in Physical and Health Sciences in Oregon
| Zip Code | % Graduates | vs State | vs National | |
| 1. | 97534 | 100.0% | 3.9%(+96.1)#1 | 3.1%(+96.9)#4 |
| 2. | 97406 | 100.0% | 3.9%(+96.1)#2 | 3.1%(+96.9)#8 |
| 3. | 97905 | 66.7% | 3.9%(+62.8)#3 | 3.1%(+63.6)#38 |
| 4. | 97350 | 55.6% | 3.9%(+51.7)#4 | 3.1%(+52.5)#49 |
| 5. | 97621 | 33.3% | 3.9%(+29.4)#5 | 3.1%(+30.2)#149 |
| 6. | 97109 | 27.7% | 3.9%(+23.8)#6 | 3.1%(+24.6)#218 |
| 7. | 97451 | 27.3% | 3.9%(+23.4)#7 | 3.1%(+24.2)#225 |
| 8. | 97842 | 25.0% | 3.9%(+21.1)#8 | 3.1%(+21.9)#280 |
| 9. | 97873 | 23.5% | 3.9%(+19.6)#9 | 3.1%(+20.4)#305 |
| 10. | 97722 | 23.1% | 3.9%(+19.2)#10 | 3.1%(+20.0)#319 |
| 11. | 97880 | 22.5% | 3.9%(+18.6)#11 | 3.1%(+19.4)#331 |
| 12. | 97410 | 21.7% | 3.9%(+17.8)#12 | 3.1%(+18.6)#357 |
| 13. | 97461 | 21.6% | 3.9%(+17.7)#13 | 3.1%(+18.5)#362 |
| 14. | 97108 | 19.5% | 3.9%(+15.6)#14 | 3.1%(+16.4)#426 |
| 15. | 97721 | 18.9% | 3.9%(+15.0)#15 | 3.1%(+15.8)#447 |
| 16. | 97376 | 18.5% | 3.9%(+14.6)#16 | 3.1%(+15.4)#471 |
| 17. | 97360 | 18.2% | 3.9%(+14.3)#17 | 3.1%(+15.1)#483 |
| 18. | 97134 | 17.9% | 3.9%(+14.0)#18 | 3.1%(+14.8)#502 |
| 19. | 97625 | 17.6% | 3.9%(+13.7)#19 | 3.1%(+14.5)#518 |
| 20. | 97641 | 17.5% | 3.9%(+13.6)#20 | 3.1%(+14.4)#523 |
| 21. | 97436 | 17.4% | 3.9%(+13.5)#21 | 3.1%(+14.3)#528 |
| 22. | 97884 | 14.3% | 3.9%(+10.4)#22 | 3.1%(+11.2)#746 |
| 23. | 97830 | 14.0% | 3.9%(+10.1)#23 | 3.1%(+10.9)#766 |
| 24. | 97488 | 13.9% | 3.9%(+10.0)#24 | 3.1%(+10.8)#772 |
| 25. | 97324 | 13.8% | 3.9%(+9.87)#25 | 3.1%(+10.7)#794 |
| 26. | 97065 | 13.6% | 3.9%(+9.74)#26 | 3.1%(+10.5)#808 |
| 27. | 97102 | 13.2% | 3.9%(+9.26)#27 | 3.1%(+10.1)#856 |
| 28. | 97037 | 11.4% | 3.9%(+7.54)#28 | 3.1%(+8.34)#1,087 |
| 29. | 97423 | 11.3% | 3.9%(+7.40)#29 | 3.1%(+8.20)#1,108 |
| 30. | 97131 | 11.3% | 3.9%(+7.35)#30 | 3.1%(+8.15)#1,114 |
| 31. | 97343 | 11.1% | 3.9%(+7.21)#31 | 3.1%(+8.01)#1,143 |
| 32. | 97710 | 11.1% | 3.9%(+7.21)#32 | 3.1%(+8.01)#1,153 |
| 33. | 97828 | 9.8% | 3.9%(+5.93)#33 | 3.1%(+6.73)#1,411 |
| 34. | 97457 | 9.7% | 3.9%(+5.79)#34 | 3.1%(+6.59)#1,443 |
| 35. | 97375 | 9.6% | 3.9%(+5.67)#35 | 3.1%(+6.47)#1,472 |
| 36. | 97730 | 9.4% | 3.9%(+5.48)#36 | 3.1%(+6.28)#1,534 |
| 37. | 97498 | 9.3% | 3.9%(+5.42)#37 | 3.1%(+6.22)#1,548 |
| 38. | 97532 | 9.3% | 3.9%(+5.36)#38 | 3.1%(+6.16)#1,569 |
| 39. | 97130 | 9.2% | 3.9%(+5.33)#39 | 3.1%(+6.13)#1,579 |
| 40. | 97127 | 9.1% | 3.9%(+5.17)#40 | 3.1%(+5.97)#1,642 |
| 41. | 97493 | 9.0% | 3.9%(+5.09)#41 | 3.1%(+5.89)#1,669 |
| 42. | 97907 | 9.0% | 3.9%(+5.06)#42 | 3.1%(+5.86)#1,677 |
| 43. | 97330 | 8.9% | 3.9%(+5.01)#43 | 3.1%(+5.81)#1,700 |
| 44. | 97443 | 8.6% | 3.9%(+4.73)#44 | 3.1%(+5.53)#1,794 |
| 45. | 97841 | 8.5% | 3.9%(+4.57)#45 | 3.1%(+5.37)#1,848 |
| 46. | 97342 | 8.3% | 3.9%(+4.43)#46 | 3.1%(+5.23)#1,897 |
| 47. | 97378 | 8.2% | 3.9%(+4.29)#47 | 3.1%(+5.09)#1,942 |
| 48. | 97738 | 8.0% | 3.9%(+4.09)#48 | 3.1%(+4.89)#2,028 |
| 49. | 97497 | 8.0% | 3.9%(+4.06)#49 | 3.1%(+4.86)#2,033 |
| 50. | 97366 | 7.8% | 3.9%(+3.89)#50 | 3.1%(+4.69)#2,105 |
| 51. | 97370 | 7.5% | 3.9%(+3.63)#51 | 3.1%(+4.43)#2,231 |
| 52. | 97413 | 7.4% | 3.9%(+3.54)#52 | 3.1%(+4.34)#2,280 |
| 53. | 97524 | 7.4% | 3.9%(+3.53)#53 | 3.1%(+4.33)#2,284 |
| 54. | 97147 | 7.2% | 3.9%(+3.29)#54 | 3.1%(+4.09)#2,414 |
| 55. | 97801 | 7.1% | 3.9%(+3.19)#55 | 3.1%(+3.99)#2,462 |
| 56. | 97060 | 7.0% | 3.9%(+3.13)#56 | 3.1%(+3.93)#2,479 |
| 57. | 97058 | 6.9% | 3.9%(+3.03)#57 | 3.1%(+3.83)#2,552 |
| 58. | 97843 | 6.8% | 3.9%(+2.95)#58 | 3.1%(+3.75)#2,599 |
| 59. | 97814 | 6.8% | 3.9%(+2.89)#59 | 3.1%(+3.69)#2,636 |
| 60. | 97402 | 6.7% | 3.9%(+2.84)#60 | 3.1%(+3.64)#2,670 |
| 61. | 97019 | 6.7% | 3.9%(+2.77)#61 | 3.1%(+3.57)#2,717 |
| 62. | 97525 | 6.5% | 3.9%(+2.60)#62 | 3.1%(+3.40)#2,825 |
| 63. | 97470 | 6.4% | 3.9%(+2.48)#63 | 3.1%(+3.28)#2,922 |
| 64. | 97850 | 6.4% | 3.9%(+2.47)#64 | 3.1%(+3.27)#2,932 |
| 65. | 97107 | 6.4% | 3.9%(+2.46)#65 | 3.1%(+3.26)#2,941 |
| 66. | 97137 | 6.2% | 3.9%(+2.35)#66 | 3.1%(+3.15)#3,036 |
| 67. | 97449 | 6.2% | 3.9%(+2.33)#67 | 3.1%(+3.13)#3,057 |
| 68. | 97361 | 6.2% | 3.9%(+2.30)#68 | 3.1%(+3.10)#3,086 |
| 69. | 97327 | 6.1% | 3.9%(+2.18)#69 | 3.1%(+2.98)#3,190 |
| 70. | 97201 | 6.0% | 3.9%(+2.11)#70 | 3.1%(+2.91)#3,254 |
| 71. | 97111 | 6.0% | 3.9%(+2.09)#71 | 3.1%(+2.89)#3,278 |
| 72. | 97846 | 5.9% | 3.9%(+2.03)#72 | 3.1%(+2.83)#3,332 |
| 73. | 97009 | 5.9% | 3.9%(+2.03)#73 | 3.1%(+2.83)#3,336 |
| 74. | 97229 | 5.9% | 3.9%(+1.98)#74 | 3.1%(+2.78)#3,388 |
| 75. | 97121 | 5.8% | 3.9%(+1.93)#75 | 3.1%(+2.73)#3,444 |
| 76. | 97862 | 5.8% | 3.9%(+1.90)#76 | 3.1%(+2.70)#3,467 |
| 77. | 97124 | 5.8% | 3.9%(+1.89)#77 | 3.1%(+2.69)#3,481 |
| 78. | 97123 | 5.7% | 3.9%(+1.82)#78 | 3.1%(+2.62)#3,534 |
| 79. | 97021 | 5.6% | 3.9%(+1.73)#79 | 3.1%(+2.53)#3,645 |
| 80. | 97078 | 5.6% | 3.9%(+1.72)#80 | 3.1%(+2.52)#3,668 |
| 81. | 97056 | 5.6% | 3.9%(+1.71)#81 | 3.1%(+2.51)#3,673 |
| 82. | 97374 | 5.6% | 3.9%(+1.67)#82 | 3.1%(+2.47)#3,726 |
| 83. | 97401 | 5.6% | 3.9%(+1.66)#83 | 3.1%(+2.46)#3,741 |
| 84. | 97040 | 5.5% | 3.9%(+1.63)#84 | 3.1%(+2.43)#3,793 |
| 85. | 97352 | 5.5% | 3.9%(+1.60)#85 | 3.1%(+2.40)#3,818 |
| 86. | 97754 | 5.5% | 3.9%(+1.57)#86 | 3.1%(+2.37)#3,864 |
| 87. | 97070 | 5.4% | 3.9%(+1.52)#87 | 3.1%(+2.32)#3,925 |
| 88. | 97430 | 5.4% | 3.9%(+1.51)#88 | 3.1%(+2.31)#3,941 |
| 89. | 97403 | 5.4% | 3.9%(+1.48)#89 | 3.1%(+2.28)#3,981 |
| 90. | 97392 | 5.3% | 3.9%(+1.44)#90 | 3.1%(+2.24)#4,022 |
| 91. | 97636 | 5.3% | 3.9%(+1.43)#91 | 3.1%(+2.23)#4,041 |
| 92. | 97068 | 5.3% | 3.9%(+1.37)#92 | 3.1%(+2.17)#4,126 |
| 93. | 97640 | 5.3% | 3.9%(+1.36)#93 | 3.1%(+2.16)#4,143 |
| 94. | 97527 | 5.3% | 3.9%(+1.36)#94 | 3.1%(+2.16)#4,147 |
| 95. | 97145 | 5.2% | 3.9%(+1.32)#95 | 3.1%(+2.12)#4,193 |
| 96. | 97048 | 5.2% | 3.9%(+1.32)#96 | 3.1%(+2.12)#4,194 |
| 97. | 97115 | 5.2% | 3.9%(+1.32)#97 | 3.1%(+2.12)#4,206 |
| 98. | 97119 | 5.2% | 3.9%(+1.31)#98 | 3.1%(+2.11)#4,211 |
| 99. | 97032 | 5.1% | 3.9%(+1.16)#99 | 3.1%(+1.96)#4,454 |
| 100. | 97444 | 5.0% | 3.9%(+1.13)#100 | 3.1%(+1.93)#4,495 |
Common Questions
What are the Top 10 Zip Codes with the Highest Percentage of Population with a Degree in Physical and Health Sciences in Oregon?
Top 10 Zip Codes with the Highest Percentage of Population with a Degree in Physical and Health Sciences in Oregon are:
What zip code has the Highest Percentage of Population with a Degree in Physical and Health Sciences in Oregon?
97534 has the Highest Percentage of Population with a Degree in Physical and Health Sciences in Oregon with 100.0%.
What is the Percentage of Population with a Degree in Physical and Health Sciences in the State of Oregon?
Percentage of Population with a Degree in Physical and Health Sciences in Oregon is 3.9%.
What is the Percentage of Population with a Degree in Physical and Health Sciences in the United States?
Percentage of Population with a Degree in Physical and Health Sciences in the United States is 3.1%.