Zip Codes with the Highest Percentage of Population Employed in Security & Protection in Oregon
RELATED REPORTS & OPTIONS
Security & Protection
Oregon
Compare Zip Codes
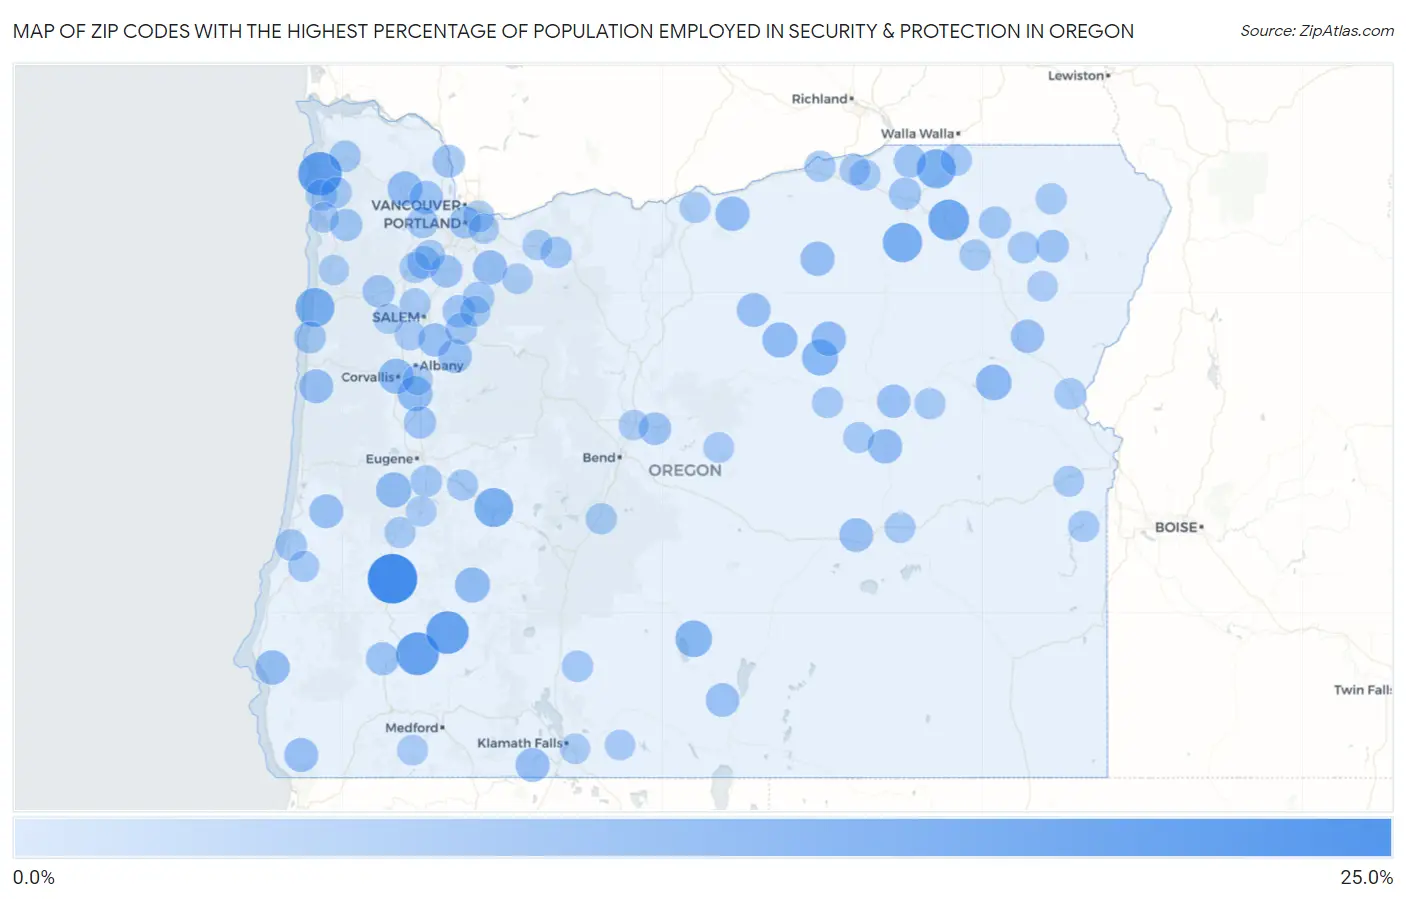
Map of Zip Codes with the Highest Percentage of Population Employed in Security & Protection in Oregon
0.0%
25.0%
Zip Codes with the Highest Percentage of Population Employed in Security & Protection in Oregon
| Zip Code | % Employed | vs State | vs National | |
| 1. | 97495 | 24.1% | 1.7%(+22.4)#1 | 2.1%(+21.9)#141 |
| 2. | 97102 | 17.1% | 1.7%(+15.5)#2 | 2.1%(+15.0)#283 |
| 3. | 97410 | 16.3% | 1.7%(+14.6)#3 | 2.1%(+14.1)#303 |
| 4. | 97484 | 16.1% | 1.7%(+14.4)#4 | 2.1%(+13.9)#313 |
| 5. | 97859 | 14.0% | 1.7%(+12.4)#5 | 2.1%(+11.9)#417 |
| 6. | 97868 | 12.3% | 1.7%(+10.6)#6 | 2.1%(+10.2)#527 |
| 7. | 97463 | 12.0% | 1.7%(+10.3)#7 | 2.1%(+9.83)#551 |
| 8. | 97813 | 12.0% | 1.7%(+10.3)#8 | 2.1%(+9.82)#552 |
| 9. | 97364 | 11.8% | 1.7%(+10.2)#9 | 2.1%(+9.69)#564 |
| 10. | 97640 | 9.4% | 1.7%(+7.78)#10 | 2.1%(+7.29)#852 |
| 11. | 97848 | 8.8% | 1.7%(+7.17)#11 | 2.1%(+6.68)#947 |
| 12. | 97837 | 8.3% | 1.7%(+6.68)#12 | 2.1%(+6.18)#1,067 |
| 13. | 97451 | 7.9% | 1.7%(+6.22)#13 | 2.1%(+5.72)#1,212 |
| 14. | 97874 | 7.8% | 1.7%(+6.17)#14 | 2.1%(+5.68)#1,230 |
| 15. | 97447 | 7.8% | 1.7%(+6.10)#15 | 2.1%(+5.61)#1,252 |
| 16. | 97331 | 7.7% | 1.7%(+6.02)#16 | 2.1%(+5.52)#1,274 |
| 17. | 97377 | 7.6% | 1.7%(+5.95)#17 | 2.1%(+5.45)#1,295 |
| 18. | 97109 | 7.4% | 1.7%(+5.71)#18 | 2.1%(+5.22)#1,375 |
| 19. | 97864 | 7.0% | 1.7%(+5.36)#19 | 2.1%(+4.87)#1,523 |
| 20. | 97812 | 6.9% | 1.7%(+5.27)#20 | 2.1%(+4.77)#1,566 |
| 21. | 97465 | 6.9% | 1.7%(+5.24)#21 | 2.1%(+4.75)#1,578 |
| 22. | 97873 | 6.9% | 1.7%(+5.24)#22 | 2.1%(+4.75)#1,583 |
| 23. | 97004 | 6.8% | 1.7%(+5.12)#23 | 2.1%(+4.62)#1,644 |
| 24. | 97836 | 6.7% | 1.7%(+5.04)#24 | 2.1%(+4.55)#1,689 |
| 25. | 97627 | 6.5% | 1.7%(+4.80)#25 | 2.1%(+4.30)#1,804 |
| 26. | 97376 | 6.4% | 1.7%(+4.77)#26 | 2.1%(+4.27)#1,818 |
| 27. | 97415 | 6.4% | 1.7%(+4.76)#27 | 2.1%(+4.27)#1,821 |
| 28. | 97830 | 6.3% | 1.7%(+4.65)#28 | 2.1%(+4.16)#1,896 |
| 29. | 97467 | 6.3% | 1.7%(+4.64)#29 | 2.1%(+4.14)#1,904 |
| 30. | 97738 | 6.2% | 1.7%(+4.58)#30 | 2.1%(+4.08)#1,933 |
| 31. | 97374 | 6.1% | 1.7%(+4.44)#31 | 2.1%(+3.95)#2,018 |
| 32. | 97630 | 6.1% | 1.7%(+4.40)#32 | 2.1%(+3.91)#2,038 |
| 33. | 97814 | 5.8% | 1.7%(+4.17)#33 | 2.1%(+3.68)#2,191 |
| 34. | 97845 | 5.8% | 1.7%(+4.14)#34 | 2.1%(+3.65)#2,210 |
| 35. | 97392 | 5.8% | 1.7%(+4.12)#35 | 2.1%(+3.63)#2,225 |
| 36. | 97133 | 5.7% | 1.7%(+4.02)#36 | 2.1%(+3.53)#2,305 |
| 37. | 97442 | 5.5% | 1.7%(+3.87)#37 | 2.1%(+3.37)#2,434 |
| 38. | 97857 | 5.1% | 1.7%(+3.47)#38 | 2.1%(+2.98)#2,781 |
| 39. | 97018 | 5.1% | 1.7%(+3.43)#39 | 2.1%(+2.94)#2,820 |
| 40. | 97115 | 5.0% | 1.7%(+3.35)#40 | 2.1%(+2.85)#2,927 |
| 41. | 97835 | 5.0% | 1.7%(+3.33)#41 | 2.1%(+2.83)#2,948 |
| 42. | 97020 | 5.0% | 1.7%(+3.31)#42 | 2.1%(+2.82)#2,966 |
| 43. | 97753 | 4.9% | 1.7%(+3.23)#43 | 2.1%(+2.74)#3,062 |
| 44. | 97381 | 4.8% | 1.7%(+3.12)#44 | 2.1%(+2.63)#3,197 |
| 45. | 97378 | 4.8% | 1.7%(+3.10)#45 | 2.1%(+2.61)#3,222 |
| 46. | 97446 | 4.8% | 1.7%(+3.10)#46 | 2.1%(+2.61)#3,233 |
| 47. | 97801 | 4.7% | 1.7%(+3.04)#47 | 2.1%(+2.55)#3,307 |
| 48. | 97141 | 4.5% | 1.7%(+2.86)#48 | 2.1%(+2.36)#3,596 |
| 49. | 97876 | 4.4% | 1.7%(+2.73)#49 | 2.1%(+2.23)#3,809 |
| 50. | 97341 | 4.2% | 1.7%(+2.54)#50 | 2.1%(+2.04)#4,135 |
| 51. | 97385 | 4.1% | 1.7%(+2.46)#51 | 2.1%(+1.97)#4,264 |
| 52. | 97204 | 4.1% | 1.7%(+2.43)#52 | 2.1%(+1.94)#4,328 |
| 53. | 97824 | 4.0% | 1.7%(+2.31)#53 | 2.1%(+1.81)#4,572 |
| 54. | 97426 | 4.0% | 1.7%(+2.30)#54 | 2.1%(+1.80)#4,583 |
| 55. | 97138 | 3.9% | 1.7%(+2.22)#55 | 2.1%(+1.73)#4,741 |
| 56. | 97038 | 3.8% | 1.7%(+2.14)#56 | 2.1%(+1.65)#4,914 |
| 57. | 97049 | 3.8% | 1.7%(+2.11)#57 | 2.1%(+1.62)#4,994 |
| 58. | 97862 | 3.7% | 1.7%(+2.04)#58 | 2.1%(+1.54)#5,174 |
| 59. | 97624 | 3.7% | 1.7%(+2.03)#59 | 2.1%(+1.54)#5,188 |
| 60. | 97459 | 3.6% | 1.7%(+1.96)#60 | 2.1%(+1.47)#5,358 |
| 61. | 97220 | 3.6% | 1.7%(+1.93)#61 | 2.1%(+1.43)#5,449 |
| 62. | 97113 | 3.6% | 1.7%(+1.90)#62 | 2.1%(+1.41)#5,516 |
| 63. | 97907 | 3.5% | 1.7%(+1.88)#63 | 2.1%(+1.38)#5,601 |
| 64. | 97499 | 3.5% | 1.7%(+1.85)#64 | 2.1%(+1.35)#5,670 |
| 65. | 97850 | 3.5% | 1.7%(+1.84)#65 | 2.1%(+1.34)#5,692 |
| 66. | 97130 | 3.5% | 1.7%(+1.83)#66 | 2.1%(+1.33)#5,716 |
| 67. | 97739 | 3.5% | 1.7%(+1.82)#67 | 2.1%(+1.32)#5,751 |
| 68. | 97913 | 3.5% | 1.7%(+1.80)#68 | 2.1%(+1.31)#5,787 |
| 69. | 97825 | 3.4% | 1.7%(+1.74)#69 | 2.1%(+1.24)#5,971 |
| 70. | 97885 | 3.4% | 1.7%(+1.73)#70 | 2.1%(+1.24)#5,993 |
| 71. | 97131 | 3.4% | 1.7%(+1.71)#71 | 2.1%(+1.22)#6,036 |
| 72. | 97875 | 3.3% | 1.7%(+1.69)#72 | 2.1%(+1.20)#6,103 |
| 73. | 97844 | 3.3% | 1.7%(+1.67)#73 | 2.1%(+1.18)#6,160 |
| 74. | 97869 | 3.3% | 1.7%(+1.63)#74 | 2.1%(+1.14)#6,283 |
| 75. | 97452 | 3.3% | 1.7%(+1.60)#75 | 2.1%(+1.10)#6,396 |
| 76. | 97720 | 3.2% | 1.7%(+1.59)#76 | 2.1%(+1.09)#6,422 |
| 77. | 97127 | 3.2% | 1.7%(+1.59)#77 | 2.1%(+1.09)#6,426 |
| 78. | 97420 | 3.2% | 1.7%(+1.58)#78 | 2.1%(+1.09)#6,437 |
| 79. | 97820 | 3.2% | 1.7%(+1.57)#79 | 2.1%(+1.07)#6,499 |
| 80. | 97065 | 3.2% | 1.7%(+1.51)#80 | 2.1%(+1.02)#6,641 |
| 81. | 97918 | 3.1% | 1.7%(+1.49)#81 | 2.1%(+0.992)#6,740 |
| 82. | 97754 | 3.1% | 1.7%(+1.46)#82 | 2.1%(+0.967)#6,837 |
| 83. | 97304 | 3.1% | 1.7%(+1.46)#83 | 2.1%(+0.964)#6,848 |
| 84. | 97838 | 3.0% | 1.7%(+1.37)#84 | 2.1%(+0.874)#7,136 |
| 85. | 97530 | 3.0% | 1.7%(+1.30)#85 | 2.1%(+0.802)#7,431 |
| 86. | 97623 | 2.9% | 1.7%(+1.27)#86 | 2.1%(+0.776)#7,536 |
| 87. | 97351 | 2.9% | 1.7%(+1.27)#87 | 2.1%(+0.774)#7,538 |
| 88. | 97375 | 2.7% | 1.7%(+1.07)#88 | 2.1%(+0.577)#8,415 |
| 89. | 97118 | 2.7% | 1.7%(+1.04)#89 | 2.1%(+0.545)#8,563 |
| 90. | 97023 | 2.7% | 1.7%(+1.03)#90 | 2.1%(+0.535)#8,608 |
| 91. | 97883 | 2.7% | 1.7%(+1.00)#91 | 2.1%(+0.506)#8,737 |
| 92. | 97424 | 2.7% | 1.7%(+0.996)#92 | 2.1%(+0.502)#8,762 |
| 93. | 97389 | 2.6% | 1.7%(+0.974)#93 | 2.1%(+0.480)#8,880 |
| 94. | 97338 | 2.6% | 1.7%(+0.960)#94 | 2.1%(+0.466)#8,934 |
| 95. | 97011 | 2.6% | 1.7%(+0.956)#95 | 2.1%(+0.462)#8,959 |
| 96. | 97603 | 2.6% | 1.7%(+0.926)#96 | 2.1%(+0.432)#9,104 |
| 97. | 97112 | 2.5% | 1.7%(+0.883)#97 | 2.1%(+0.389)#9,317 |
| 98. | 97132 | 2.5% | 1.7%(+0.854)#98 | 2.1%(+0.360)#9,468 |
| 99. | 97756 | 2.5% | 1.7%(+0.826)#99 | 2.1%(+0.332)#9,615 |
| 100. | 97236 | 2.5% | 1.7%(+0.820)#100 | 2.1%(+0.325)#9,654 |
Common Questions
What are the Top 10 Zip Codes with the Highest Percentage of Population Employed in Security & Protection in Oregon?
Top 10 Zip Codes with the Highest Percentage of Population Employed in Security & Protection in Oregon are:
What zip code has the Highest Percentage of Population Employed in Security & Protection in Oregon?
97495 has the Highest Percentage of Population Employed in Security & Protection in Oregon with 24.1%.
What is the Percentage of Population Employed in Security & Protection in the State of Oregon?
Percentage of Population Employed in Security & Protection in Oregon is 1.7%.
What is the Percentage of Population Employed in Security & Protection in the United States?
Percentage of Population Employed in Security & Protection in the United States is 2.1%.