Zip Codes with the Highest Percentage of Population Employed in Security & Protection in Brandon, MS
RELATED REPORTS & OPTIONS
Security & Protection
Brandon
Compare Zip Codes
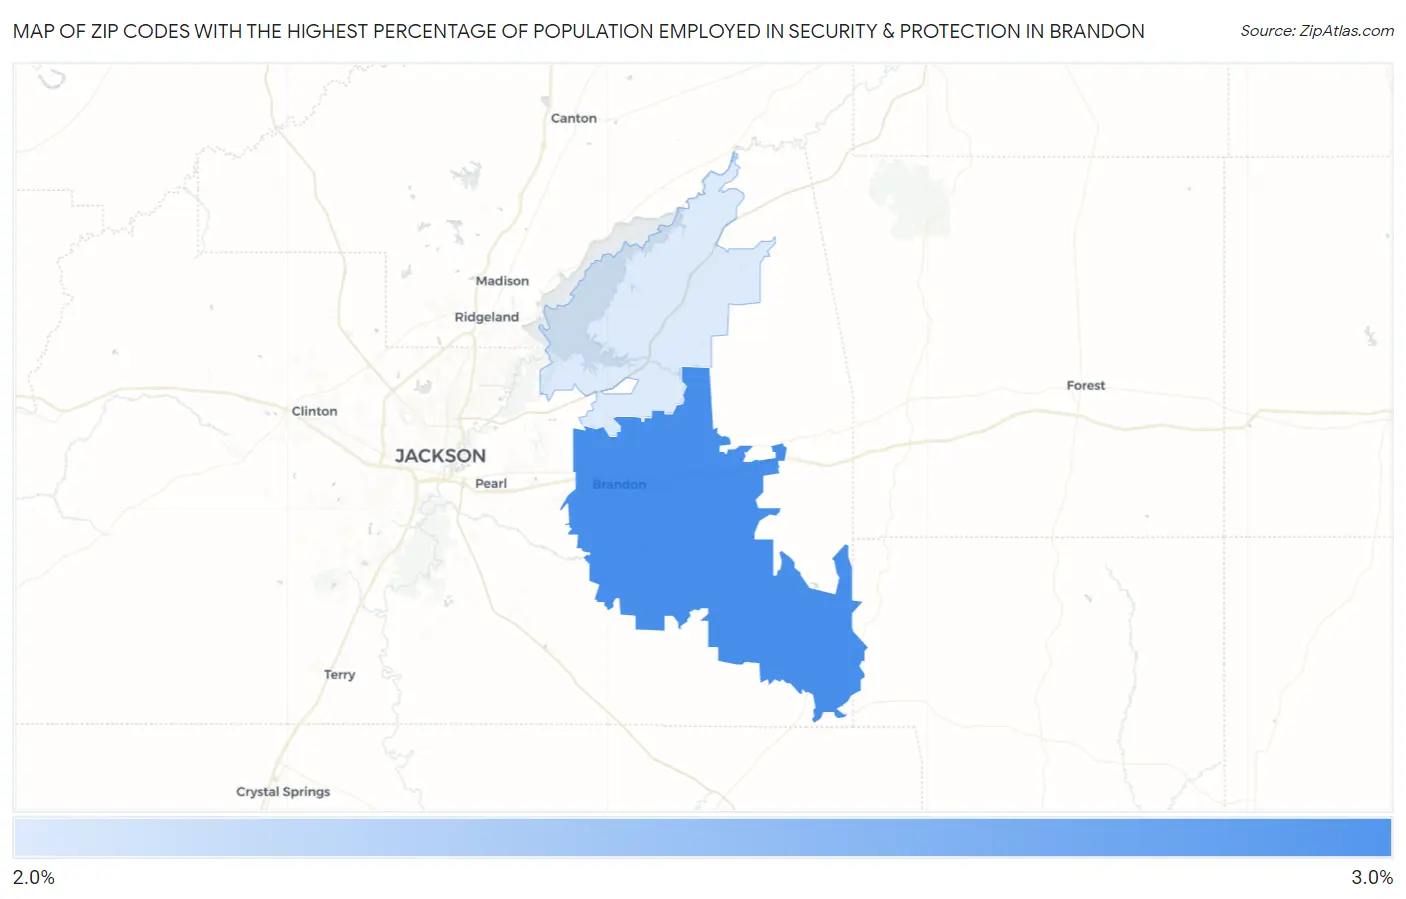
Map of Zip Codes with the Highest Percentage of Population Employed in Security & Protection in Brandon
2.2%
2.6%
Zip Codes with the Highest Percentage of Population Employed in Security & Protection in Brandon, MS
| Zip Code | % Employed | vs State | vs National | |
| 1. | 39042 | 2.6% | 2.4%(+0.215)#137 | 2.1%(+0.444)#9,042 |
| 2. | 39047 | 2.2% | 2.4%(-0.185)#170 | 2.1%(+0.044)#11,298 |
1
Common Questions
What are the Top Zip Codes with the Highest Percentage of Population Employed in Security & Protection in Brandon, MS?
Top Zip Codes with the Highest Percentage of Population Employed in Security & Protection in Brandon, MS are:
What zip code has the Highest Percentage of Population Employed in Security & Protection in Brandon, MS?
39042 has the Highest Percentage of Population Employed in Security & Protection in Brandon, MS with 2.6%.
What is the Percentage of Population Employed in Security & Protection in Brandon, MS?
Percentage of Population Employed in Security & Protection in Brandon is 3.0%.
What is the Percentage of Population Employed in Security & Protection in Mississippi?
Percentage of Population Employed in Security & Protection in Mississippi is 2.4%.
What is the Percentage of Population Employed in Security & Protection in the United States?
Percentage of Population Employed in Security & Protection in the United States is 2.1%.