Big Point, MS Map & Demographics
Big Point Map
Big Point Overview
$60,236
PER CAPITA INCOME
$111,639
AVG FAMILY INCOME
$110,946
AVG HOUSEHOLD INCOME
0.42
INEQUALITY / GINI INDEX
918
TOTAL POPULATION
580
MALE POPULATION
338
FEMALE POPULATION
171.60
MALES / 100 FEMALES
58.28
FEMALES / 100 MALES
44.8
MEDIAN AGE
2.8
AVG FAMILY SIZE
2.8
AVG HOUSEHOLD SIZE
732
LABOR FORCE [ PEOPLE ]
87.7%
PERCENT IN LABOR FORCE
8.6%
UNEMPLOYMENT RATE
Income in Big Point
Income Overview in Big Point
Per Capita Income in Big Point is $60,236, while median incomes of families and households are $111,639 and $110,946 respectively.
| Characteristic | Number | Measure |
| Per Capita Income | 918 | $60,236 |
| Median Family Income | 287 | $111,639 |
| Mean Family Income | 287 | $176,119 |
| Median Household Income | 328 | $110,946 |
| Mean Household Income | 328 | $168,330 |
| Income Deficit | 287 | $0 |
| Wage / Income Gap (%) | 918 | 0.00% |
| Wage / Income Gap ($) | 918 | 100.00¢ per $1 |
| Gini / Inequality Index | 918 | 0.42 |
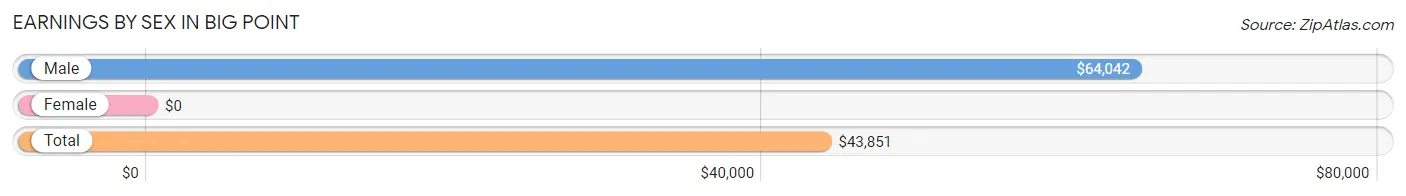
Earnings by Sex in Big Point
| Sex | Number | Average Earnings |
| Male | 493 (65.7%) | $64,042 |
| Female | 257 (34.3%) | $0 |
| Total | 750 (100.0%) | $43,851 |
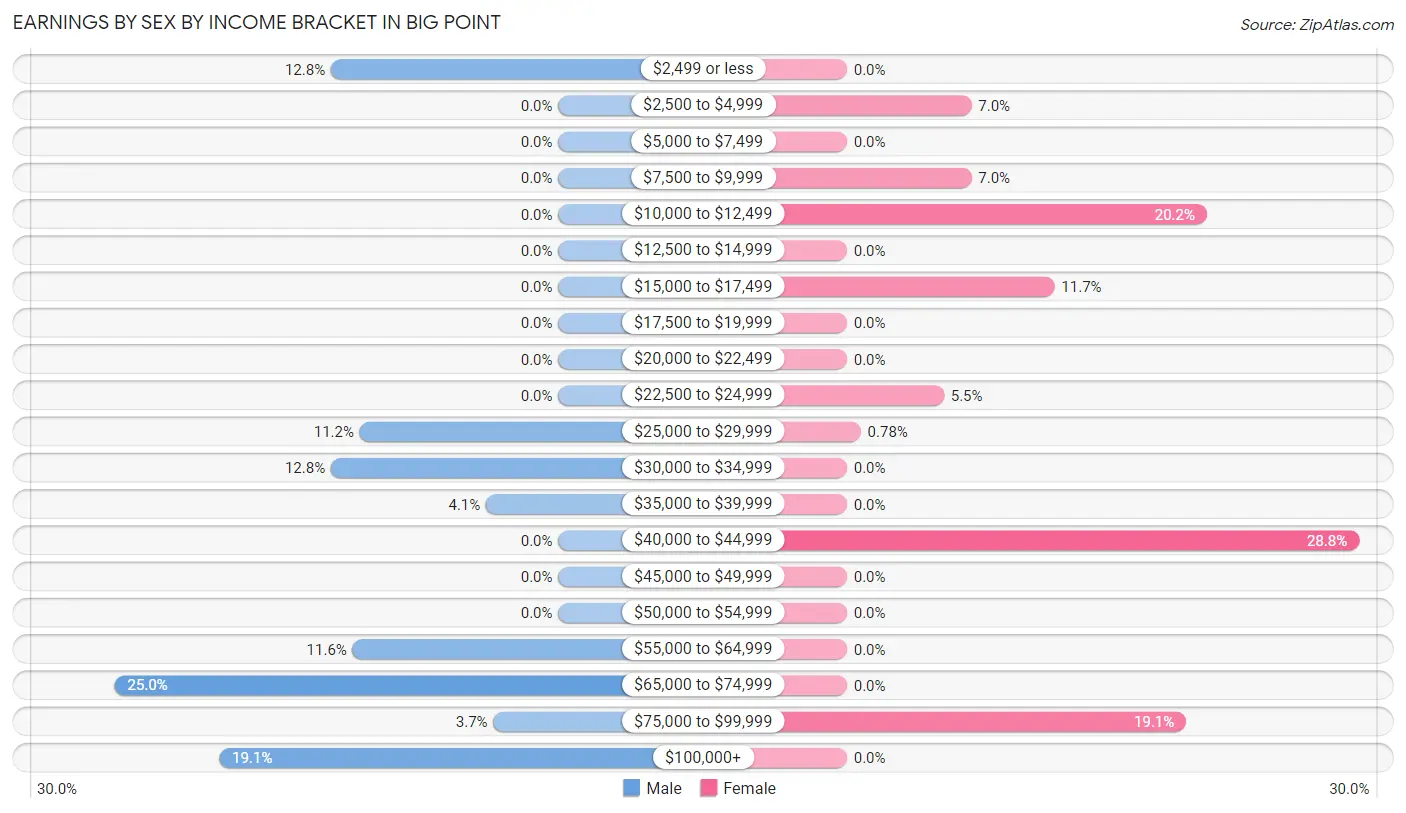
Earnings by Sex by Income Bracket in Big Point
The most common earnings brackets in Big Point are $65,000 to $74,999 for men (123 | 24.9%) and $40,000 to $44,999 for women (74 | 28.8%).
| Income | Male | Female |
| $2,499 or less | 63 (12.8%) | 0 (0.0%) |
| $2,500 to $4,999 | 0 (0.0%) | 18 (7.0%) |
| $5,000 to $7,499 | 0 (0.0%) | 0 (0.0%) |
| $7,500 to $9,999 | 0 (0.0%) | 18 (7.0%) |
| $10,000 to $12,499 | 0 (0.0%) | 52 (20.2%) |
| $12,500 to $14,999 | 0 (0.0%) | 0 (0.0%) |
| $15,000 to $17,499 | 0 (0.0%) | 30 (11.7%) |
| $17,500 to $19,999 | 0 (0.0%) | 0 (0.0%) |
| $20,000 to $22,499 | 0 (0.0%) | 0 (0.0%) |
| $22,500 to $24,999 | 0 (0.0%) | 14 (5.4%) |
| $25,000 to $29,999 | 55 (11.2%) | 2 (0.8%) |
| $30,000 to $34,999 | 63 (12.8%) | 0 (0.0%) |
| $35,000 to $39,999 | 20 (4.1%) | 0 (0.0%) |
| $40,000 to $44,999 | 0 (0.0%) | 74 (28.8%) |
| $45,000 to $49,999 | 0 (0.0%) | 0 (0.0%) |
| $50,000 to $54,999 | 0 (0.0%) | 0 (0.0%) |
| $55,000 to $64,999 | 57 (11.6%) | 0 (0.0%) |
| $65,000 to $74,999 | 123 (24.9%) | 0 (0.0%) |
| $75,000 to $99,999 | 18 (3.6%) | 49 (19.1%) |
| $100,000+ | 94 (19.1%) | 0 (0.0%) |
| Total | 493 (100.0%) | 257 (100.0%) |
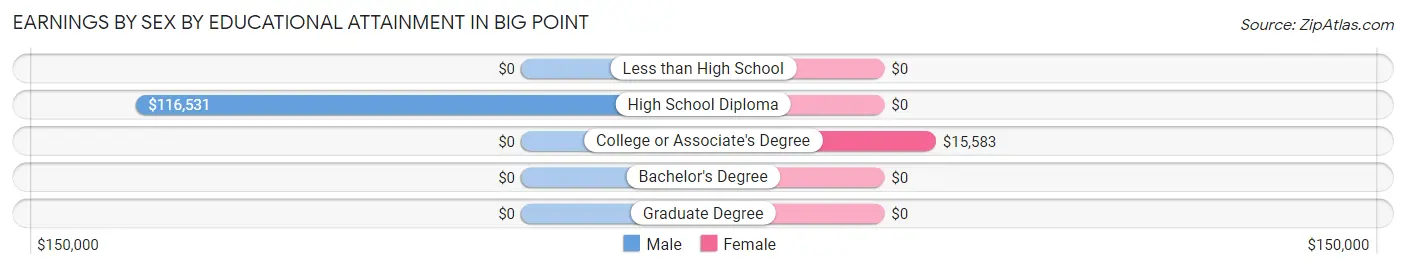
Earnings by Sex by Educational Attainment in Big Point
| Educational Attainment | Male Income | Female Income |
| Less than High School | - | - |
| High School Diploma | $116,531 | $0 |
| College or Associate's Degree | - | - |
| Bachelor's Degree | - | - |
| Graduate Degree | - | - |
| Total | $66,570 | $0 |
Family Income in Big Point
Family Income Brackets in Big Point
According to the Big Point family income data, there are 74 families falling into the $100,000 to $149,999 income range, which is the most common income bracket and makes up 25.8% of all families.
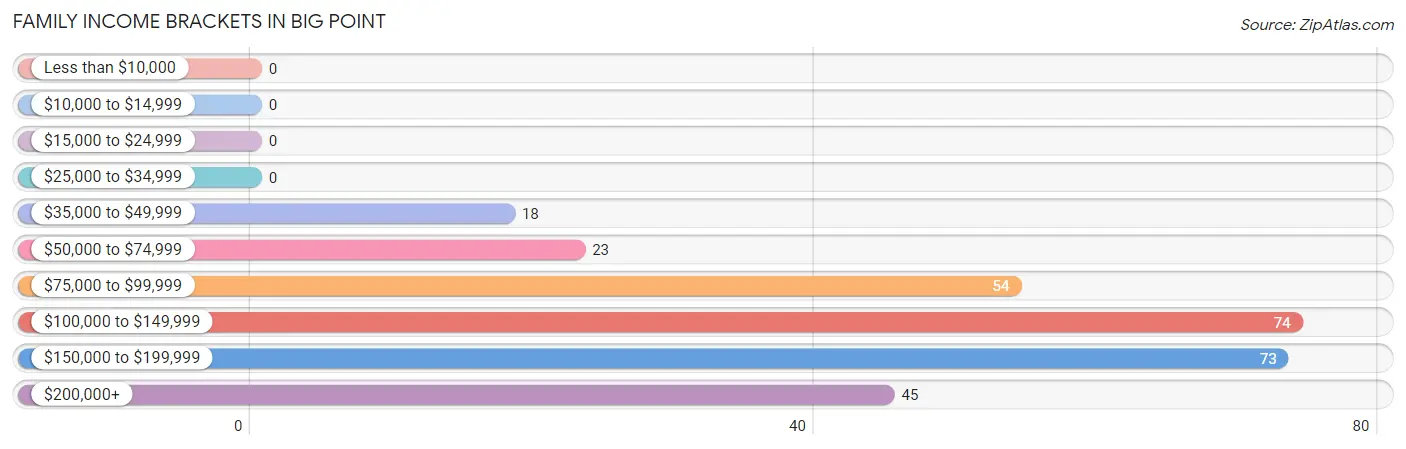
| Income Bracket | # Families | % Families |
| Less than $10,000 | 0 | 0.0% |
| $10,000 to $14,999 | 0 | 0.0% |
| $15,000 to $24,999 | 0 | 0.0% |
| $25,000 to $34,999 | 0 | 0.0% |
| $35,000 to $49,999 | 18 | 6.3% |
| $50,000 to $74,999 | 23 | 8.0% |
| $75,000 to $99,999 | 54 | 18.8% |
| $100,000 to $149,999 | 74 | 25.8% |
| $150,000 to $199,999 | 73 | 25.4% |
| $200,000+ | 45 | 15.7% |
Family Income by Famaliy Size in Big Point
2-person families (189 | 65.8%) account for the highest median family income in Big Point with $111,064 per family, while 2-person families (189 | 65.8%) have the highest median income of $55,532 per family member.
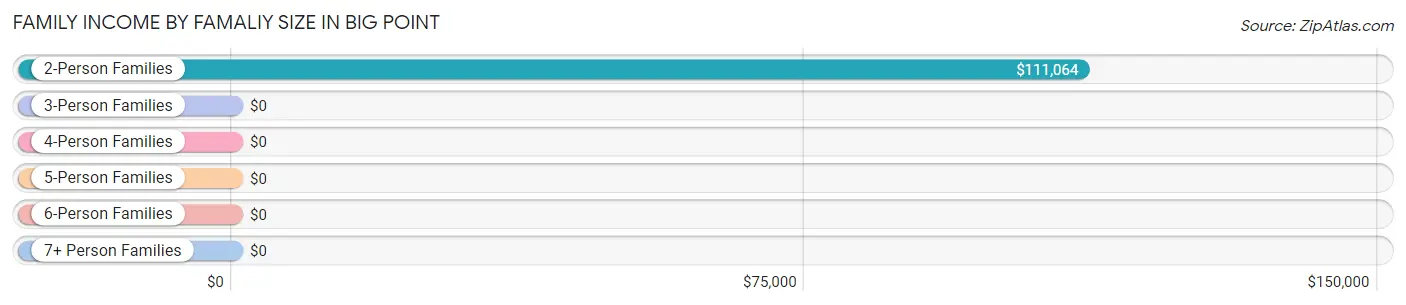
| Income Bracket | # Families | Median Income |
| 2-Person Families | 189 (65.8%) | $111,064 |
| 3-Person Families | 14 (4.9%) | $0 |
| 4-Person Families | 30 (10.4%) | $0 |
| 5-Person Families | 54 (18.8%) | $0 |
| 6-Person Families | 0 (0.0%) | $0 |
| 7+ Person Families | 0 (0.0%) | $0 |
| Total | 287 (100.0%) | $111,639 |
Family Income by Number of Earners in Big Point
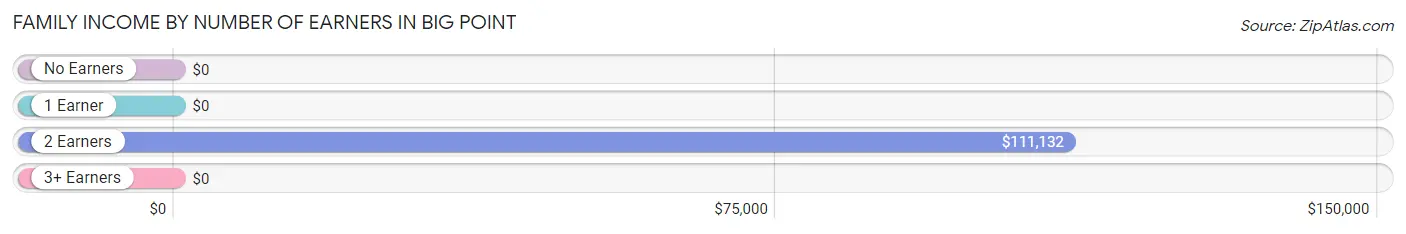
| Number of Earners | # Families | Median Income |
| No Earners | 22 (7.7%) | $0 |
| 1 Earner | 0 (0.0%) | $0 |
| 2 Earners | 213 (74.2%) | $111,132 |
| 3+ Earners | 52 (18.1%) | $0 |
| Total | 287 (100.0%) | $111,639 |
Household Income in Big Point
Household Income Brackets in Big Point
With 74 households falling in the category, the $100,000 to $149,999 income range is the most frequent in Big Point, accounting for 22.6% of all households.
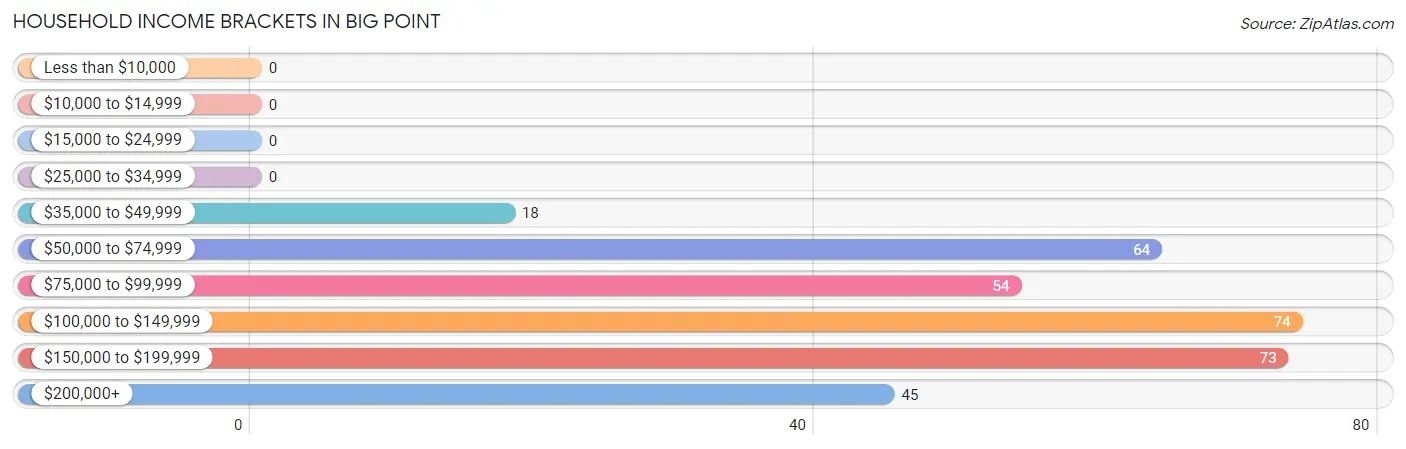
| Income Bracket | # Households | % Households |
| Less than $10,000 | 0 | 0.0% |
| $10,000 to $14,999 | 0 | 0.0% |
| $15,000 to $24,999 | 0 | 0.0% |
| $25,000 to $34,999 | 0 | 0.0% |
| $35,000 to $49,999 | 18 | 5.5% |
| $50,000 to $74,999 | 64 | 19.5% |
| $75,000 to $99,999 | 54 | 16.5% |
| $100,000 to $149,999 | 74 | 22.6% |
| $150,000 to $199,999 | 73 | 22.3% |
| $200,000+ | 45 | 13.7% |
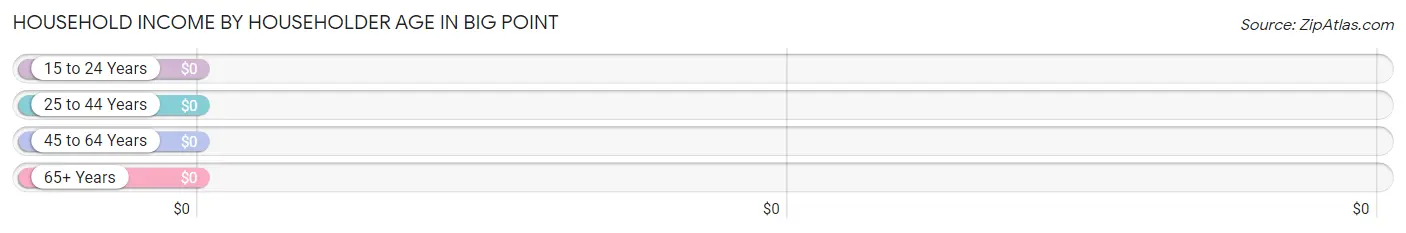
Household Income by Householder Age in Big Point
| Income Bracket | # Households | Median Income |
| 15 to 24 Years | 0 (0.0%) | $0 |
| 25 to 44 Years | 108 (32.9%) | $0 |
| 45 to 64 Years | 198 (60.4%) | $0 |
| 65+ Years | 22 (6.7%) | $0 |
| Total | 328 (100.0%) | $110,946 |
Poverty in Big Point
Income Below Poverty by Sex and Age in Big Point
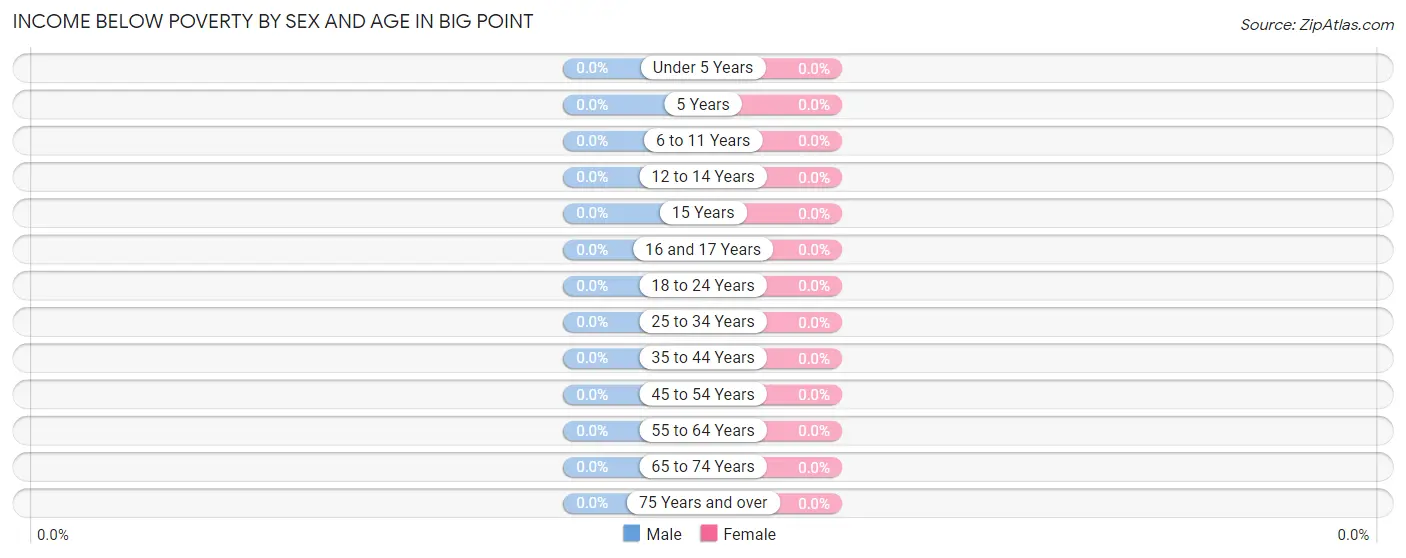
| Age Bracket | Male | Female |
| Under 5 Years | 0 (0.0%) | 0 (0.0%) |
| 5 Years | 0 (0.0%) | 0 (0.0%) |
| 6 to 11 Years | 0 (0.0%) | 0 (0.0%) |
| 12 to 14 Years | 0 (0.0%) | 0 (0.0%) |
| 15 Years | 0 (0.0%) | 0 (0.0%) |
| 16 and 17 Years | 0 (0.0%) | 0 (0.0%) |
| 18 to 24 Years | 0 (0.0%) | 0 (0.0%) |
| 25 to 34 Years | 0 (0.0%) | 0 (0.0%) |
| 35 to 44 Years | 0 (0.0%) | 0 (0.0%) |
| 45 to 54 Years | 0 (0.0%) | 0 (0.0%) |
| 55 to 64 Years | 0 (0.0%) | 0 (0.0%) |
| 65 to 74 Years | 0 (0.0%) | 0 (0.0%) |
| 75 Years and over | 0 (0.0%) | 0 (0.0%) |
| Total | 0 (0.0%) | 0 (0.0%) |
Income Above Poverty by Sex and Age in Big Point
According to the poverty statistics in Big Point, males aged under 5 years and females aged 5 years are the age groups that are most secure financially, with 100.0% of males and 100.0% of females in these age groups living above the poverty line.
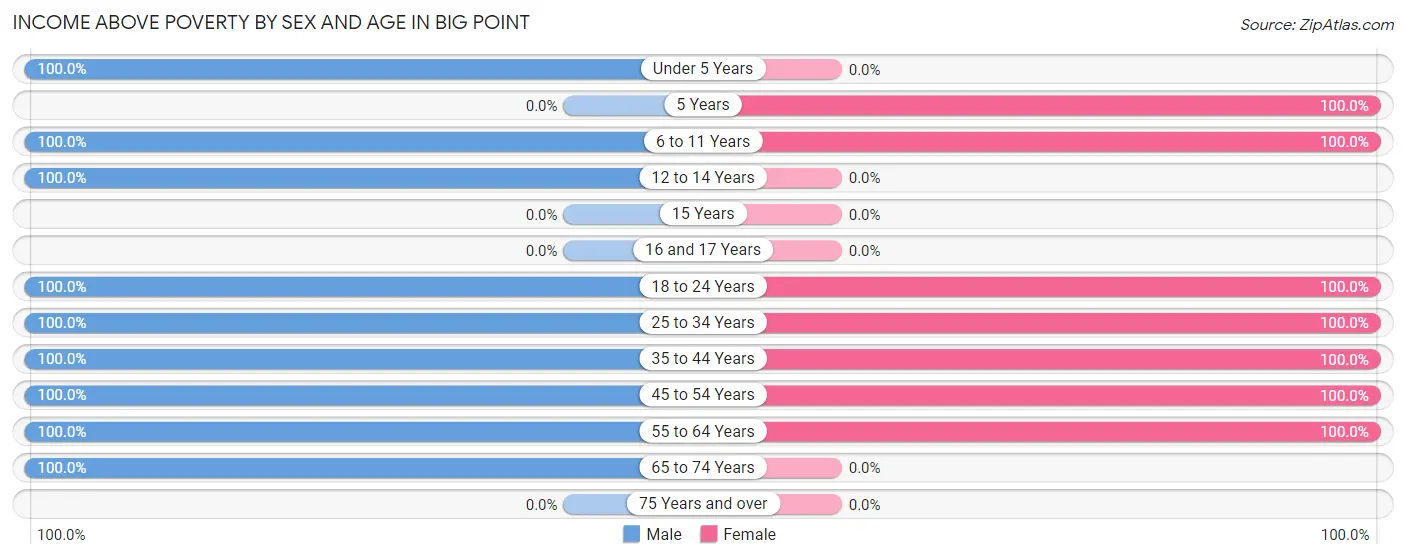
| Age Bracket | Male | Female |
| Under 5 Years | 32 (100.0%) | 0 (0.0%) |
| 5 Years | 0 (0.0%) | 2 (100.0%) |
| 6 to 11 Years | 30 (100.0%) | 16 (100.0%) |
| 12 to 14 Years | 3 (100.0%) | 0 (0.0%) |
| 15 Years | 0 (0.0%) | 0 (0.0%) |
| 16 and 17 Years | 0 (0.0%) | 0 (0.0%) |
| 18 to 24 Years | 126 (100.0%) | 44 (100.0%) |
| 25 to 34 Years | 107 (100.0%) | 53 (100.0%) |
| 35 to 44 Years | 41 (100.0%) | 14 (100.0%) |
| 45 to 54 Years | 57 (100.0%) | 70 (100.0%) |
| 55 to 64 Years | 162 (100.0%) | 139 (100.0%) |
| 65 to 74 Years | 22 (100.0%) | 0 (0.0%) |
| 75 Years and over | 0 (0.0%) | 0 (0.0%) |
| Total | 580 (100.0%) | 338 (100.0%) |
Income Below Poverty Among Married-Couple Families in Big Point
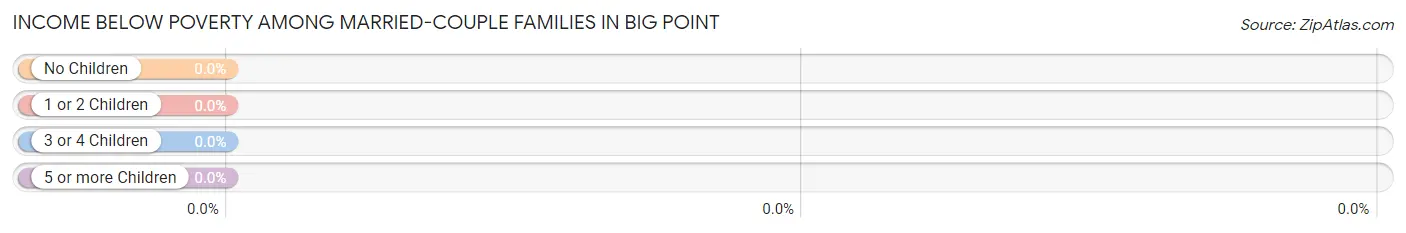
| Children | Above Poverty | Below Poverty |
| No Children | 241 (100.0%) | 0 (0.0%) |
| 1 or 2 Children | 14 (100.0%) | 0 (0.0%) |
| 3 or 4 Children | 2 (100.0%) | 0 (0.0%) |
| 5 or more Children | 0 (0.0%) | 0 (0.0%) |
| Total | 257 (100.0%) | 0 (0.0%) |
Income Below Poverty Among Single-Parent Households in Big Point
| Children | Single Father | Single Mother |
| No Children | 0 (0.0%) | 0 (0.0%) |
| 1 or 2 Children | 0 (0.0%) | 0 (0.0%) |
| 3 or 4 Children | 0 (0.0%) | 0 (0.0%) |
| 5 or more Children | 0 (0.0%) | 0 (0.0%) |
| Total | 0 (0.0%) | 0 (0.0%) |
Income Below Poverty Among Married-Couple vs Single-Parent Households in Big Point
| Children | Married-Couple Families | Single-Parent Households |
| No Children | 0 (0.0%) | 0 (0.0%) |
| 1 or 2 Children | 0 (0.0%) | 0 (0.0%) |
| 3 or 4 Children | 0 (0.0%) | 0 (0.0%) |
| 5 or more Children | 0 (0.0%) | 0 (0.0%) |
| Total | 0 (0.0%) | 0 (0.0%) |
Race in Big Point
The most populous races in Big Point are White / Caucasian (914 | 99.6%), and Two or more Races (4 | 0.4%).
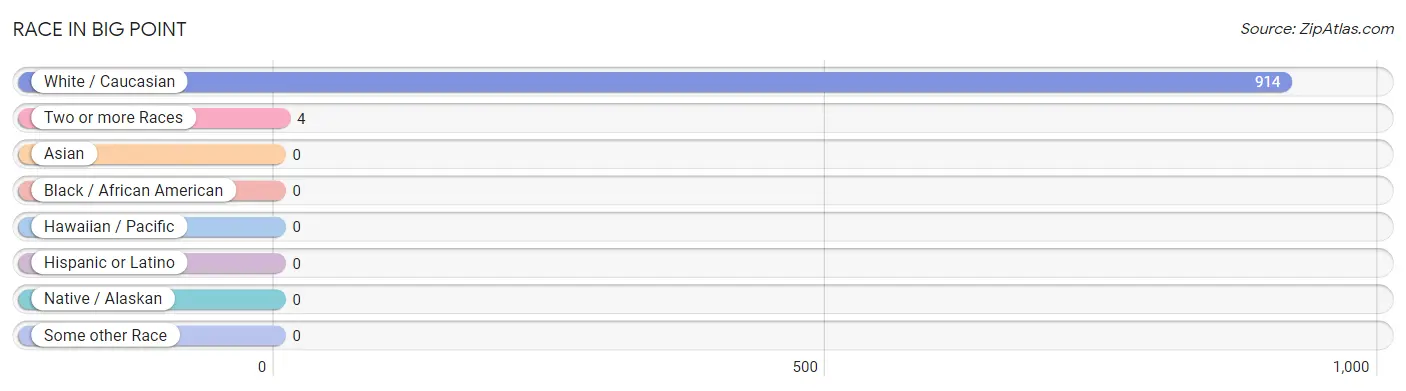
| Race | # Population | % Population |
| Asian | 0 | 0.0% |
| Black / African American | 0 | 0.0% |
| Hawaiian / Pacific | 0 | 0.0% |
| Hispanic or Latino | 0 | 0.0% |
| Native / Alaskan | 0 | 0.0% |
| White / Caucasian | 914 | 99.6% |
| Two or more Races | 4 | 0.4% |
| Some other Race | 0 | 0.0% |
| Total | 918 | 100.0% |
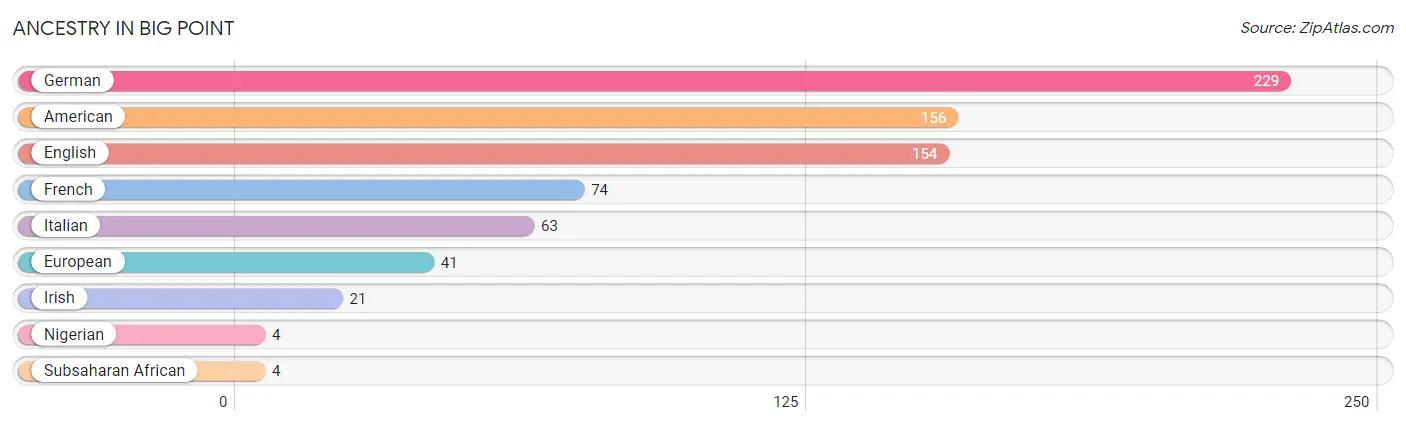
Ancestry in Big Point
The most populous ancestries reported in Big Point are German (229 | 24.9%), American (156 | 17.0%), English (154 | 16.8%), French (74 | 8.1%), and Italian (63 | 6.9%), together accounting for 73.6% of all Big Point residents.
| Ancestry | # Population | % Population |
| American | 156 | 17.0% |
| English | 154 | 16.8% |
| European | 41 | 4.5% |
| French | 74 | 8.1% |
| German | 229 | 24.9% |
| Irish | 21 | 2.3% |
| Italian | 63 | 6.9% |
| Nigerian | 4 | 0.4% |
| Subsaharan African | 4 | 0.4% | View All 9 Rows |
Immigrants in Big Point
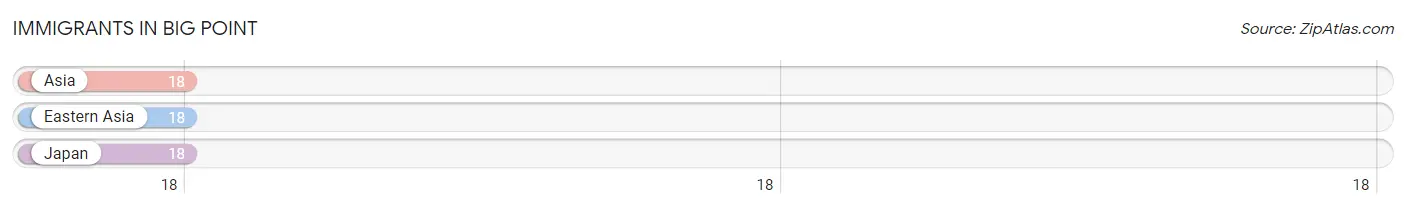
The most numerous immigrant groups reported in Big Point came from Asia (18 | 2.0%), Eastern Asia (18 | 2.0%), and Japan (18 | 2.0%), together accounting for 5.9% of all Big Point residents.
| Immigration Origin | # Population | % Population |
| Asia | 18 | 2.0% |
| Eastern Asia | 18 | 2.0% |
| Japan | 18 | 2.0% | View All 3 Rows |
Sex and Age in Big Point
Sex and Age in Big Point
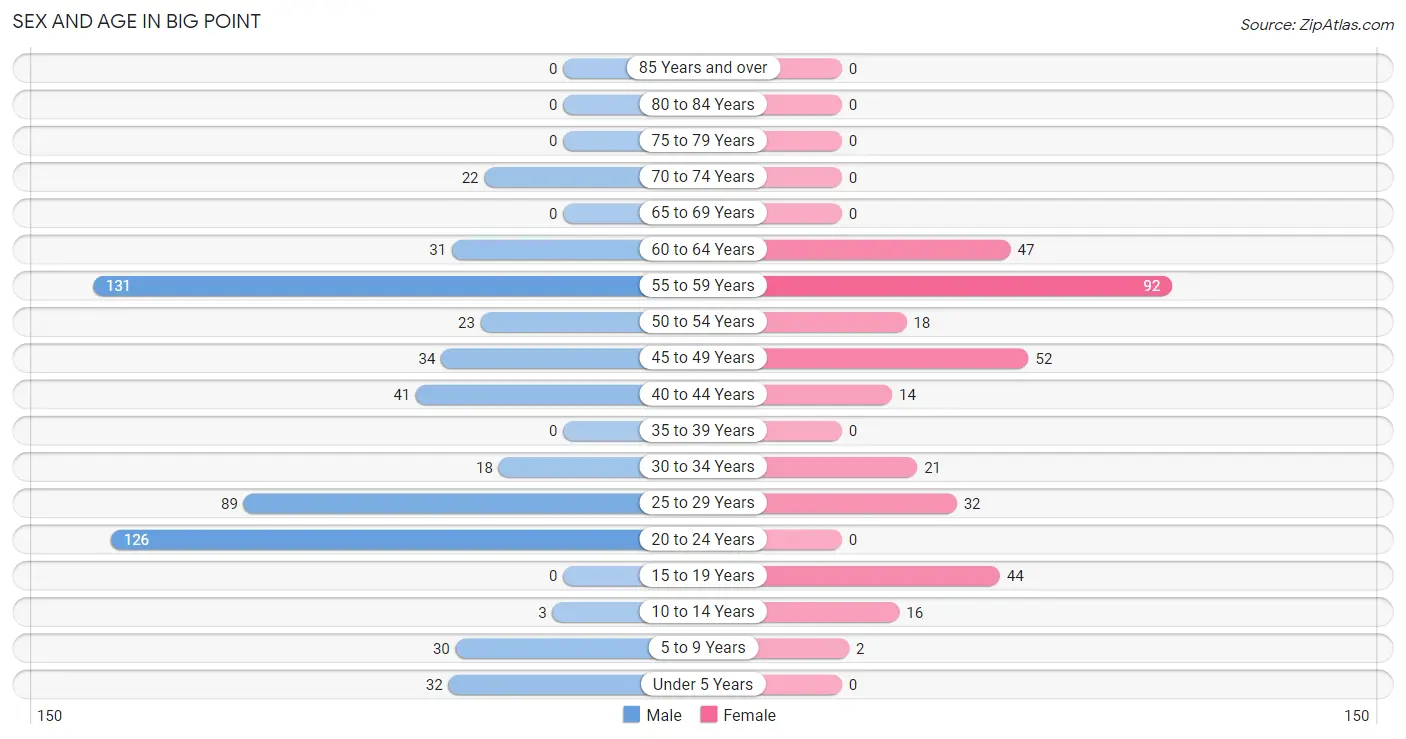
The most populous age groups in Big Point are 55 to 59 Years (131 | 22.6%) for men and 55 to 59 Years (92 | 27.2%) for women.
| Age Bracket | Male | Female |
| Under 5 Years | 32 (5.5%) | 0 (0.0%) |
| 5 to 9 Years | 30 (5.2%) | 2 (0.6%) |
| 10 to 14 Years | 3 (0.5%) | 16 (4.7%) |
| 15 to 19 Years | 0 (0.0%) | 44 (13.0%) |
| 20 to 24 Years | 126 (21.7%) | 0 (0.0%) |
| 25 to 29 Years | 89 (15.3%) | 32 (9.5%) |
| 30 to 34 Years | 18 (3.1%) | 21 (6.2%) |
| 35 to 39 Years | 0 (0.0%) | 0 (0.0%) |
| 40 to 44 Years | 41 (7.1%) | 14 (4.1%) |
| 45 to 49 Years | 34 (5.9%) | 52 (15.4%) |
| 50 to 54 Years | 23 (4.0%) | 18 (5.3%) |
| 55 to 59 Years | 131 (22.6%) | 92 (27.2%) |
| 60 to 64 Years | 31 (5.3%) | 47 (13.9%) |
| 65 to 69 Years | 0 (0.0%) | 0 (0.0%) |
| 70 to 74 Years | 22 (3.8%) | 0 (0.0%) |
| 75 to 79 Years | 0 (0.0%) | 0 (0.0%) |
| 80 to 84 Years | 0 (0.0%) | 0 (0.0%) |
| 85 Years and over | 0 (0.0%) | 0 (0.0%) |
| Total | 580 (100.0%) | 338 (100.0%) |
Families and Households in Big Point
Median Family Size in Big Point
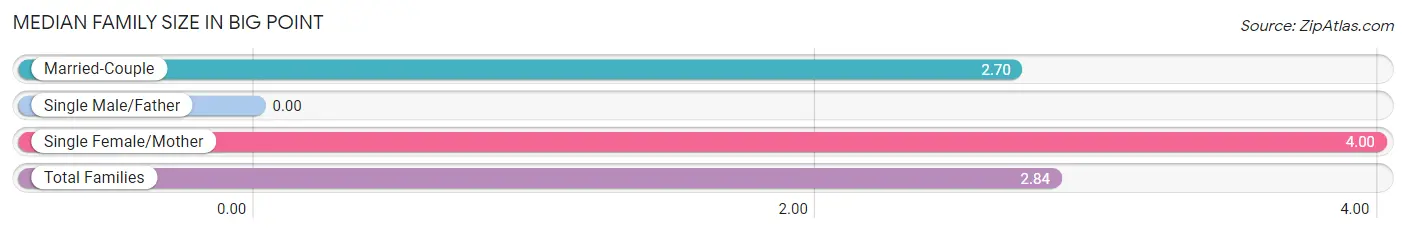
| Family Type | # Families | Family Size |
| Married-Couple | 257 (89.5%) | 2.70 |
| Single Male/Father | 0 (0.0%) | - |
| Single Female/Mother | 30 (10.4%) | 4.00 |
| Total Families | 287 (100.0%) | 2.84 |
Median Household Size in Big Point
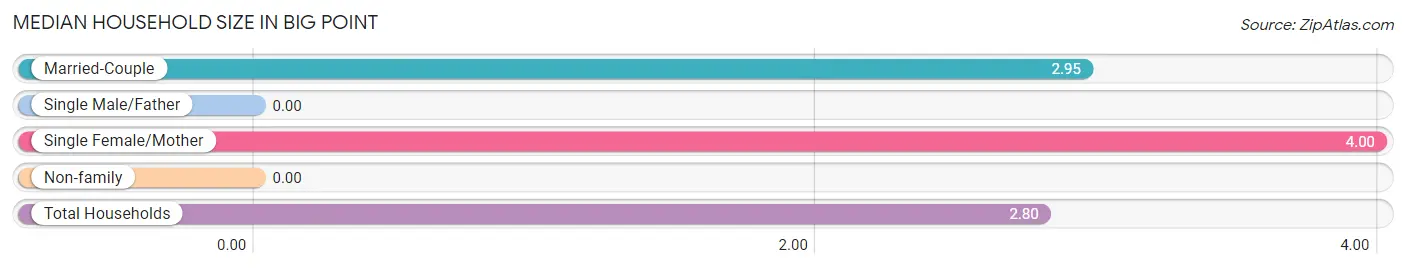
| Household Type | # Households | Household Size |
| Married-Couple | 257 (78.3%) | 2.95 |
| Single Male/Father | 0 (0.0%) | - |
| Single Female/Mother | 30 (9.1%) | 4.00 |
| Non-family | 41 (12.5%) | - |
| Total Households | 328 (100.0%) | 2.80 |
Household Size by Marriage Status in Big Point
Out of a total of 328 households in Big Point, 287 (87.5%) are family households, while 41 (12.5%) are nonfamily households. The most numerous type of family households are 2-person households, comprising 189, and the most common type of nonfamily households are 1-person households, comprising 41.
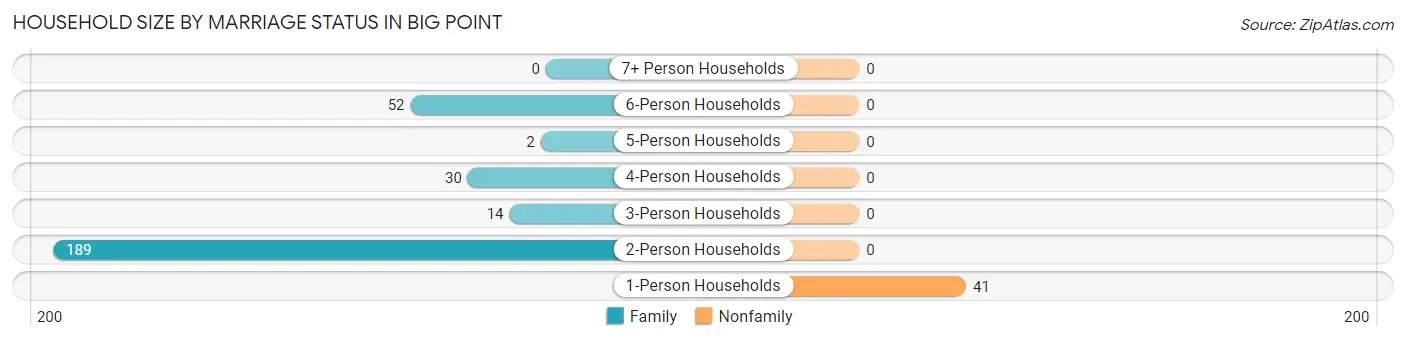
| Household Size | Family Households | Nonfamily Households |
| 1-Person Households | - | 41 (12.5%) |
| 2-Person Households | 189 (57.6%) | 0 (0.0%) |
| 3-Person Households | 14 (4.3%) | 0 (0.0%) |
| 4-Person Households | 30 (9.1%) | 0 (0.0%) |
| 5-Person Households | 2 (0.6%) | 0 (0.0%) |
| 6-Person Households | 52 (15.9%) | 0 (0.0%) |
| 7+ Person Households | 0 (0.0%) | 0 (0.0%) |
| Total | 287 (87.5%) | 41 (12.5%) |
Female Fertility in Big Point
Fertility by Age in Big Point
| Age Bracket | Women with Births | Births / 1,000 Women |
| 15 to 19 years | 0 (0.0%) | 0.0 |
| 20 to 34 years | 0 (0.0%) | 0.0 |
| 35 to 50 years | 0 (0.0%) | 0.0 |
| Total | 0 (0.0%) | 0.0 |
Fertility by Age by Marriage Status in Big Point
| Age Bracket | Married | Unmarried |
| 15 to 19 years | 0 (0.0%) | 0 (0.0%) |
| 20 to 34 years | 0 (0.0%) | 0 (0.0%) |
| 35 to 50 years | 0 (0.0%) | 0 (0.0%) |
| Total | 0 (0.0%) | 0 (0.0%) |
Fertility by Education in Big Point
| Educational Attainment | Women with Births | Births / 1,000 Women |
| Less than High School | 0 (0.0%) | 0.0 |
| High School Diploma | 0 (0.0%) | 0.0 |
| College or Associate's Degree | 0 (0.0%) | 0.0 |
| Bachelor's Degree | 0 (0.0%) | 0.0 |
| Graduate Degree | 0 (0.0%) | 0.0 |
| Total | 0 (0.0%) | 0.0 |
Fertility by Education by Marriage Status in Big Point
| Educational Attainment | Married | Unmarried |
| Less than High School | 0 (0.0%) | 0 (0.0%) |
| High School Diploma | 0 (0.0%) | 0 (0.0%) |
| College or Associate's Degree | 0 (0.0%) | 0 (0.0%) |
| Bachelor's Degree | 0 (0.0%) | 0 (0.0%) |
| Graduate Degree | 0 (0.0%) | 0 (0.0%) |
| Total | 0 (0.0%) | 0 (0.0%) |
Employment Characteristics in Big Point
Employment by Class of Employer in Big Point
Among the 669 employed individuals in Big Point, private company employees (347 | 51.9%), self-employed (not incorporated) (156 | 23.3%), and local government employees (140 | 20.9%) make up the most common classes of employment.
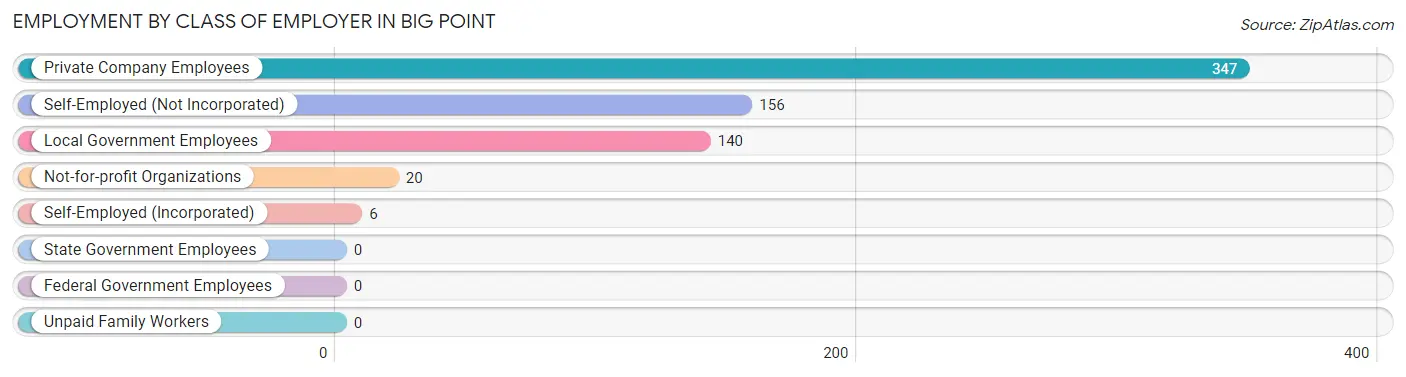
| Employer Class | # Employees | % Employees |
| Private Company Employees | 347 | 51.9% |
| Self-Employed (Incorporated) | 6 | 0.9% |
| Self-Employed (Not Incorporated) | 156 | 23.3% |
| Not-for-profit Organizations | 20 | 3.0% |
| Local Government Employees | 140 | 20.9% |
| State Government Employees | 0 | 0.0% |
| Federal Government Employees | 0 | 0.0% |
| Unpaid Family Workers | 0 | 0.0% |
| Total | 669 | 100.0% |
Employment Status by Age in Big Point
According to the labor force statistics for Big Point, out of the total population over 16 years of age (835), 87.7% or 732 individuals are in the labor force, with 8.6% or 63 of them unemployed. The age group with the highest labor force participation rate is 20 to 24 years, with 100.0% or 126 individuals in the labor force. Within the labor force, the 20 to 24 years age range has the highest percentage of unemployed individuals, with 50.0% or 63 of them being unemployed.
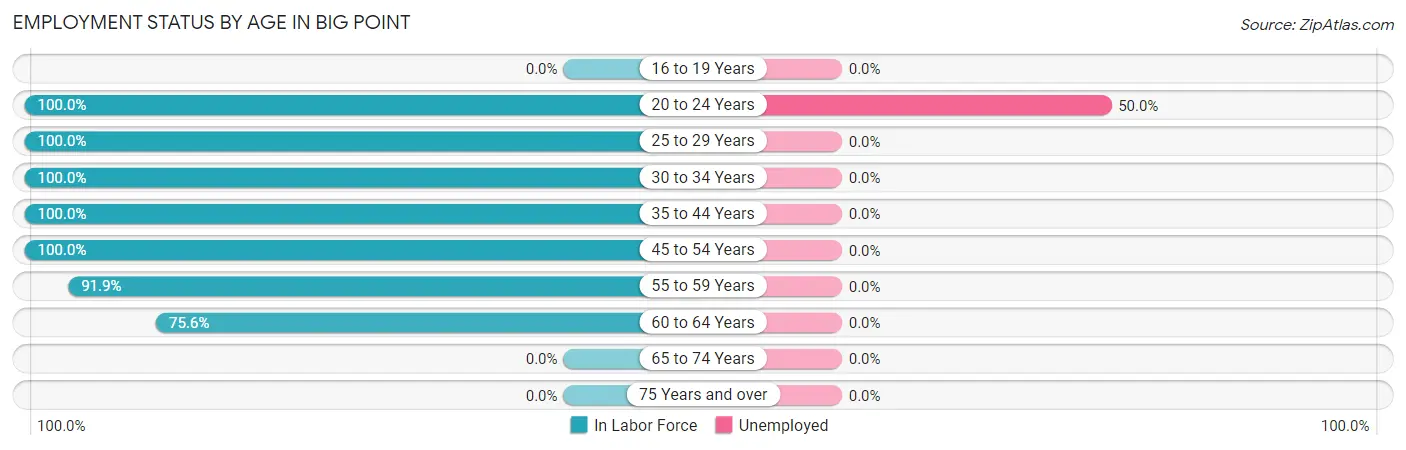
| Age Bracket | In Labor Force | Unemployed |
| 16 to 19 Years | 0 (0.0%) | 0 (0.0%) |
| 20 to 24 Years | 126 (100.0%) | 63 (50.0%) |
| 25 to 29 Years | 121 (100.0%) | 0 (0.0%) |
| 30 to 34 Years | 39 (100.0%) | 0 (0.0%) |
| 35 to 44 Years | 55 (100.0%) | 0 (0.0%) |
| 45 to 54 Years | 127 (100.0%) | 0 (0.0%) |
| 55 to 59 Years | 205 (91.9%) | 0 (0.0%) |
| 60 to 64 Years | 59 (75.6%) | 0 (0.0%) |
| 65 to 74 Years | 0 (0.0%) | 0 (0.0%) |
| 75 Years and over | 0 (0.0%) | 0 (0.0%) |
| Total | 732 (87.7%) | 63 (8.6%) |
Employment Status by Educational Attainment in Big Point
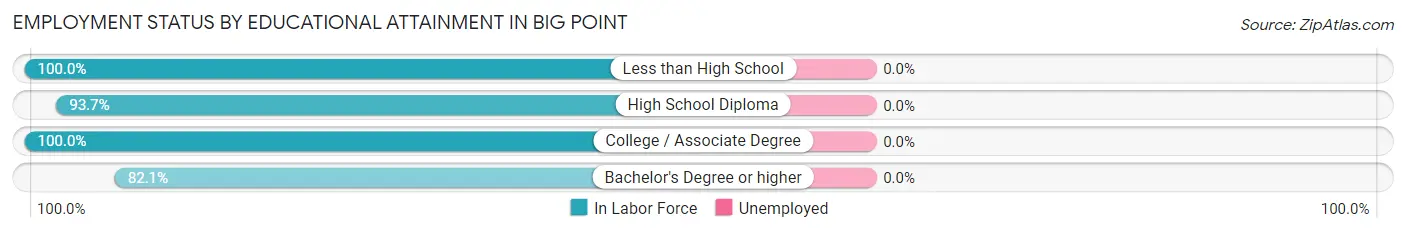
| Educational Attainment | In Labor Force | Unemployed |
| Less than High School | 123 (100.0%) | 0 (0.0%) |
| High School Diploma | 268 (93.7%) | 0 (0.0%) |
| College / Associate Degree | 128 (100.0%) | 0 (0.0%) |
| Bachelor's Degree or higher | 87 (82.1%) | 0 (0.0%) |
| Total | 606 (94.2%) | 0 (0.0%) |
Employment Occupations by Sex in Big Point
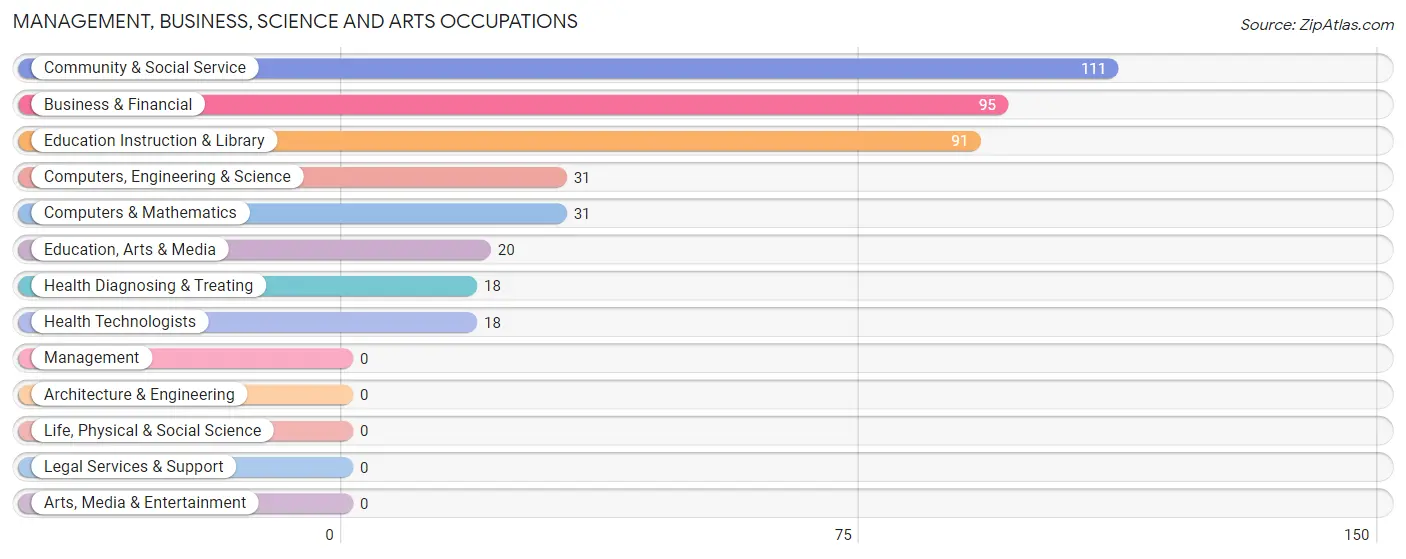
Management, Business, Science and Arts Occupations
The most common Management, Business, Science and Arts occupations in Big Point are Community & Social Service (111 | 16.6%), Business & Financial (95 | 14.2%), Education Instruction & Library (91 | 13.6%), Computers, Engineering & Science (31 | 4.6%), and Computers & Mathematics (31 | 4.6%).
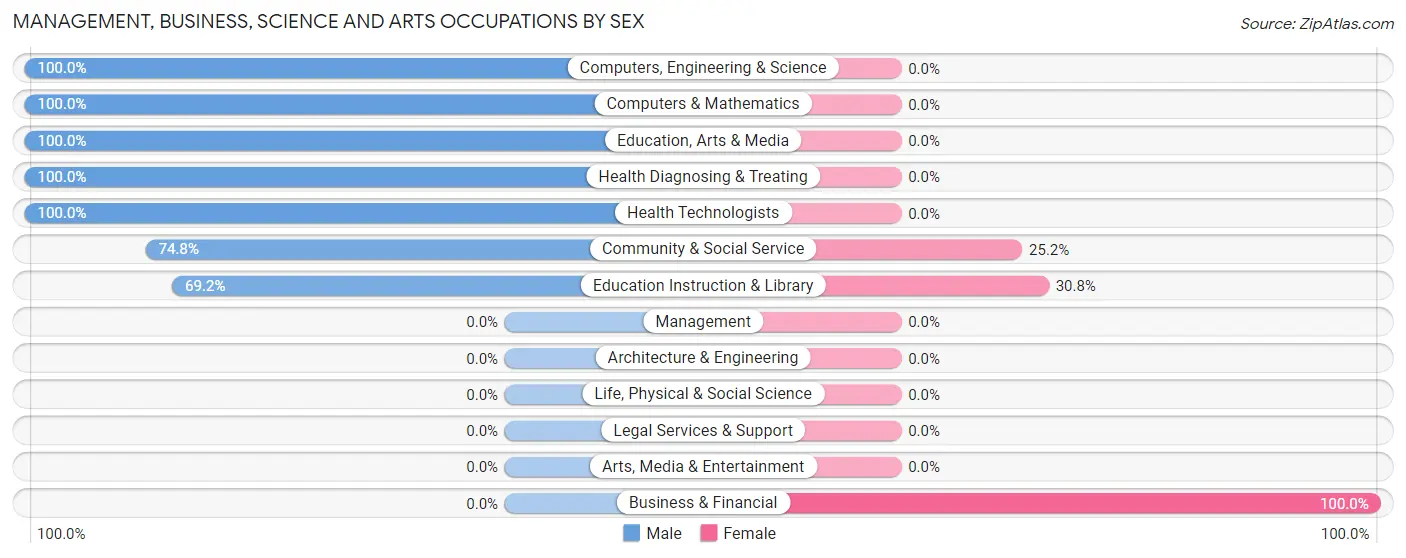
Management, Business, Science and Arts Occupations by Sex
Within the Management, Business, Science and Arts occupations in Big Point, the most male-oriented occupations are Computers, Engineering & Science (100.0%), Computers & Mathematics (100.0%), and Education, Arts & Media (100.0%), while the most female-oriented occupations are Business & Financial (100.0%), Education Instruction & Library (30.8%), and Community & Social Service (25.2%).
| Occupation | Male | Female |
| Management | 0 (0.0%) | 0 (0.0%) |
| Business & Financial | 0 (0.0%) | 95 (100.0%) |
| Computers, Engineering & Science | 31 (100.0%) | 0 (0.0%) |
| Computers & Mathematics | 31 (100.0%) | 0 (0.0%) |
| Architecture & Engineering | 0 (0.0%) | 0 (0.0%) |
| Life, Physical & Social Science | 0 (0.0%) | 0 (0.0%) |
| Community & Social Service | 83 (74.8%) | 28 (25.2%) |
| Education, Arts & Media | 20 (100.0%) | 0 (0.0%) |
| Legal Services & Support | 0 (0.0%) | 0 (0.0%) |
| Education Instruction & Library | 63 (69.2%) | 28 (30.8%) |
| Arts, Media & Entertainment | 0 (0.0%) | 0 (0.0%) |
| Health Diagnosing & Treating | 18 (100.0%) | 0 (0.0%) |
| Health Technologists | 18 (100.0%) | 0 (0.0%) |
| Total (Category) | 132 (51.8%) | 123 (48.2%) |
| Total (Overall) | 430 (64.3%) | 239 (35.7%) |
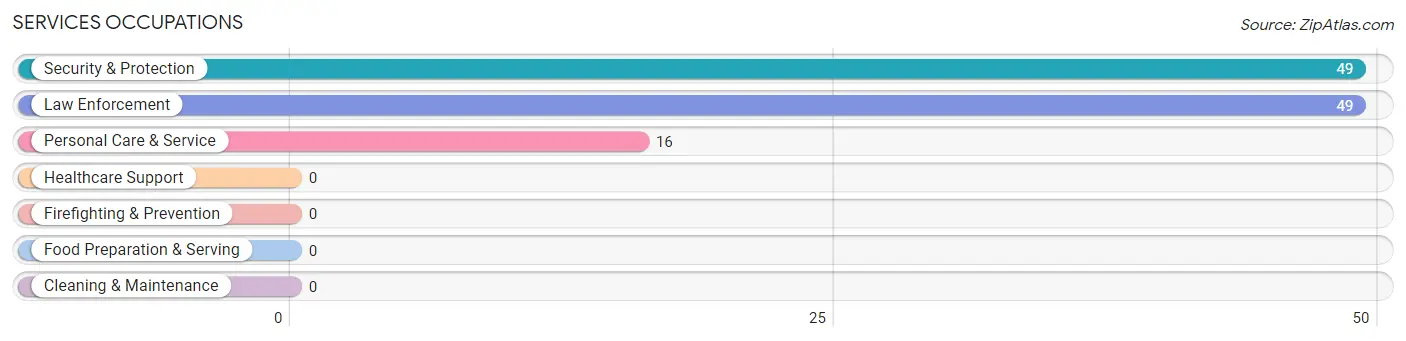
Services Occupations
The most common Services occupations in Big Point are Security & Protection (49 | 7.3%), Law Enforcement (49 | 7.3%), and Personal Care & Service (16 | 2.4%).
Services Occupations by Sex
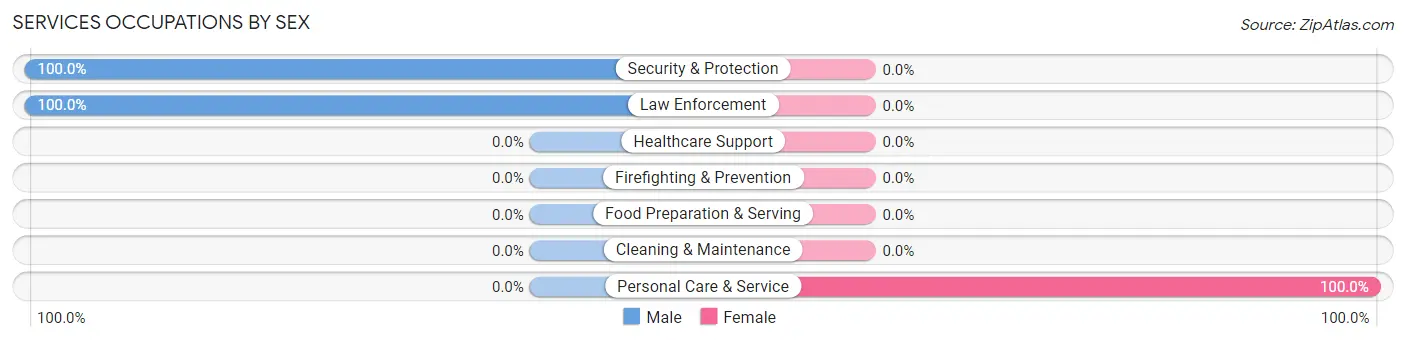
| Occupation | Male | Female |
| Healthcare Support | 0 (0.0%) | 0 (0.0%) |
| Security & Protection | 49 (100.0%) | 0 (0.0%) |
| Firefighting & Prevention | 0 (0.0%) | 0 (0.0%) |
| Law Enforcement | 49 (100.0%) | 0 (0.0%) |
| Food Preparation & Serving | 0 (0.0%) | 0 (0.0%) |
| Cleaning & Maintenance | 0 (0.0%) | 0 (0.0%) |
| Personal Care & Service | 0 (0.0%) | 16 (100.0%) |
| Total (Category) | 49 (75.4%) | 16 (24.6%) |
| Total (Overall) | 430 (64.3%) | 239 (35.7%) |
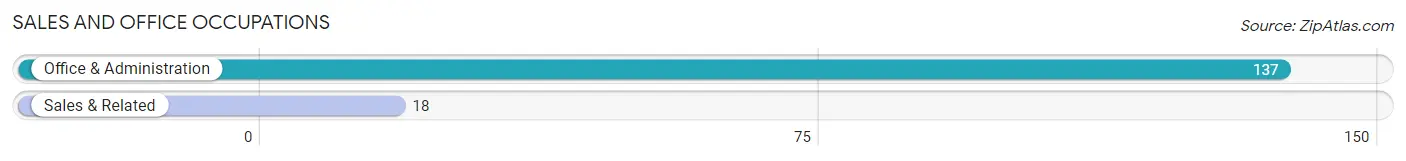
Sales and Office Occupations
The most common Sales and Office occupations in Big Point are Office & Administration (137 | 20.5%), and Sales & Related (18 | 2.7%).
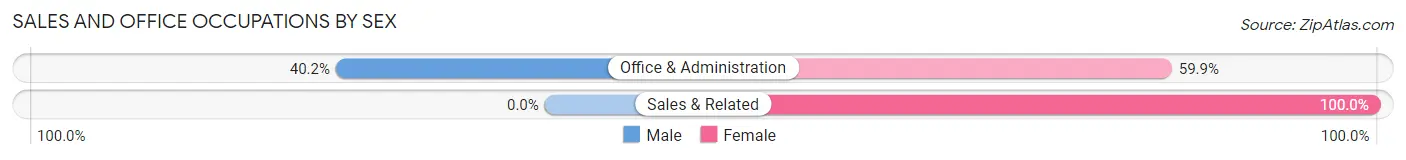
Sales and Office Occupations by Sex
| Occupation | Male | Female |
| Sales & Related | 0 (0.0%) | 18 (100.0%) |
| Office & Administration | 55 (40.2%) | 82 (59.9%) |
| Total (Category) | 55 (35.5%) | 100 (64.5%) |
| Total (Overall) | 430 (64.3%) | 239 (35.7%) |
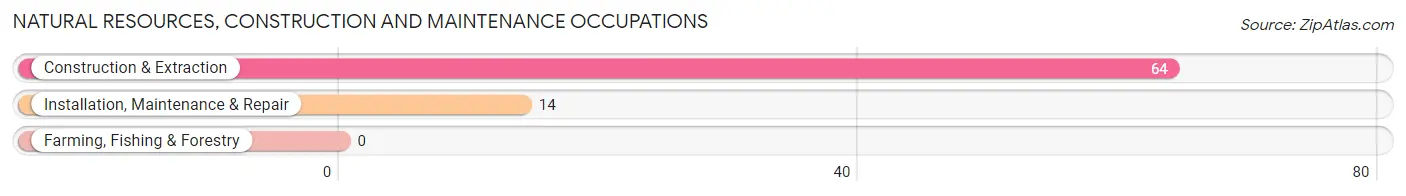
Natural Resources, Construction and Maintenance Occupations
The most common Natural Resources, Construction and Maintenance occupations in Big Point are Construction & Extraction (64 | 9.6%), and Installation, Maintenance & Repair (14 | 2.1%).
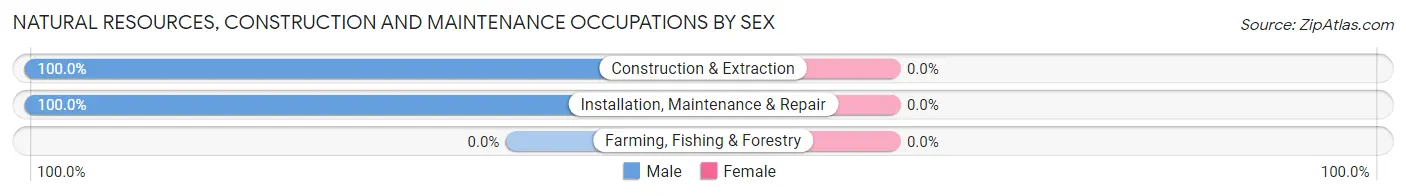
Natural Resources, Construction and Maintenance Occupations by Sex
| Occupation | Male | Female |
| Farming, Fishing & Forestry | 0 (0.0%) | 0 (0.0%) |
| Construction & Extraction | 64 (100.0%) | 0 (0.0%) |
| Installation, Maintenance & Repair | 14 (100.0%) | 0 (0.0%) |
| Total (Category) | 78 (100.0%) | 0 (0.0%) |
| Total (Overall) | 430 (64.3%) | 239 (35.7%) |
Production, Transportation and Moving Occupations
The most common Production, Transportation and Moving occupations in Big Point are , and Production (116 | 17.3%).
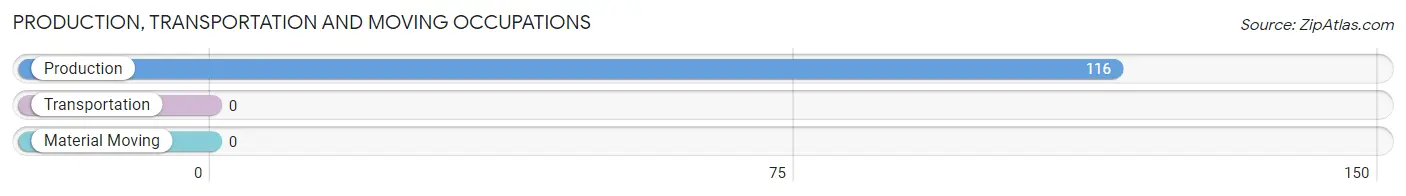
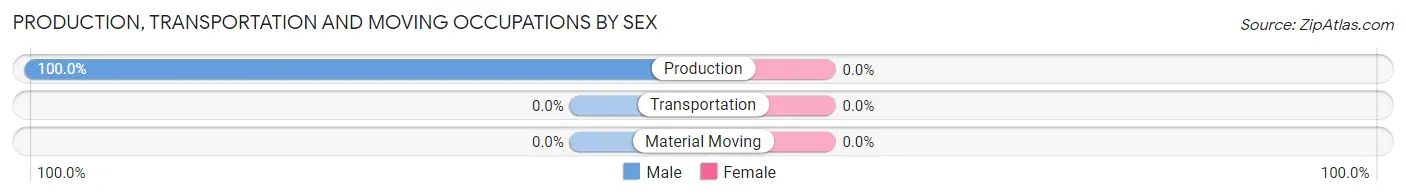
Production, Transportation and Moving Occupations by Sex
| Occupation | Male | Female |
| Production | 116 (100.0%) | 0 (0.0%) |
| Transportation | 0 (0.0%) | 0 (0.0%) |
| Material Moving | 0 (0.0%) | 0 (0.0%) |
| Total (Category) | 116 (100.0%) | 0 (0.0%) |
| Total (Overall) | 430 (64.3%) | 239 (35.7%) |
Employment Industries by Sex in Big Point
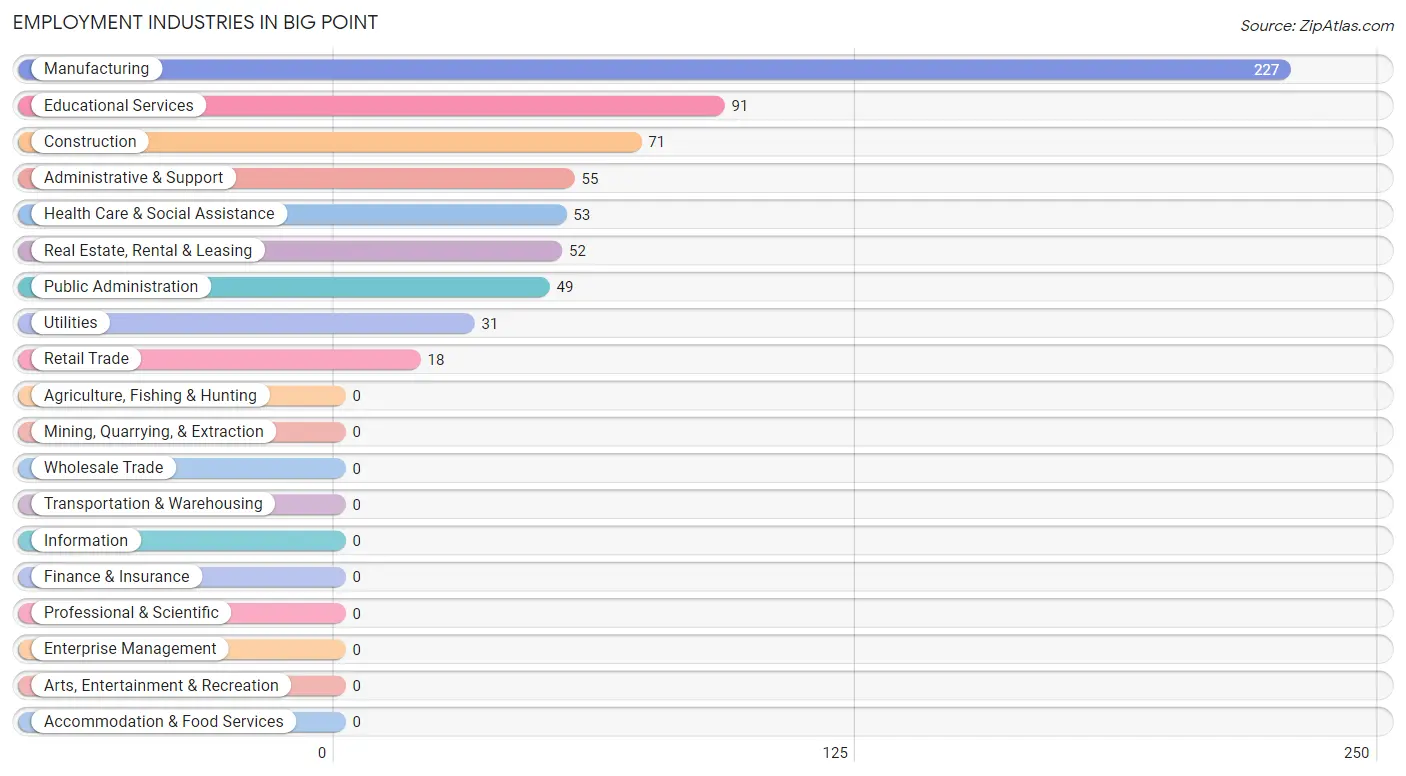
Employment Industries in Big Point
The major employment industries in Big Point include Manufacturing (227 | 33.9%), Educational Services (91 | 13.6%), Construction (71 | 10.6%), Administrative & Support (55 | 8.2%), and Health Care & Social Assistance (53 | 7.9%).
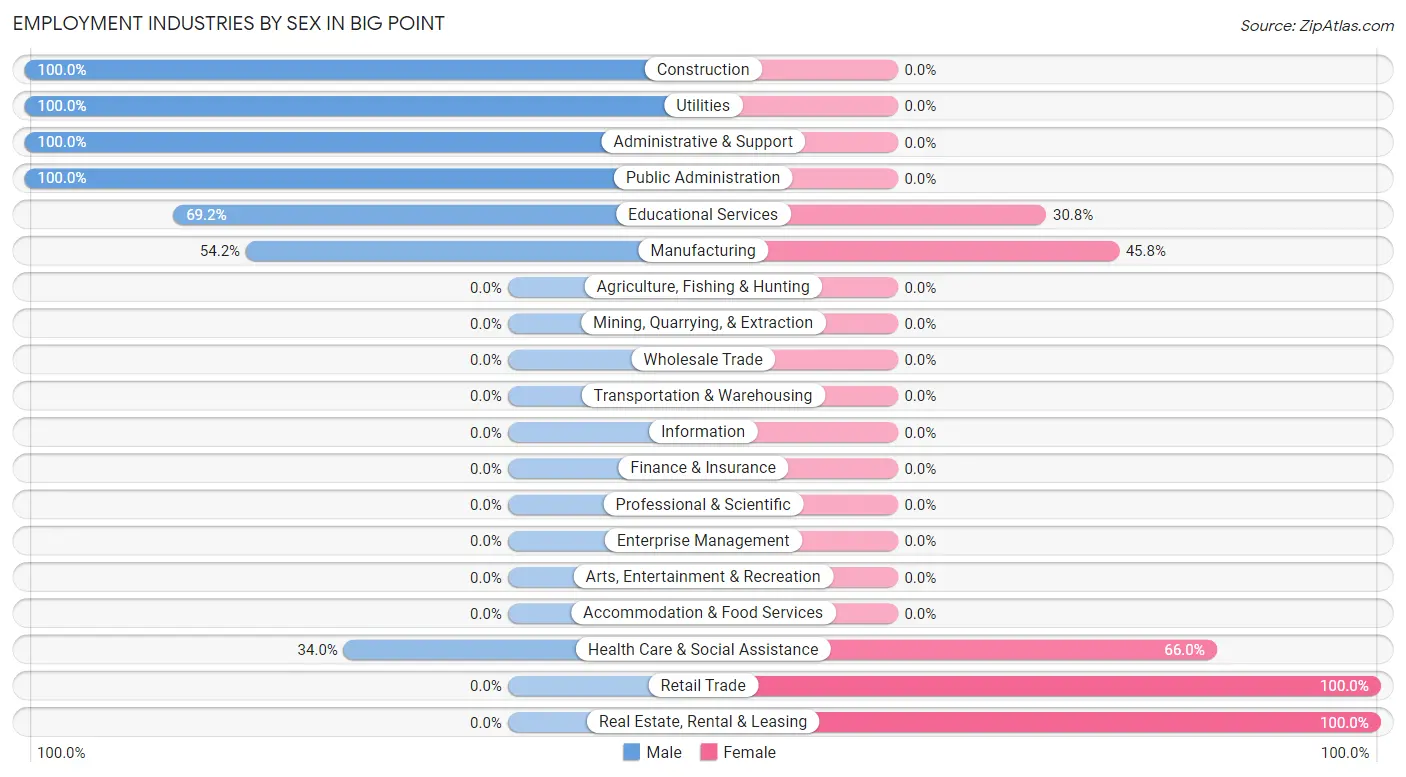
Employment Industries by Sex in Big Point
The Big Point industries that see more men than women are Construction (100.0%), Utilities (100.0%), and Administrative & Support (100.0%), whereas the industries that tend to have a higher number of women are Retail Trade (100.0%), Real Estate, Rental & Leasing (100.0%), and Health Care & Social Assistance (66.0%).
| Industry | Male | Female |
| Agriculture, Fishing & Hunting | 0 (0.0%) | 0 (0.0%) |
| Mining, Quarrying, & Extraction | 0 (0.0%) | 0 (0.0%) |
| Construction | 71 (100.0%) | 0 (0.0%) |
| Manufacturing | 123 (54.2%) | 104 (45.8%) |
| Wholesale Trade | 0 (0.0%) | 0 (0.0%) |
| Retail Trade | 0 (0.0%) | 18 (100.0%) |
| Transportation & Warehousing | 0 (0.0%) | 0 (0.0%) |
| Utilities | 31 (100.0%) | 0 (0.0%) |
| Information | 0 (0.0%) | 0 (0.0%) |
| Finance & Insurance | 0 (0.0%) | 0 (0.0%) |
| Real Estate, Rental & Leasing | 0 (0.0%) | 52 (100.0%) |
| Professional & Scientific | 0 (0.0%) | 0 (0.0%) |
| Enterprise Management | 0 (0.0%) | 0 (0.0%) |
| Administrative & Support | 55 (100.0%) | 0 (0.0%) |
| Educational Services | 63 (69.2%) | 28 (30.8%) |
| Health Care & Social Assistance | 18 (34.0%) | 35 (66.0%) |
| Arts, Entertainment & Recreation | 0 (0.0%) | 0 (0.0%) |
| Accommodation & Food Services | 0 (0.0%) | 0 (0.0%) |
| Public Administration | 49 (100.0%) | 0 (0.0%) |
| Total | 430 (64.3%) | 239 (35.7%) |
Education in Big Point
School Enrollment in Big Point
The most common levels of schooling among the 211 students in Big Point are graduate / professional (84 | 39.8%), elementary school (46 | 21.8%), and high school (44 | 20.8%).
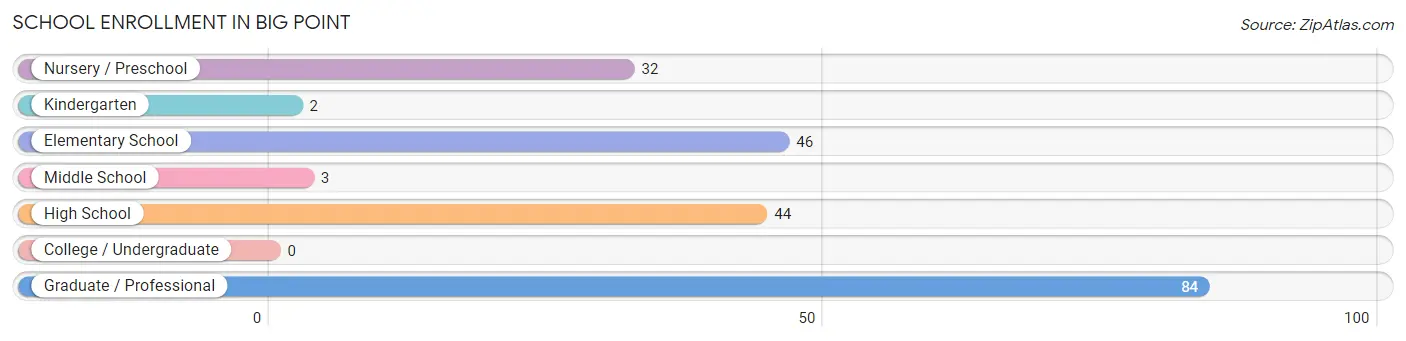
| School Level | # Students | % Students |
| Nursery / Preschool | 32 | 15.2% |
| Kindergarten | 2 | 0.9% |
| Elementary School | 46 | 21.8% |
| Middle School | 3 | 1.4% |
| High School | 44 | 20.8% |
| College / Undergraduate | 0 | 0.0% |
| Graduate / Professional | 84 | 39.8% |
| Total | 211 | 100.0% |
School Enrollment by Age by Funding Source in Big Point
Out of a total of 211 students who are enrolled in schools in Big Point, 30 (14.2%) attend a private institution, while the remaining 181 (85.8%) are enrolled in public schools. The age group of 3 to 4 year olds has the highest likelihood of being enrolled in private schools, with 30 (93.8% in the age bracket) enrolled. Conversely, the age group of 5 to 9 year old has the lowest likelihood of being enrolled in a private school, with 32 (100.0% in the age bracket) attending a public institution.
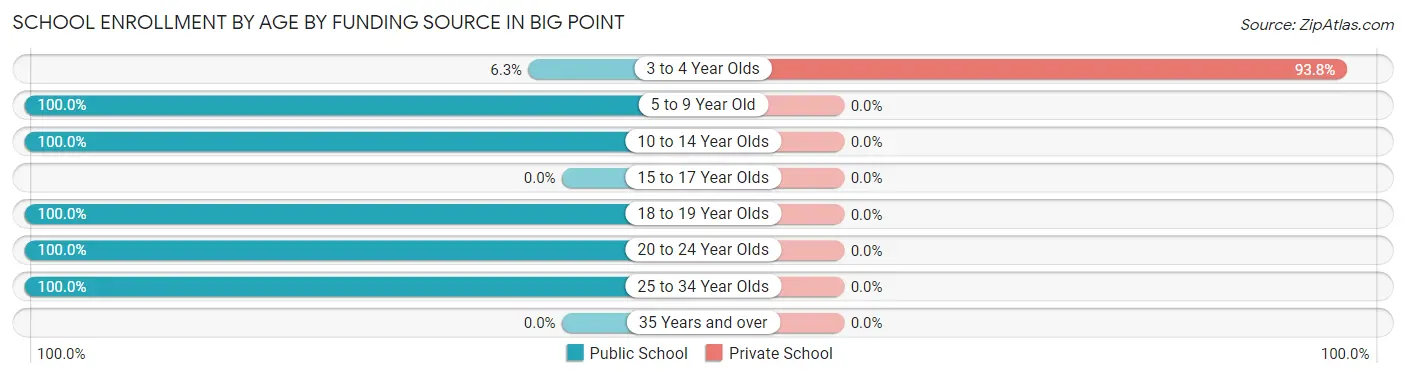
| Age Bracket | Public School | Private School |
| 3 to 4 Year Olds | 2 (6.2%) | 30 (93.8%) |
| 5 to 9 Year Old | 32 (100.0%) | 0 (0.0%) |
| 10 to 14 Year Olds | 19 (100.0%) | 0 (0.0%) |
| 15 to 17 Year Olds | 0 (0.0%) | 0 (0.0%) |
| 18 to 19 Year Olds | 44 (100.0%) | 0 (0.0%) |
| 20 to 24 Year Olds | 63 (100.0%) | 0 (0.0%) |
| 25 to 34 Year Olds | 21 (100.0%) | 0 (0.0%) |
| 35 Years and over | 0 (0.0%) | 0 (0.0%) |
| Total | 181 (85.8%) | 30 (14.2%) |
Educational Attainment by Field of Study in Big Point
Business (69 | 51.5%), science & technology (37 | 27.6%), and education (28 | 20.9%) are the most common fields of study among 134 individuals in Big Point who have obtained a bachelor's degree or higher.
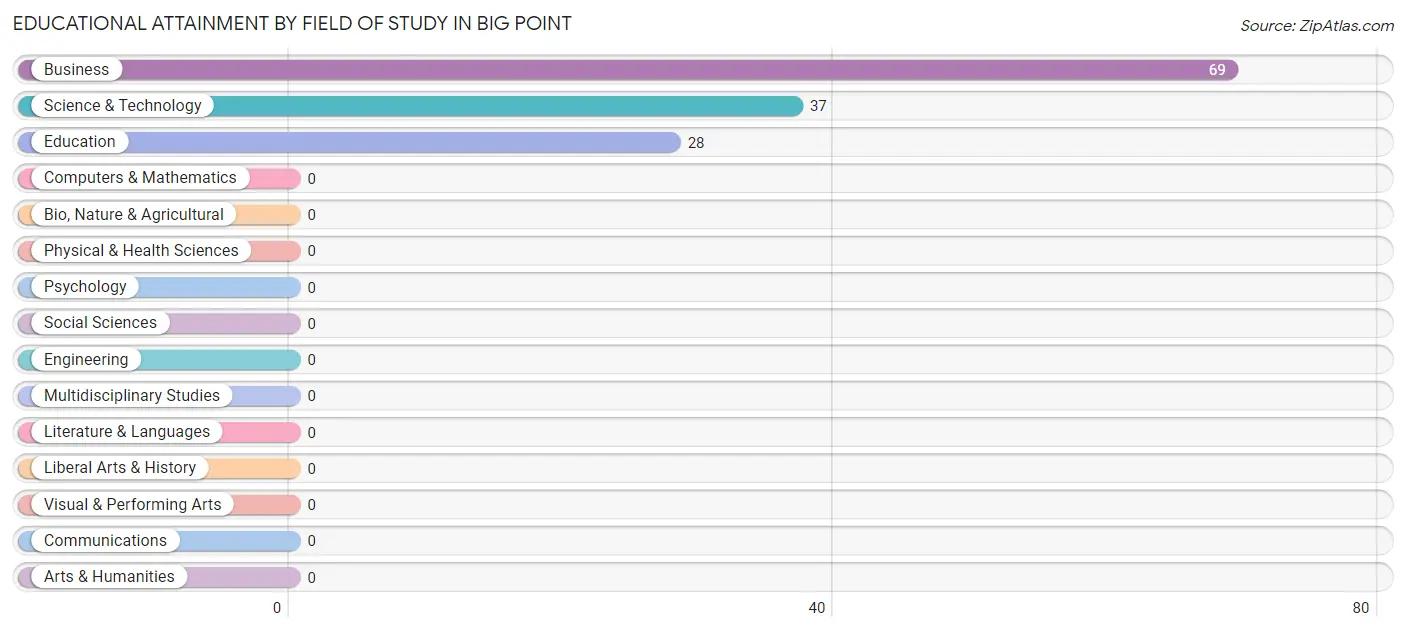
| Field of Study | # Graduates | % Graduates |
| Computers & Mathematics | 0 | 0.0% |
| Bio, Nature & Agricultural | 0 | 0.0% |
| Physical & Health Sciences | 0 | 0.0% |
| Psychology | 0 | 0.0% |
| Social Sciences | 0 | 0.0% |
| Engineering | 0 | 0.0% |
| Multidisciplinary Studies | 0 | 0.0% |
| Science & Technology | 37 | 27.6% |
| Business | 69 | 51.5% |
| Education | 28 | 20.9% |
| Literature & Languages | 0 | 0.0% |
| Liberal Arts & History | 0 | 0.0% |
| Visual & Performing Arts | 0 | 0.0% |
| Communications | 0 | 0.0% |
| Arts & Humanities | 0 | 0.0% |
| Total | 134 | 100.0% |
Transportation & Commute in Big Point
Vehicle Availability by Sex in Big Point
The most prevalent vehicle ownership categories in Big Point are males with 5 or more vehicles (167, accounting for 38.8%) and females with 5 or more vehicles (52, making up 69.9%).
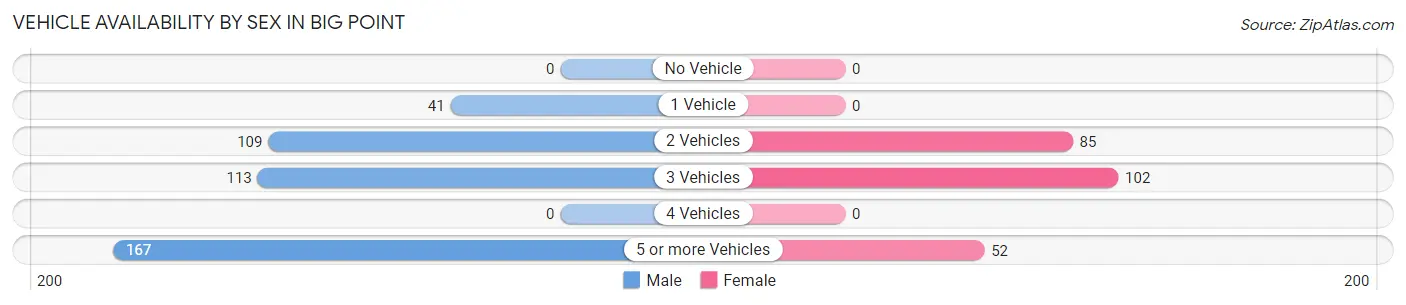
| Vehicles Available | Male | Female |
| No Vehicle | 0 (0.0%) | 0 (0.0%) |
| 1 Vehicle | 41 (9.5%) | 0 (0.0%) |
| 2 Vehicles | 109 (25.4%) | 85 (35.6%) |
| 3 Vehicles | 113 (26.3%) | 102 (42.7%) |
| 4 Vehicles | 0 (0.0%) | 0 (0.0%) |
| 5 or more Vehicles | 167 (38.8%) | 52 (21.8%) |
| Total | 430 (100.0%) | 239 (100.0%) |
Commute Time in Big Point
The most frequently occuring commute durations in Big Point are 30 to 34 minutes (442 commuters, 66.1%), 5 to 9 minutes (52 commuters, 7.8%), and 35 to 39 minutes (49 commuters, 7.3%).
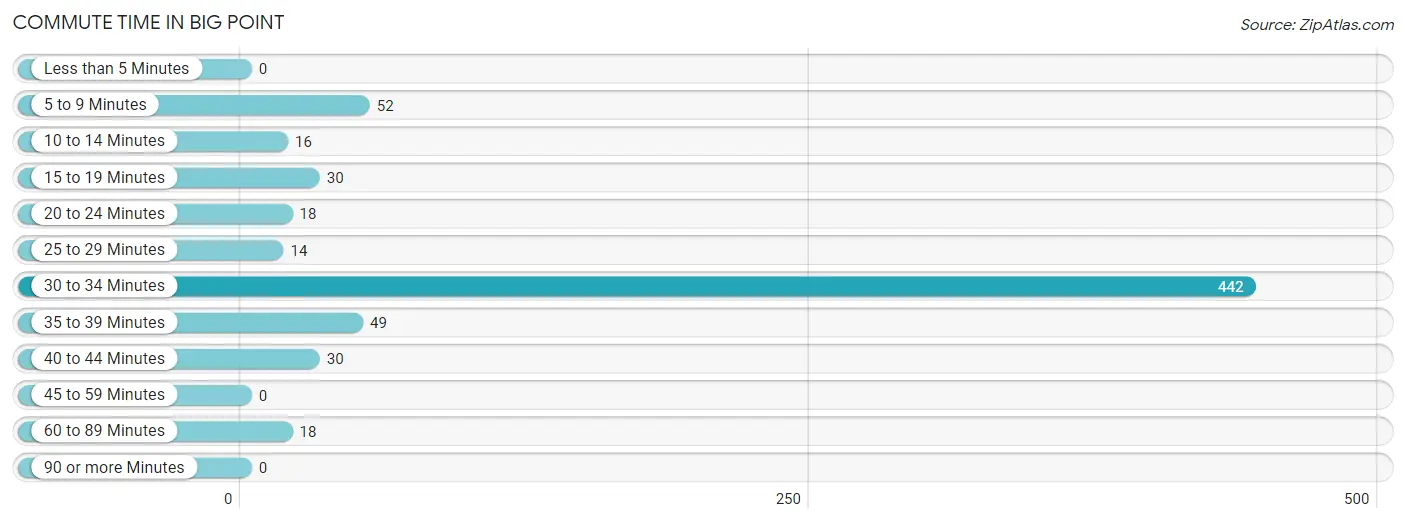
| Commute Time | # Commuters | % Commuters |
| Less than 5 Minutes | 0 | 0.0% |
| 5 to 9 Minutes | 52 | 7.8% |
| 10 to 14 Minutes | 16 | 2.4% |
| 15 to 19 Minutes | 30 | 4.5% |
| 20 to 24 Minutes | 18 | 2.7% |
| 25 to 29 Minutes | 14 | 2.1% |
| 30 to 34 Minutes | 442 | 66.1% |
| 35 to 39 Minutes | 49 | 7.3% |
| 40 to 44 Minutes | 30 | 4.5% |
| 45 to 59 Minutes | 0 | 0.0% |
| 60 to 89 Minutes | 18 | 2.7% |
| 90 or more Minutes | 0 | 0.0% |
Commute Time by Sex in Big Point
The most common commute times in Big Point are 30 to 34 minutes (319 commuters, 74.2%) for males and 30 to 34 minutes (123 commuters, 51.5%) for females.
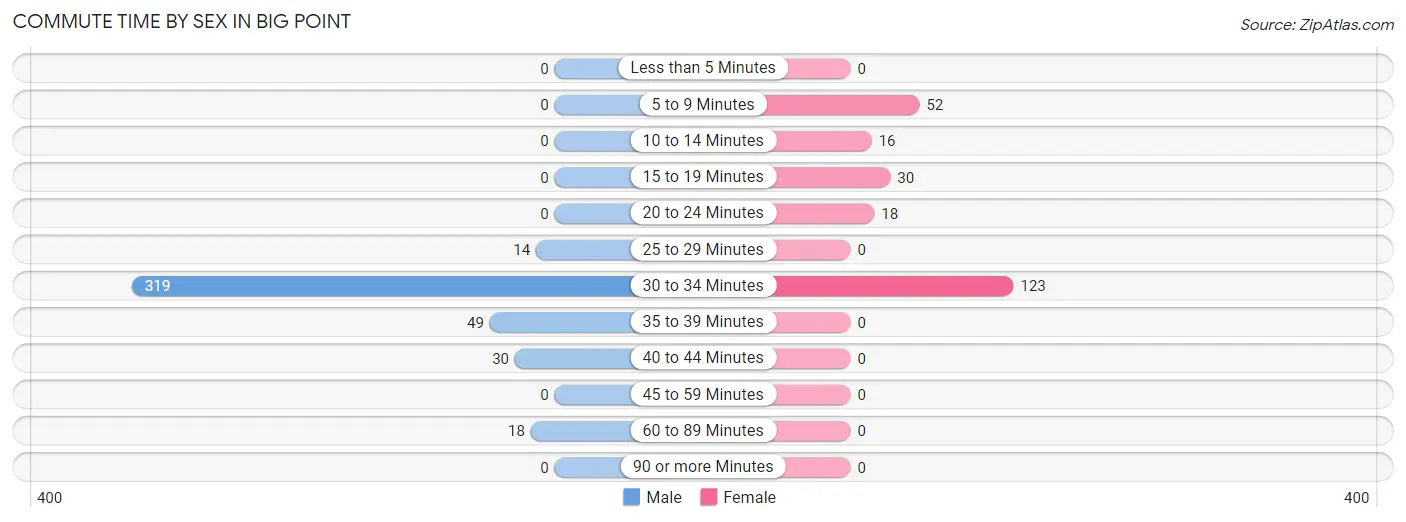
| Commute Time | Male | Female |
| Less than 5 Minutes | 0 (0.0%) | 0 (0.0%) |
| 5 to 9 Minutes | 0 (0.0%) | 52 (21.8%) |
| 10 to 14 Minutes | 0 (0.0%) | 16 (6.7%) |
| 15 to 19 Minutes | 0 (0.0%) | 30 (12.6%) |
| 20 to 24 Minutes | 0 (0.0%) | 18 (7.5%) |
| 25 to 29 Minutes | 14 (3.3%) | 0 (0.0%) |
| 30 to 34 Minutes | 319 (74.2%) | 123 (51.5%) |
| 35 to 39 Minutes | 49 (11.4%) | 0 (0.0%) |
| 40 to 44 Minutes | 30 (7.0%) | 0 (0.0%) |
| 45 to 59 Minutes | 0 (0.0%) | 0 (0.0%) |
| 60 to 89 Minutes | 18 (4.2%) | 0 (0.0%) |
| 90 or more Minutes | 0 (0.0%) | 0 (0.0%) |
Time of Departure to Work by Sex in Big Point
The most frequent times of departure to work in Big Point are 7:30 AM to 7:59 AM (113, 26.3%) for males and 7:30 AM to 7:59 AM (146, 61.1%) for females.
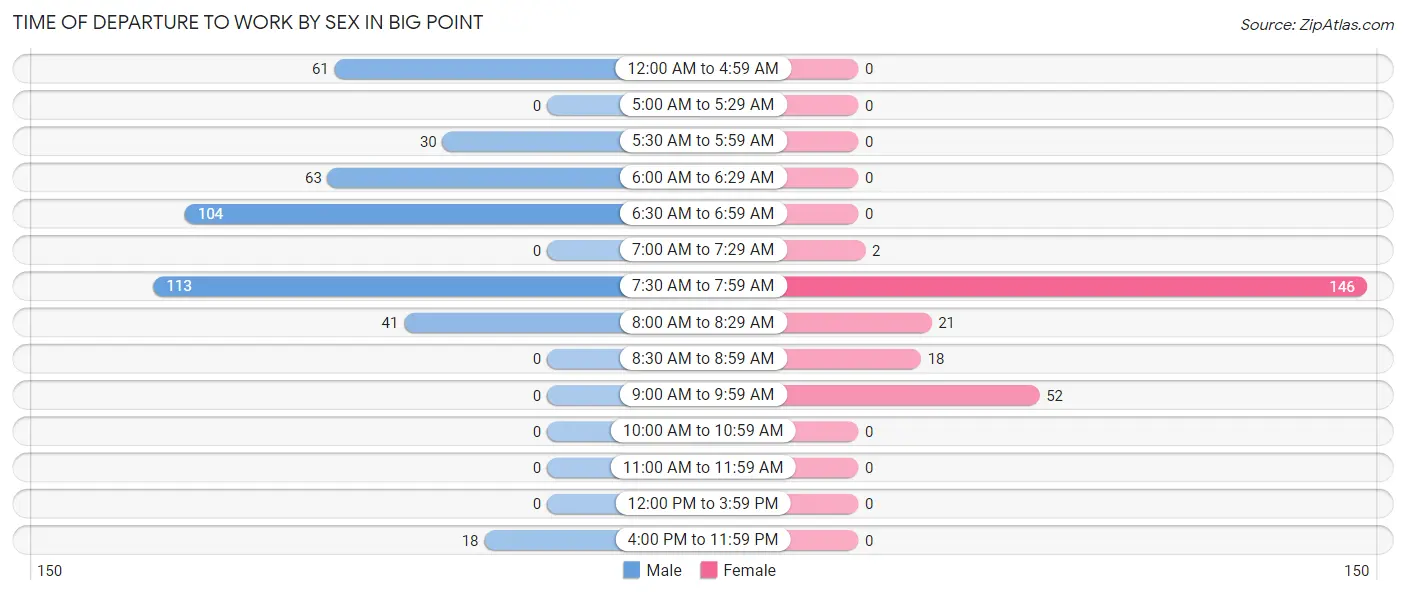
| Time of Departure | Male | Female |
| 12:00 AM to 4:59 AM | 61 (14.2%) | 0 (0.0%) |
| 5:00 AM to 5:29 AM | 0 (0.0%) | 0 (0.0%) |
| 5:30 AM to 5:59 AM | 30 (7.0%) | 0 (0.0%) |
| 6:00 AM to 6:29 AM | 63 (14.6%) | 0 (0.0%) |
| 6:30 AM to 6:59 AM | 104 (24.2%) | 0 (0.0%) |
| 7:00 AM to 7:29 AM | 0 (0.0%) | 2 (0.8%) |
| 7:30 AM to 7:59 AM | 113 (26.3%) | 146 (61.1%) |
| 8:00 AM to 8:29 AM | 41 (9.5%) | 21 (8.8%) |
| 8:30 AM to 8:59 AM | 0 (0.0%) | 18 (7.5%) |
| 9:00 AM to 9:59 AM | 0 (0.0%) | 52 (21.8%) |
| 10:00 AM to 10:59 AM | 0 (0.0%) | 0 (0.0%) |
| 11:00 AM to 11:59 AM | 0 (0.0%) | 0 (0.0%) |
| 12:00 PM to 3:59 PM | 0 (0.0%) | 0 (0.0%) |
| 4:00 PM to 11:59 PM | 18 (4.2%) | 0 (0.0%) |
| Total | 430 (100.0%) | 239 (100.0%) |
Housing Occupancy in Big Point
Occupancy by Ownership in Big Point
Of the total 328 dwellings in Big Point, owner-occupied units account for 269 (82.0%), while renter-occupied units make up 59 (18.0%).
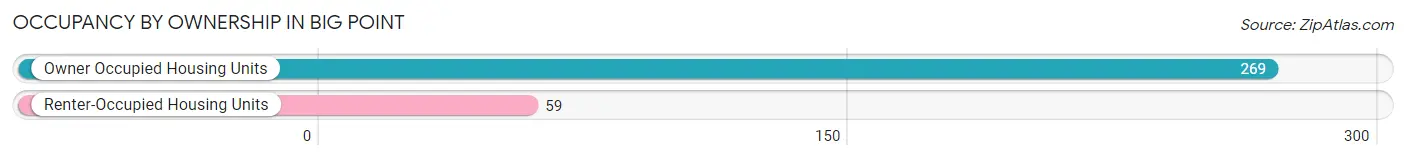
| Occupancy | # Housing Units | % Housing Units |
| Owner Occupied Housing Units | 269 | 82.0% |
| Renter-Occupied Housing Units | 59 | 18.0% |
| Total Occupied Housing Units | 328 | 100.0% |
Occupancy by Household Size in Big Point
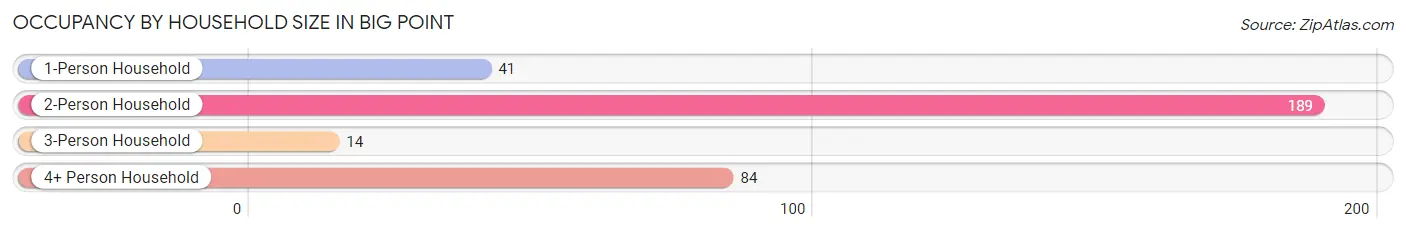
| Household Size | # Housing Units | % Housing Units |
| 1-Person Household | 41 | 12.5% |
| 2-Person Household | 189 | 57.6% |
| 3-Person Household | 14 | 4.3% |
| 4+ Person Household | 84 | 25.6% |
| Total Housing Units | 328 | 100.0% |
Occupancy by Ownership by Household Size in Big Point
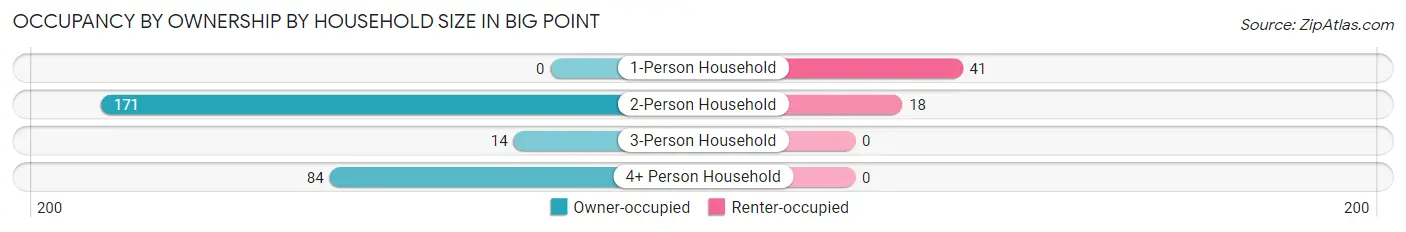
| Household Size | Owner-occupied | Renter-occupied |
| 1-Person Household | 0 (0.0%) | 41 (100.0%) |
| 2-Person Household | 171 (90.5%) | 18 (9.5%) |
| 3-Person Household | 14 (100.0%) | 0 (0.0%) |
| 4+ Person Household | 84 (100.0%) | 0 (0.0%) |
| Total Housing Units | 269 (82.0%) | 59 (18.0%) |
Occupancy by Educational Attainment in Big Point
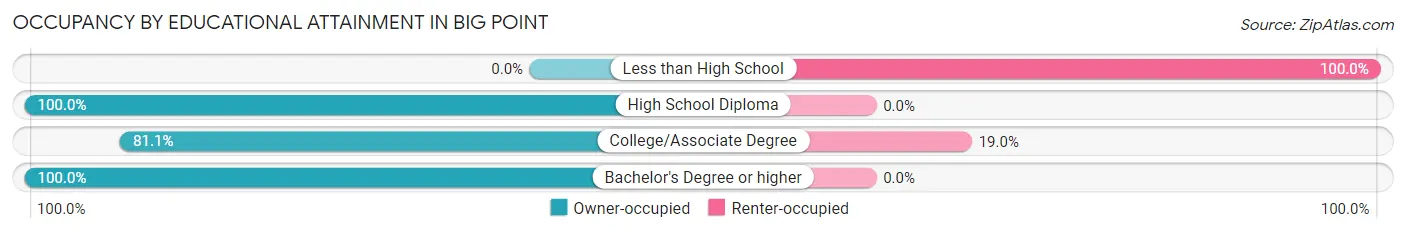
| Household Size | Owner-occupied | Renter-occupied |
| Less than High School | 0 (0.0%) | 41 (100.0%) |
| High School Diploma | 171 (100.0%) | 0 (0.0%) |
| College/Associate Degree | 77 (81.0%) | 18 (19.0%) |
| Bachelor's Degree or higher | 21 (100.0%) | 0 (0.0%) |
Occupancy by Age of Householder in Big Point
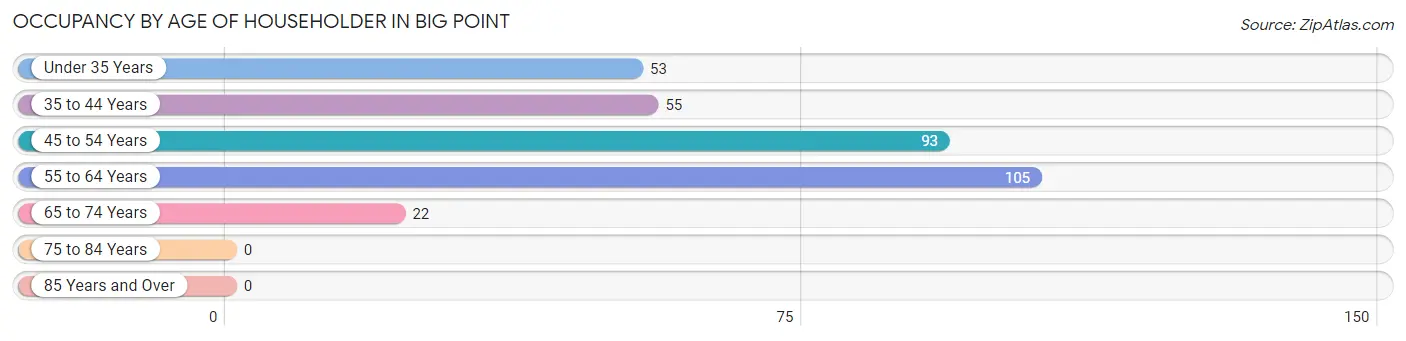
| Age Bracket | # Households | % Households |
| Under 35 Years | 53 | 16.2% |
| 35 to 44 Years | 55 | 16.8% |
| 45 to 54 Years | 93 | 28.3% |
| 55 to 64 Years | 105 | 32.0% |
| 65 to 74 Years | 22 | 6.7% |
| 75 to 84 Years | 0 | 0.0% |
| 85 Years and Over | 0 | 0.0% |
| Total | 328 | 100.0% |
Housing Finances in Big Point
Median Income by Occupancy in Big Point
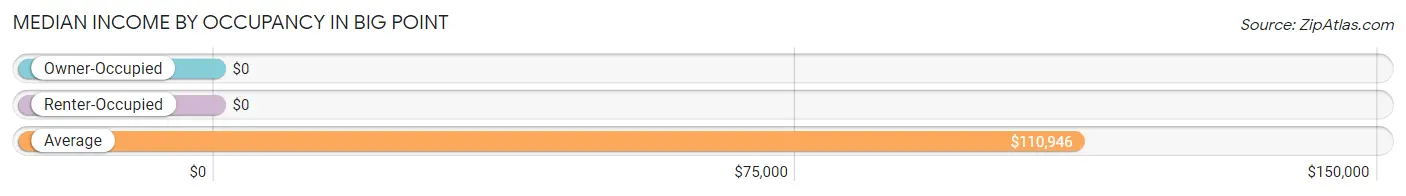
| Occupancy Type | # Households | Median Income |
| Owner-Occupied | 269 (82.0%) | $0 |
| Renter-Occupied | 59 (18.0%) | $0 |
| Average | 328 (100.0%) | $110,946 |
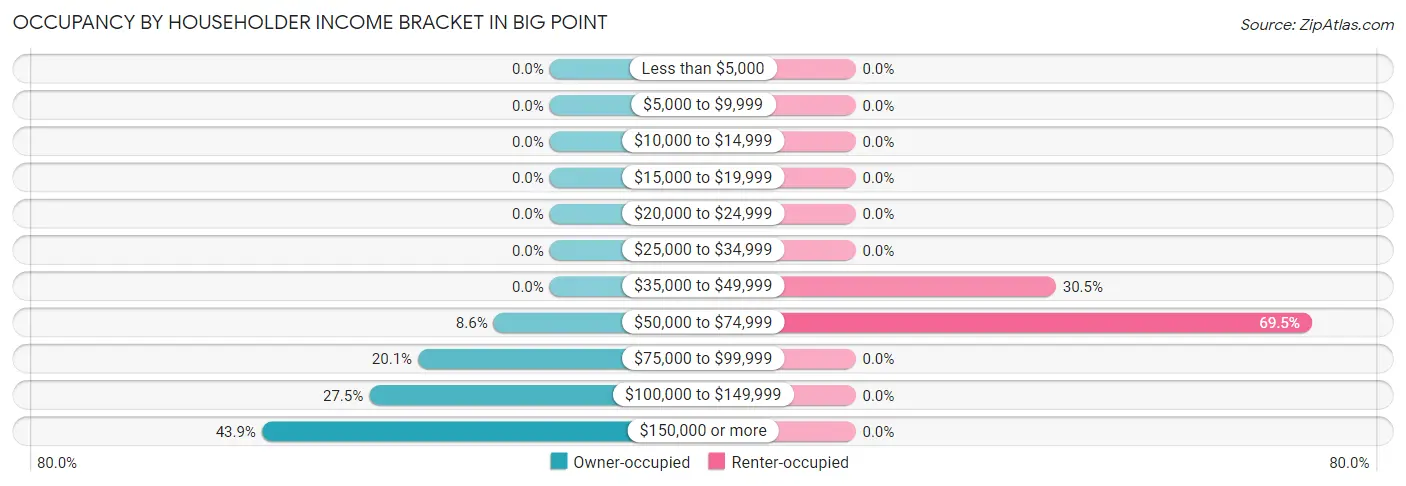
Occupancy by Householder Income Bracket in Big Point
| Income Bracket | Owner-occupied | Renter-occupied |
| Less than $5,000 | 0 (0.0%) | 0 (0.0%) |
| $5,000 to $9,999 | 0 (0.0%) | 0 (0.0%) |
| $10,000 to $14,999 | 0 (0.0%) | 0 (0.0%) |
| $15,000 to $19,999 | 0 (0.0%) | 0 (0.0%) |
| $20,000 to $24,999 | 0 (0.0%) | 0 (0.0%) |
| $25,000 to $34,999 | 0 (0.0%) | 0 (0.0%) |
| $35,000 to $49,999 | 0 (0.0%) | 18 (30.5%) |
| $50,000 to $74,999 | 23 (8.6%) | 41 (69.5%) |
| $75,000 to $99,999 | 54 (20.1%) | 0 (0.0%) |
| $100,000 to $149,999 | 74 (27.5%) | 0 (0.0%) |
| $150,000 or more | 118 (43.9%) | 0 (0.0%) |
| Total | 269 (100.0%) | 59 (100.0%) |
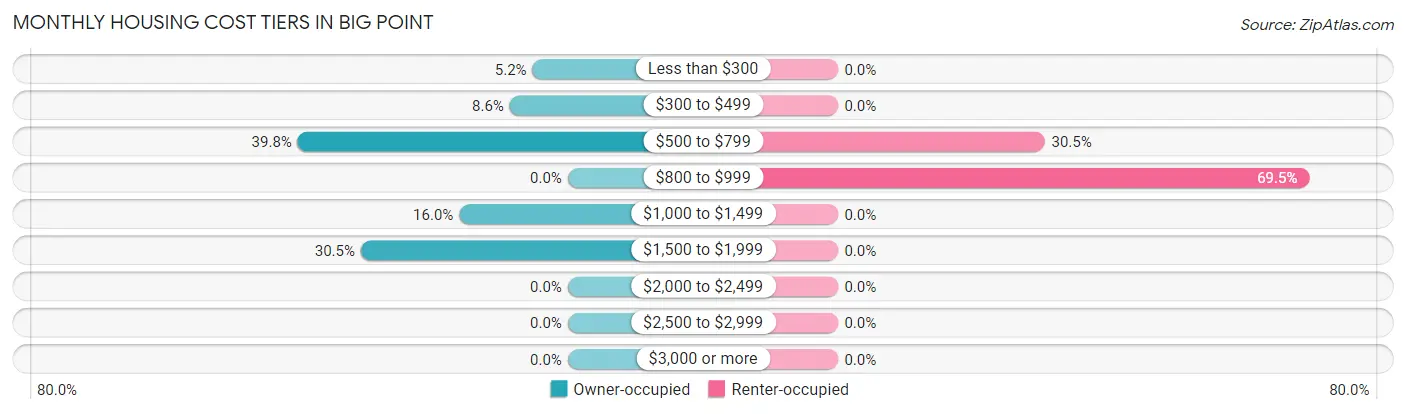
Monthly Housing Cost Tiers in Big Point
| Monthly Cost | Owner-occupied | Renter-occupied |
| Less than $300 | 14 (5.2%) | 0 (0.0%) |
| $300 to $499 | 23 (8.6%) | 0 (0.0%) |
| $500 to $799 | 107 (39.8%) | 18 (30.5%) |
| $800 to $999 | 0 (0.0%) | 41 (69.5%) |
| $1,000 to $1,499 | 43 (16.0%) | 0 (0.0%) |
| $1,500 to $1,999 | 82 (30.5%) | 0 (0.0%) |
| $2,000 to $2,499 | 0 (0.0%) | 0 (0.0%) |
| $2,500 to $2,999 | 0 (0.0%) | 0 (0.0%) |
| $3,000 or more | 0 (0.0%) | 0 (0.0%) |
| Total | 269 (100.0%) | 59 (100.0%) |
Physical Housing Characteristics in Big Point
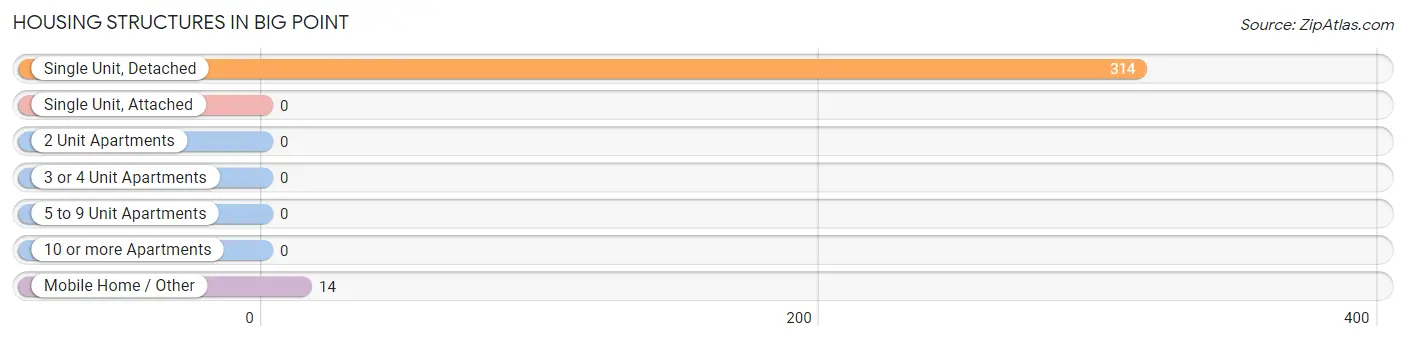
Housing Structures in Big Point
| Structure Type | # Housing Units | % Housing Units |
| Single Unit, Detached | 314 | 95.7% |
| Single Unit, Attached | 0 | 0.0% |
| 2 Unit Apartments | 0 | 0.0% |
| 3 or 4 Unit Apartments | 0 | 0.0% |
| 5 to 9 Unit Apartments | 0 | 0.0% |
| 10 or more Apartments | 0 | 0.0% |
| Mobile Home / Other | 14 | 4.3% |
| Total | 328 | 100.0% |
Housing Structures by Occupancy in Big Point
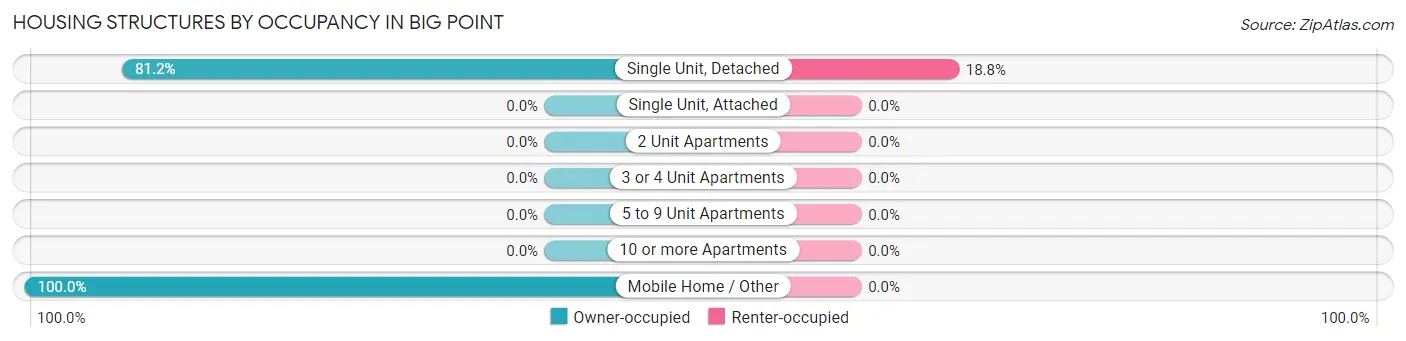
| Structure Type | Owner-occupied | Renter-occupied |
| Single Unit, Detached | 255 (81.2%) | 59 (18.8%) |
| Single Unit, Attached | 0 (0.0%) | 0 (0.0%) |
| 2 Unit Apartments | 0 (0.0%) | 0 (0.0%) |
| 3 or 4 Unit Apartments | 0 (0.0%) | 0 (0.0%) |
| 5 to 9 Unit Apartments | 0 (0.0%) | 0 (0.0%) |
| 10 or more Apartments | 0 (0.0%) | 0 (0.0%) |
| Mobile Home / Other | 14 (100.0%) | 0 (0.0%) |
| Total | 269 (82.0%) | 59 (18.0%) |
Housing Structures by Number of Rooms in Big Point
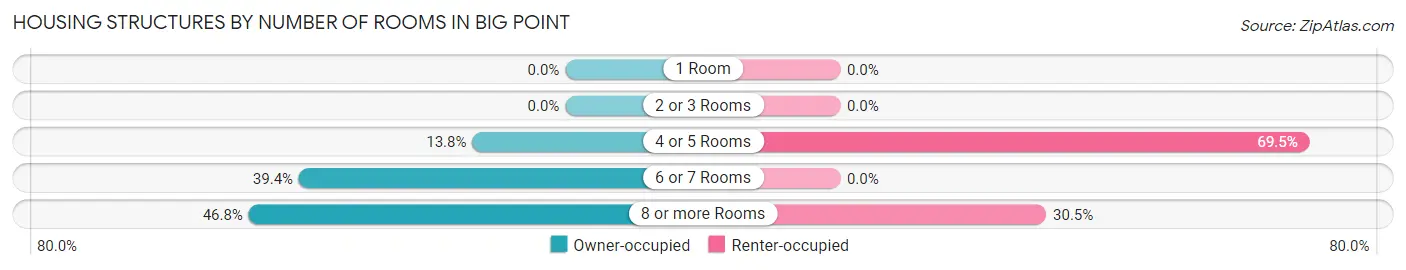
| Number of Rooms | Owner-occupied | Renter-occupied |
| 1 Room | 0 (0.0%) | 0 (0.0%) |
| 2 or 3 Rooms | 0 (0.0%) | 0 (0.0%) |
| 4 or 5 Rooms | 37 (13.8%) | 41 (69.5%) |
| 6 or 7 Rooms | 106 (39.4%) | 0 (0.0%) |
| 8 or more Rooms | 126 (46.8%) | 18 (30.5%) |
| Total | 269 (100.0%) | 59 (100.0%) |
Housing Structure by Heating Type in Big Point
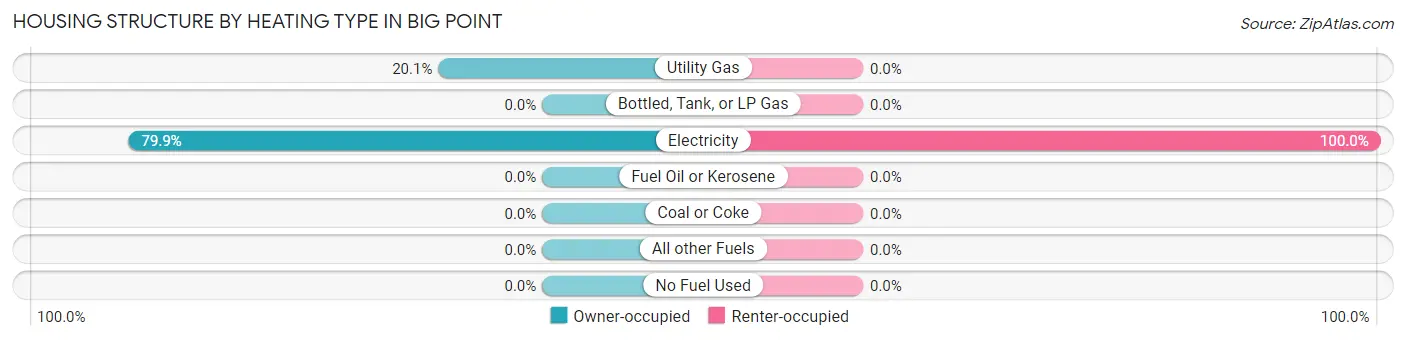
| Heating Type | Owner-occupied | Renter-occupied |
| Utility Gas | 54 (20.1%) | 0 (0.0%) |
| Bottled, Tank, or LP Gas | 0 (0.0%) | 0 (0.0%) |
| Electricity | 215 (79.9%) | 59 (100.0%) |
| Fuel Oil or Kerosene | 0 (0.0%) | 0 (0.0%) |
| Coal or Coke | 0 (0.0%) | 0 (0.0%) |
| All other Fuels | 0 (0.0%) | 0 (0.0%) |
| No Fuel Used | 0 (0.0%) | 0 (0.0%) |
| Total | 269 (100.0%) | 59 (100.0%) |
Household Vehicle Usage in Big Point
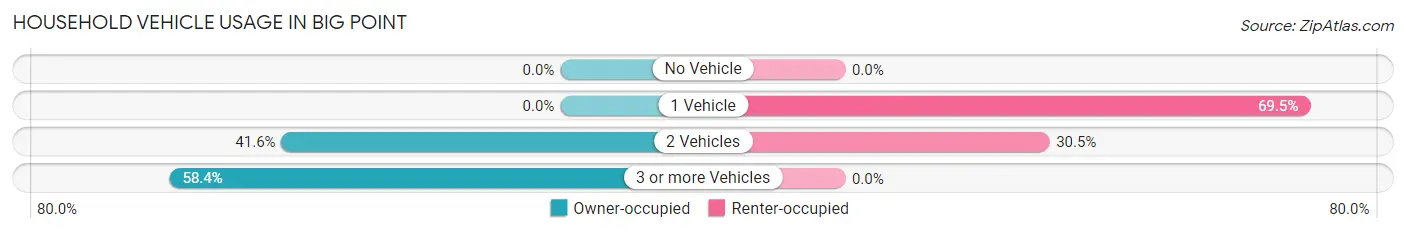
| Vehicles per Household | Owner-occupied | Renter-occupied |
| No Vehicle | 0 (0.0%) | 0 (0.0%) |
| 1 Vehicle | 0 (0.0%) | 41 (69.5%) |
| 2 Vehicles | 112 (41.6%) | 18 (30.5%) |
| 3 or more Vehicles | 157 (58.4%) | 0 (0.0%) |
| Total | 269 (100.0%) | 59 (100.0%) |
Real Estate & Mortgages in Big Point
Real Estate and Mortgage Overview in Big Point
| Characteristic | Without Mortgage | With Mortgage |
| Housing Units | 144 | 125 |
| Median Property Value | $114,900 | $274,700 |
| Median Household Income | - | - |
| Monthly Housing Costs | $605 | $0 |
| Real Estate Taxes | $2,027 | $0 |
Property Value by Mortgage Status in Big Point
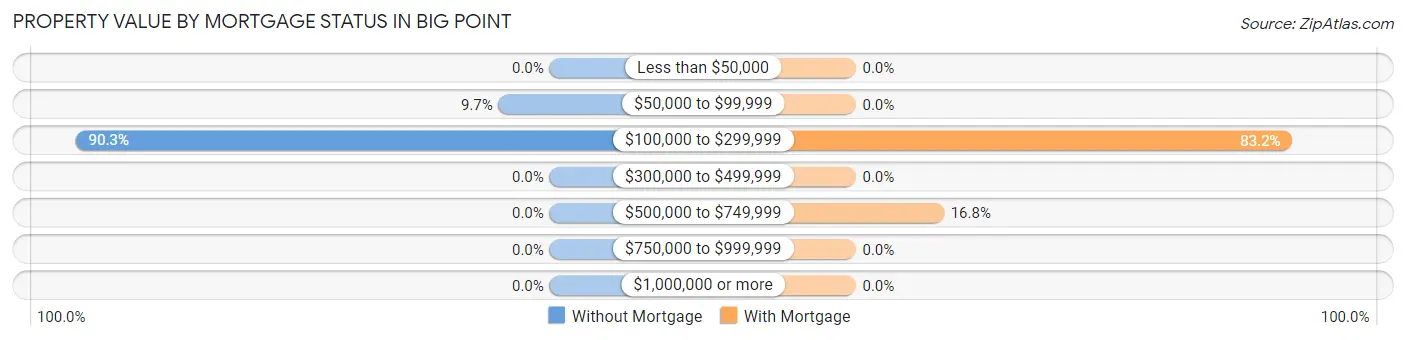
| Property Value | Without Mortgage | With Mortgage |
| Less than $50,000 | 0 (0.0%) | 0 (0.0%) |
| $50,000 to $99,999 | 14 (9.7%) | 0 (0.0%) |
| $100,000 to $299,999 | 130 (90.3%) | 104 (83.2%) |
| $300,000 to $499,999 | 0 (0.0%) | 0 (0.0%) |
| $500,000 to $749,999 | 0 (0.0%) | 21 (16.8%) |
| $750,000 to $999,999 | 0 (0.0%) | 0 (0.0%) |
| $1,000,000 or more | 0 (0.0%) | 0 (0.0%) |
| Total | 144 (100.0%) | 125 (100.0%) |
Household Income by Mortgage Status in Big Point
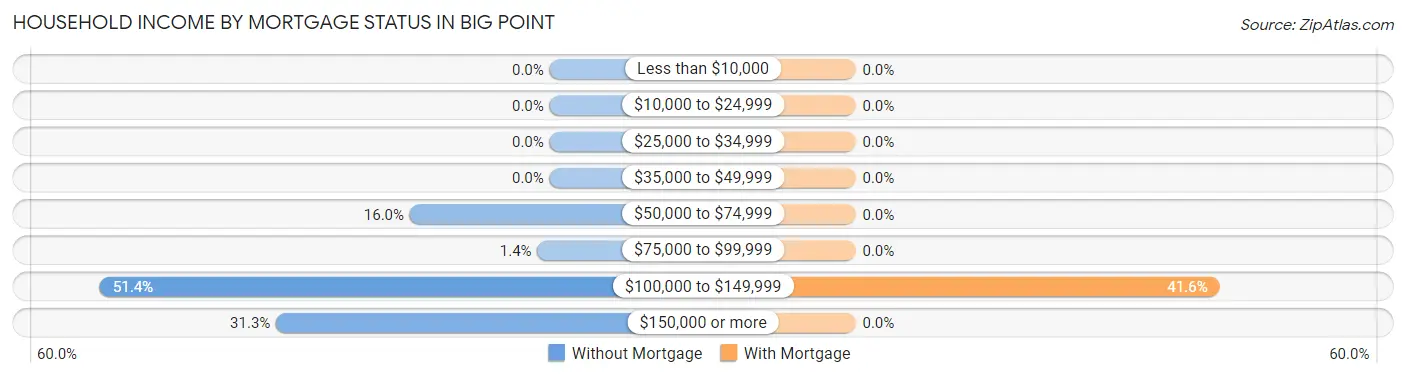
| Household Income | Without Mortgage | With Mortgage |
| Less than $10,000 | 0 (0.0%) | 0 (0.0%) |
| $10,000 to $24,999 | 0 (0.0%) | 0 (0.0%) |
| $25,000 to $34,999 | 0 (0.0%) | 0 (0.0%) |
| $35,000 to $49,999 | 0 (0.0%) | 0 (0.0%) |
| $50,000 to $74,999 | 23 (16.0%) | 0 (0.0%) |
| $75,000 to $99,999 | 2 (1.4%) | 0 (0.0%) |
| $100,000 to $149,999 | 74 (51.4%) | 52 (41.6%) |
| $150,000 or more | 45 (31.2%) | 0 (0.0%) |
| Total | 144 (100.0%) | 125 (100.0%) |
Property Value to Household Income Ratio in Big Point
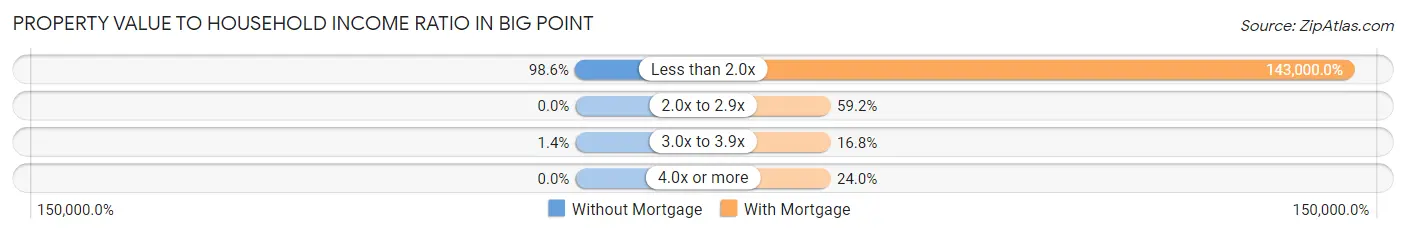
| Value-to-Income Ratio | Without Mortgage | With Mortgage |
| Less than 2.0x | 142 (98.6%) | 178,750 (143,000.0%) |
| 2.0x to 2.9x | 0 (0.0%) | 74 (59.2%) |
| 3.0x to 3.9x | 2 (1.4%) | 21 (16.8%) |
| 4.0x or more | 0 (0.0%) | 30 (24.0%) |
| Total | 144 (100.0%) | 125 (100.0%) |
Real Estate Taxes by Mortgage Status in Big Point
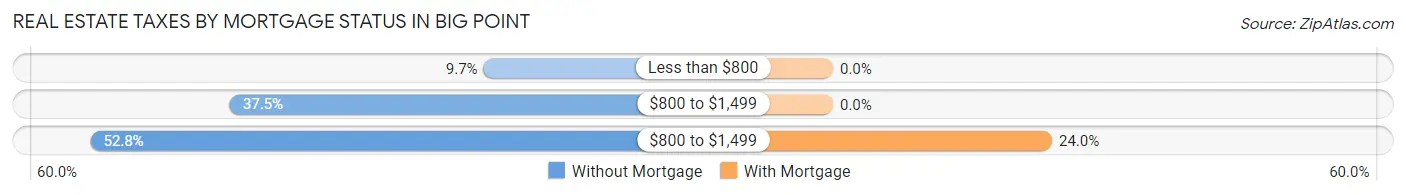
| Property Taxes | Without Mortgage | With Mortgage |
| Less than $800 | 14 (9.7%) | 0 (0.0%) |
| $800 to $1,499 | 54 (37.5%) | 0 (0.0%) |
| $800 to $1,499 | 76 (52.8%) | 30 (24.0%) |
| Total | 144 (100.0%) | 125 (100.0%) |
Health & Disability in Big Point
Health Insurance Coverage by Age in Big Point
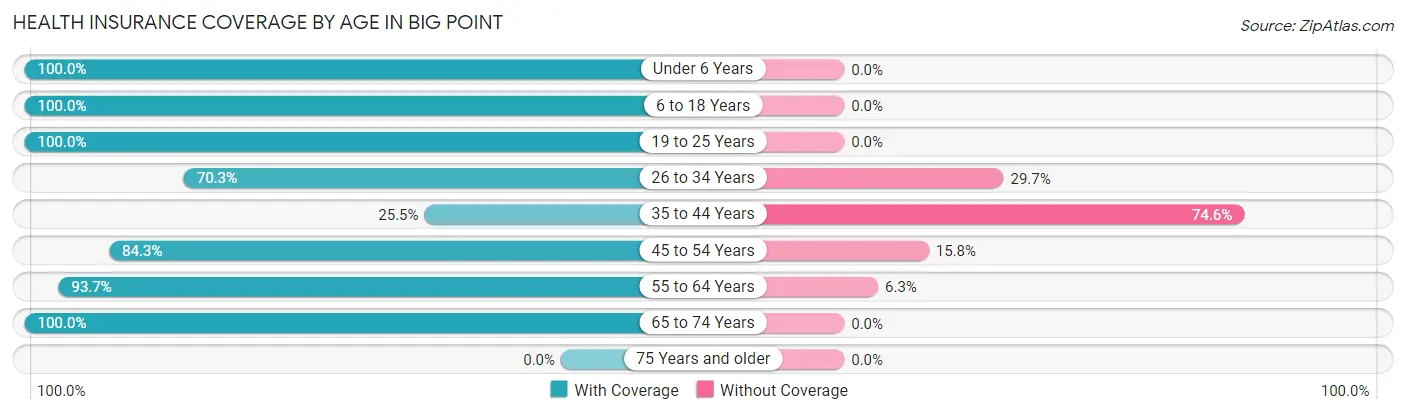
| Age Bracket | With Coverage | Without Coverage |
| Under 6 Years | 34 (100.0%) | 0 (0.0%) |
| 6 to 18 Years | 93 (100.0%) | 0 (0.0%) |
| 19 to 25 Years | 185 (100.0%) | 0 (0.0%) |
| 26 to 34 Years | 71 (70.3%) | 30 (29.7%) |
| 35 to 44 Years | 14 (25.5%) | 41 (74.6%) |
| 45 to 54 Years | 107 (84.3%) | 20 (15.8%) |
| 55 to 64 Years | 282 (93.7%) | 19 (6.3%) |
| 65 to 74 Years | 22 (100.0%) | 0 (0.0%) |
| 75 Years and older | 0 (0.0%) | 0 (0.0%) |
| Total | 808 (88.0%) | 110 (12.0%) |
Health Insurance Coverage by Citizenship Status in Big Point
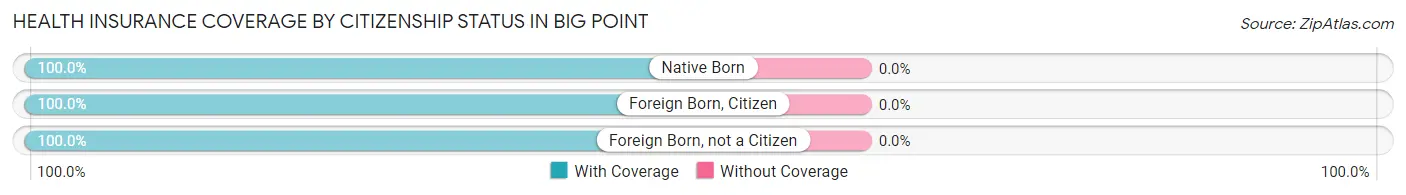
| Citizenship Status | With Coverage | Without Coverage |
| Native Born | 34 (100.0%) | 0 (0.0%) |
| Foreign Born, Citizen | 93 (100.0%) | 0 (0.0%) |
| Foreign Born, not a Citizen | 185 (100.0%) | 0 (0.0%) |
Health Insurance Coverage by Household Income in Big Point
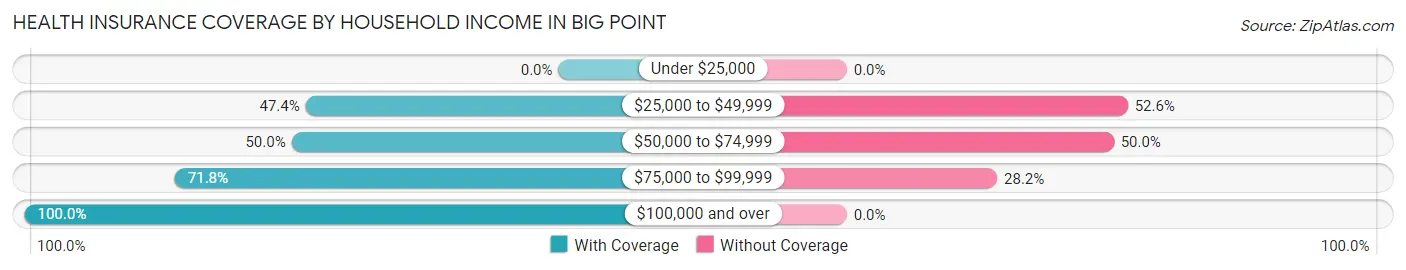
| Household Income | With Coverage | Without Coverage |
| Under $25,000 | 0 (0.0%) | 0 (0.0%) |
| $25,000 to $49,999 | 18 (47.4%) | 20 (52.6%) |
| $50,000 to $74,999 | 41 (50.0%) | 41 (50.0%) |
| $75,000 to $99,999 | 125 (71.8%) | 49 (28.2%) |
| $100,000 and over | 624 (100.0%) | 0 (0.0%) |
Public vs Private Health Insurance Coverage by Age in Big Point
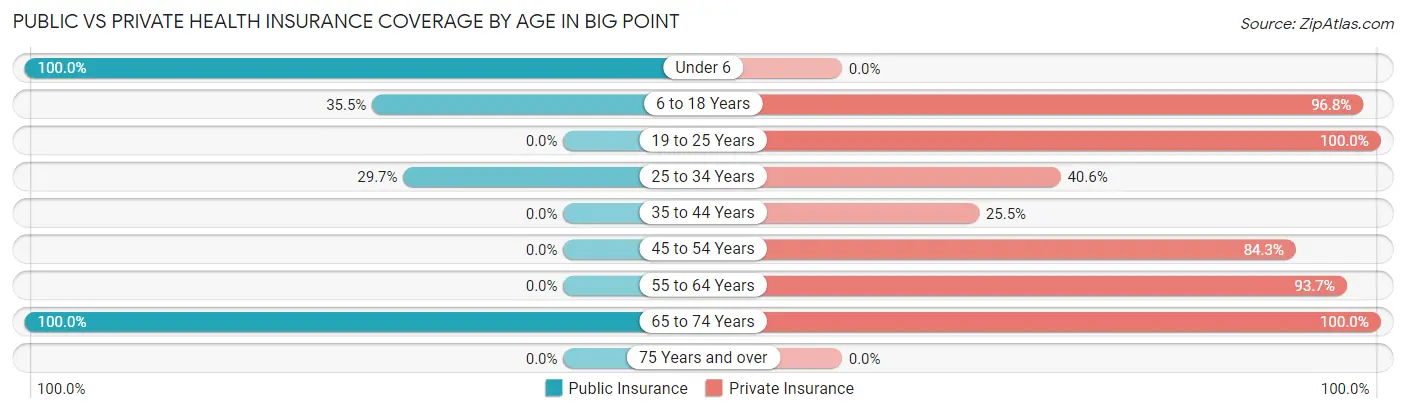
| Age Bracket | Public Insurance | Private Insurance |
| Under 6 | 34 (100.0%) | 0 (0.0%) |
| 6 to 18 Years | 33 (35.5%) | 90 (96.8%) |
| 19 to 25 Years | 0 (0.0%) | 185 (100.0%) |
| 25 to 34 Years | 30 (29.7%) | 41 (40.6%) |
| 35 to 44 Years | 0 (0.0%) | 14 (25.5%) |
| 45 to 54 Years | 0 (0.0%) | 107 (84.3%) |
| 55 to 64 Years | 0 (0.0%) | 282 (93.7%) |
| 65 to 74 Years | 22 (100.0%) | 22 (100.0%) |
| 75 Years and over | 0 (0.0%) | 0 (0.0%) |
| Total | 119 (13.0%) | 741 (80.7%) |
Disability Status by Sex by Age in Big Point
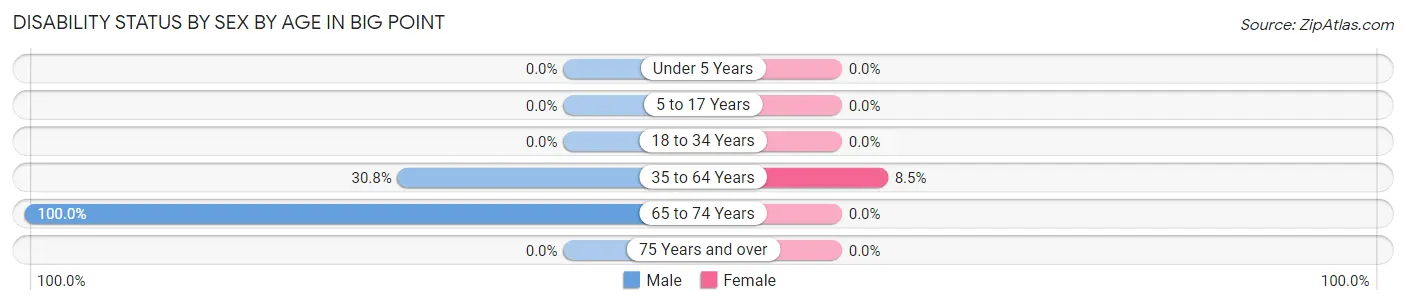
| Age Bracket | Male | Female |
| Under 5 Years | 0 (0.0%) | 0 (0.0%) |
| 5 to 17 Years | 0 (0.0%) | 0 (0.0%) |
| 18 to 34 Years | 0 (0.0%) | 0 (0.0%) |
| 35 to 64 Years | 80 (30.8%) | 19 (8.5%) |
| 65 to 74 Years | 22 (100.0%) | 0 (0.0%) |
| 75 Years and over | 0 (0.0%) | 0 (0.0%) |
Disability Class by Sex by Age in Big Point
Disability Class: Hearing Difficulty
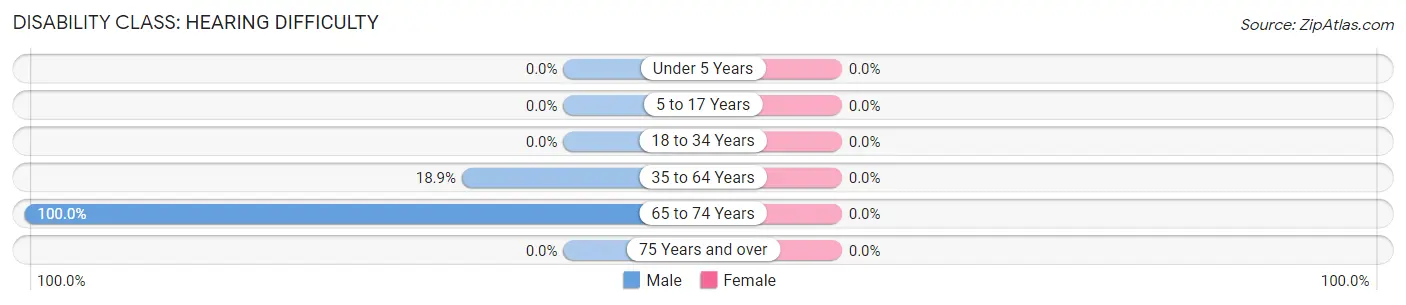
| Age Bracket | Male | Female |
| Under 5 Years | 0 (0.0%) | 0 (0.0%) |
| 5 to 17 Years | 0 (0.0%) | 0 (0.0%) |
| 18 to 34 Years | 0 (0.0%) | 0 (0.0%) |
| 35 to 64 Years | 49 (18.9%) | 0 (0.0%) |
| 65 to 74 Years | 22 (100.0%) | 0 (0.0%) |
| 75 Years and over | 0 (0.0%) | 0 (0.0%) |
Disability Class: Vision Difficulty
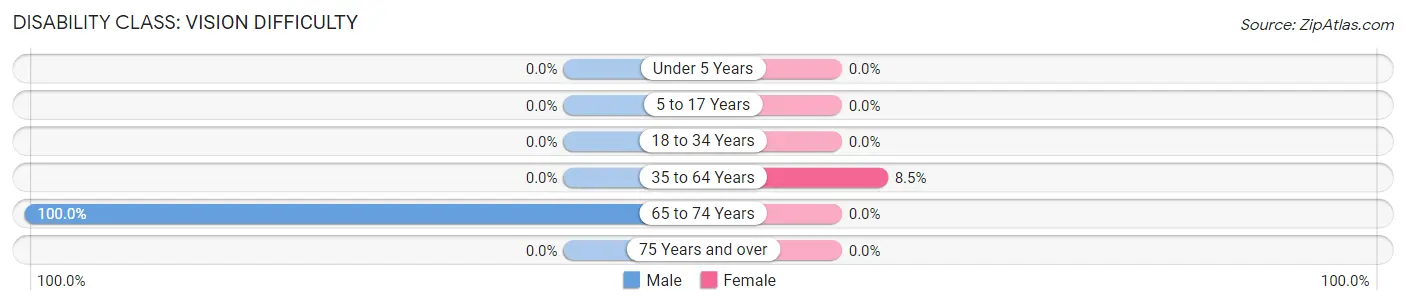
| Age Bracket | Male | Female |
| Under 5 Years | 0 (0.0%) | 0 (0.0%) |
| 5 to 17 Years | 0 (0.0%) | 0 (0.0%) |
| 18 to 34 Years | 0 (0.0%) | 0 (0.0%) |
| 35 to 64 Years | 0 (0.0%) | 19 (8.5%) |
| 65 to 74 Years | 22 (100.0%) | 0 (0.0%) |
| 75 Years and over | 0 (0.0%) | 0 (0.0%) |
Disability Class: Cognitive Difficulty
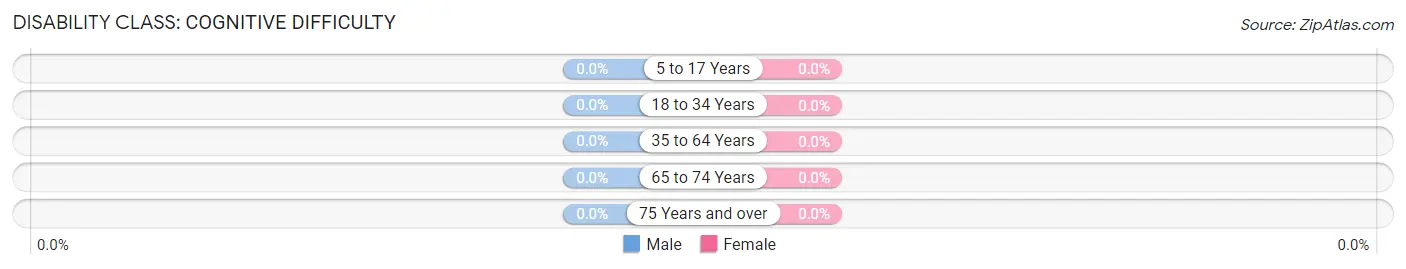
| Age Bracket | Male | Female |
| 5 to 17 Years | 0 (0.0%) | 0 (0.0%) |
| 18 to 34 Years | 0 (0.0%) | 0 (0.0%) |
| 35 to 64 Years | 0 (0.0%) | 0 (0.0%) |
| 65 to 74 Years | 0 (0.0%) | 0 (0.0%) |
| 75 Years and over | 0 (0.0%) | 0 (0.0%) |
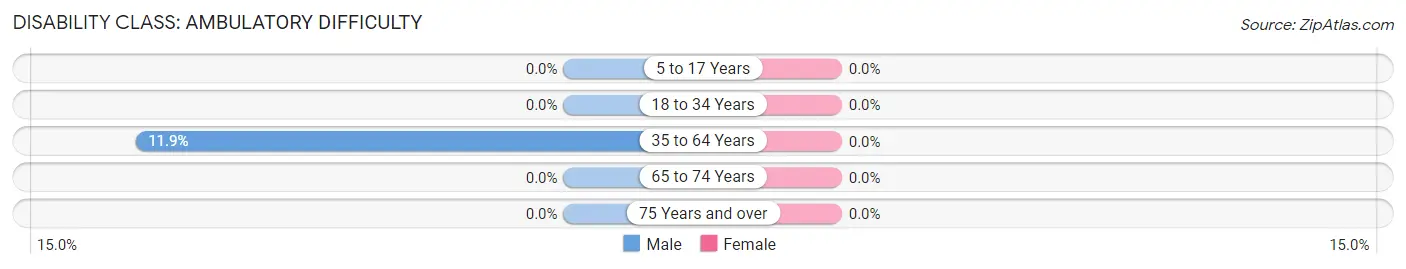
Disability Class: Ambulatory Difficulty
| Age Bracket | Male | Female |
| 5 to 17 Years | 0 (0.0%) | 0 (0.0%) |
| 18 to 34 Years | 0 (0.0%) | 0 (0.0%) |
| 35 to 64 Years | 31 (11.9%) | 0 (0.0%) |
| 65 to 74 Years | 0 (0.0%) | 0 (0.0%) |
| 75 Years and over | 0 (0.0%) | 0 (0.0%) |
Disability Class: Self-Care Difficulty
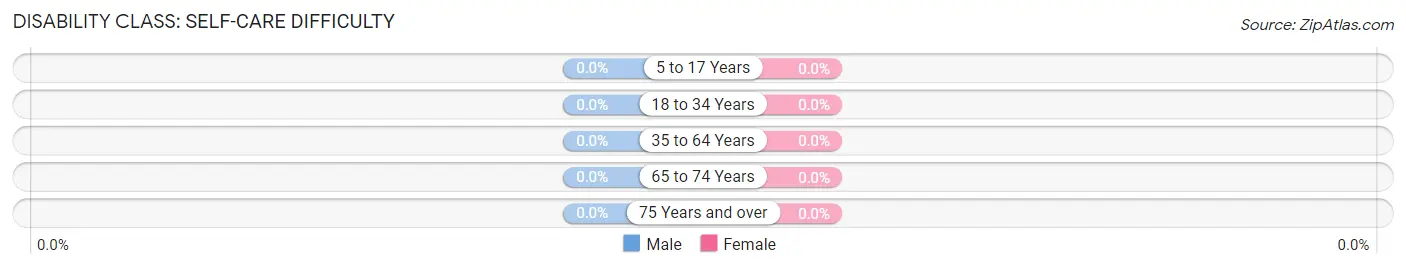
| Age Bracket | Male | Female |
| 5 to 17 Years | 0 (0.0%) | 0 (0.0%) |
| 18 to 34 Years | 0 (0.0%) | 0 (0.0%) |
| 35 to 64 Years | 0 (0.0%) | 0 (0.0%) |
| 65 to 74 Years | 0 (0.0%) | 0 (0.0%) |
| 75 Years and over | 0 (0.0%) | 0 (0.0%) |
Technology Access in Big Point
Computing Device Access in Big Point
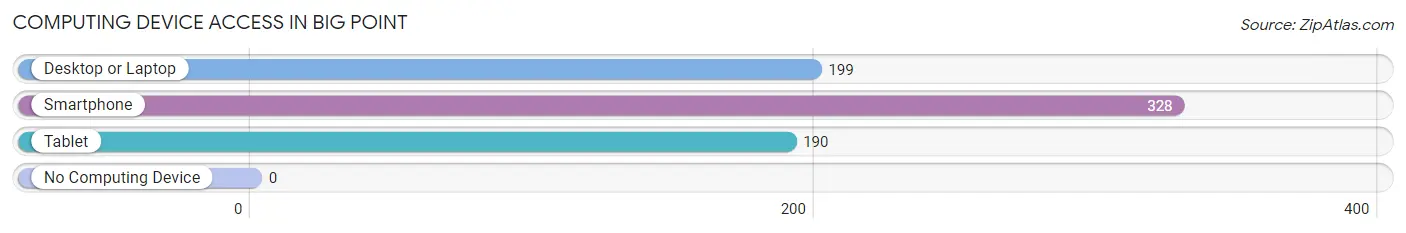
| Device Type | # Households | % Households |
| Desktop or Laptop | 199 | 60.7% |
| Smartphone | 328 | 100.0% |
| Tablet | 190 | 57.9% |
| No Computing Device | 0 | 0.0% |
| Total | 328 | 100.0% |
Internet Access in Big Point
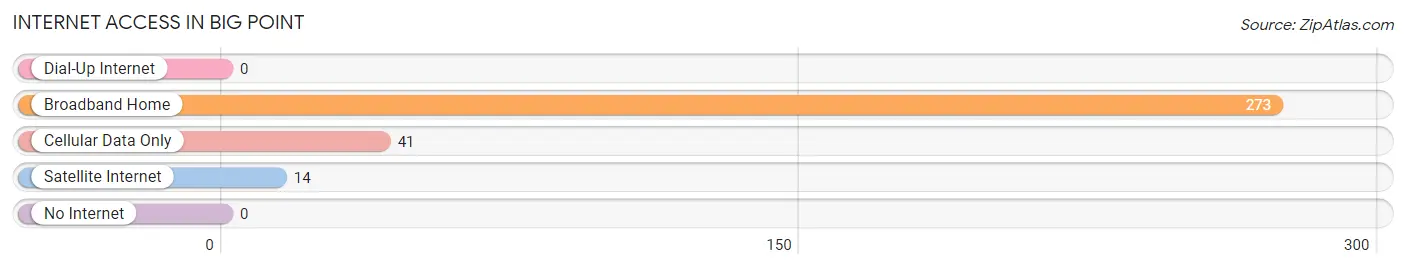
| Internet Type | # Households | % Households |
| Dial-Up Internet | 0 | 0.0% |
| Broadband Home | 273 | 83.2% |
| Cellular Data Only | 41 | 12.5% |
| Satellite Internet | 14 | 4.3% |
| No Internet | 0 | 0.0% |
| Total | 328 | 100.0% |
Big Point Summary
Big Point is a small unincorporated community located in Jackson County, Mississippi. It is situated on the western shore of the Pascagoula River, approximately 10 miles south of Pascagoula. The community is part of the Pascagoula-Moss Point Metropolitan Statistical Area.
History
Big Point was first settled in the early 1800s by French settlers. The area was originally known as “Pointe aux Pins”, which translates to “Point of Pines”. The name was changed to Big Point in the late 1800s when the area was developed as a lumber mill town. The lumber mill was owned by the Big Point Lumber Company, which operated until the early 1900s.
The town was incorporated in 1906 and the first mayor was J.W. Smith. The town was home to a post office, a general store, a school, and a few other businesses. The town was also home to a large African American population, many of whom worked in the lumber mill.
Geography
Big Point is located in Jackson County, Mississippi, on the western shore of the Pascagoula River. The town is situated approximately 10 miles south of Pascagoula and is part of the Pascagoula-Moss Point Metropolitan Statistical Area. The town is located in a rural area and is surrounded by forests and wetlands.
Economy
The economy of Big Point is largely based on agriculture and forestry. The town is home to several farms and ranches, as well as a few small businesses. The town is also home to a few small manufacturing companies.
Demographics
As of the 2010 census, the population of Big Point was 1,093. The racial makeup of the town was 79.3% White, 17.7% African American, 0.7% Native American, 0.3% Asian, 0.1% Pacific Islander, and 1.9% from other races. The median household income was $30,938 and the median family income was $37,813. The per capita income was $14,945.
Conclusion
Big Point is a small unincorporated community located in Jackson County, Mississippi. It is situated on the western shore of the Pascagoula River, approximately 10 miles south of Pascagoula. The town was first settled in the early 1800s and was originally known as “Pointe aux Pins”. The town was incorporated in 1906 and the economy is largely based on agriculture and forestry. As of the 2010 census, the population of Big Point was 1,093. The racial makeup of the town was 79.3% White, 17.7% African American, 0.7% Native American, 0.3% Asian, 0.1% Pacific Islander, and 1.9% from other races. The median household income was $30,938 and the median family income was $37,813. The per capita income was $14,945.
Common Questions
What is Per Capita Income in Big Point?
Per Capita income in Big Point is $60,236.
What is the Median Family Income in Big Point?
Median Family Income in Big Point is $111,639.
What is the Median Household income in Big Point?
Median Household Income in Big Point is $110,946.
What is Inequality or Gini Index in Big Point?
Inequality or Gini Index in Big Point is 0.42.
What is the Total Population of Big Point?
Total Population of Big Point is 918.
What is the Total Male Population of Big Point?
Total Male Population of Big Point is 580.
What is the Total Female Population of Big Point?
Total Female Population of Big Point is 338.
What is the Ratio of Males per 100 Females in Big Point?
There are 171.60 Males per 100 Females in Big Point.
What is the Ratio of Females per 100 Males in Big Point?
There are 58.28 Females per 100 Males in Big Point.
What is the Median Population Age in Big Point?
Median Population Age in Big Point is 44.8 Years.
What is the Average Family Size in Big Point
Average Family Size in Big Point is 2.8 People.
What is the Average Household Size in Big Point
Average Household Size in Big Point is 2.8 People.
How Large is the Labor Force in Big Point?
There are 732 People in the Labor Forcein in Big Point.
What is the Percentage of People in the Labor Force in Big Point?
87.7% of People are in the Labor Force in Big Point.
What is the Unemployment Rate in Big Point?
Unemployment Rate in Big Point is 8.6%.