Renova, MS Map & Demographics
Renova Map
Renova Overview
$15,930
PER CAPITA INCOME
$27,106
AVG FAMILY INCOME
$25,974
AVG HOUSEHOLD INCOME
11.7%
WAGE / INCOME GAP [ % ]
88.3¢/ $1
WAGE / INCOME GAP [ $ ]
0.47
INEQUALITY / GINI INDEX
1,008
TOTAL POPULATION
357
MALE POPULATION
651
FEMALE POPULATION
54.84
MALES / 100 FEMALES
182.35
FEMALES / 100 MALES
28.5
MEDIAN AGE
3.1
AVG FAMILY SIZE
2.3
AVG HOUSEHOLD SIZE
377
LABOR FORCE [ PEOPLE ]
56.8%
PERCENT IN LABOR FORCE
8.0%
UNEMPLOYMENT RATE
Income in Renova
Income Overview in Renova
Per Capita Income in Renova is $15,930, while median incomes of families and households are $27,106 and $25,974 respectively.
| Characteristic | Number | Measure |
| Per Capita Income | 1,008 | $15,930 |
| Median Family Income | 255 | $27,106 |
| Mean Family Income | 255 | $40,855 |
| Median Household Income | 442 | $25,974 |
| Mean Household Income | 442 | $35,919 |
| Income Deficit | 255 | $0 |
| Wage / Income Gap (%) | 1,008 | 11.71% |
| Wage / Income Gap ($) | 1,008 | 88.29¢ per $1 |
| Gini / Inequality Index | 1,008 | 0.47 |
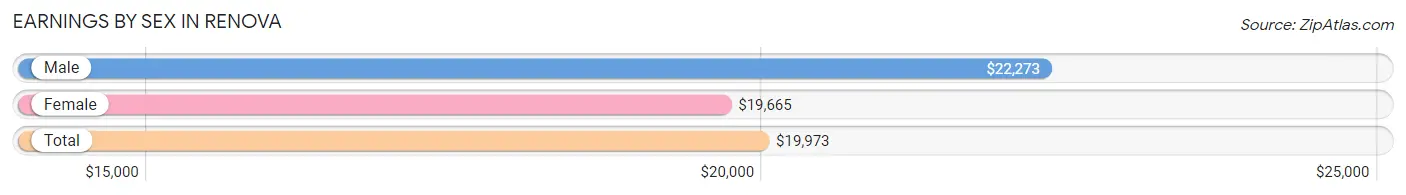
Earnings by Sex in Renova
Average Earnings in Renova are $19,973, $22,273 for men and $19,665 for women, a difference of 11.7%.
| Sex | Number | Average Earnings |
| Male | 122 (30.2%) | $22,273 |
| Female | 282 (69.8%) | $19,665 |
| Total | 404 (100.0%) | $19,973 |
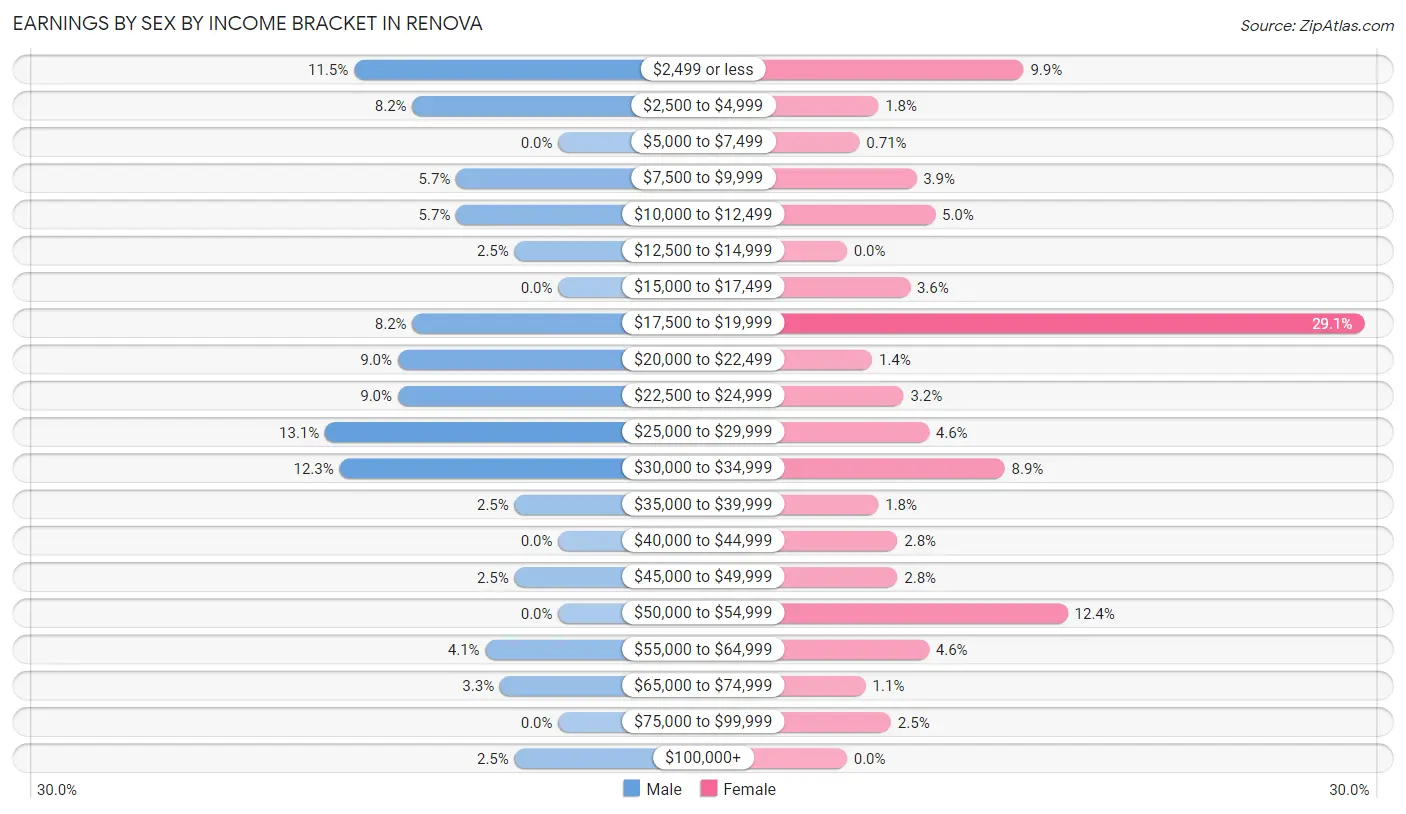
Earnings by Sex by Income Bracket in Renova
The most common earnings brackets in Renova are $25,000 to $29,999 for men (16 | 13.1%) and $17,500 to $19,999 for women (82 | 29.1%).
| Income | Male | Female |
| $2,499 or less | 14 (11.5%) | 28 (9.9%) |
| $2,500 to $4,999 | 10 (8.2%) | 5 (1.8%) |
| $5,000 to $7,499 | 0 (0.0%) | 2 (0.7%) |
| $7,500 to $9,999 | 7 (5.7%) | 11 (3.9%) |
| $10,000 to $12,499 | 7 (5.7%) | 14 (5.0%) |
| $12,500 to $14,999 | 3 (2.5%) | 0 (0.0%) |
| $15,000 to $17,499 | 0 (0.0%) | 10 (3.5%) |
| $17,500 to $19,999 | 10 (8.2%) | 82 (29.1%) |
| $20,000 to $22,499 | 11 (9.0%) | 4 (1.4%) |
| $22,500 to $24,999 | 11 (9.0%) | 9 (3.2%) |
| $25,000 to $29,999 | 16 (13.1%) | 13 (4.6%) |
| $30,000 to $34,999 | 15 (12.3%) | 25 (8.9%) |
| $35,000 to $39,999 | 3 (2.5%) | 5 (1.8%) |
| $40,000 to $44,999 | 0 (0.0%) | 8 (2.8%) |
| $45,000 to $49,999 | 3 (2.5%) | 8 (2.8%) |
| $50,000 to $54,999 | 0 (0.0%) | 35 (12.4%) |
| $55,000 to $64,999 | 5 (4.1%) | 13 (4.6%) |
| $65,000 to $74,999 | 4 (3.3%) | 3 (1.1%) |
| $75,000 to $99,999 | 0 (0.0%) | 7 (2.5%) |
| $100,000+ | 3 (2.5%) | 0 (0.0%) |
| Total | 122 (100.0%) | 282 (100.0%) |
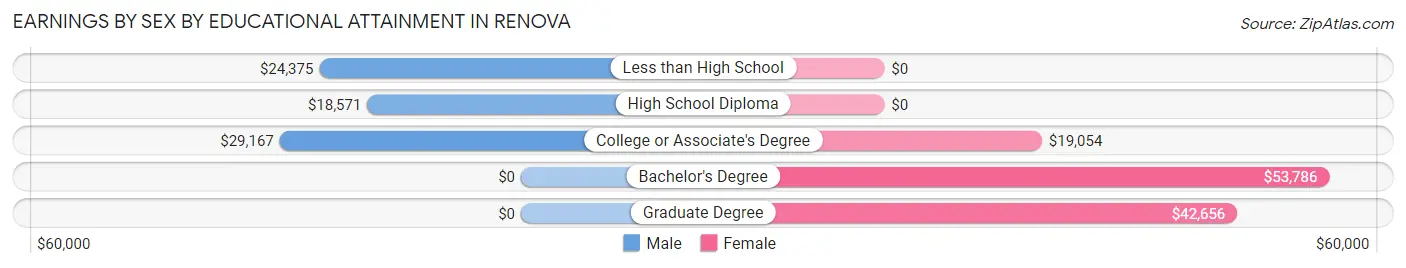
Earnings by Sex by Educational Attainment in Renova
Average earnings in Renova are $25,313 for men and $20,000 for women, a difference of 21.0%. Men with an educational attainment of college or associate's degree enjoy the highest average annual earnings of $29,167, while those with high school diploma education earn the least with $18,571. Women with an educational attainment of bachelor's degree earn the most with the average annual earnings of $53,786, while those with college or associate's degree education have the smallest earnings of $19,054.
| Educational Attainment | Male Income | Female Income |
| Less than High School | $24,375 | $0 |
| High School Diploma | $18,571 | $0 |
| College or Associate's Degree | $29,167 | $19,054 |
| Bachelor's Degree | - | - |
| Graduate Degree | - | - |
| Total | $25,313 | $20,000 |
Family Income in Renova
Family Income Brackets in Renova
According to the Renova family income data, there are 84 families falling into the $25,000 to $34,999 income range, which is the most common income bracket and makes up 32.9% of all families. Conversely, the $150,000 to $199,999 income bracket is the least frequent group with only 3 families (1.2%) belonging to this category.
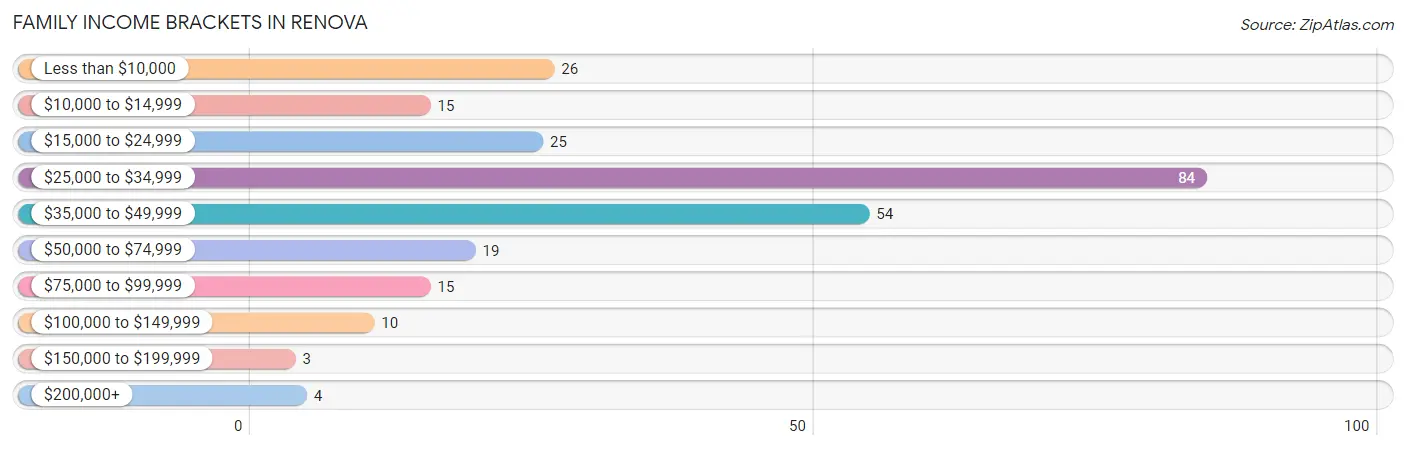
| Income Bracket | # Families | % Families |
| Less than $10,000 | 26 | 10.2% |
| $10,000 to $14,999 | 15 | 5.9% |
| $15,000 to $24,999 | 25 | 9.8% |
| $25,000 to $34,999 | 84 | 32.9% |
| $35,000 to $49,999 | 54 | 21.2% |
| $50,000 to $74,999 | 19 | 7.5% |
| $75,000 to $99,999 | 15 | 5.9% |
| $100,000 to $149,999 | 10 | 3.9% |
| $150,000 to $199,999 | 3 | 1.2% |
| $200,000+ | 4 | 1.6% |
Family Income by Famaliy Size in Renova
3-person families (90 | 35.3%) account for the highest median family income in Renova with $45,870 per family, while 2-person families (67 | 26.3%) have the highest median income of $22,875 per family member.
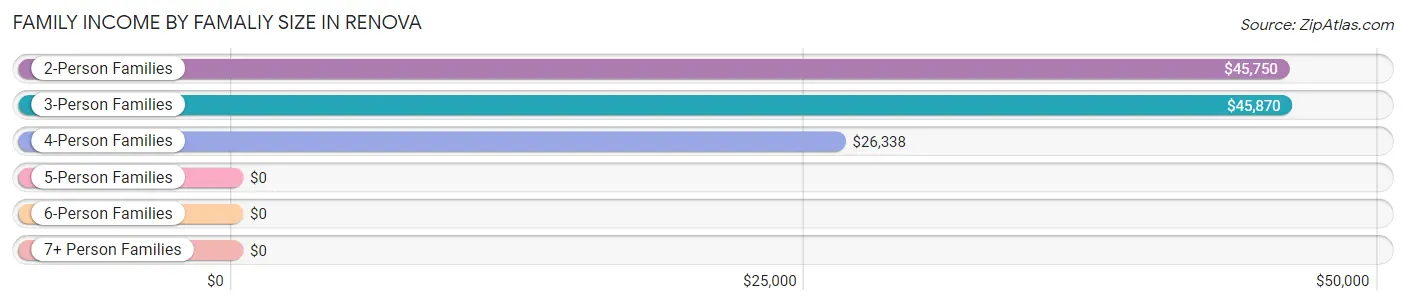
| Income Bracket | # Families | Median Income |
| 2-Person Families | 67 (26.3%) | $45,750 |
| 3-Person Families | 90 (35.3%) | $45,870 |
| 4-Person Families | 76 (29.8%) | $26,338 |
| 5-Person Families | 22 (8.6%) | $0 |
| 6-Person Families | 0 (0.0%) | $0 |
| 7+ Person Families | 0 (0.0%) | $0 |
| Total | 255 (100.0%) | $27,106 |
Family Income by Number of Earners in Renova
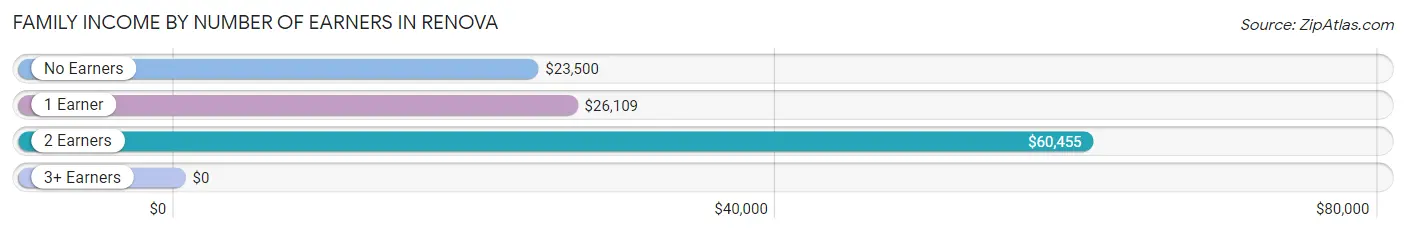
| Number of Earners | # Families | Median Income |
| No Earners | 18 (7.1%) | $23,500 |
| 1 Earner | 163 (63.9%) | $26,109 |
| 2 Earners | 72 (28.2%) | $60,455 |
| 3+ Earners | 2 (0.8%) | $0 |
| Total | 255 (100.0%) | $27,106 |
Household Income in Renova
Household Income Brackets in Renova
With 88 households falling in the category, the $25,000 to $34,999 income range is the most frequent in Renova, accounting for 19.9% of all households. In contrast, only 3 households (0.7%) fall into the $150,000 to $199,999 income bracket, making it the least populous group.
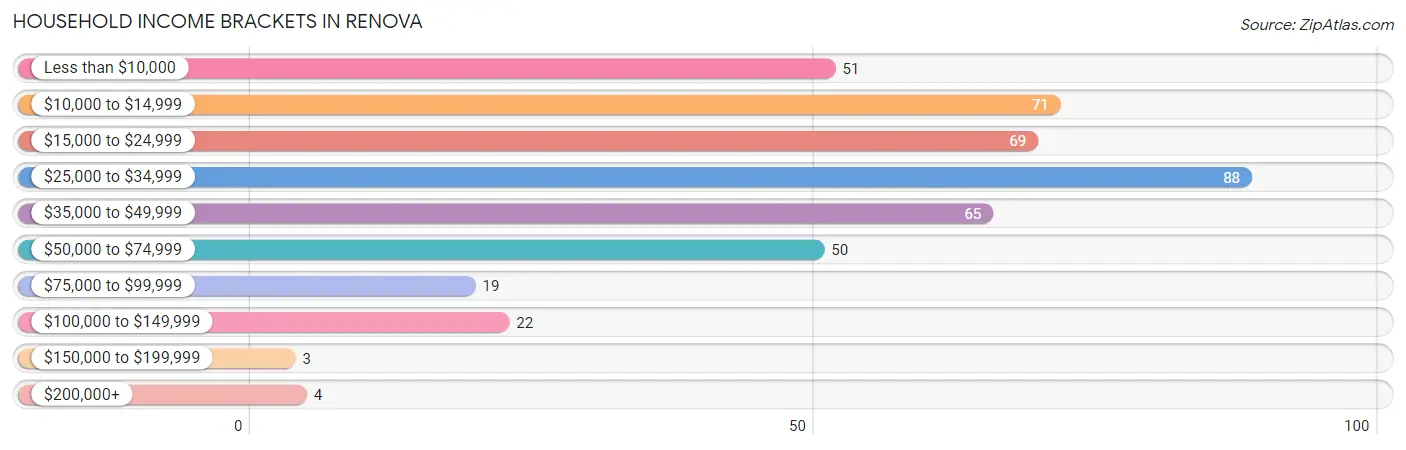
| Income Bracket | # Households | % Households |
| Less than $10,000 | 51 | 11.5% |
| $10,000 to $14,999 | 71 | 16.1% |
| $15,000 to $24,999 | 69 | 15.6% |
| $25,000 to $34,999 | 88 | 19.9% |
| $35,000 to $49,999 | 65 | 14.7% |
| $50,000 to $74,999 | 50 | 11.3% |
| $75,000 to $99,999 | 19 | 4.3% |
| $100,000 to $149,999 | 22 | 5.0% |
| $150,000 to $199,999 | 3 | 0.7% |
| $200,000+ | 4 | 0.9% |
Household Income by Householder Age in Renova
The median household income in Renova is $25,974, with the highest median household income of $48,625 found in the 45 to 64 years age bracket for the primary householder. A total of 115 households (26.0%) fall into this category. Meanwhile, the 15 to 24 years age bracket for the primary householder has the lowest median household income of $2,499, with 26 households (5.9%) in this group.
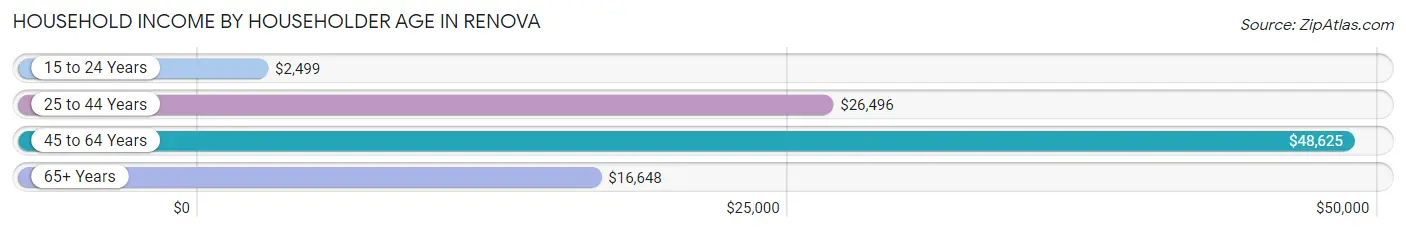
| Income Bracket | # Households | Median Income |
| 15 to 24 Years | 26 (5.9%) | $2,499 |
| 25 to 44 Years | 155 (35.1%) | $26,496 |
| 45 to 64 Years | 115 (26.0%) | $48,625 |
| 65+ Years | 146 (33.0%) | $16,648 |
| Total | 442 (100.0%) | $25,974 |
Poverty in Renova
Income Below Poverty by Sex and Age in Renova
With 45.9% poverty level for males and 59.8% for females among the residents of Renova, 15 year old males and 5 year old females are the most vulnerable to poverty, with 12 males (100.0%) and 8 females (100.0%) in their respective age groups living below the poverty level.
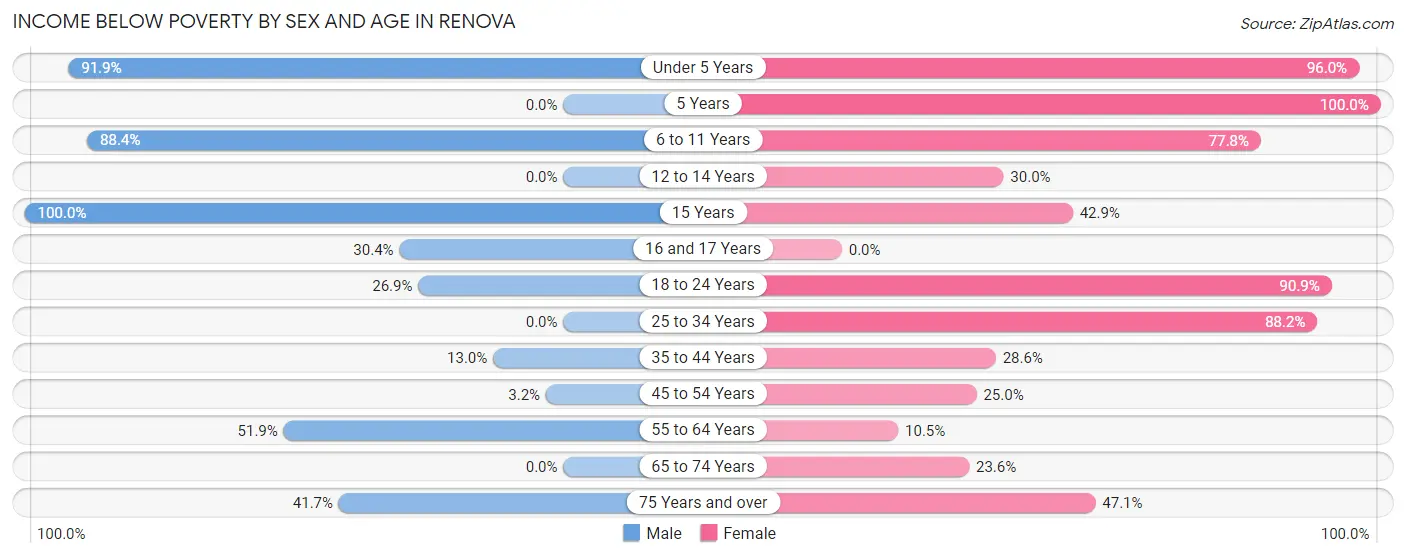
| Age Bracket | Male | Female |
| Under 5 Years | 34 (91.9%) | 167 (96.0%) |
| 5 Years | 0 (0.0%) | 8 (100.0%) |
| 6 to 11 Years | 61 (88.4%) | 21 (77.8%) |
| 12 to 14 Years | 0 (0.0%) | 3 (30.0%) |
| 15 Years | 12 (100.0%) | 3 (42.9%) |
| 16 and 17 Years | 7 (30.4%) | 0 (0.0%) |
| 18 to 24 Years | 14 (26.9%) | 30 (90.9%) |
| 25 to 34 Years | 0 (0.0%) | 90 (88.2%) |
| 35 to 44 Years | 3 (13.0%) | 18 (28.6%) |
| 45 to 54 Years | 1 (3.2%) | 4 (25.0%) |
| 55 to 64 Years | 27 (51.9%) | 7 (10.4%) |
| 65 to 74 Years | 0 (0.0%) | 30 (23.6%) |
| 75 Years and over | 5 (41.7%) | 8 (47.1%) |
| Total | 164 (45.9%) | 389 (59.8%) |
Income Above Poverty by Sex and Age in Renova
According to the poverty statistics in Renova, males aged 25 to 34 years and females aged 55 to 64 years are the age groups that are most secure financially, with 100.0% of males and 89.5% of females in these age groups living above the poverty line.
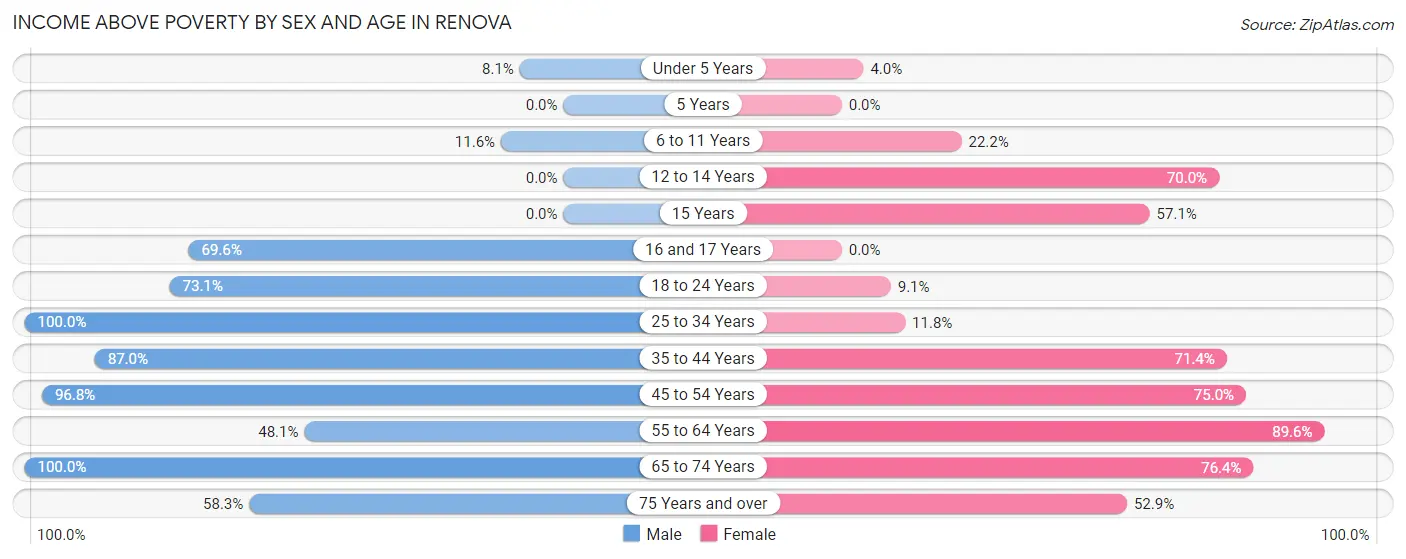
| Age Bracket | Male | Female |
| Under 5 Years | 3 (8.1%) | 7 (4.0%) |
| 5 Years | 0 (0.0%) | 0 (0.0%) |
| 6 to 11 Years | 8 (11.6%) | 6 (22.2%) |
| 12 to 14 Years | 0 (0.0%) | 7 (70.0%) |
| 15 Years | 0 (0.0%) | 4 (57.1%) |
| 16 and 17 Years | 16 (69.6%) | 0 (0.0%) |
| 18 to 24 Years | 38 (73.1%) | 3 (9.1%) |
| 25 to 34 Years | 22 (100.0%) | 12 (11.8%) |
| 35 to 44 Years | 20 (87.0%) | 45 (71.4%) |
| 45 to 54 Years | 30 (96.8%) | 12 (75.0%) |
| 55 to 64 Years | 25 (48.1%) | 60 (89.5%) |
| 65 to 74 Years | 24 (100.0%) | 97 (76.4%) |
| 75 Years and over | 7 (58.3%) | 9 (52.9%) |
| Total | 193 (54.1%) | 262 (40.3%) |
Income Below Poverty Among Married-Couple Families in Renova
The poverty statistics for married-couple families in Renova show that 5.3% or 4 of the total 76 families live below the poverty line. Families with 3 or 4 children have the highest poverty rate of 36.4%, comprising of 4 families. On the other hand, families with no children have the lowest poverty rate of 0.0%, which includes 0 families.
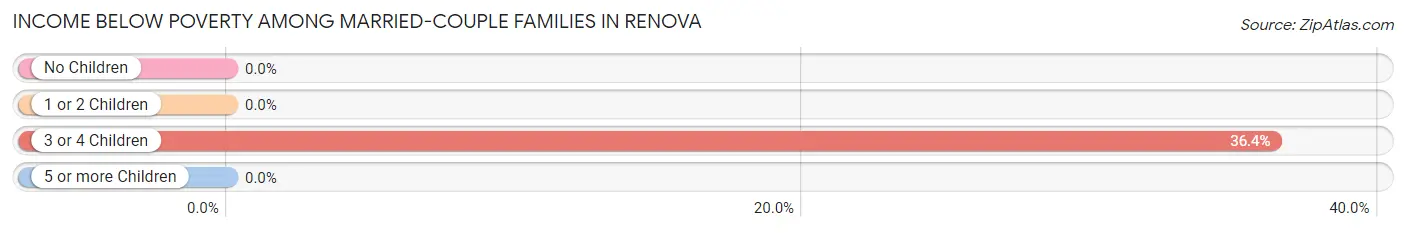
| Children | Above Poverty | Below Poverty |
| No Children | 40 (100.0%) | 0 (0.0%) |
| 1 or 2 Children | 25 (100.0%) | 0 (0.0%) |
| 3 or 4 Children | 7 (63.6%) | 4 (36.4%) |
| 5 or more Children | 0 (0.0%) | 0 (0.0%) |
| Total | 72 (94.7%) | 4 (5.3%) |
Income Below Poverty Among Single-Parent Households in Renova
According to the poverty data in Renova, 14.3% or 1 single-father households and 73.3% or 126 single-mother households are living below the poverty line. Among single-father households, those with no children have the highest poverty rate, with 1 households (33.3%) experiencing poverty. Likewise, among single-mother households, those with 3 or 4 children have the highest poverty rate, with 82 households (100.0%) falling below the poverty line.
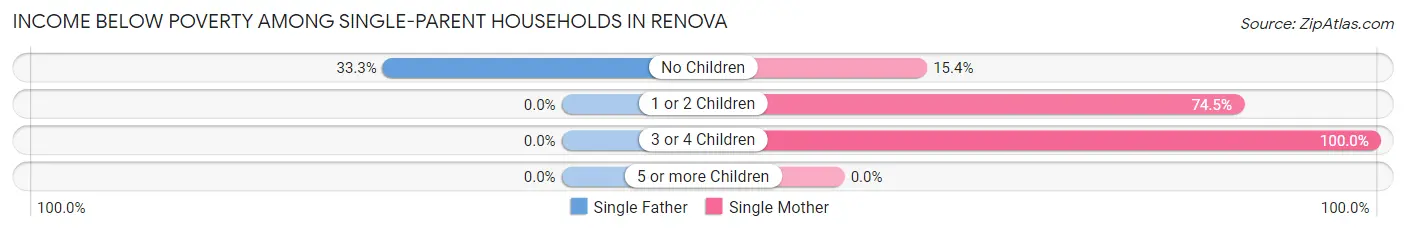
| Children | Single Father | Single Mother |
| No Children | 1 (33.3%) | 6 (15.4%) |
| 1 or 2 Children | 0 (0.0%) | 38 (74.5%) |
| 3 or 4 Children | 0 (0.0%) | 82 (100.0%) |
| 5 or more Children | 0 (0.0%) | 0 (0.0%) |
| Total | 1 (14.3%) | 126 (73.3%) |
Income Below Poverty Among Married-Couple vs Single-Parent Households in Renova
The poverty data for Renova shows that 4 of the married-couple family households (5.3%) and 127 of the single-parent households (71.0%) are living below the poverty level. Within the married-couple family households, those with 3 or 4 children have the highest poverty rate, with 4 households (36.4%) falling below the poverty line. Among the single-parent households, those with 3 or 4 children have the highest poverty rate, with 82 household (100.0%) living below poverty.
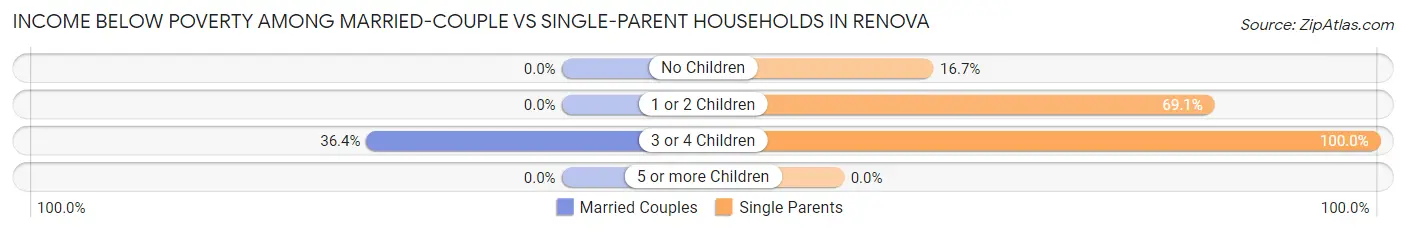
| Children | Married-Couple Families | Single-Parent Households |
| No Children | 0 (0.0%) | 7 (16.7%) |
| 1 or 2 Children | 0 (0.0%) | 38 (69.1%) |
| 3 or 4 Children | 4 (36.4%) | 82 (100.0%) |
| 5 or more Children | 0 (0.0%) | 0 (0.0%) |
| Total | 4 (5.3%) | 127 (71.0%) |
Race in Renova
The most populous races in Renova are Black / African American (982 | 97.4%), Hispanic or Latino (16 | 1.6%), and Some other Race (16 | 1.6%).
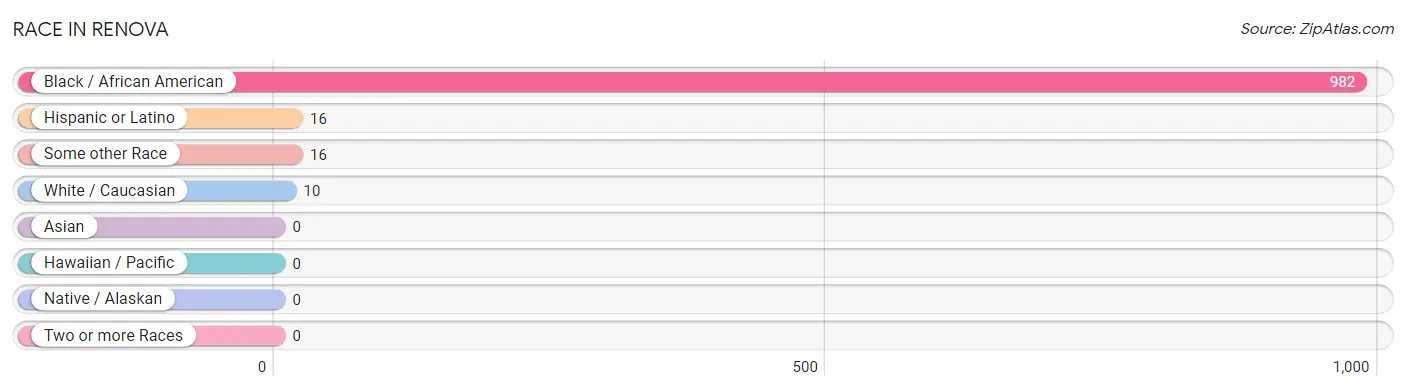
| Race | # Population | % Population |
| Asian | 0 | 0.0% |
| Black / African American | 982 | 97.4% |
| Hawaiian / Pacific | 0 | 0.0% |
| Hispanic or Latino | 16 | 1.6% |
| Native / Alaskan | 0 | 0.0% |
| White / Caucasian | 10 | 1.0% |
| Two or more Races | 0 | 0.0% |
| Some other Race | 16 | 1.6% |
| Total | 1,008 | 100.0% |
Ancestry in Renova
The most populous ancestries reported in Renova are American (57 | 5.7%), Mexican (16 | 1.6%), African (9 | 0.9%), Subsaharan African (9 | 0.9%), and French Canadian (5 | 0.5%), together accounting for 9.5% of all Renova residents.
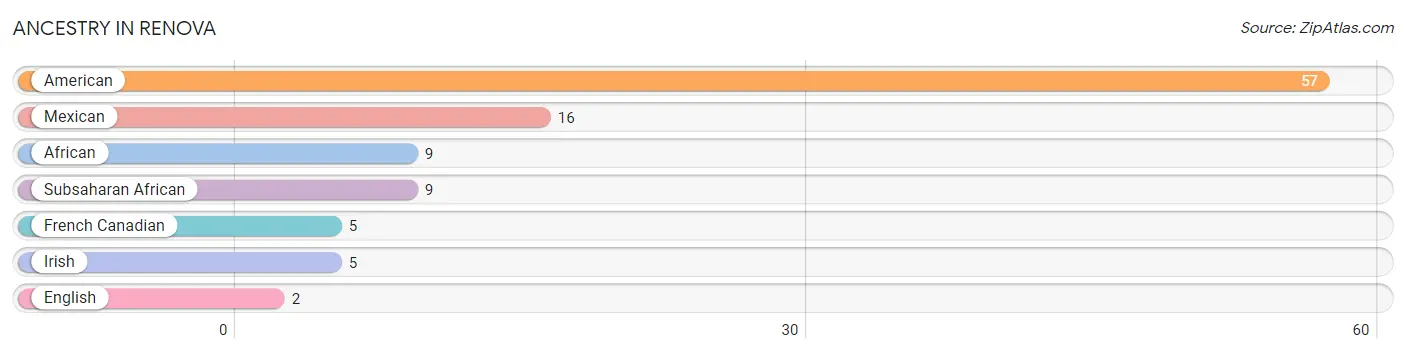
| Ancestry | # Population | % Population |
| African | 9 | 0.9% |
| American | 57 | 5.7% |
| English | 2 | 0.2% |
| French Canadian | 5 | 0.5% |
| Irish | 5 | 0.5% |
| Mexican | 16 | 1.6% |
| Subsaharan African | 9 | 0.9% | View All 7 Rows |
Immigrants in Renova
The most numerous immigrant groups reported in Renova came from Central America (16 | 1.6%), Latin America (16 | 1.6%), and Mexico (16 | 1.6%), together accounting for 4.8% of all Renova residents.
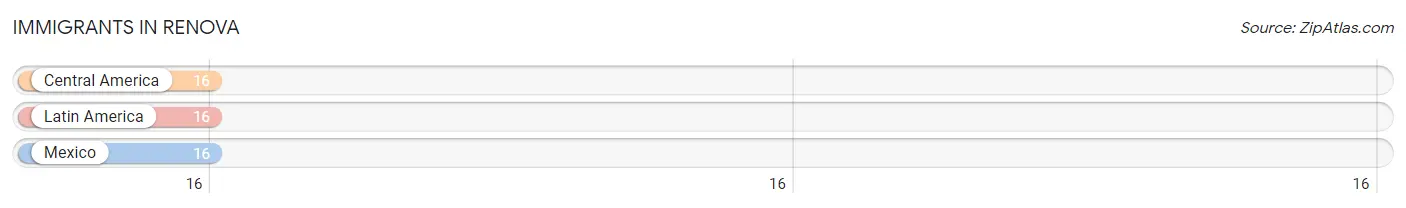
| Immigration Origin | # Population | % Population |
| Central America | 16 | 1.6% |
| Latin America | 16 | 1.6% |
| Mexico | 16 | 1.6% | View All 3 Rows |
Sex and Age in Renova
Sex and Age in Renova
The most populous age groups in Renova are 15 to 19 Years (71 | 19.9%) for men and Under 5 Years (174 | 26.7%) for women.
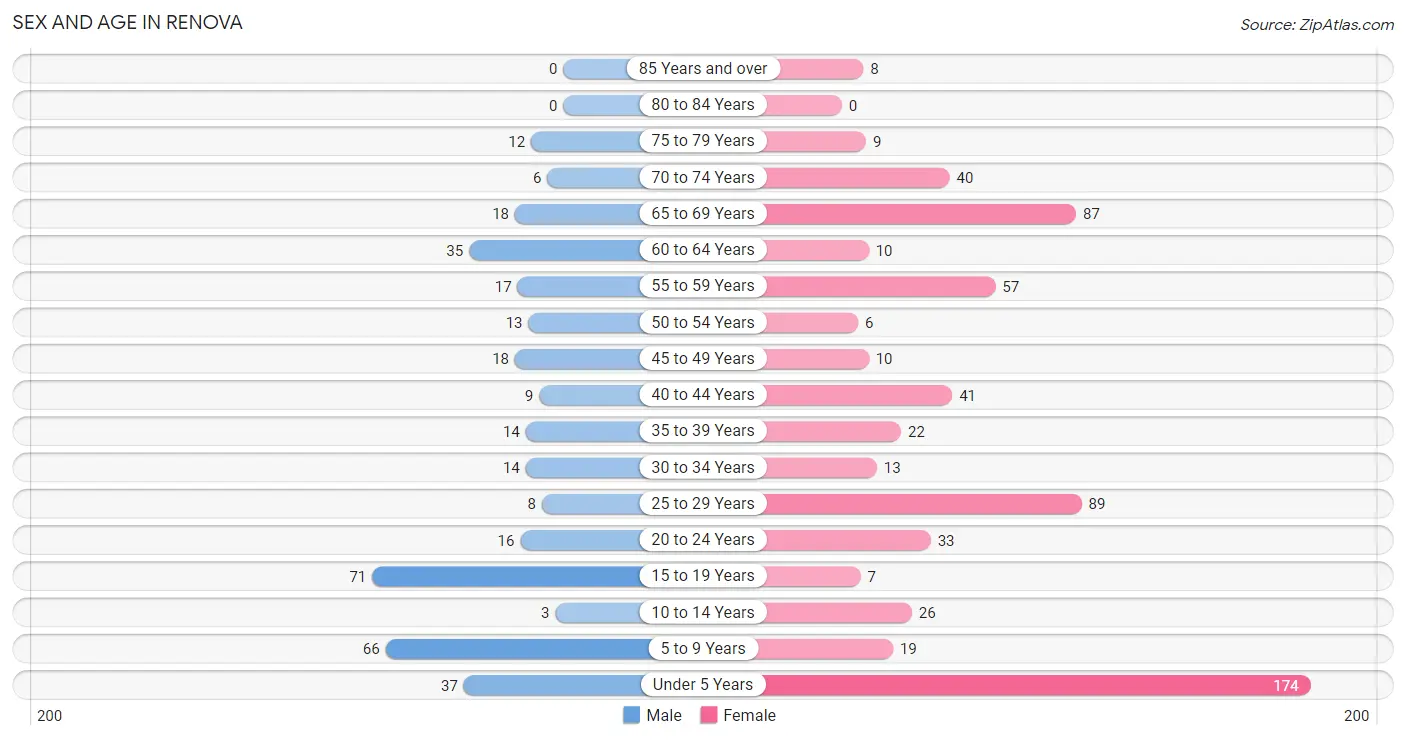
| Age Bracket | Male | Female |
| Under 5 Years | 37 (10.4%) | 174 (26.7%) |
| 5 to 9 Years | 66 (18.5%) | 19 (2.9%) |
| 10 to 14 Years | 3 (0.8%) | 26 (4.0%) |
| 15 to 19 Years | 71 (19.9%) | 7 (1.1%) |
| 20 to 24 Years | 16 (4.5%) | 33 (5.1%) |
| 25 to 29 Years | 8 (2.2%) | 89 (13.7%) |
| 30 to 34 Years | 14 (3.9%) | 13 (2.0%) |
| 35 to 39 Years | 14 (3.9%) | 22 (3.4%) |
| 40 to 44 Years | 9 (2.5%) | 41 (6.3%) |
| 45 to 49 Years | 18 (5.0%) | 10 (1.5%) |
| 50 to 54 Years | 13 (3.6%) | 6 (0.9%) |
| 55 to 59 Years | 17 (4.8%) | 57 (8.8%) |
| 60 to 64 Years | 35 (9.8%) | 10 (1.5%) |
| 65 to 69 Years | 18 (5.0%) | 87 (13.4%) |
| 70 to 74 Years | 6 (1.7%) | 40 (6.1%) |
| 75 to 79 Years | 12 (3.4%) | 9 (1.4%) |
| 80 to 84 Years | 0 (0.0%) | 0 (0.0%) |
| 85 Years and over | 0 (0.0%) | 8 (1.2%) |
| Total | 357 (100.0%) | 651 (100.0%) |
Families and Households in Renova
Median Family Size in Renova
The median family size in Renova is 3.14 persons per family, with single female/mother families (172 | 67.4%) accounting for the largest median family size of 3.27 persons per family. On the other hand, single male/father families (7 | 2.8%) represent the smallest median family size with 2.57 persons per family.
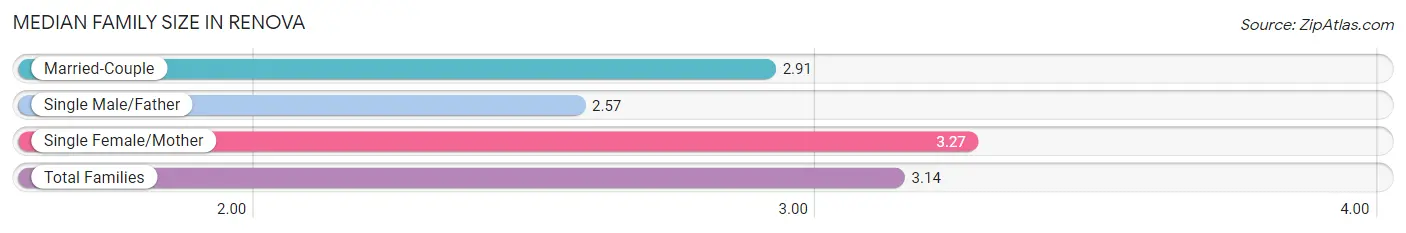
| Family Type | # Families | Family Size |
| Married-Couple | 76 (29.8%) | 2.91 |
| Single Male/Father | 7 (2.8%) | 2.57 |
| Single Female/Mother | 172 (67.4%) | 3.27 |
| Total Families | 255 (100.0%) | 3.14 |
Median Household Size in Renova
The median household size in Renova is 2.28 persons per household, with single female/mother households (172 | 38.9%) accounting for the largest median household size of 3.32 persons per household. non-family households (187 | 42.3%) represent the smallest median household size with 1.04 persons per household.
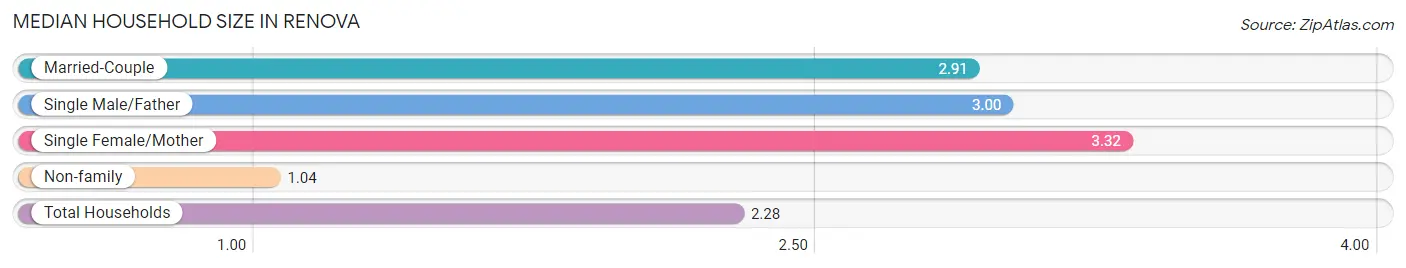
| Household Type | # Households | Household Size |
| Married-Couple | 76 (17.2%) | 2.91 |
| Single Male/Father | 7 (1.6%) | 3.00 |
| Single Female/Mother | 172 (38.9%) | 3.32 |
| Non-family | 187 (42.3%) | 1.04 |
| Total Households | 442 (100.0%) | 2.28 |
Household Size by Marriage Status in Renova
Out of a total of 442 households in Renova, 255 (57.7%) are family households, while 187 (42.3%) are nonfamily households. The most numerous type of family households are 3-person households, comprising 100, and the most common type of nonfamily households are 1-person households, comprising 179.
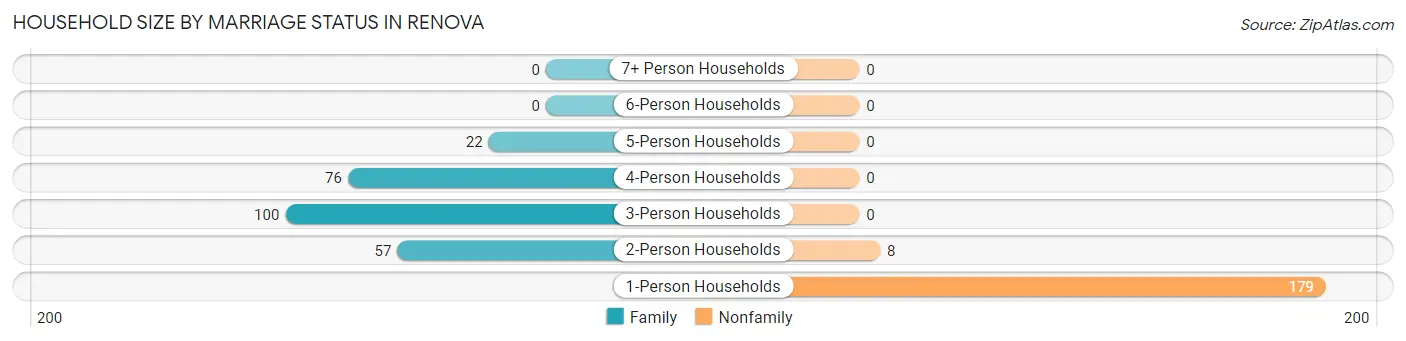
| Household Size | Family Households | Nonfamily Households |
| 1-Person Households | - | 179 (40.5%) |
| 2-Person Households | 57 (12.9%) | 8 (1.8%) |
| 3-Person Households | 100 (22.6%) | 0 (0.0%) |
| 4-Person Households | 76 (17.2%) | 0 (0.0%) |
| 5-Person Households | 22 (5.0%) | 0 (0.0%) |
| 6-Person Households | 0 (0.0%) | 0 (0.0%) |
| 7+ Person Households | 0 (0.0%) | 0 (0.0%) |
| Total | 255 (57.7%) | 187 (42.3%) |
Female Fertility in Renova
Fertility by Age in Renova
| Age Bracket | Women with Births | Births / 1,000 Women |
| 15 to 19 years | 0 (0.0%) | 0.0 |
| 20 to 34 years | 0 (0.0%) | 0.0 |
| 35 to 50 years | 0 (0.0%) | 0.0 |
| Total | 0 (0.0%) | 0.0 |
Fertility by Age by Marriage Status in Renova
| Age Bracket | Married | Unmarried |
| 15 to 19 years | 0 (0.0%) | 0 (0.0%) |
| 20 to 34 years | 0 (0.0%) | 0 (0.0%) |
| 35 to 50 years | 0 (0.0%) | 0 (0.0%) |
| Total | 0 (0.0%) | 0 (0.0%) |
Fertility by Education in Renova
| Educational Attainment | Women with Births | Births / 1,000 Women |
| Less than High School | 0 (0.0%) | 0.0 |
| High School Diploma | 0 (0.0%) | 0.0 |
| College or Associate's Degree | 0 (0.0%) | 0.0 |
| Bachelor's Degree | 0 (0.0%) | 0.0 |
| Graduate Degree | 0 (0.0%) | 0.0 |
| Total | 0 (0.0%) | 0.0 |
Fertility by Education by Marriage Status in Renova
| Educational Attainment | Married | Unmarried |
| Less than High School | 0 (0.0%) | 0 (0.0%) |
| High School Diploma | 0 (0.0%) | 0 (0.0%) |
| College or Associate's Degree | 0 (0.0%) | 0 (0.0%) |
| Bachelor's Degree | 0 (0.0%) | 0 (0.0%) |
| Graduate Degree | 0 (0.0%) | 0 (0.0%) |
| Total | 0 (0.0%) | 0 (0.0%) |
Employment Characteristics in Renova
Employment by Class of Employer in Renova
Among the 347 employed individuals in Renova, private company employees (196 | 56.5%), state government employees (60 | 17.3%), and local government employees (45 | 13.0%) make up the most common classes of employment.
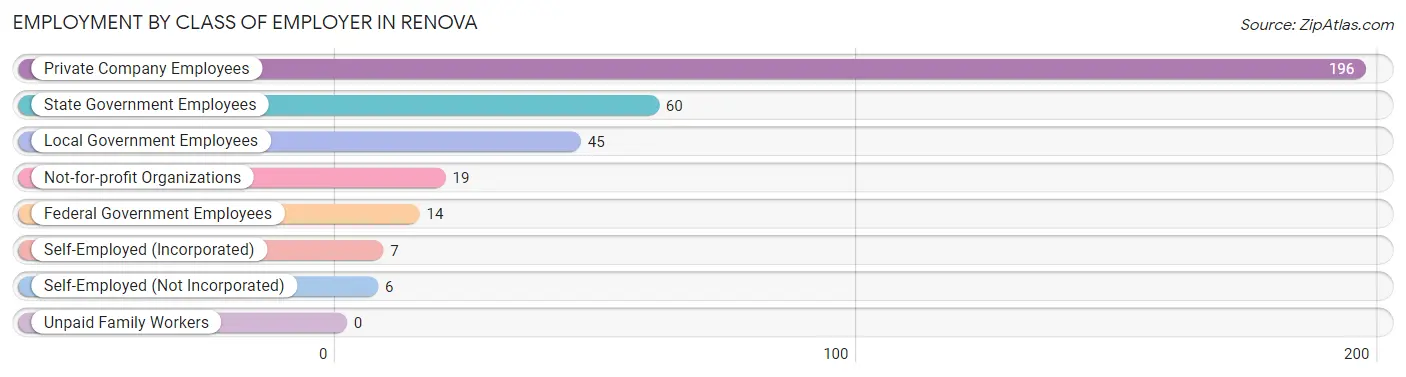
| Employer Class | # Employees | % Employees |
| Private Company Employees | 196 | 56.5% |
| Self-Employed (Incorporated) | 7 | 2.0% |
| Self-Employed (Not Incorporated) | 6 | 1.7% |
| Not-for-profit Organizations | 19 | 5.5% |
| Local Government Employees | 45 | 13.0% |
| State Government Employees | 60 | 17.3% |
| Federal Government Employees | 14 | 4.0% |
| Unpaid Family Workers | 0 | 0.0% |
| Total | 347 | 100.0% |
Employment Status by Age in Renova
According to the labor force statistics for Renova, out of the total population over 16 years of age (664), 56.8% or 377 individuals are in the labor force, with 8.0% or 30 of them unemployed. The age group with the highest labor force participation rate is 25 to 29 years, with 92.8% or 90 individuals in the labor force. Within the labor force, the 16 to 19 years age range has the highest percentage of unemployed individuals, with 46.2% or 12 of them being unemployed.
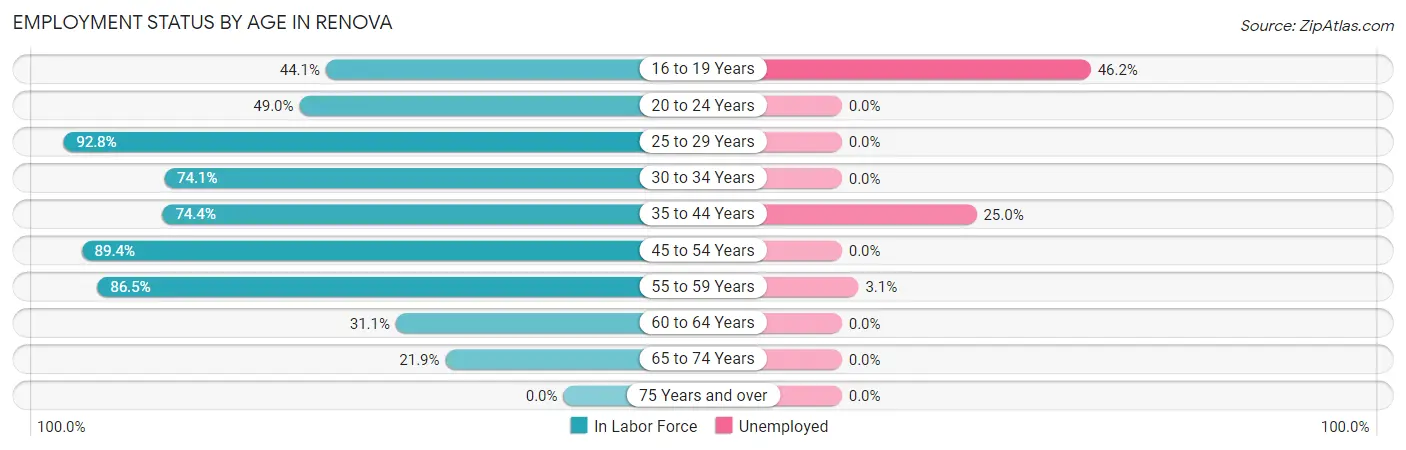
| Age Bracket | In Labor Force | Unemployed |
| 16 to 19 Years | 26 (44.1%) | 12 (46.2%) |
| 20 to 24 Years | 24 (49.0%) | 0 (0.0%) |
| 25 to 29 Years | 90 (92.8%) | 0 (0.0%) |
| 30 to 34 Years | 20 (74.1%) | 0 (0.0%) |
| 35 to 44 Years | 64 (74.4%) | 16 (25.0%) |
| 45 to 54 Years | 42 (89.4%) | 0 (0.0%) |
| 55 to 59 Years | 64 (86.5%) | 2 (3.1%) |
| 60 to 64 Years | 14 (31.1%) | 0 (0.0%) |
| 65 to 74 Years | 33 (21.9%) | 0 (0.0%) |
| 75 Years and over | 0 (0.0%) | 0 (0.0%) |
| Total | 377 (56.8%) | 30 (8.0%) |
Employment Status by Educational Attainment in Renova
According to labor force statistics for Renova, 78.2% of individuals (294) out of the total population between 25 and 64 years of age (376) are in the labor force, with 6.1% or 18 of them being unemployed. The group with the highest labor force participation rate are those with the educational attainment of bachelor's degree or higher, with 96.2% or 75 individuals in the labor force. Within the labor force, individuals with high school diploma education have the highest percentage of unemployment, with 16.9% or 11 of them being unemployed.
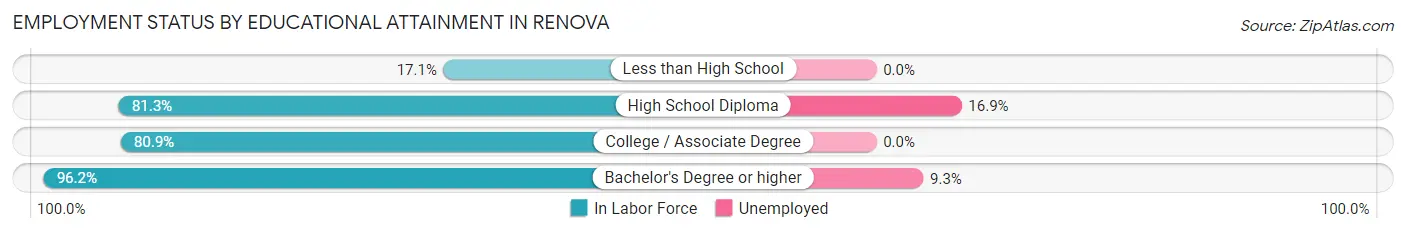
| Educational Attainment | In Labor Force | Unemployed |
| Less than High School | 6 (17.1%) | 0 (0.0%) |
| High School Diploma | 65 (81.3%) | 14 (16.9%) |
| College / Associate Degree | 148 (80.9%) | 0 (0.0%) |
| Bachelor's Degree or higher | 75 (96.2%) | 7 (9.3%) |
| Total | 294 (78.2%) | 23 (6.1%) |
Employment Occupations by Sex in Renova
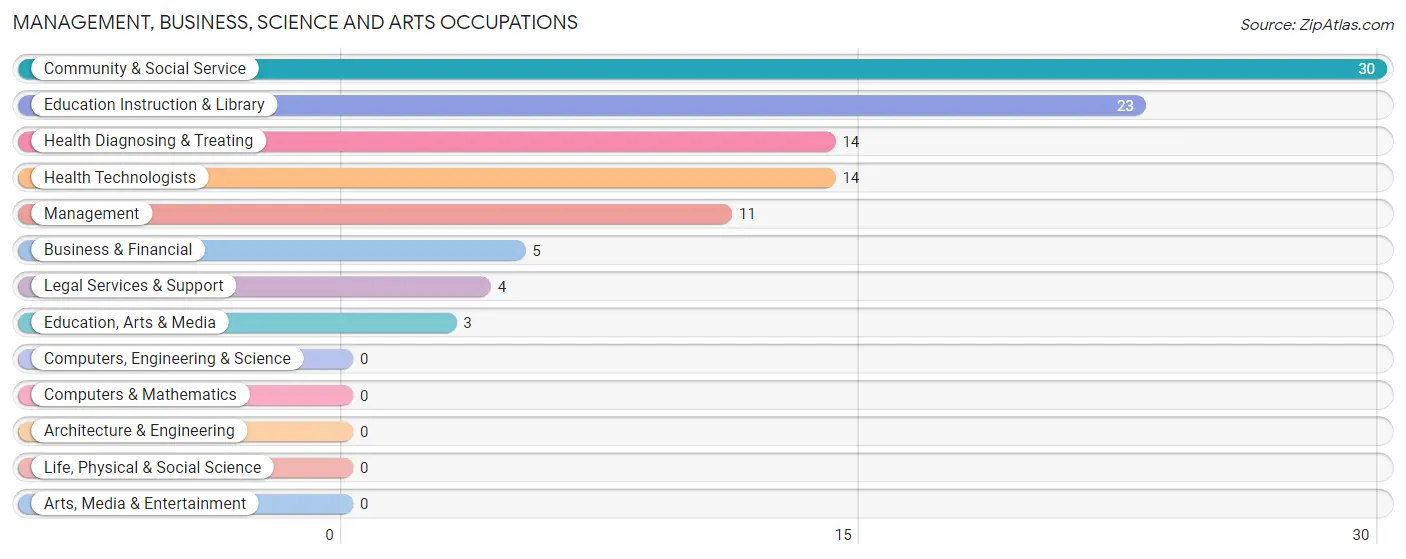
Management, Business, Science and Arts Occupations
The most common Management, Business, Science and Arts occupations in Renova are Community & Social Service (30 | 8.6%), Education Instruction & Library (23 | 6.6%), Health Diagnosing & Treating (14 | 4.0%), Health Technologists (14 | 4.0%), and Management (11 | 3.2%).
Management, Business, Science and Arts Occupations by Sex
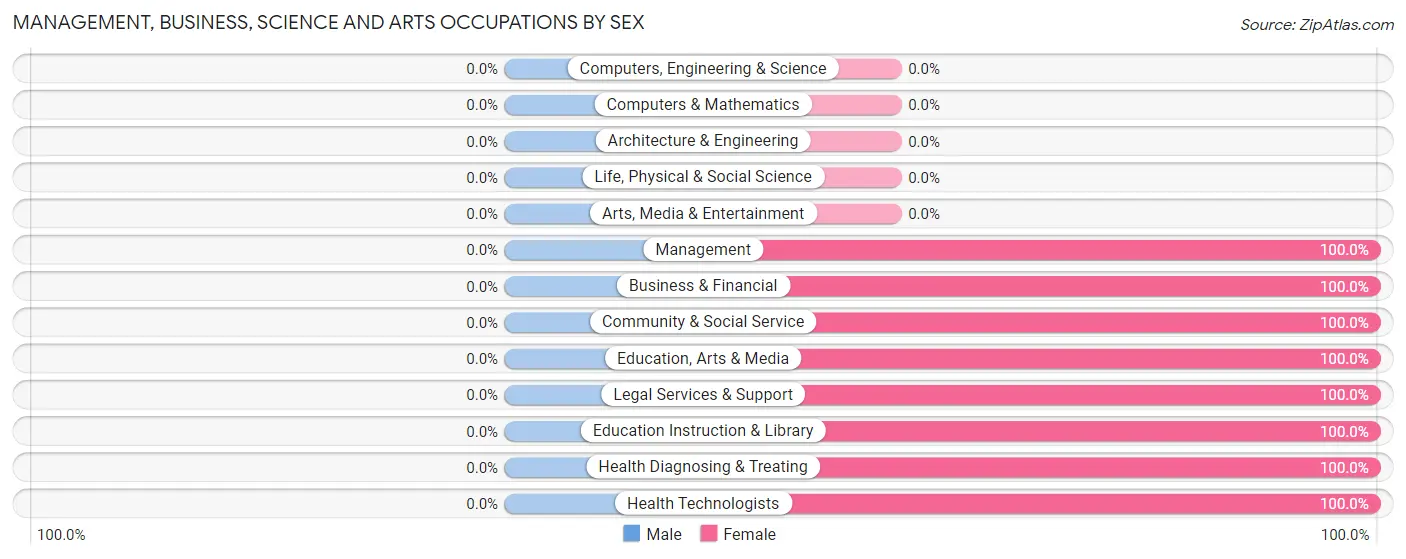
| Occupation | Male | Female |
| Management | 0 (0.0%) | 11 (100.0%) |
| Business & Financial | 0 (0.0%) | 5 (100.0%) |
| Computers, Engineering & Science | 0 (0.0%) | 0 (0.0%) |
| Computers & Mathematics | 0 (0.0%) | 0 (0.0%) |
| Architecture & Engineering | 0 (0.0%) | 0 (0.0%) |
| Life, Physical & Social Science | 0 (0.0%) | 0 (0.0%) |
| Community & Social Service | 0 (0.0%) | 30 (100.0%) |
| Education, Arts & Media | 0 (0.0%) | 3 (100.0%) |
| Legal Services & Support | 0 (0.0%) | 4 (100.0%) |
| Education Instruction & Library | 0 (0.0%) | 23 (100.0%) |
| Arts, Media & Entertainment | 0 (0.0%) | 0 (0.0%) |
| Health Diagnosing & Treating | 0 (0.0%) | 14 (100.0%) |
| Health Technologists | 0 (0.0%) | 14 (100.0%) |
| Total (Category) | 0 (0.0%) | 60 (100.0%) |
| Total (Overall) | 90 (25.9%) | 257 (74.1%) |
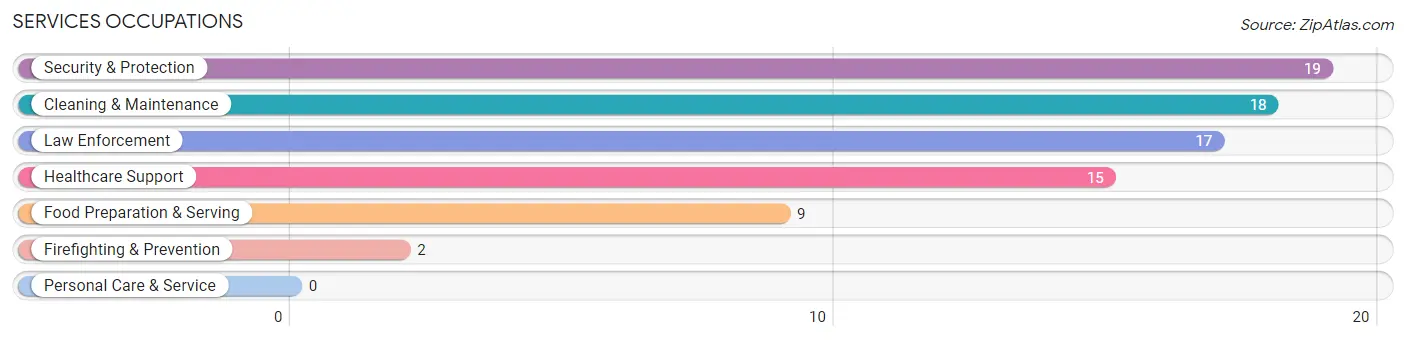
Services Occupations
The most common Services occupations in Renova are Security & Protection (19 | 5.5%), Cleaning & Maintenance (18 | 5.2%), Law Enforcement (17 | 4.9%), Healthcare Support (15 | 4.3%), and Food Preparation & Serving (9 | 2.6%).
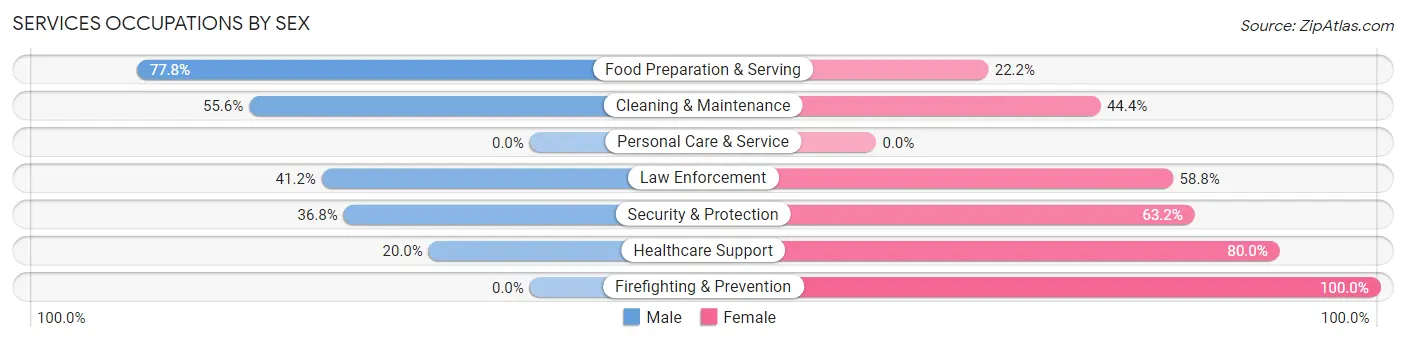
Services Occupations by Sex
Within the Services occupations in Renova, the most male-oriented occupations are Food Preparation & Serving (77.8%), Cleaning & Maintenance (55.6%), and Law Enforcement (41.2%), while the most female-oriented occupations are Firefighting & Prevention (100.0%), Healthcare Support (80.0%), and Security & Protection (63.2%).
| Occupation | Male | Female |
| Healthcare Support | 3 (20.0%) | 12 (80.0%) |
| Security & Protection | 7 (36.8%) | 12 (63.2%) |
| Firefighting & Prevention | 0 (0.0%) | 2 (100.0%) |
| Law Enforcement | 7 (41.2%) | 10 (58.8%) |
| Food Preparation & Serving | 7 (77.8%) | 2 (22.2%) |
| Cleaning & Maintenance | 10 (55.6%) | 8 (44.4%) |
| Personal Care & Service | 0 (0.0%) | 0 (0.0%) |
| Total (Category) | 27 (44.3%) | 34 (55.7%) |
| Total (Overall) | 90 (25.9%) | 257 (74.1%) |
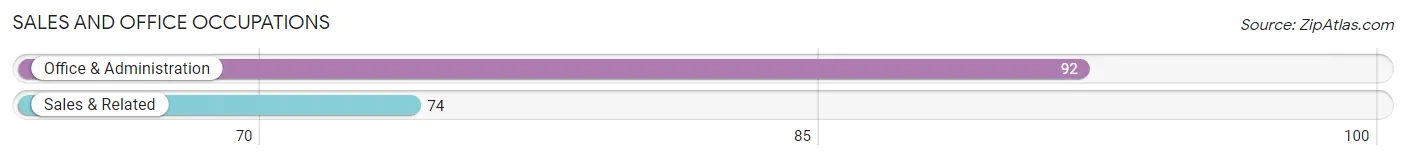
Sales and Office Occupations
The most common Sales and Office occupations in Renova are Office & Administration (92 | 26.5%), and Sales & Related (74 | 21.3%).
Sales and Office Occupations by Sex
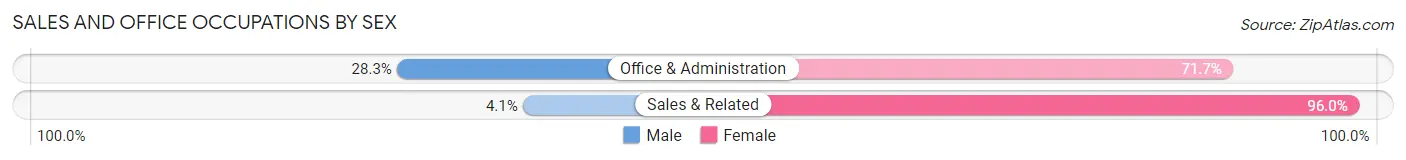
| Occupation | Male | Female |
| Sales & Related | 3 (4.1%) | 71 (96.0%) |
| Office & Administration | 26 (28.3%) | 66 (71.7%) |
| Total (Category) | 29 (17.5%) | 137 (82.5%) |
| Total (Overall) | 90 (25.9%) | 257 (74.1%) |
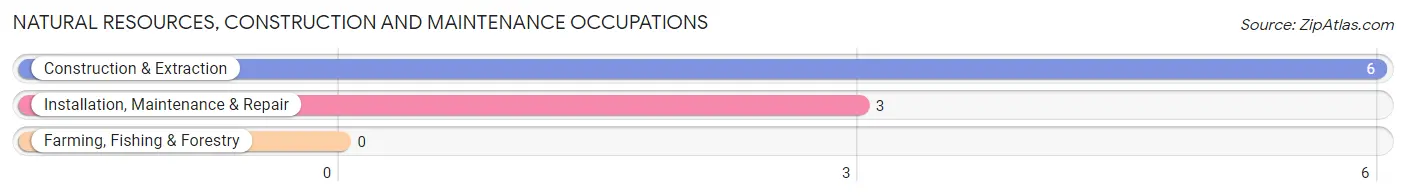
Natural Resources, Construction and Maintenance Occupations
The most common Natural Resources, Construction and Maintenance occupations in Renova are Construction & Extraction (6 | 1.7%), and Installation, Maintenance & Repair (3 | 0.9%).
Natural Resources, Construction and Maintenance Occupations by Sex
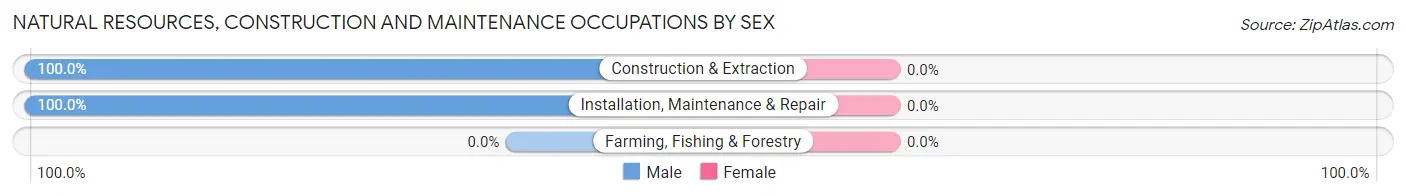
| Occupation | Male | Female |
| Farming, Fishing & Forestry | 0 (0.0%) | 0 (0.0%) |
| Construction & Extraction | 6 (100.0%) | 0 (0.0%) |
| Installation, Maintenance & Repair | 3 (100.0%) | 0 (0.0%) |
| Total (Category) | 9 (100.0%) | 0 (0.0%) |
| Total (Overall) | 90 (25.9%) | 257 (74.1%) |
Production, Transportation and Moving Occupations
The most common Production, Transportation and Moving occupations in Renova are Material Moving (30 | 8.6%), Production (18 | 5.2%), and Transportation (3 | 0.9%).
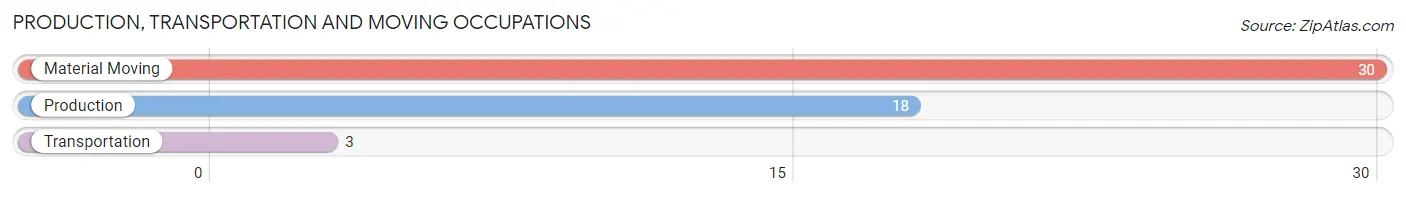
Production, Transportation and Moving Occupations by Sex
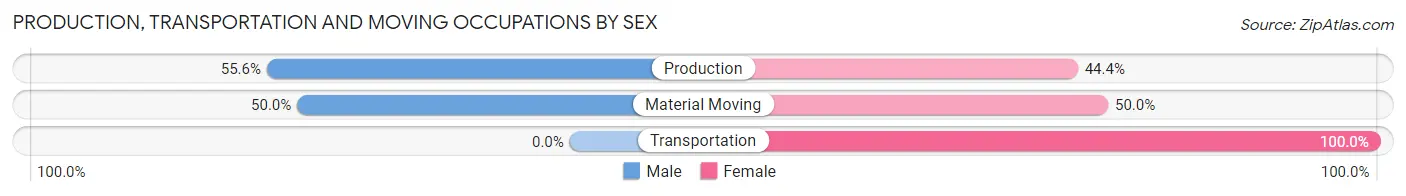
| Occupation | Male | Female |
| Production | 10 (55.6%) | 8 (44.4%) |
| Transportation | 0 (0.0%) | 3 (100.0%) |
| Material Moving | 15 (50.0%) | 15 (50.0%) |
| Total (Category) | 25 (49.0%) | 26 (51.0%) |
| Total (Overall) | 90 (25.9%) | 257 (74.1%) |
Employment Industries by Sex in Renova
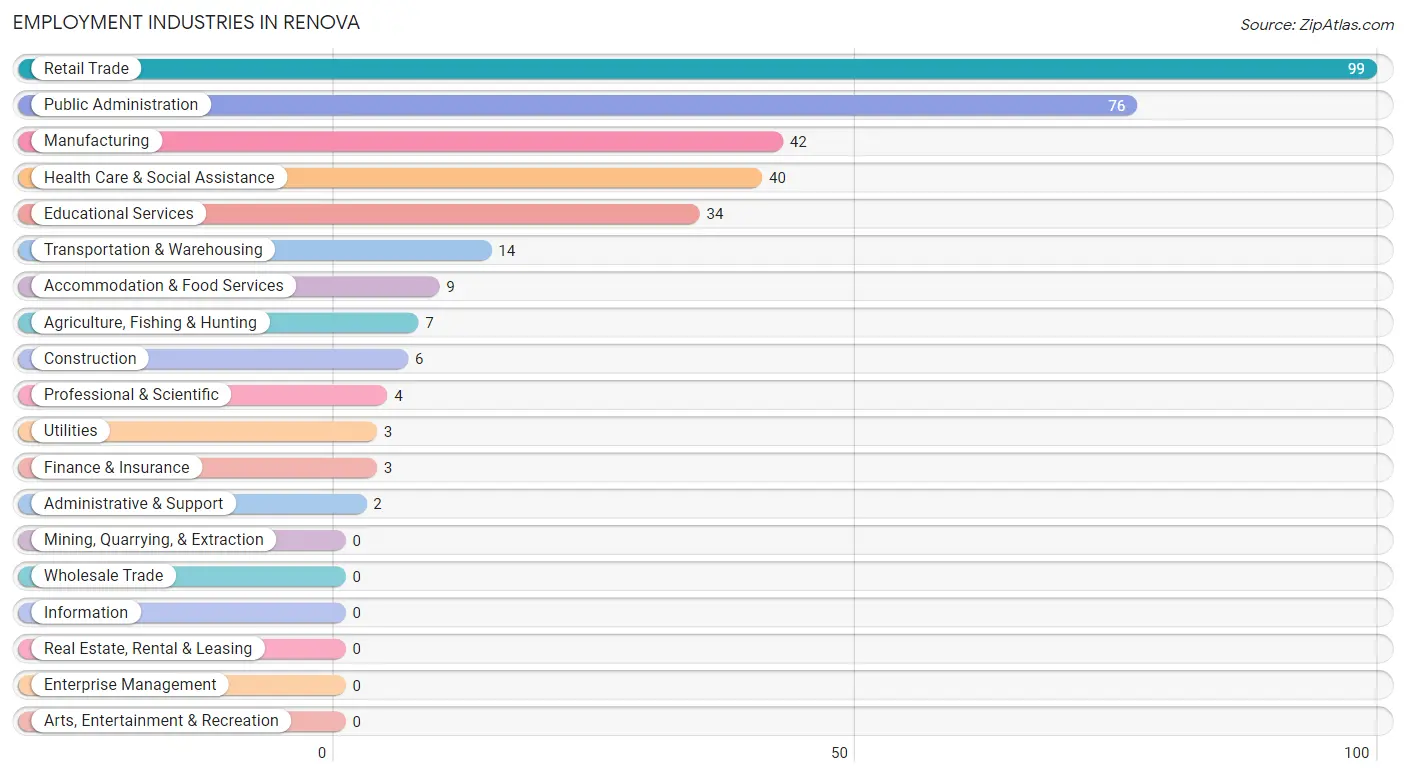
Employment Industries in Renova
The major employment industries in Renova include Retail Trade (99 | 28.5%), Public Administration (76 | 21.9%), Manufacturing (42 | 12.1%), Health Care & Social Assistance (40 | 11.5%), and Educational Services (34 | 9.8%).
Employment Industries by Sex in Renova
The Renova industries that see more men than women are Agriculture, Fishing & Hunting (100.0%), Construction (100.0%), and Utilities (100.0%), whereas the industries that tend to have a higher number of women are Finance & Insurance (100.0%), Professional & Scientific (100.0%), and Health Care & Social Assistance (92.5%).
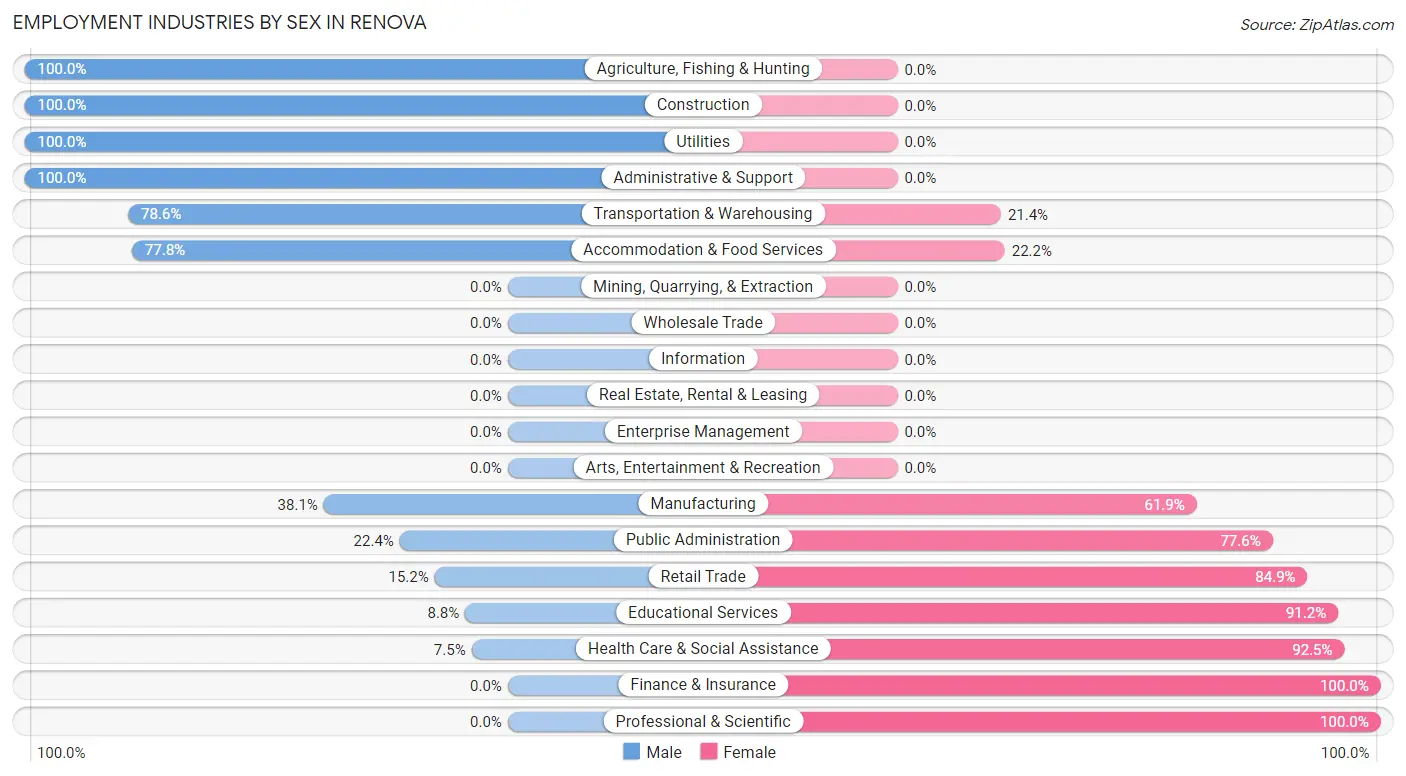
| Industry | Male | Female |
| Agriculture, Fishing & Hunting | 7 (100.0%) | 0 (0.0%) |
| Mining, Quarrying, & Extraction | 0 (0.0%) | 0 (0.0%) |
| Construction | 6 (100.0%) | 0 (0.0%) |
| Manufacturing | 16 (38.1%) | 26 (61.9%) |
| Wholesale Trade | 0 (0.0%) | 0 (0.0%) |
| Retail Trade | 15 (15.1%) | 84 (84.9%) |
| Transportation & Warehousing | 11 (78.6%) | 3 (21.4%) |
| Utilities | 3 (100.0%) | 0 (0.0%) |
| Information | 0 (0.0%) | 0 (0.0%) |
| Finance & Insurance | 0 (0.0%) | 3 (100.0%) |
| Real Estate, Rental & Leasing | 0 (0.0%) | 0 (0.0%) |
| Professional & Scientific | 0 (0.0%) | 4 (100.0%) |
| Enterprise Management | 0 (0.0%) | 0 (0.0%) |
| Administrative & Support | 2 (100.0%) | 0 (0.0%) |
| Educational Services | 3 (8.8%) | 31 (91.2%) |
| Health Care & Social Assistance | 3 (7.5%) | 37 (92.5%) |
| Arts, Entertainment & Recreation | 0 (0.0%) | 0 (0.0%) |
| Accommodation & Food Services | 7 (77.8%) | 2 (22.2%) |
| Public Administration | 17 (22.4%) | 59 (77.6%) |
| Total | 90 (25.9%) | 257 (74.1%) |
Education in Renova
School Enrollment in Renova
The most common levels of schooling among the 371 students in Renova are nursery / preschool (165 | 44.5%), elementary school (69 | 18.6%), and high school (52 | 14.0%).
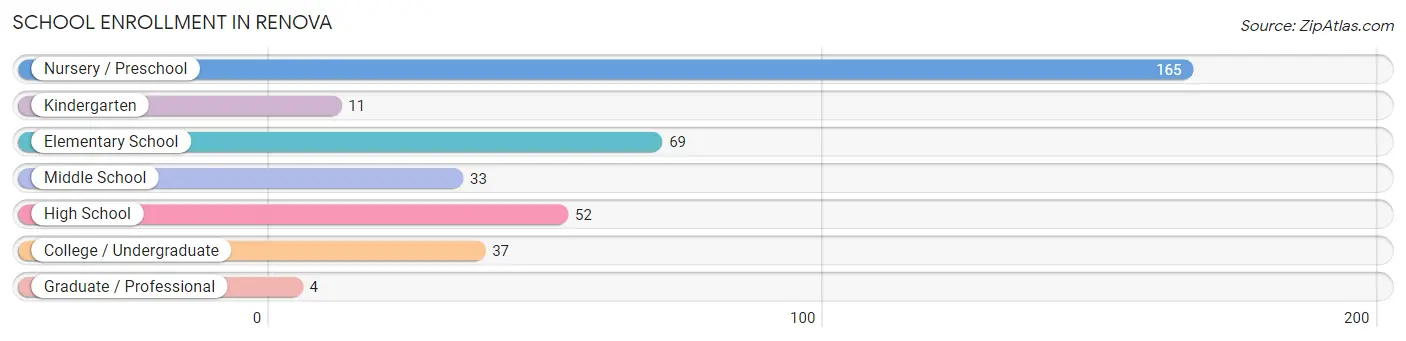
| School Level | # Students | % Students |
| Nursery / Preschool | 165 | 44.5% |
| Kindergarten | 11 | 3.0% |
| Elementary School | 69 | 18.6% |
| Middle School | 33 | 8.9% |
| High School | 52 | 14.0% |
| College / Undergraduate | 37 | 10.0% |
| Graduate / Professional | 4 | 1.1% |
| Total | 371 | 100.0% |
School Enrollment by Age by Funding Source in Renova
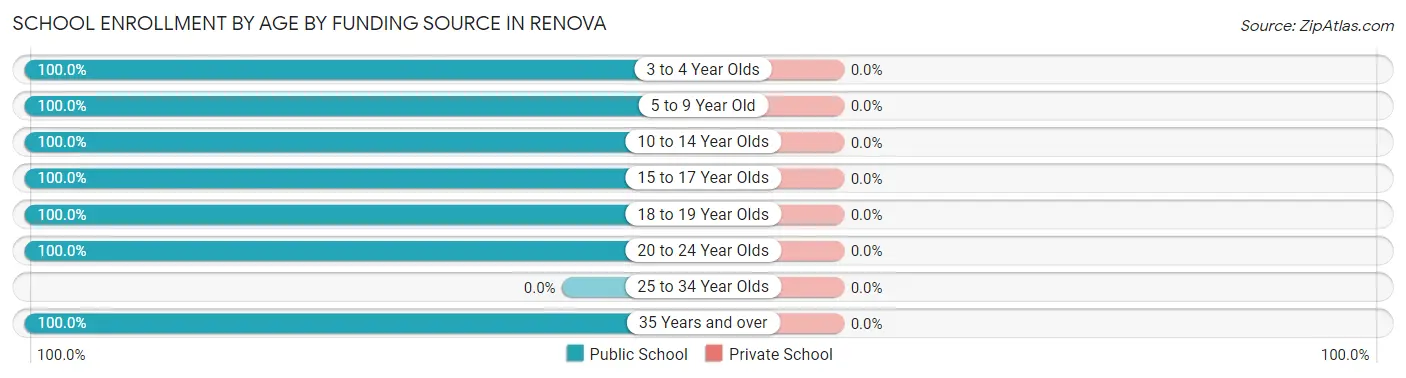
| Age Bracket | Public School | Private School |
| 3 to 4 Year Olds | 168 (100.0%) | 0 (0.0%) |
| 5 to 9 Year Old | 85 (100.0%) | 0 (0.0%) |
| 10 to 14 Year Olds | 29 (100.0%) | 0 (0.0%) |
| 15 to 17 Year Olds | 38 (100.0%) | 0 (0.0%) |
| 18 to 19 Year Olds | 21 (100.0%) | 0 (0.0%) |
| 20 to 24 Year Olds | 26 (100.0%) | 0 (0.0%) |
| 25 to 34 Year Olds | 0 (0.0%) | 0 (0.0%) |
| 35 Years and over | 4 (100.0%) | 0 (0.0%) |
| Total | 371 (100.0%) | 0 (0.0%) |
Educational Attainment by Field of Study in Renova
Business (44 | 44.0%), education (24 | 24.0%), arts & humanities (12 | 12.0%), visual & performing arts (6 | 6.0%), and engineering (4 | 4.0%) are the most common fields of study among 100 individuals in Renova who have obtained a bachelor's degree or higher.
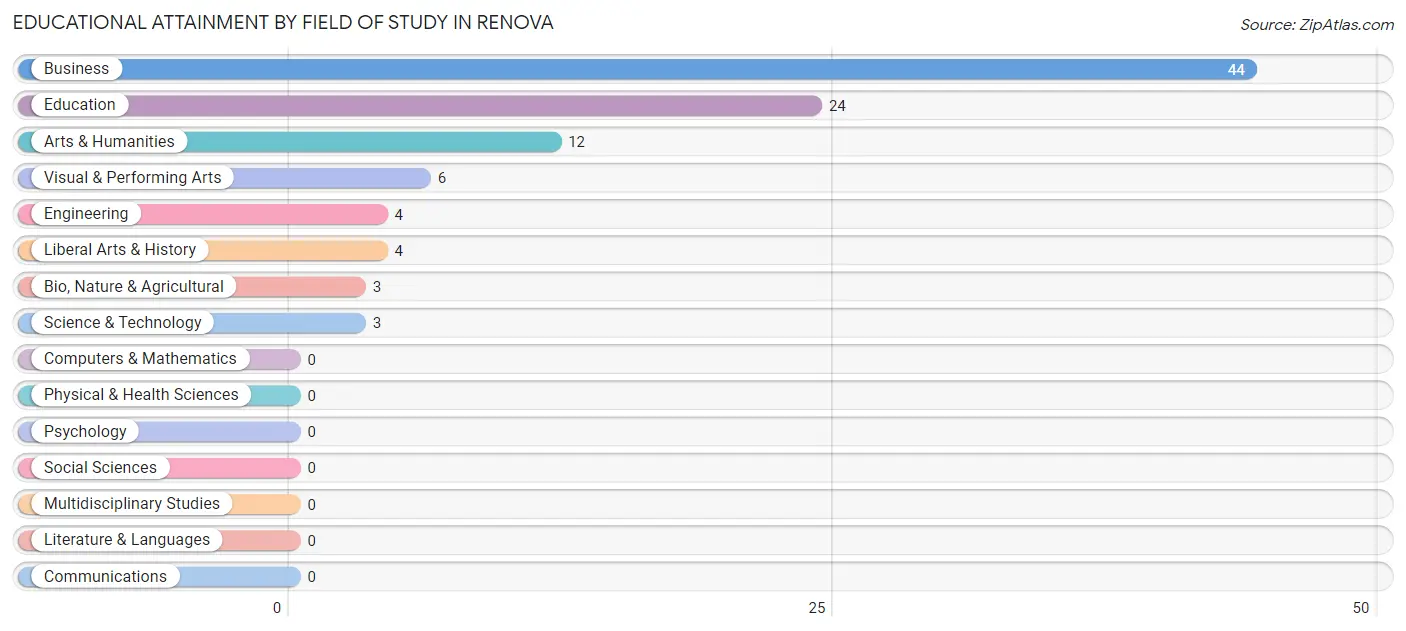
| Field of Study | # Graduates | % Graduates |
| Computers & Mathematics | 0 | 0.0% |
| Bio, Nature & Agricultural | 3 | 3.0% |
| Physical & Health Sciences | 0 | 0.0% |
| Psychology | 0 | 0.0% |
| Social Sciences | 0 | 0.0% |
| Engineering | 4 | 4.0% |
| Multidisciplinary Studies | 0 | 0.0% |
| Science & Technology | 3 | 3.0% |
| Business | 44 | 44.0% |
| Education | 24 | 24.0% |
| Literature & Languages | 0 | 0.0% |
| Liberal Arts & History | 4 | 4.0% |
| Visual & Performing Arts | 6 | 6.0% |
| Communications | 0 | 0.0% |
| Arts & Humanities | 12 | 12.0% |
| Total | 100 | 100.0% |
Transportation & Commute in Renova
Vehicle Availability by Sex in Renova
The most prevalent vehicle ownership categories in Renova are males with 2 vehicles (49, accounting for 54.4%) and females with 2 vehicles (120, making up 19.1%).
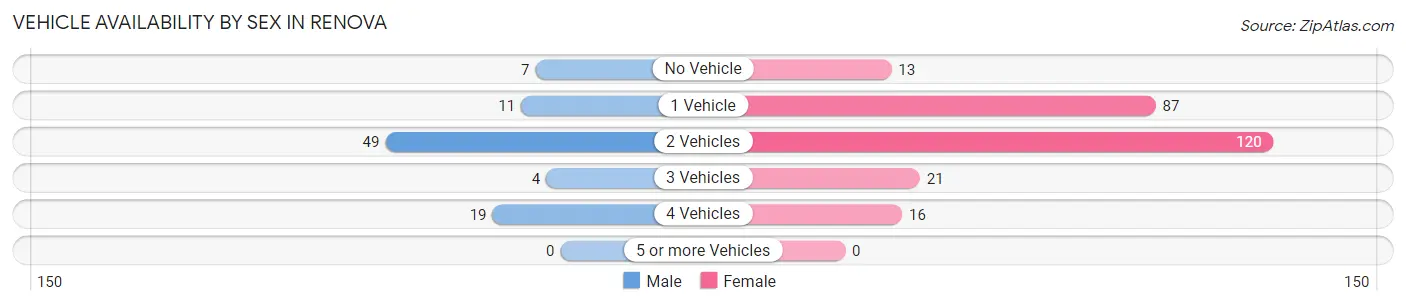
| Vehicles Available | Male | Female |
| No Vehicle | 7 (7.8%) | 13 (5.1%) |
| 1 Vehicle | 11 (12.2%) | 87 (33.9%) |
| 2 Vehicles | 49 (54.4%) | 120 (46.7%) |
| 3 Vehicles | 4 (4.4%) | 21 (8.2%) |
| 4 Vehicles | 19 (21.1%) | 16 (6.2%) |
| 5 or more Vehicles | 0 (0.0%) | 0 (0.0%) |
| Total | 90 (100.0%) | 257 (100.0%) |
Commute Time in Renova
The most frequently occuring commute durations in Renova are 5 to 9 minutes (130 commuters, 38.9%), 10 to 14 minutes (82 commuters, 24.5%), and 15 to 19 minutes (33 commuters, 9.9%).
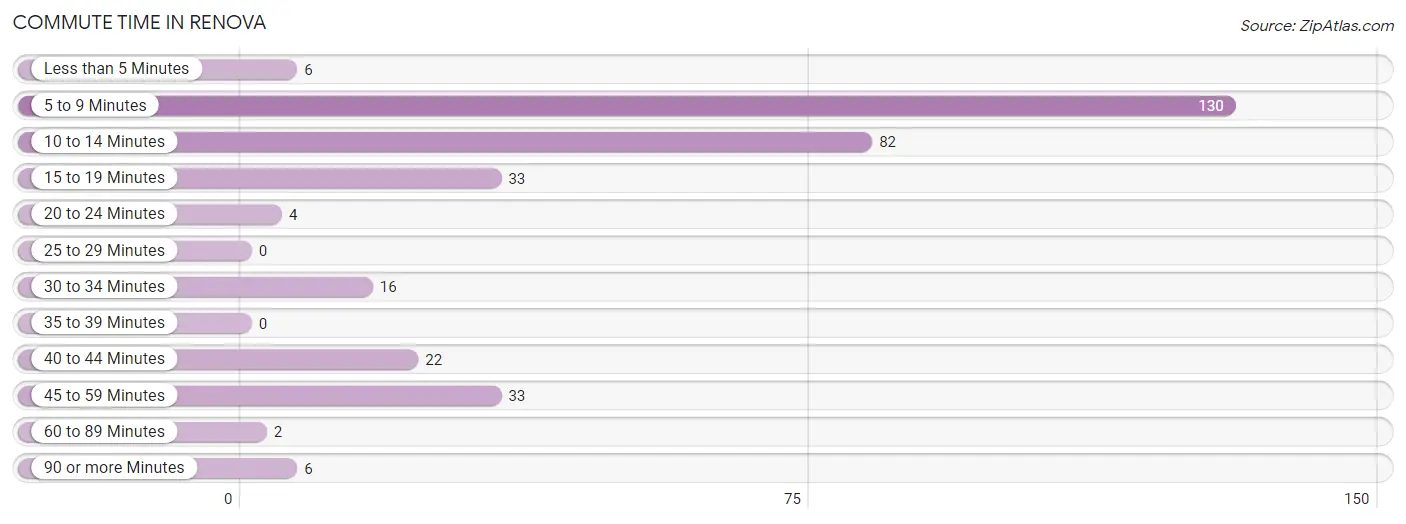
| Commute Time | # Commuters | % Commuters |
| Less than 5 Minutes | 6 | 1.8% |
| 5 to 9 Minutes | 130 | 38.9% |
| 10 to 14 Minutes | 82 | 24.5% |
| 15 to 19 Minutes | 33 | 9.9% |
| 20 to 24 Minutes | 4 | 1.2% |
| 25 to 29 Minutes | 0 | 0.0% |
| 30 to 34 Minutes | 16 | 4.8% |
| 35 to 39 Minutes | 0 | 0.0% |
| 40 to 44 Minutes | 22 | 6.6% |
| 45 to 59 Minutes | 33 | 9.9% |
| 60 to 89 Minutes | 2 | 0.6% |
| 90 or more Minutes | 6 | 1.8% |
Commute Time by Sex in Renova
The most common commute times in Renova are 5 to 9 minutes (27 commuters, 30.7%) for males and 5 to 9 minutes (103 commuters, 41.9%) for females.
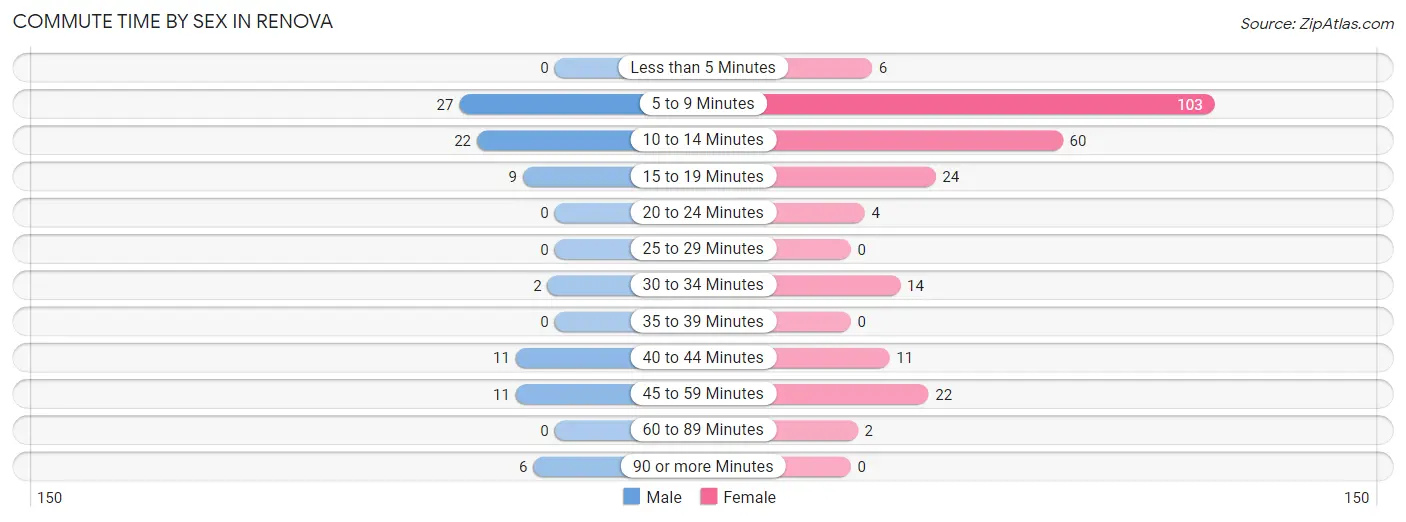
| Commute Time | Male | Female |
| Less than 5 Minutes | 0 (0.0%) | 6 (2.4%) |
| 5 to 9 Minutes | 27 (30.7%) | 103 (41.9%) |
| 10 to 14 Minutes | 22 (25.0%) | 60 (24.4%) |
| 15 to 19 Minutes | 9 (10.2%) | 24 (9.8%) |
| 20 to 24 Minutes | 0 (0.0%) | 4 (1.6%) |
| 25 to 29 Minutes | 0 (0.0%) | 0 (0.0%) |
| 30 to 34 Minutes | 2 (2.3%) | 14 (5.7%) |
| 35 to 39 Minutes | 0 (0.0%) | 0 (0.0%) |
| 40 to 44 Minutes | 11 (12.5%) | 11 (4.5%) |
| 45 to 59 Minutes | 11 (12.5%) | 22 (8.9%) |
| 60 to 89 Minutes | 0 (0.0%) | 2 (0.8%) |
| 90 or more Minutes | 6 (6.8%) | 0 (0.0%) |
Time of Departure to Work by Sex in Renova
The most frequent times of departure to work in Renova are 6:00 AM to 6:29 AM (28, 31.8%) for males and 7:00 AM to 7:29 AM (147, 59.8%) for females.
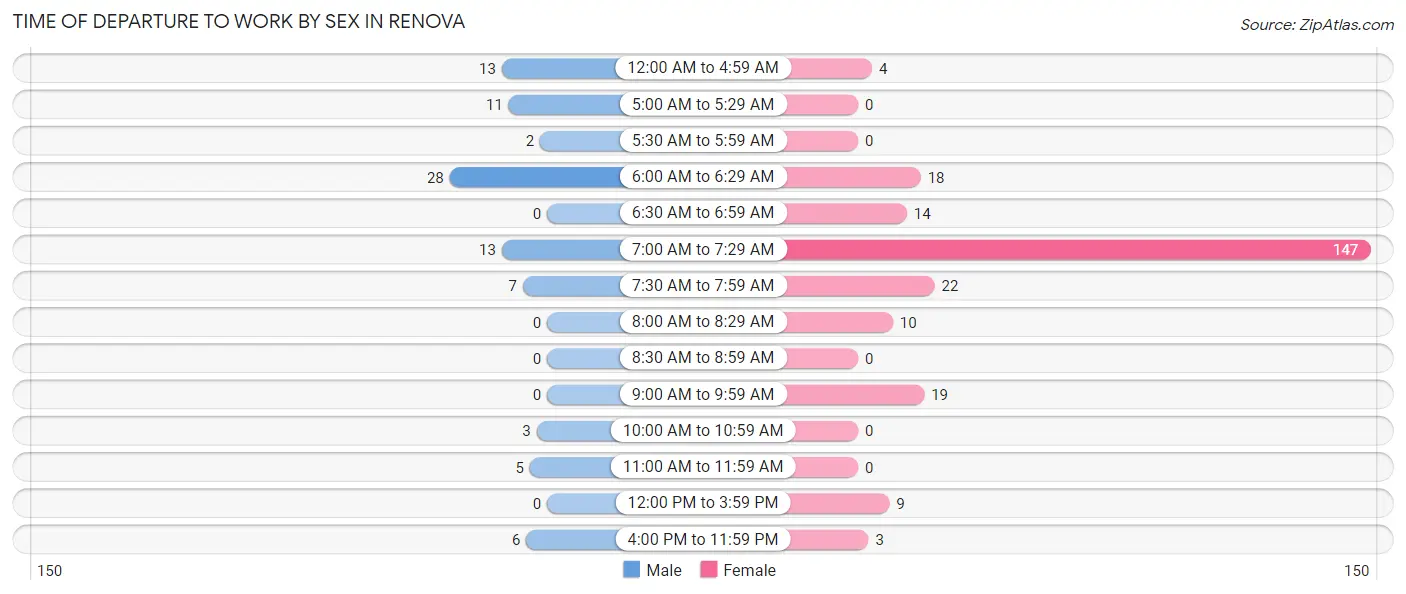
| Time of Departure | Male | Female |
| 12:00 AM to 4:59 AM | 13 (14.8%) | 4 (1.6%) |
| 5:00 AM to 5:29 AM | 11 (12.5%) | 0 (0.0%) |
| 5:30 AM to 5:59 AM | 2 (2.3%) | 0 (0.0%) |
| 6:00 AM to 6:29 AM | 28 (31.8%) | 18 (7.3%) |
| 6:30 AM to 6:59 AM | 0 (0.0%) | 14 (5.7%) |
| 7:00 AM to 7:29 AM | 13 (14.8%) | 147 (59.8%) |
| 7:30 AM to 7:59 AM | 7 (8.0%) | 22 (8.9%) |
| 8:00 AM to 8:29 AM | 0 (0.0%) | 10 (4.1%) |
| 8:30 AM to 8:59 AM | 0 (0.0%) | 0 (0.0%) |
| 9:00 AM to 9:59 AM | 0 (0.0%) | 19 (7.7%) |
| 10:00 AM to 10:59 AM | 3 (3.4%) | 0 (0.0%) |
| 11:00 AM to 11:59 AM | 5 (5.7%) | 0 (0.0%) |
| 12:00 PM to 3:59 PM | 0 (0.0%) | 9 (3.7%) |
| 4:00 PM to 11:59 PM | 6 (6.8%) | 3 (1.2%) |
| Total | 88 (100.0%) | 246 (100.0%) |
Housing Occupancy in Renova
Occupancy by Ownership in Renova
Of the total 442 dwellings in Renova, owner-occupied units account for 216 (48.9%), while renter-occupied units make up 226 (51.1%).
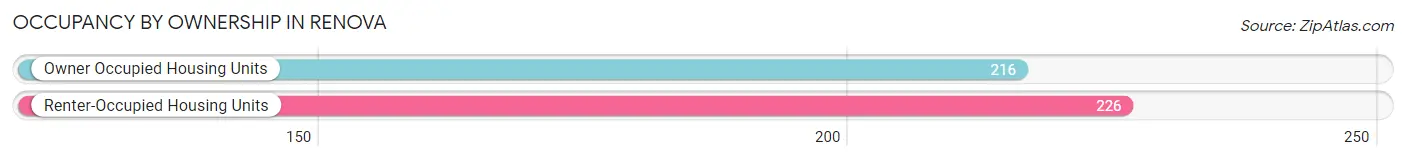
| Occupancy | # Housing Units | % Housing Units |
| Owner Occupied Housing Units | 216 | 48.9% |
| Renter-Occupied Housing Units | 226 | 51.1% |
| Total Occupied Housing Units | 442 | 100.0% |
Occupancy by Household Size in Renova
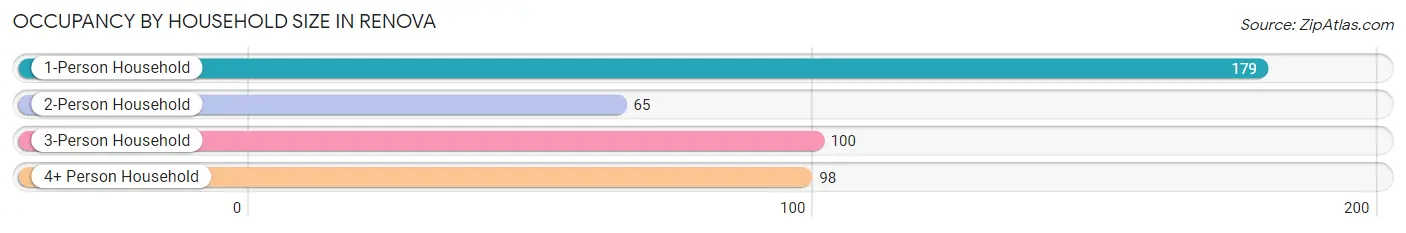
| Household Size | # Housing Units | % Housing Units |
| 1-Person Household | 179 | 40.5% |
| 2-Person Household | 65 | 14.7% |
| 3-Person Household | 100 | 22.6% |
| 4+ Person Household | 98 | 22.2% |
| Total Housing Units | 442 | 100.0% |
Occupancy by Ownership by Household Size in Renova
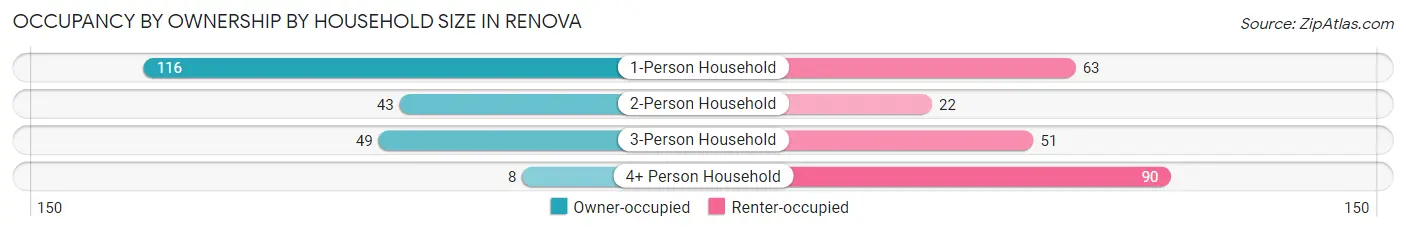
| Household Size | Owner-occupied | Renter-occupied |
| 1-Person Household | 116 (64.8%) | 63 (35.2%) |
| 2-Person Household | 43 (66.1%) | 22 (33.9%) |
| 3-Person Household | 49 (49.0%) | 51 (51.0%) |
| 4+ Person Household | 8 (8.2%) | 90 (91.8%) |
| Total Housing Units | 216 (48.9%) | 226 (51.1%) |
Occupancy by Educational Attainment in Renova
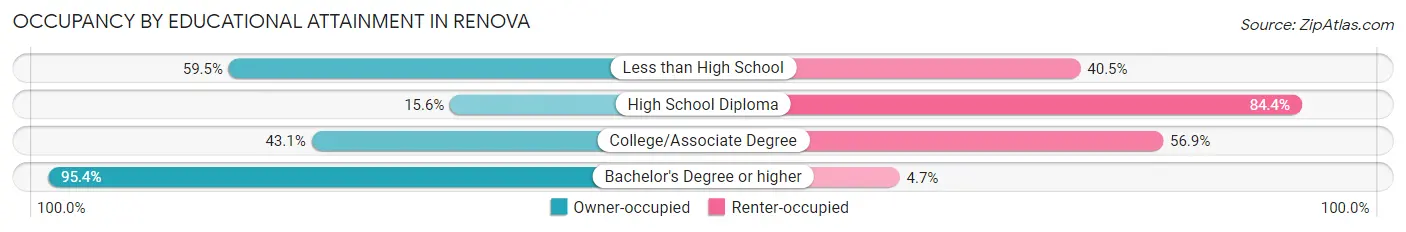
| Household Size | Owner-occupied | Renter-occupied |
| Less than High School | 25 (59.5%) | 17 (40.5%) |
| High School Diploma | 15 (15.6%) | 81 (84.4%) |
| College/Associate Degree | 94 (43.1%) | 124 (56.9%) |
| Bachelor's Degree or higher | 82 (95.4%) | 4 (4.6%) |
Occupancy by Age of Householder in Renova
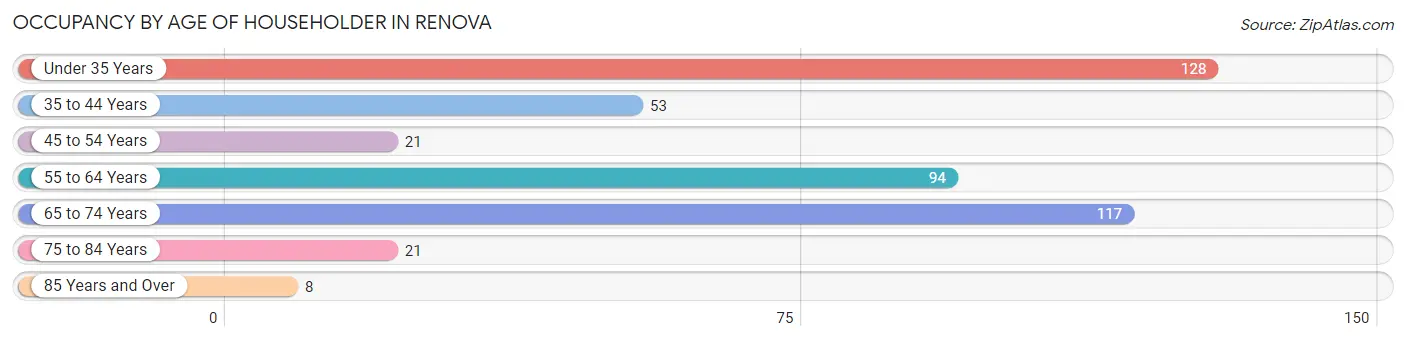
| Age Bracket | # Households | % Households |
| Under 35 Years | 128 | 29.0% |
| 35 to 44 Years | 53 | 12.0% |
| 45 to 54 Years | 21 | 4.8% |
| 55 to 64 Years | 94 | 21.3% |
| 65 to 74 Years | 117 | 26.5% |
| 75 to 84 Years | 21 | 4.8% |
| 85 Years and Over | 8 | 1.8% |
| Total | 442 | 100.0% |
Housing Finances in Renova
Median Income by Occupancy in Renova
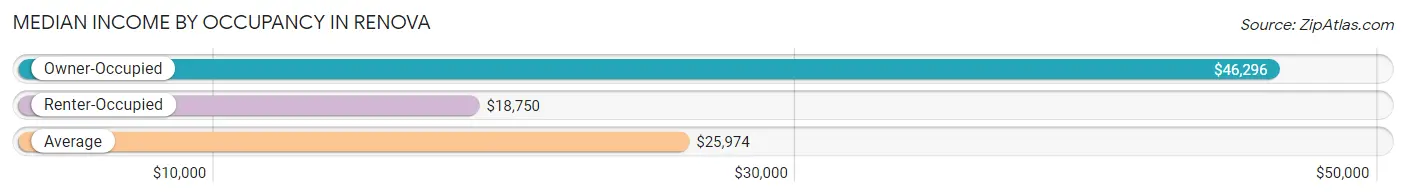
| Occupancy Type | # Households | Median Income |
| Owner-Occupied | 216 (48.9%) | $46,296 |
| Renter-Occupied | 226 (51.1%) | $18,750 |
| Average | 442 (100.0%) | $25,974 |
Occupancy by Householder Income Bracket in Renova
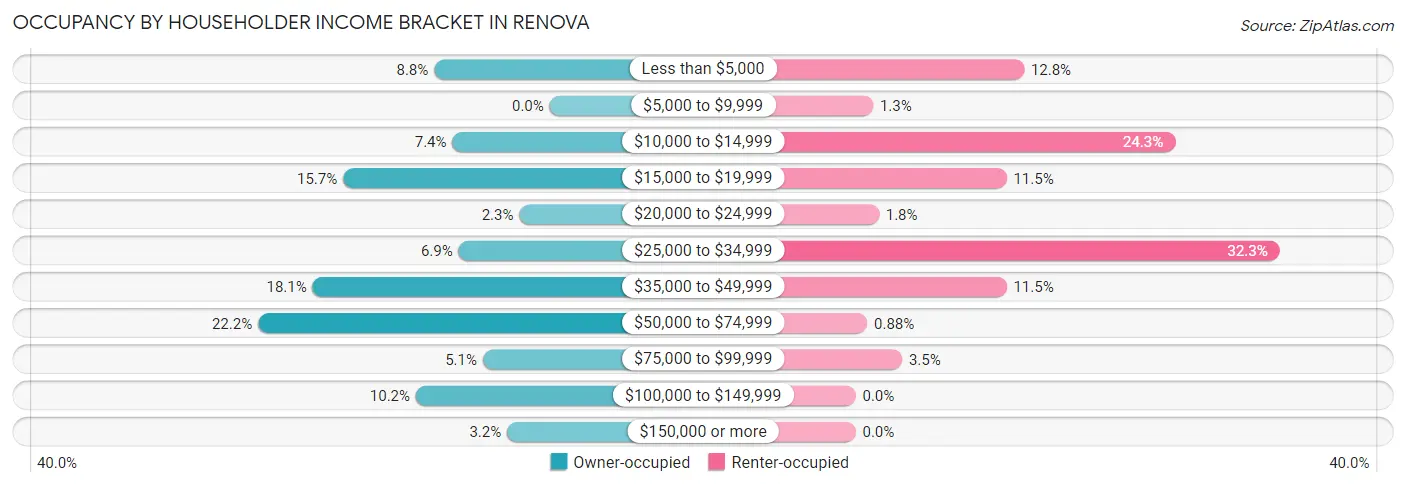
| Income Bracket | Owner-occupied | Renter-occupied |
| Less than $5,000 | 19 (8.8%) | 29 (12.8%) |
| $5,000 to $9,999 | 0 (0.0%) | 3 (1.3%) |
| $10,000 to $14,999 | 16 (7.4%) | 55 (24.3%) |
| $15,000 to $19,999 | 34 (15.7%) | 26 (11.5%) |
| $20,000 to $24,999 | 5 (2.3%) | 4 (1.8%) |
| $25,000 to $34,999 | 15 (6.9%) | 73 (32.3%) |
| $35,000 to $49,999 | 39 (18.1%) | 26 (11.5%) |
| $50,000 to $74,999 | 48 (22.2%) | 2 (0.9%) |
| $75,000 to $99,999 | 11 (5.1%) | 8 (3.5%) |
| $100,000 to $149,999 | 22 (10.2%) | 0 (0.0%) |
| $150,000 or more | 7 (3.2%) | 0 (0.0%) |
| Total | 216 (100.0%) | 226 (100.0%) |
Monthly Housing Cost Tiers in Renova
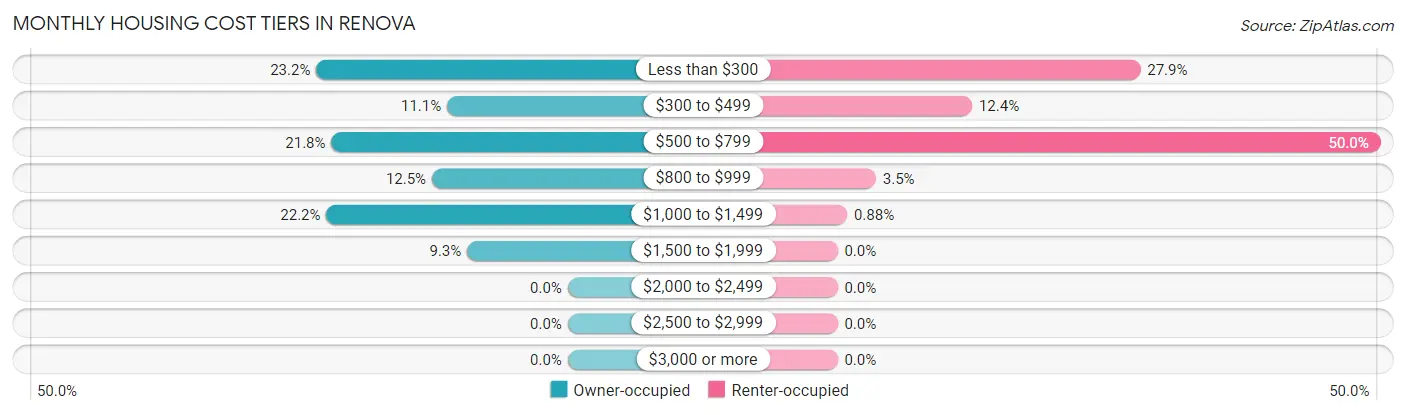
| Monthly Cost | Owner-occupied | Renter-occupied |
| Less than $300 | 50 (23.2%) | 63 (27.9%) |
| $300 to $499 | 24 (11.1%) | 28 (12.4%) |
| $500 to $799 | 47 (21.8%) | 113 (50.0%) |
| $800 to $999 | 27 (12.5%) | 8 (3.5%) |
| $1,000 to $1,499 | 48 (22.2%) | 2 (0.9%) |
| $1,500 to $1,999 | 20 (9.3%) | 0 (0.0%) |
| $2,000 to $2,499 | 0 (0.0%) | 0 (0.0%) |
| $2,500 to $2,999 | 0 (0.0%) | 0 (0.0%) |
| $3,000 or more | 0 (0.0%) | 0 (0.0%) |
| Total | 216 (100.0%) | 226 (100.0%) |
Physical Housing Characteristics in Renova
Housing Structures in Renova
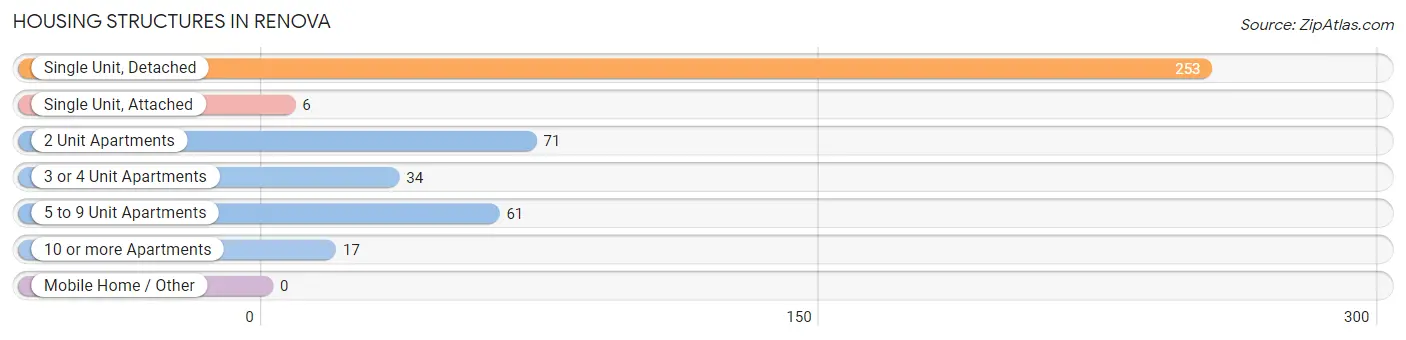
| Structure Type | # Housing Units | % Housing Units |
| Single Unit, Detached | 253 | 57.2% |
| Single Unit, Attached | 6 | 1.4% |
| 2 Unit Apartments | 71 | 16.1% |
| 3 or 4 Unit Apartments | 34 | 7.7% |
| 5 to 9 Unit Apartments | 61 | 13.8% |
| 10 or more Apartments | 17 | 3.8% |
| Mobile Home / Other | 0 | 0.0% |
| Total | 442 | 100.0% |
Housing Structures by Occupancy in Renova
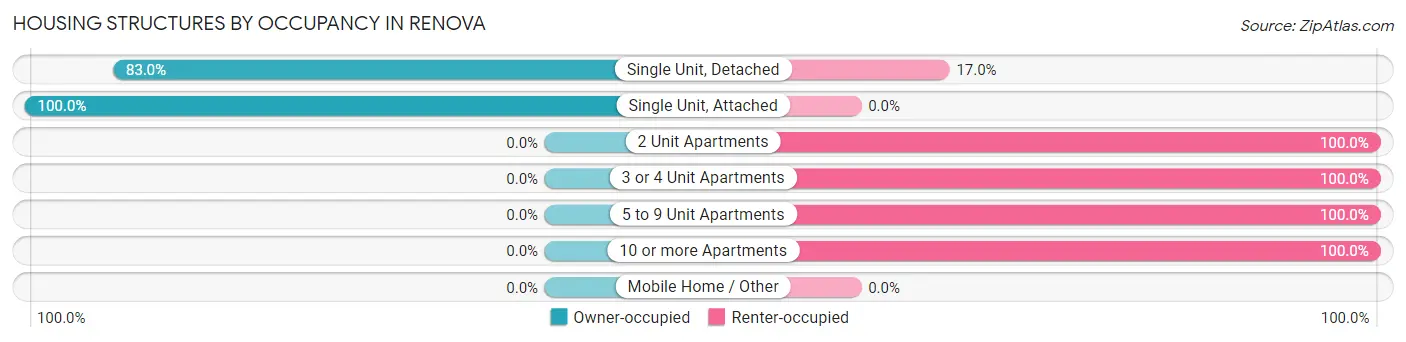
| Structure Type | Owner-occupied | Renter-occupied |
| Single Unit, Detached | 210 (83.0%) | 43 (17.0%) |
| Single Unit, Attached | 6 (100.0%) | 0 (0.0%) |
| 2 Unit Apartments | 0 (0.0%) | 71 (100.0%) |
| 3 or 4 Unit Apartments | 0 (0.0%) | 34 (100.0%) |
| 5 to 9 Unit Apartments | 0 (0.0%) | 61 (100.0%) |
| 10 or more Apartments | 0 (0.0%) | 17 (100.0%) |
| Mobile Home / Other | 0 (0.0%) | 0 (0.0%) |
| Total | 216 (48.9%) | 226 (51.1%) |
Housing Structures by Number of Rooms in Renova
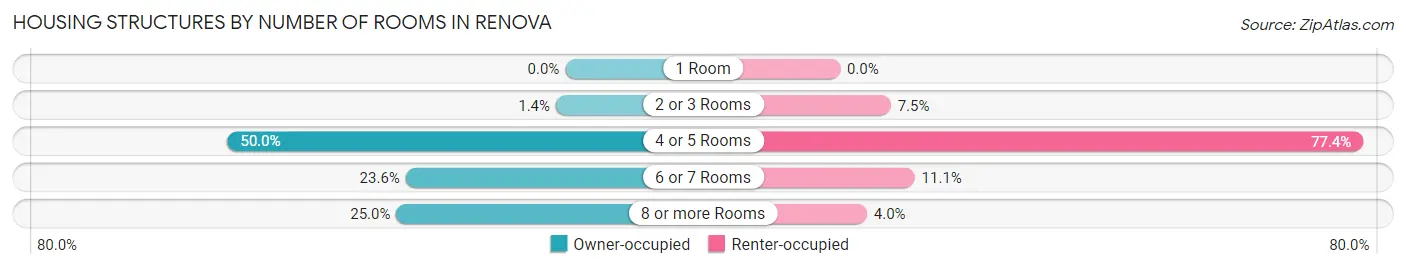
| Number of Rooms | Owner-occupied | Renter-occupied |
| 1 Room | 0 (0.0%) | 0 (0.0%) |
| 2 or 3 Rooms | 3 (1.4%) | 17 (7.5%) |
| 4 or 5 Rooms | 108 (50.0%) | 175 (77.4%) |
| 6 or 7 Rooms | 51 (23.6%) | 25 (11.1%) |
| 8 or more Rooms | 54 (25.0%) | 9 (4.0%) |
| Total | 216 (100.0%) | 226 (100.0%) |
Housing Structure by Heating Type in Renova
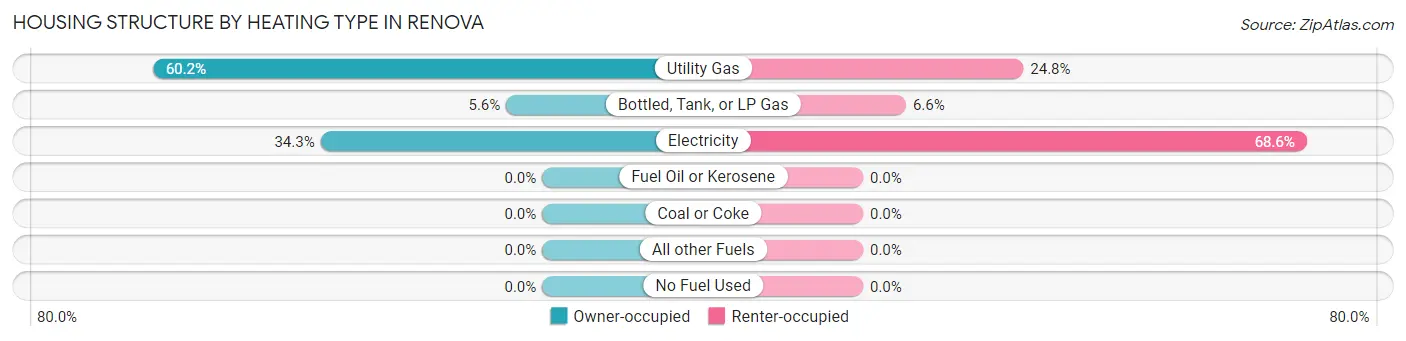
| Heating Type | Owner-occupied | Renter-occupied |
| Utility Gas | 130 (60.2%) | 56 (24.8%) |
| Bottled, Tank, or LP Gas | 12 (5.6%) | 15 (6.6%) |
| Electricity | 74 (34.3%) | 155 (68.6%) |
| Fuel Oil or Kerosene | 0 (0.0%) | 0 (0.0%) |
| Coal or Coke | 0 (0.0%) | 0 (0.0%) |
| All other Fuels | 0 (0.0%) | 0 (0.0%) |
| No Fuel Used | 0 (0.0%) | 0 (0.0%) |
| Total | 216 (100.0%) | 226 (100.0%) |
Household Vehicle Usage in Renova
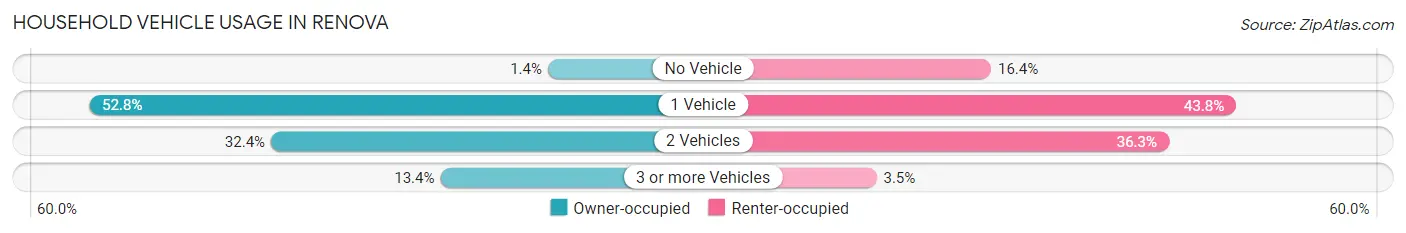
| Vehicles per Household | Owner-occupied | Renter-occupied |
| No Vehicle | 3 (1.4%) | 37 (16.4%) |
| 1 Vehicle | 114 (52.8%) | 99 (43.8%) |
| 2 Vehicles | 70 (32.4%) | 82 (36.3%) |
| 3 or more Vehicles | 29 (13.4%) | 8 (3.5%) |
| Total | 216 (100.0%) | 226 (100.0%) |
Real Estate & Mortgages in Renova
Real Estate and Mortgage Overview in Renova
| Characteristic | Without Mortgage | With Mortgage |
| Housing Units | 105 | 111 |
| Median Property Value | $97,500 | $130,800 |
| Median Household Income | - | - |
| Monthly Housing Costs | $388 | $0 |
| Real Estate Taxes | $1,153 | $19 |
Property Value by Mortgage Status in Renova
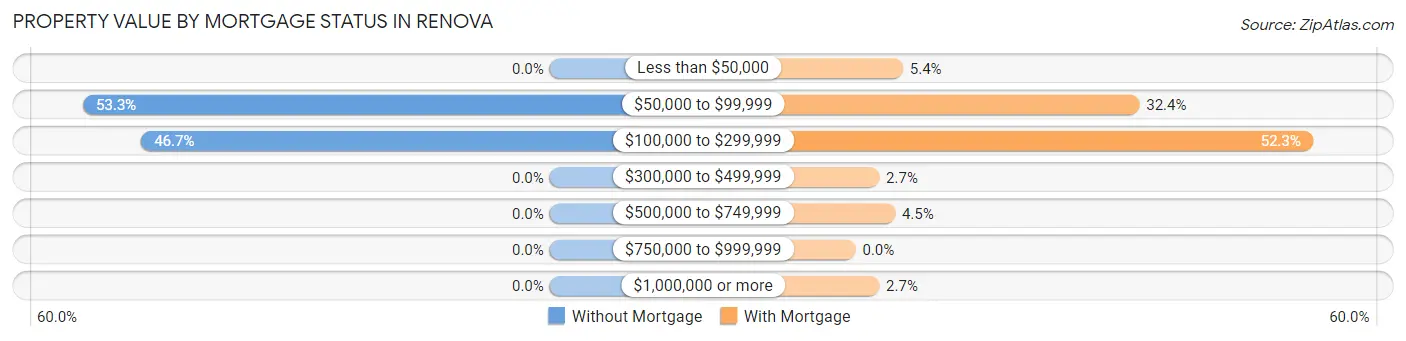
| Property Value | Without Mortgage | With Mortgage |
| Less than $50,000 | 0 (0.0%) | 6 (5.4%) |
| $50,000 to $99,999 | 56 (53.3%) | 36 (32.4%) |
| $100,000 to $299,999 | 49 (46.7%) | 58 (52.2%) |
| $300,000 to $499,999 | 0 (0.0%) | 3 (2.7%) |
| $500,000 to $749,999 | 0 (0.0%) | 5 (4.5%) |
| $750,000 to $999,999 | 0 (0.0%) | 0 (0.0%) |
| $1,000,000 or more | 0 (0.0%) | 3 (2.7%) |
| Total | 105 (100.0%) | 111 (100.0%) |
Household Income by Mortgage Status in Renova
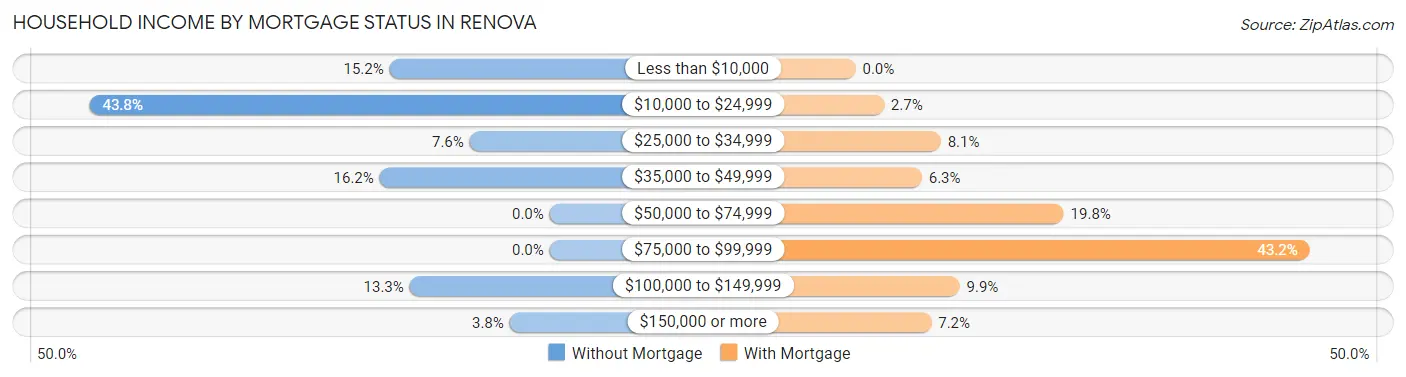
| Household Income | Without Mortgage | With Mortgage |
| Less than $10,000 | 16 (15.2%) | 0 (0.0%) |
| $10,000 to $24,999 | 46 (43.8%) | 3 (2.7%) |
| $25,000 to $34,999 | 8 (7.6%) | 9 (8.1%) |
| $35,000 to $49,999 | 17 (16.2%) | 7 (6.3%) |
| $50,000 to $74,999 | 0 (0.0%) | 22 (19.8%) |
| $75,000 to $99,999 | 0 (0.0%) | 48 (43.2%) |
| $100,000 to $149,999 | 14 (13.3%) | 11 (9.9%) |
| $150,000 or more | 4 (3.8%) | 8 (7.2%) |
| Total | 105 (100.0%) | 111 (100.0%) |
Property Value to Household Income Ratio in Renova
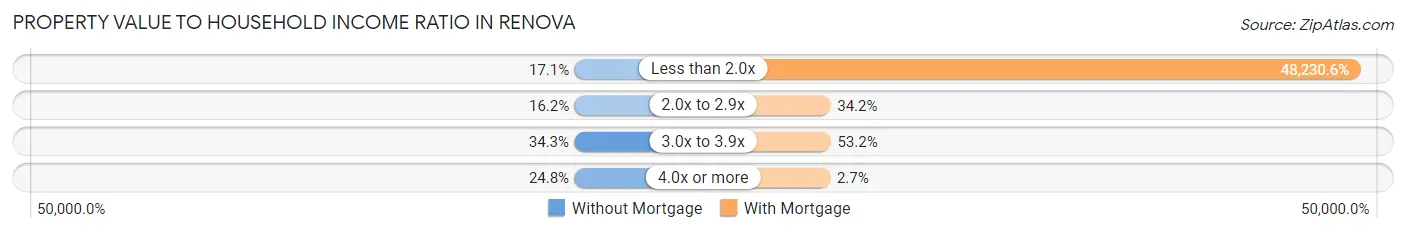
| Value-to-Income Ratio | Without Mortgage | With Mortgage |
| Less than 2.0x | 18 (17.1%) | 53,536 (48,230.6%) |
| 2.0x to 2.9x | 17 (16.2%) | 38 (34.2%) |
| 3.0x to 3.9x | 36 (34.3%) | 59 (53.1%) |
| 4.0x or more | 26 (24.8%) | 3 (2.7%) |
| Total | 105 (100.0%) | 111 (100.0%) |
Real Estate Taxes by Mortgage Status in Renova
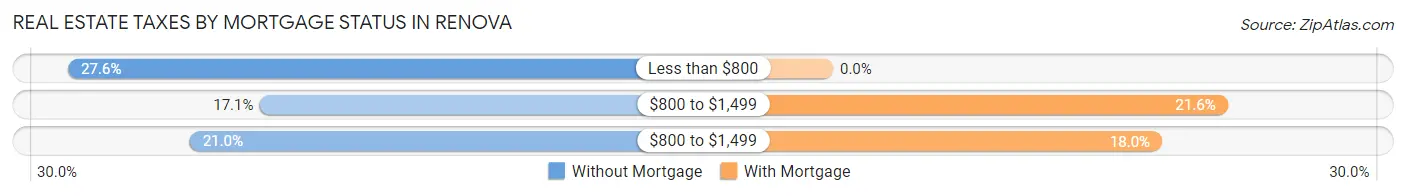
| Property Taxes | Without Mortgage | With Mortgage |
| Less than $800 | 29 (27.6%) | 0 (0.0%) |
| $800 to $1,499 | 18 (17.1%) | 24 (21.6%) |
| $800 to $1,499 | 22 (20.9%) | 20 (18.0%) |
| Total | 105 (100.0%) | 111 (100.0%) |
Health & Disability in Renova
Health Insurance Coverage by Age in Renova
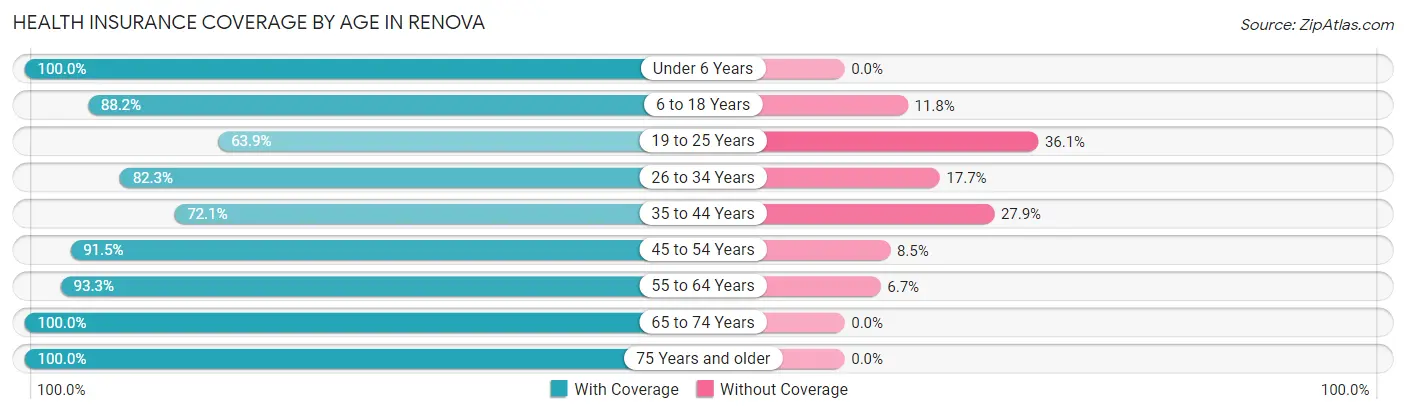
| Age Bracket | With Coverage | Without Coverage |
| Under 6 Years | 219 (100.0%) | 0 (0.0%) |
| 6 to 18 Years | 142 (88.2%) | 19 (11.8%) |
| 19 to 25 Years | 46 (63.9%) | 26 (36.1%) |
| 26 to 34 Years | 102 (82.3%) | 22 (17.7%) |
| 35 to 44 Years | 62 (72.1%) | 24 (27.9%) |
| 45 to 54 Years | 43 (91.5%) | 4 (8.5%) |
| 55 to 64 Years | 111 (93.3%) | 8 (6.7%) |
| 65 to 74 Years | 151 (100.0%) | 0 (0.0%) |
| 75 Years and older | 29 (100.0%) | 0 (0.0%) |
| Total | 905 (89.8%) | 103 (10.2%) |
Health Insurance Coverage by Citizenship Status in Renova
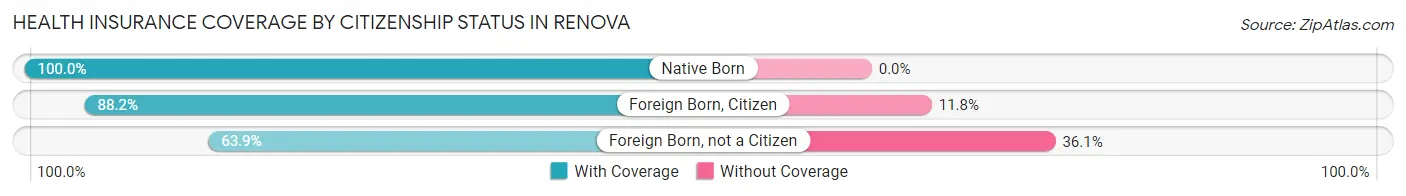
| Citizenship Status | With Coverage | Without Coverage |
| Native Born | 219 (100.0%) | 0 (0.0%) |
| Foreign Born, Citizen | 142 (88.2%) | 19 (11.8%) |
| Foreign Born, not a Citizen | 46 (63.9%) | 26 (36.1%) |
Health Insurance Coverage by Household Income in Renova
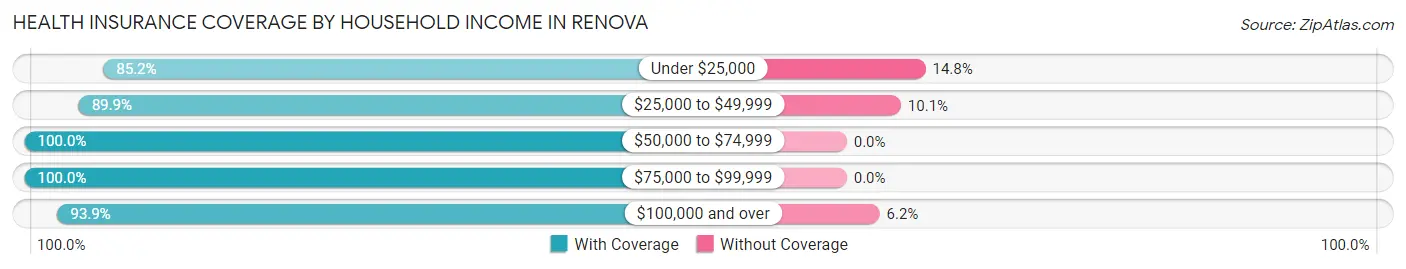
| Household Income | With Coverage | Without Coverage |
| Under $25,000 | 283 (85.2%) | 49 (14.8%) |
| $25,000 to $49,999 | 443 (89.9%) | 50 (10.1%) |
| $50,000 to $74,999 | 71 (100.0%) | 0 (0.0%) |
| $75,000 to $99,999 | 47 (100.0%) | 0 (0.0%) |
| $100,000 and over | 61 (93.9%) | 4 (6.1%) |
Public vs Private Health Insurance Coverage by Age in Renova
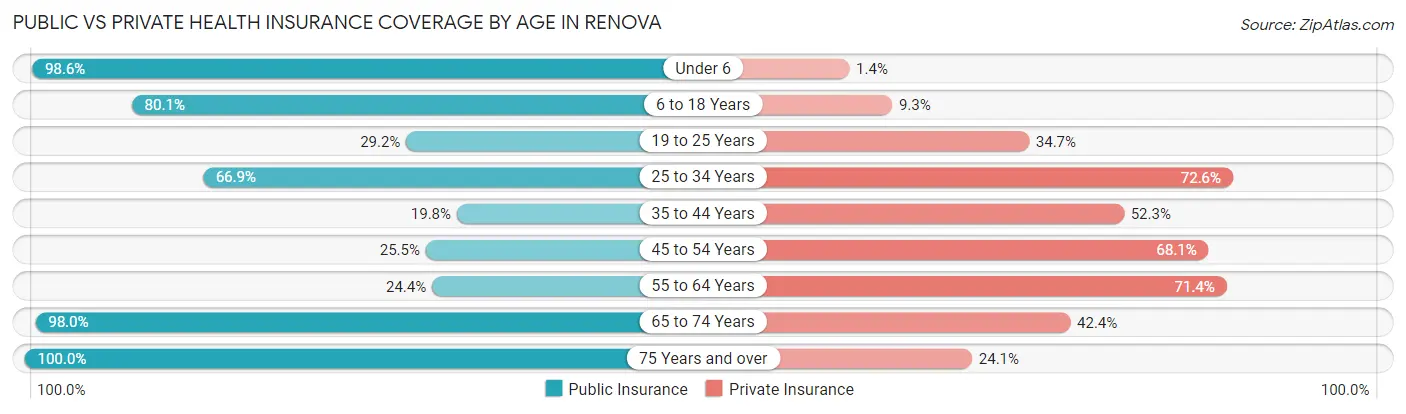
| Age Bracket | Public Insurance | Private Insurance |
| Under 6 | 216 (98.6%) | 3 (1.4%) |
| 6 to 18 Years | 129 (80.1%) | 15 (9.3%) |
| 19 to 25 Years | 21 (29.2%) | 25 (34.7%) |
| 25 to 34 Years | 83 (66.9%) | 90 (72.6%) |
| 35 to 44 Years | 17 (19.8%) | 45 (52.3%) |
| 45 to 54 Years | 12 (25.5%) | 32 (68.1%) |
| 55 to 64 Years | 29 (24.4%) | 85 (71.4%) |
| 65 to 74 Years | 148 (98.0%) | 64 (42.4%) |
| 75 Years and over | 29 (100.0%) | 7 (24.1%) |
| Total | 684 (67.9%) | 366 (36.3%) |
Disability Status by Sex by Age in Renova
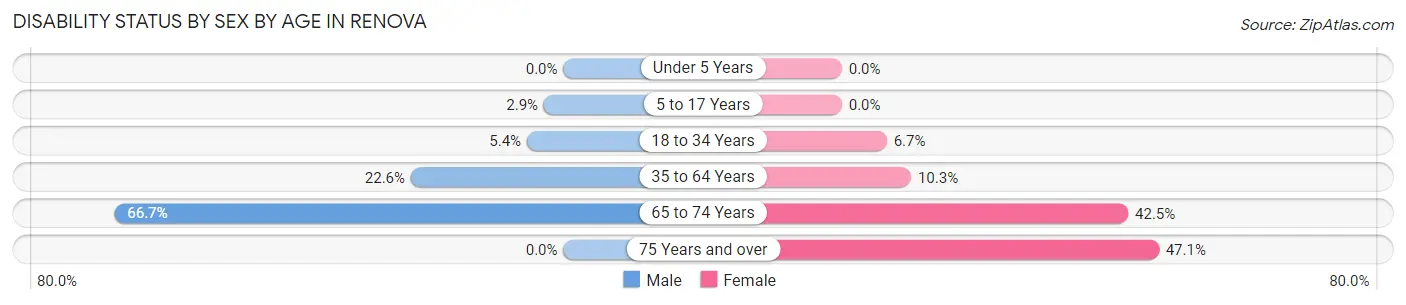
| Age Bracket | Male | Female |
| Under 5 Years | 0 (0.0%) | 0 (0.0%) |
| 5 to 17 Years | 3 (2.9%) | 0 (0.0%) |
| 18 to 34 Years | 4 (5.4%) | 9 (6.7%) |
| 35 to 64 Years | 24 (22.6%) | 15 (10.3%) |
| 65 to 74 Years | 16 (66.7%) | 54 (42.5%) |
| 75 Years and over | 0 (0.0%) | 8 (47.1%) |
Disability Class by Sex by Age in Renova
Disability Class: Hearing Difficulty
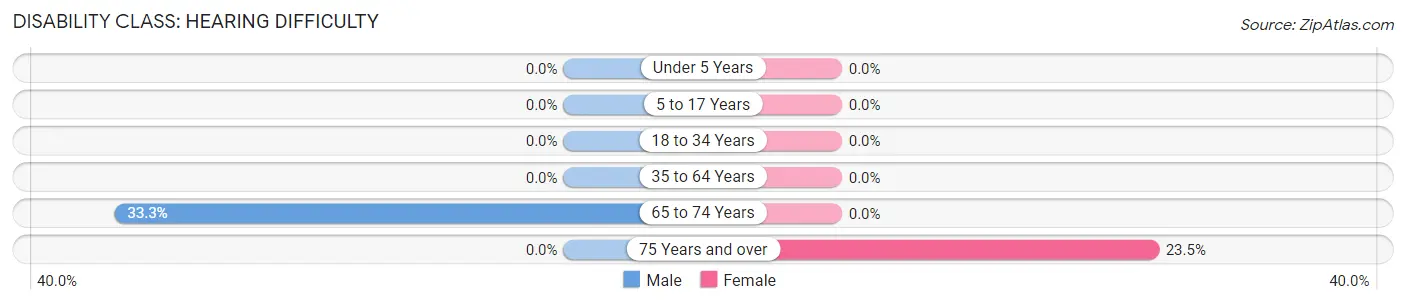
| Age Bracket | Male | Female |
| Under 5 Years | 0 (0.0%) | 0 (0.0%) |
| 5 to 17 Years | 0 (0.0%) | 0 (0.0%) |
| 18 to 34 Years | 0 (0.0%) | 0 (0.0%) |
| 35 to 64 Years | 0 (0.0%) | 0 (0.0%) |
| 65 to 74 Years | 8 (33.3%) | 0 (0.0%) |
| 75 Years and over | 0 (0.0%) | 4 (23.5%) |
Disability Class: Vision Difficulty
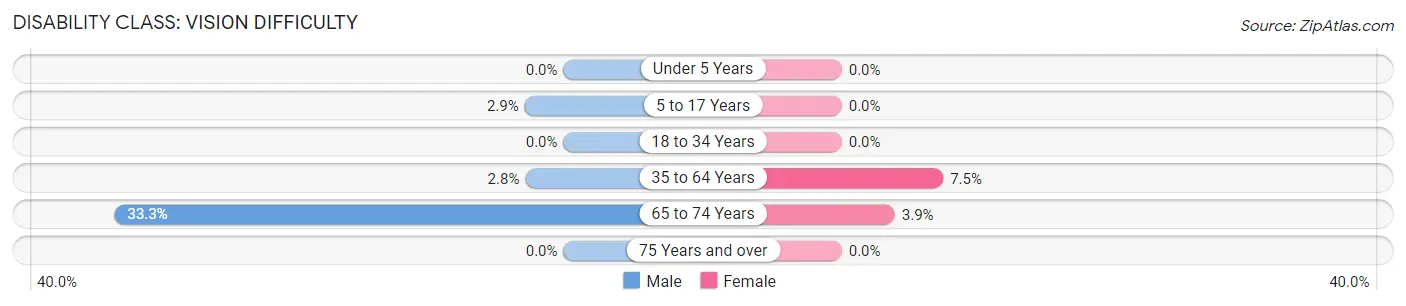
| Age Bracket | Male | Female |
| Under 5 Years | 0 (0.0%) | 0 (0.0%) |
| 5 to 17 Years | 3 (2.9%) | 0 (0.0%) |
| 18 to 34 Years | 0 (0.0%) | 0 (0.0%) |
| 35 to 64 Years | 3 (2.8%) | 11 (7.5%) |
| 65 to 74 Years | 8 (33.3%) | 5 (3.9%) |
| 75 Years and over | 0 (0.0%) | 0 (0.0%) |
Disability Class: Cognitive Difficulty
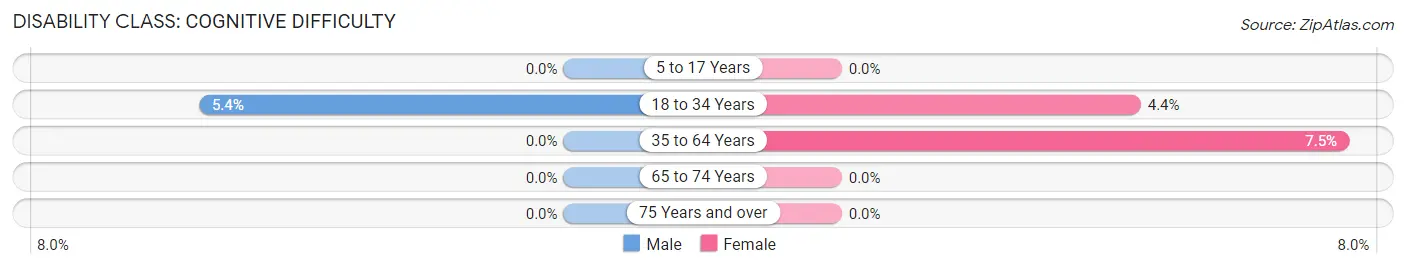
| Age Bracket | Male | Female |
| 5 to 17 Years | 0 (0.0%) | 0 (0.0%) |
| 18 to 34 Years | 4 (5.4%) | 6 (4.4%) |
| 35 to 64 Years | 0 (0.0%) | 11 (7.5%) |
| 65 to 74 Years | 0 (0.0%) | 0 (0.0%) |
| 75 Years and over | 0 (0.0%) | 0 (0.0%) |
Disability Class: Ambulatory Difficulty
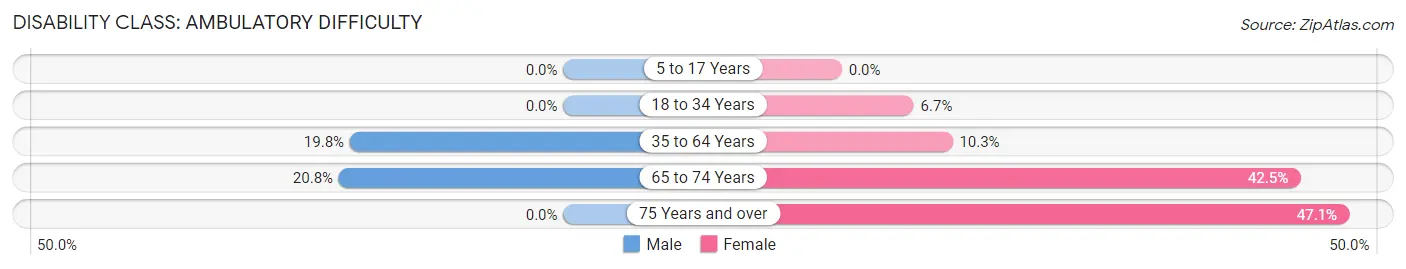
| Age Bracket | Male | Female |
| 5 to 17 Years | 0 (0.0%) | 0 (0.0%) |
| 18 to 34 Years | 0 (0.0%) | 9 (6.7%) |
| 35 to 64 Years | 21 (19.8%) | 15 (10.3%) |
| 65 to 74 Years | 5 (20.8%) | 54 (42.5%) |
| 75 Years and over | 0 (0.0%) | 8 (47.1%) |
Disability Class: Self-Care Difficulty
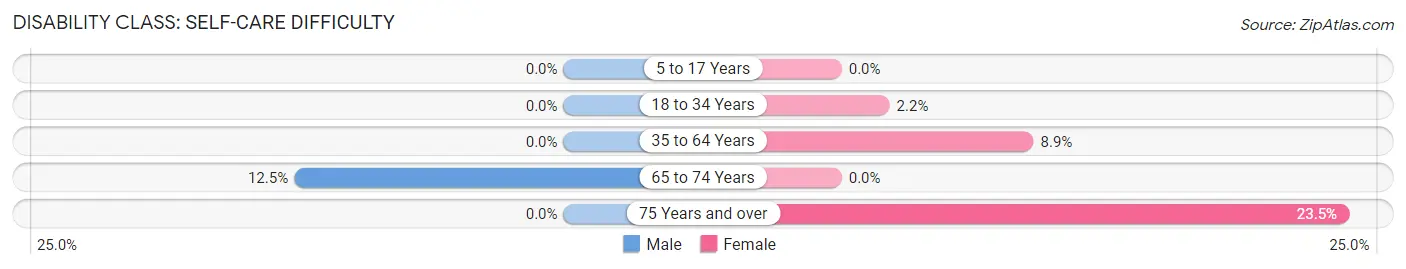
| Age Bracket | Male | Female |
| 5 to 17 Years | 0 (0.0%) | 0 (0.0%) |
| 18 to 34 Years | 0 (0.0%) | 3 (2.2%) |
| 35 to 64 Years | 0 (0.0%) | 13 (8.9%) |
| 65 to 74 Years | 3 (12.5%) | 0 (0.0%) |
| 75 Years and over | 0 (0.0%) | 4 (23.5%) |
Technology Access in Renova
Computing Device Access in Renova
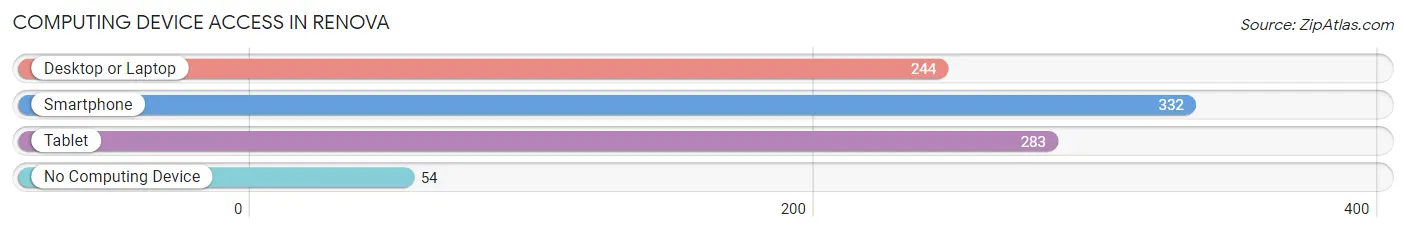
| Device Type | # Households | % Households |
| Desktop or Laptop | 244 | 55.2% |
| Smartphone | 332 | 75.1% |
| Tablet | 283 | 64.0% |
| No Computing Device | 54 | 12.2% |
| Total | 442 | 100.0% |
Internet Access in Renova
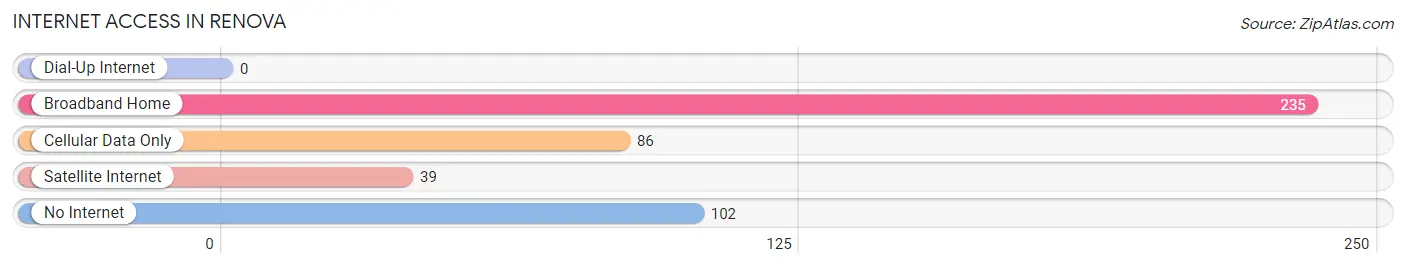
| Internet Type | # Households | % Households |
| Dial-Up Internet | 0 | 0.0% |
| Broadband Home | 235 | 53.2% |
| Cellular Data Only | 86 | 19.5% |
| Satellite Internet | 39 | 8.8% |
| No Internet | 102 | 23.1% |
| Total | 442 | 100.0% |
Renova Summary
Renova is a small city located in the state of Mississippi, in the United States. It is situated in the northern part of the state, in the county of Pontotoc. The city has a population of approximately 1,500 people, according to the 2010 census.
History
Renova was founded in 1887 by the Reverend J.W. Renfroe, a Methodist minister. He named the town after his daughter, Rena. The town was incorporated in 1891 and was the first incorporated town in Pontotoc County.
The town was originally a farming community, but in the early 1900s, the lumber industry began to take off in the area. The lumber industry was a major source of employment for the town, and it continued to be a major employer until the late 1970s.
In the late 1970s, the lumber industry began to decline, and the town began to look for other sources of employment. In the 1980s, the town began to attract new businesses, such as a furniture factory and a plastics factory. These new businesses provided much-needed jobs for the town.
Geography
Renova is located in the northern part of Mississippi, in the county of Pontotoc. The city is situated on the banks of the Tallahatchie River. The city is surrounded by rolling hills and forests. The climate in Renova is humid subtropical, with hot summers and mild winters.
Economy
Renova’s economy is largely based on agriculture and manufacturing. The town is home to several small businesses, including a furniture factory, a plastics factory, and a lumber mill. The town also has a few retail stores, such as a grocery store and a hardware store.
The town is also home to a few small farms, which produce a variety of crops, such as corn, soybeans, and cotton. The town also has a few small restaurants and bars.
Demographics
According to the 2010 census, the population of Renova was 1,500 people. The racial makeup of the town was 95.3% White, 2.7% African American, 0.7% Native American, and 1.3% from other races. The median household income was $30,000, and the median age was 37.
Renova is a small town with a rich history and a diverse economy. The town has a strong sense of community and is a great place to live and work.
Common Questions
What is Per Capita Income in Renova?
Per Capita income in Renova is $15,930.
What is the Median Family Income in Renova?
Median Family Income in Renova is $27,106.
What is the Median Household income in Renova?
Median Household Income in Renova is $25,974.
What is Income or Wage Gap in Renova?
Income or Wage Gap in Renova is 11.7%.
Women in Renova earn 88.3 cents for every dollar earned by a man.
What is Inequality or Gini Index in Renova?
Inequality or Gini Index in Renova is 0.47.
What is the Total Population of Renova?
Total Population of Renova is 1,008.
What is the Total Male Population of Renova?
Total Male Population of Renova is 357.
What is the Total Female Population of Renova?
Total Female Population of Renova is 651.
What is the Ratio of Males per 100 Females in Renova?
There are 54.84 Males per 100 Females in Renova.
What is the Ratio of Females per 100 Males in Renova?
There are 182.35 Females per 100 Males in Renova.
What is the Median Population Age in Renova?
Median Population Age in Renova is 28.5 Years.
What is the Average Family Size in Renova
Average Family Size in Renova is 3.1 People.
What is the Average Household Size in Renova
Average Household Size in Renova is 2.3 People.
How Large is the Labor Force in Renova?
There are 377 People in the Labor Forcein in Renova.
What is the Percentage of People in the Labor Force in Renova?
56.8% of People are in the Labor Force in Renova.
What is the Unemployment Rate in Renova?
Unemployment Rate in Renova is 8.0%.