Bay St Louis, MS Map & Demographics
Bay St Louis Map
Bay St Louis Overview
$45,280
PER CAPITA INCOME
$76,107
AVG FAMILY INCOME
$63,508
AVG HOUSEHOLD INCOME
43.6%
WAGE / INCOME GAP [ % ]
56.4¢/ $1
WAGE / INCOME GAP [ $ ]
0.55
INEQUALITY / GINI INDEX
9,788
TOTAL POPULATION
4,509
MALE POPULATION
5,279
FEMALE POPULATION
85.41
MALES / 100 FEMALES
117.08
FEMALES / 100 MALES
51.6
MEDIAN AGE
2.5
AVG FAMILY SIZE
2.1
AVG HOUSEHOLD SIZE
4,675
LABOR FORCE [ PEOPLE ]
56.3%
PERCENT IN LABOR FORCE
9.2%
UNEMPLOYMENT RATE
Bay St Louis Area Codes
Income in Bay St Louis
Income Overview in Bay St Louis
Per Capita Income in Bay St Louis is $45,280, while median incomes of families and households are $76,107 and $63,508 respectively.
| Characteristic | Number | Measure |
| Per Capita Income | 9,788 | $45,280 |
| Median Family Income | 3,073 | $76,107 |
| Mean Family Income | 3,073 | $113,778 |
| Median Household Income | 4,538 | $63,508 |
| Mean Household Income | 4,538 | $109,104 |
| Income Deficit | 3,073 | $0 |
| Wage / Income Gap (%) | 9,788 | 43.64% |
| Wage / Income Gap ($) | 9,788 | 56.36¢ per $1 |
| Gini / Inequality Index | 9,788 | 0.55 |
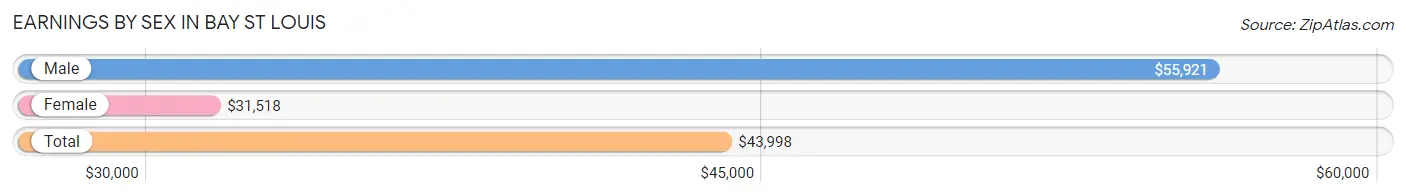
Earnings by Sex in Bay St Louis
Average Earnings in Bay St Louis are $43,998, $55,921 for men and $31,518 for women, a difference of 43.6%.
| Sex | Number | Average Earnings |
| Male | 2,304 (48.1%) | $55,921 |
| Female | 2,483 (51.9%) | $31,518 |
| Total | 4,787 (100.0%) | $43,998 |
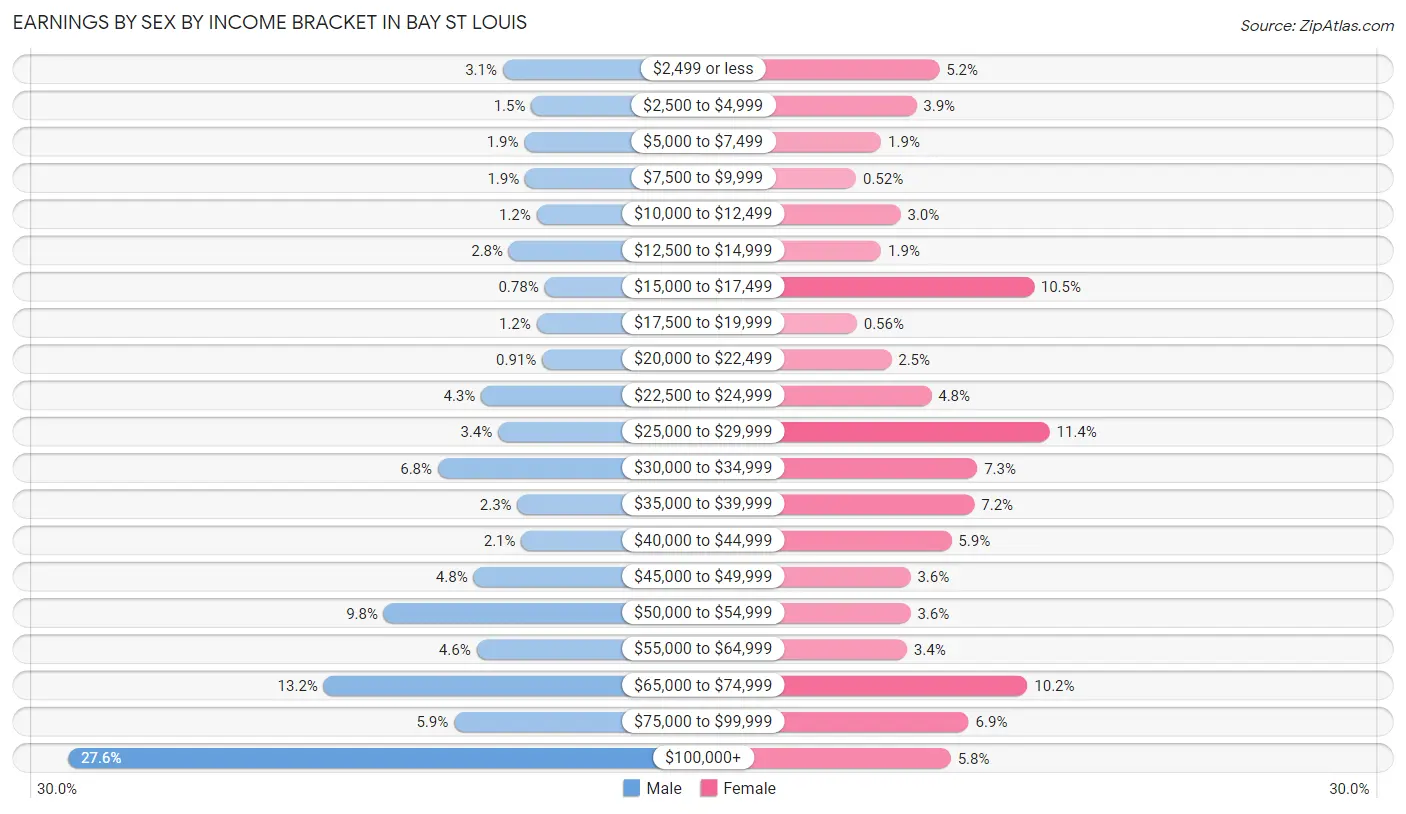
Earnings by Sex by Income Bracket in Bay St Louis
The most common earnings brackets in Bay St Louis are $100,000+ for men (635 | 27.6%) and $25,000 to $29,999 for women (283 | 11.4%).
| Income | Male | Female |
| $2,499 or less | 72 (3.1%) | 129 (5.2%) |
| $2,500 to $4,999 | 35 (1.5%) | 97 (3.9%) |
| $5,000 to $7,499 | 44 (1.9%) | 48 (1.9%) |
| $7,500 to $9,999 | 43 (1.9%) | 13 (0.5%) |
| $10,000 to $12,499 | 28 (1.2%) | 75 (3.0%) |
| $12,500 to $14,999 | 64 (2.8%) | 48 (1.9%) |
| $15,000 to $17,499 | 18 (0.8%) | 261 (10.5%) |
| $17,500 to $19,999 | 28 (1.2%) | 14 (0.6%) |
| $20,000 to $22,499 | 21 (0.9%) | 62 (2.5%) |
| $22,500 to $24,999 | 100 (4.3%) | 118 (4.8%) |
| $25,000 to $29,999 | 78 (3.4%) | 283 (11.4%) |
| $30,000 to $34,999 | 156 (6.8%) | 182 (7.3%) |
| $35,000 to $39,999 | 53 (2.3%) | 178 (7.2%) |
| $40,000 to $44,999 | 48 (2.1%) | 146 (5.9%) |
| $45,000 to $49,999 | 110 (4.8%) | 89 (3.6%) |
| $50,000 to $54,999 | 226 (9.8%) | 89 (3.6%) |
| $55,000 to $64,999 | 106 (4.6%) | 84 (3.4%) |
| $65,000 to $74,999 | 304 (13.2%) | 252 (10.2%) |
| $75,000 to $99,999 | 135 (5.9%) | 170 (6.9%) |
| $100,000+ | 635 (27.6%) | 145 (5.8%) |
| Total | 2,304 (100.0%) | 2,483 (100.0%) |
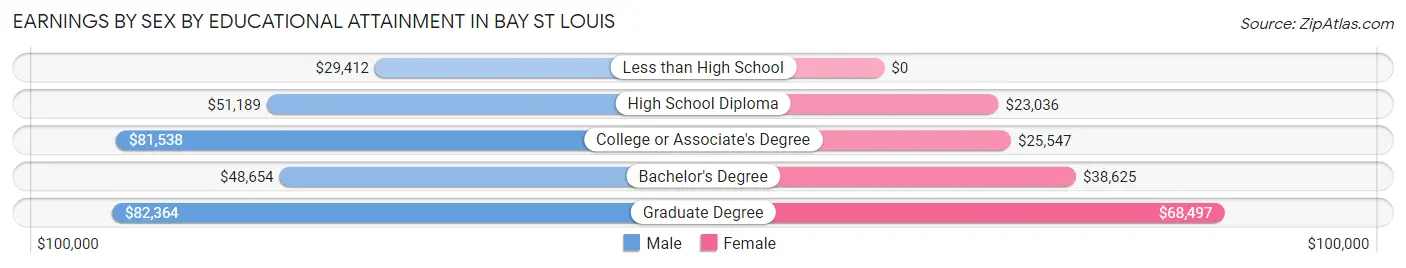
Earnings by Sex by Educational Attainment in Bay St Louis
Average earnings in Bay St Louis are $65,475 for men and $35,768 for women, a difference of 45.4%. Men with an educational attainment of graduate degree enjoy the highest average annual earnings of $82,364, while those with less than high school education earn the least with $29,412. Women with an educational attainment of graduate degree earn the most with the average annual earnings of $68,497, while those with high school diploma education have the smallest earnings of $23,036.
| Educational Attainment | Male Income | Female Income |
| Less than High School | $29,412 | $0 |
| High School Diploma | $51,189 | $23,036 |
| College or Associate's Degree | $81,538 | $25,547 |
| Bachelor's Degree | $48,654 | $38,625 |
| Graduate Degree | $82,364 | $68,497 |
| Total | $65,475 | $35,768 |
Family Income in Bay St Louis
Family Income Brackets in Bay St Louis
According to the Bay St Louis family income data, there are 664 families falling into the $100,000 to $149,999 income range, which is the most common income bracket and makes up 21.6% of all families. Conversely, the $10,000 to $14,999 income bracket is the least frequent group with only 92 families (3.0%) belonging to this category.
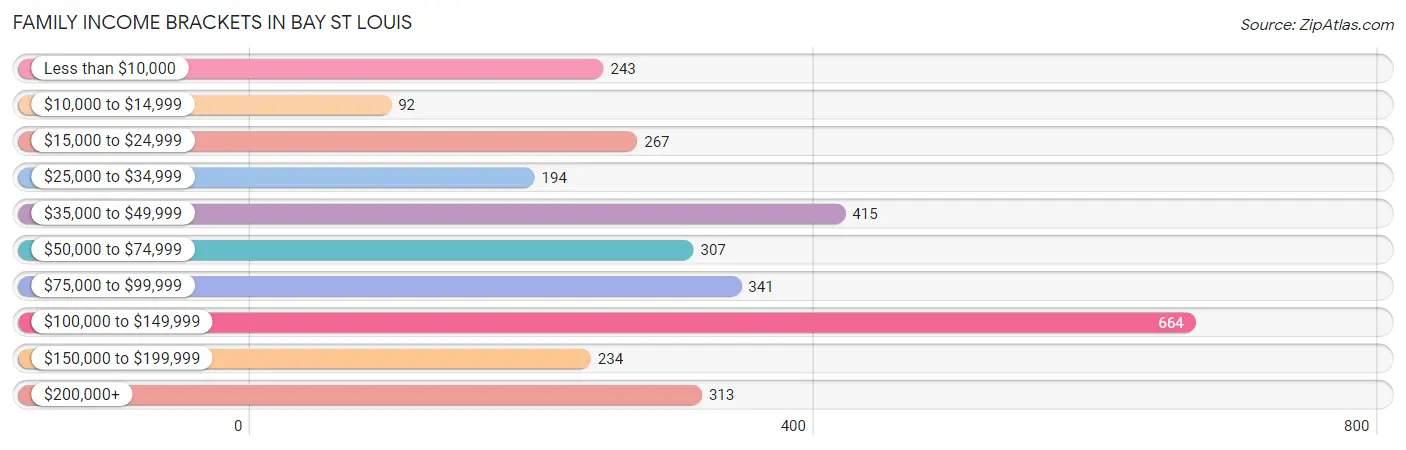
| Income Bracket | # Families | % Families |
| Less than $10,000 | 243 | 7.9% |
| $10,000 to $14,999 | 92 | 3.0% |
| $15,000 to $24,999 | 267 | 8.7% |
| $25,000 to $34,999 | 194 | 6.3% |
| $35,000 to $49,999 | 415 | 13.5% |
| $50,000 to $74,999 | 307 | 10.0% |
| $75,000 to $99,999 | 341 | 11.1% |
| $100,000 to $149,999 | 664 | 21.6% |
| $150,000 to $199,999 | 234 | 7.6% |
| $200,000+ | 313 | 10.2% |
Family Income by Famaliy Size in Bay St Louis
3-person families (437 | 14.2%) account for the highest median family income in Bay St Louis with $88,068 per family, while 2-person families (1,959 | 63.7%) have the highest median income of $39,125 per family member.
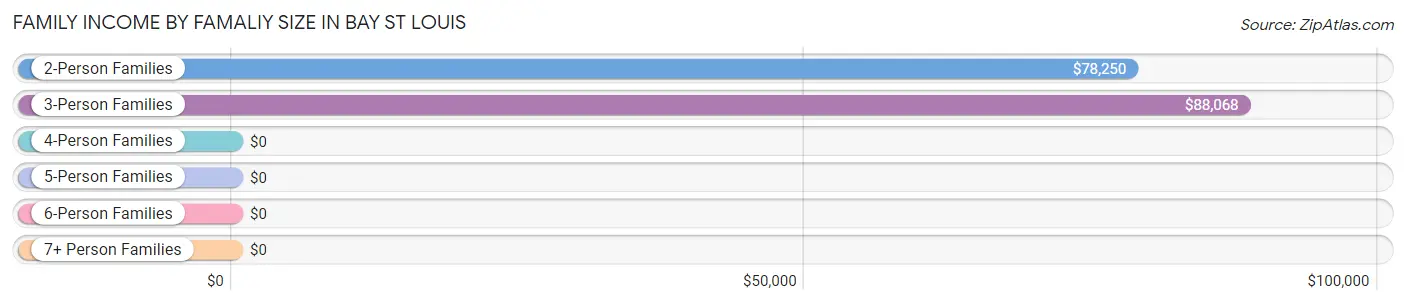
| Income Bracket | # Families | Median Income |
| 2-Person Families | 1,959 (63.7%) | $78,250 |
| 3-Person Families | 437 (14.2%) | $88,068 |
| 4-Person Families | 459 (14.9%) | $0 |
| 5-Person Families | 161 (5.2%) | $0 |
| 6-Person Families | 57 (1.8%) | $0 |
| 7+ Person Families | 0 (0.0%) | $0 |
| Total | 3,073 (100.0%) | $76,107 |
Family Income by Number of Earners in Bay St Louis
The median family income in Bay St Louis is $76,107, with families comprising 2 earners (1,209) having the highest median family income of $131,848, while families with no earners (960) have the lowest median family income of $34,904, accounting for 39.3% and 31.2% of families, respectively.
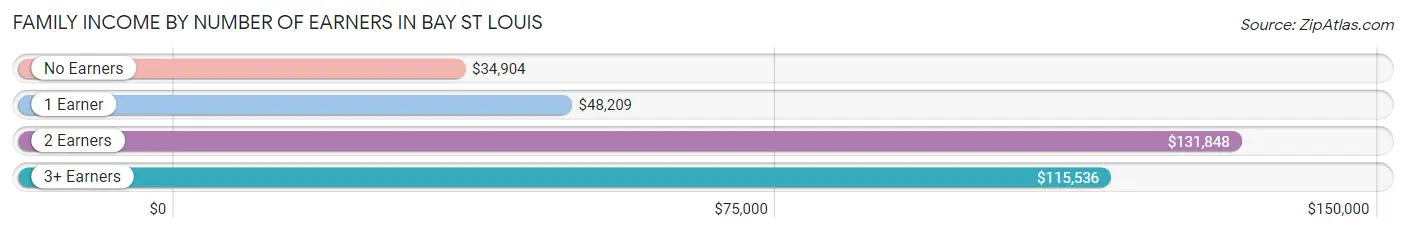
| Number of Earners | # Families | Median Income |
| No Earners | 960 (31.2%) | $34,904 |
| 1 Earner | 766 (24.9%) | $48,209 |
| 2 Earners | 1,209 (39.3%) | $131,848 |
| 3+ Earners | 138 (4.5%) | $115,536 |
| Total | 3,073 (100.0%) | $76,107 |
Household Income in Bay St Louis
Household Income Brackets in Bay St Louis
With 840 households falling in the category, the $100,000 to $149,999 income range is the most frequent in Bay St Louis, accounting for 18.5% of all households. In contrast, only 168 households (3.7%) fall into the $10,000 to $14,999 income bracket, making it the least populous group.
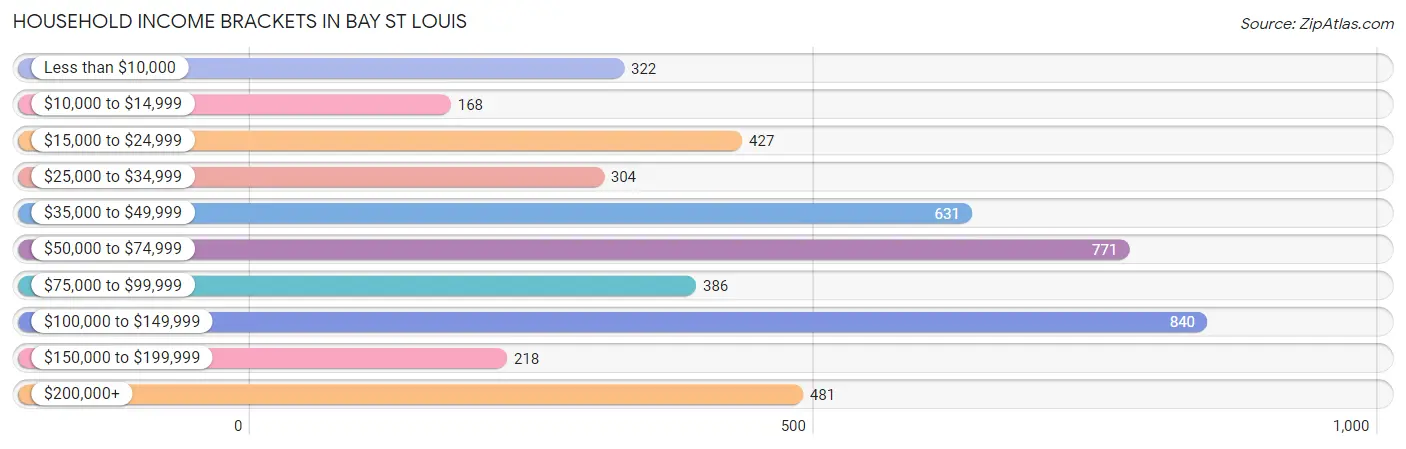
| Income Bracket | # Households | % Households |
| Less than $10,000 | 322 | 7.1% |
| $10,000 to $14,999 | 168 | 3.7% |
| $15,000 to $24,999 | 427 | 9.4% |
| $25,000 to $34,999 | 304 | 6.7% |
| $35,000 to $49,999 | 631 | 13.9% |
| $50,000 to $74,999 | 771 | 17.0% |
| $75,000 to $99,999 | 386 | 8.5% |
| $100,000 to $149,999 | 840 | 18.5% |
| $150,000 to $199,999 | 218 | 4.8% |
| $200,000+ | 481 | 10.6% |
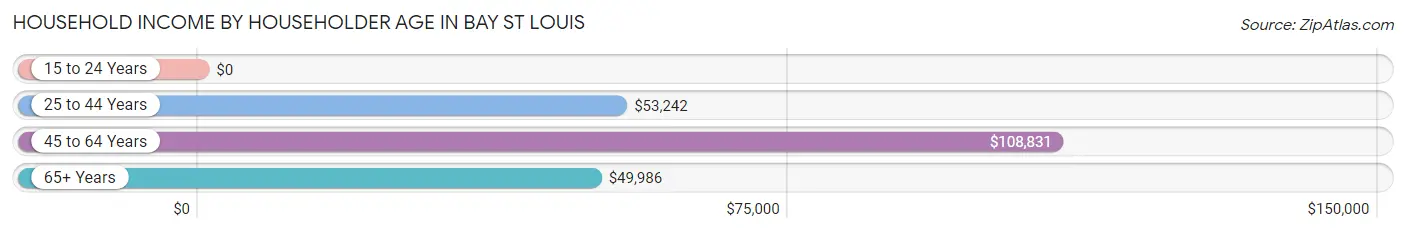
Household Income by Householder Age in Bay St Louis
The median household income in Bay St Louis is $63,508, with the highest median household income of $108,831 found in the 45 to 64 years age bracket for the primary householder. A total of 1,789 households (39.4%) fall into this category. Meanwhile, the 15 to 24 years age bracket for the primary householder has the lowest median household income of $0, with 165 households (3.6%) in this group.
| Income Bracket | # Households | Median Income |
| 15 to 24 Years | 165 (3.6%) | $0 |
| 25 to 44 Years | 957 (21.1%) | $53,242 |
| 45 to 64 Years | 1,789 (39.4%) | $108,831 |
| 65+ Years | 1,627 (35.8%) | $49,986 |
| Total | 4,538 (100.0%) | $63,508 |
Poverty in Bay St Louis
Income Below Poverty by Sex and Age in Bay St Louis
With 15.2% poverty level for males and 20.1% for females among the residents of Bay St Louis, 5 year old males and 15 year old females are the most vulnerable to poverty, with 31 males (100.0%) and 52 females (56.5%) in their respective age groups living below the poverty level.
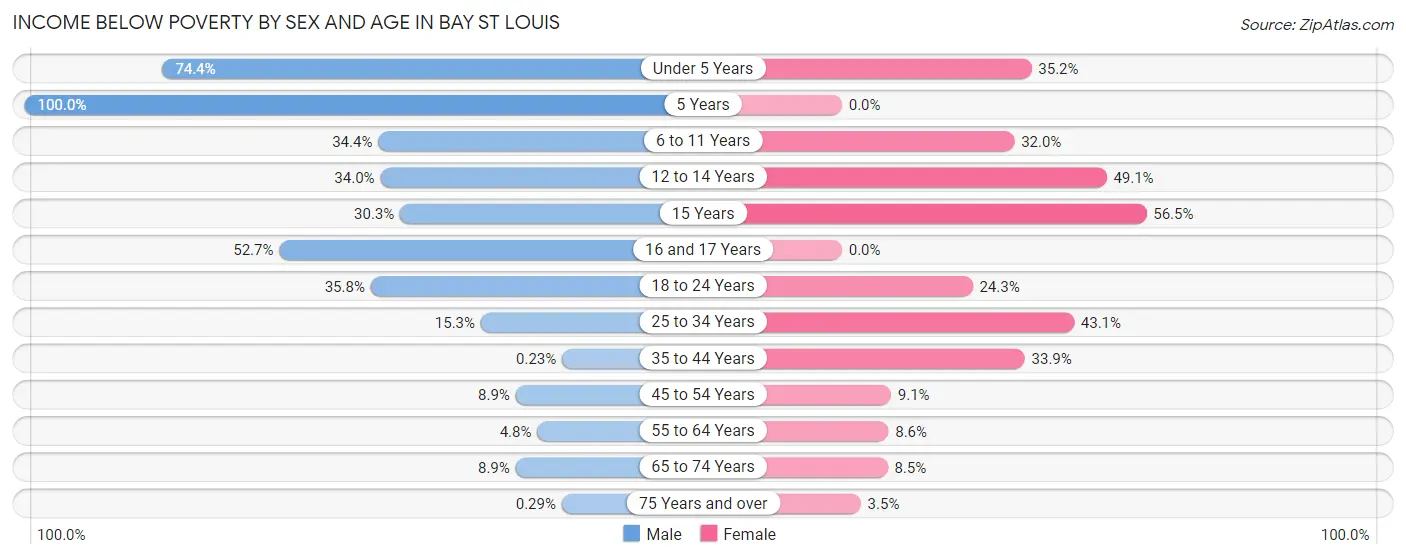
| Age Bracket | Male | Female |
| Under 5 Years | 160 (74.4%) | 38 (35.2%) |
| 5 Years | 31 (100.0%) | 0 (0.0%) |
| 6 to 11 Years | 89 (34.4%) | 104 (32.0%) |
| 12 to 14 Years | 54 (34.0%) | 111 (49.1%) |
| 15 Years | 10 (30.3%) | 52 (56.5%) |
| 16 and 17 Years | 29 (52.7%) | 0 (0.0%) |
| 18 to 24 Years | 69 (35.7%) | 106 (24.3%) |
| 25 to 34 Years | 49 (15.3%) | 202 (43.1%) |
| 35 to 44 Years | 1 (0.2%) | 208 (33.9%) |
| 45 to 54 Years | 71 (8.8%) | 65 (9.1%) |
| 55 to 64 Years | 39 (4.8%) | 74 (8.6%) |
| 65 to 74 Years | 69 (8.9%) | 71 (8.5%) |
| 75 Years and over | 1 (0.3%) | 17 (3.5%) |
| Total | 672 (15.2%) | 1,048 (20.1%) |
Income Above Poverty by Sex and Age in Bay St Louis
According to the poverty statistics in Bay St Louis, males aged 35 to 44 years and females aged 16 and 17 years are the age groups that are most secure financially, with 99.8% of males and 100.0% of females in these age groups living above the poverty line.
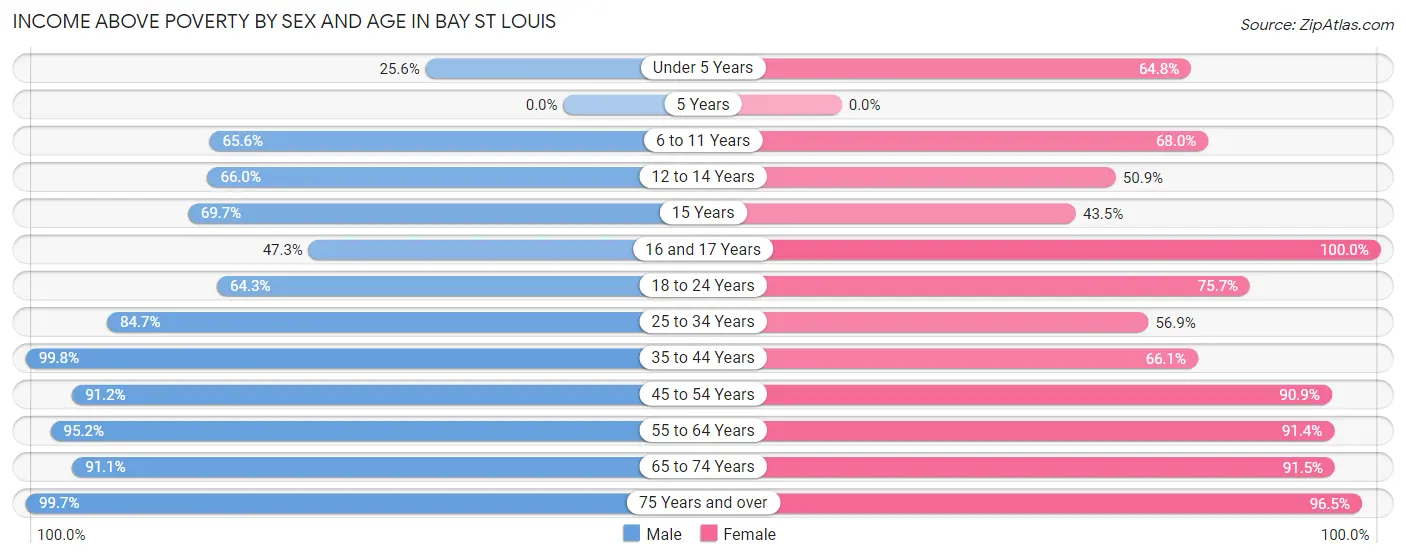
| Age Bracket | Male | Female |
| Under 5 Years | 55 (25.6%) | 70 (64.8%) |
| 5 Years | 0 (0.0%) | 0 (0.0%) |
| 6 to 11 Years | 170 (65.6%) | 221 (68.0%) |
| 12 to 14 Years | 105 (66.0%) | 115 (50.9%) |
| 15 Years | 23 (69.7%) | 40 (43.5%) |
| 16 and 17 Years | 26 (47.3%) | 45 (100.0%) |
| 18 to 24 Years | 124 (64.2%) | 331 (75.7%) |
| 25 to 34 Years | 271 (84.7%) | 267 (56.9%) |
| 35 to 44 Years | 437 (99.8%) | 405 (66.1%) |
| 45 to 54 Years | 731 (91.1%) | 649 (90.9%) |
| 55 to 64 Years | 768 (95.2%) | 783 (91.4%) |
| 65 to 74 Years | 710 (91.1%) | 767 (91.5%) |
| 75 Years and over | 342 (99.7%) | 469 (96.5%) |
| Total | 3,762 (84.8%) | 4,162 (79.9%) |
Income Below Poverty Among Married-Couple Families in Bay St Louis
The poverty statistics for married-couple families in Bay St Louis show that 5.2% or 117 of the total 2,248 families live below the poverty line. Families with 1 or 2 children have the highest poverty rate of 17.6%, comprising of 89 families. On the other hand, families with 3 or 4 children have the lowest poverty rate of 0.0%, which includes 0 families.
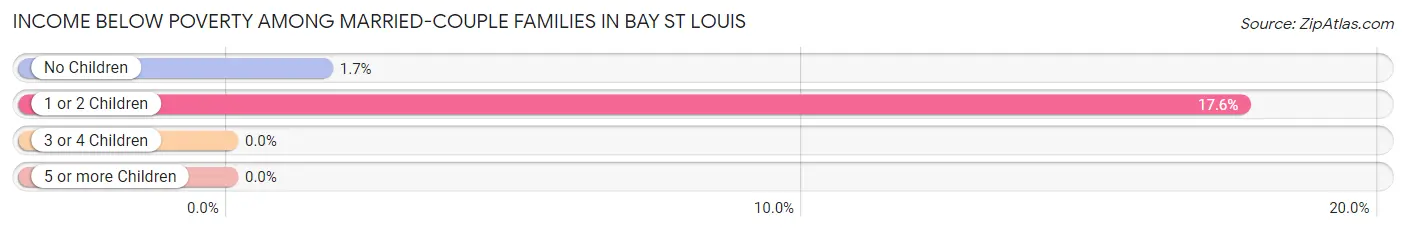
| Children | Above Poverty | Below Poverty |
| No Children | 1,671 (98.4%) | 28 (1.7%) |
| 1 or 2 Children | 416 (82.4%) | 89 (17.6%) |
| 3 or 4 Children | 44 (100.0%) | 0 (0.0%) |
| 5 or more Children | 0 (0.0%) | 0 (0.0%) |
| Total | 2,131 (94.8%) | 117 (5.2%) |
Income Below Poverty Among Single-Parent Households in Bay St Louis
According to the poverty data in Bay St Louis, 19.6% or 22 single-father households and 52.9% or 377 single-mother households are living below the poverty line. Among single-father households, those with no children have the highest poverty rate, with 8 households (34.8%) experiencing poverty. Likewise, among single-mother households, those with 3 or 4 children have the highest poverty rate, with 197 households (100.0%) falling below the poverty line.
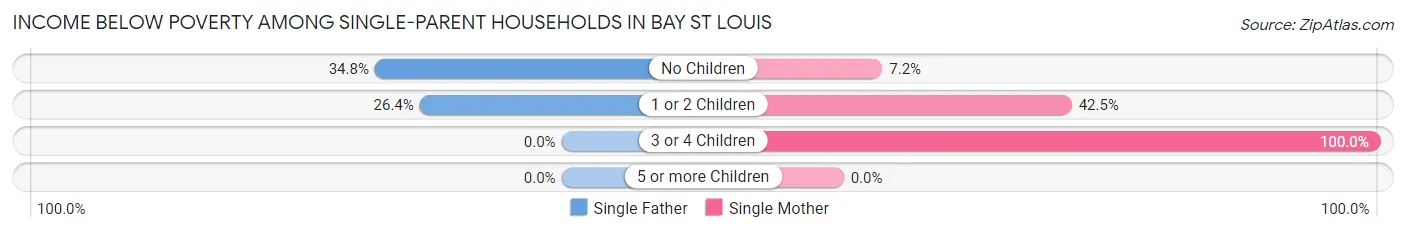
| Children | Single Father | Single Mother |
| No Children | 8 (34.8%) | 8 (7.2%) |
| 1 or 2 Children | 14 (26.4%) | 172 (42.5%) |
| 3 or 4 Children | 0 (0.0%) | 197 (100.0%) |
| 5 or more Children | 0 (0.0%) | 0 (0.0%) |
| Total | 22 (19.6%) | 377 (52.9%) |
Income Below Poverty Among Married-Couple vs Single-Parent Households in Bay St Louis
The poverty data for Bay St Louis shows that 117 of the married-couple family households (5.2%) and 399 of the single-parent households (48.4%) are living below the poverty level. Within the married-couple family households, those with 1 or 2 children have the highest poverty rate, with 89 households (17.6%) falling below the poverty line. Among the single-parent households, those with 3 or 4 children have the highest poverty rate, with 197 household (84.6%) living below poverty.
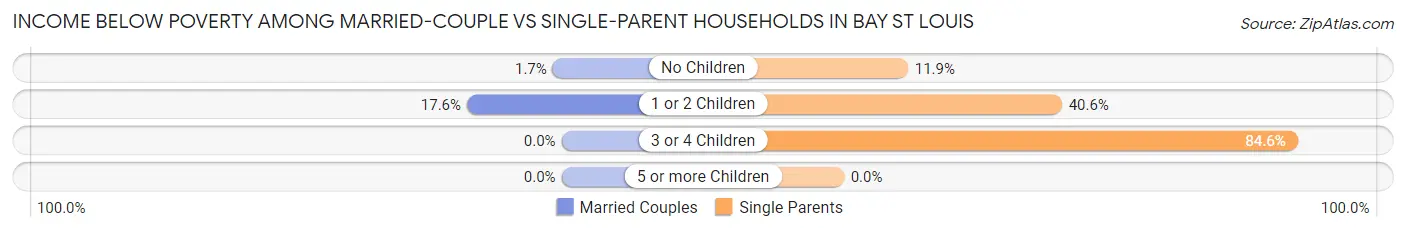
| Children | Married-Couple Families | Single-Parent Households |
| No Children | 28 (1.7%) | 16 (11.9%) |
| 1 or 2 Children | 89 (17.6%) | 186 (40.6%) |
| 3 or 4 Children | 0 (0.0%) | 197 (84.6%) |
| 5 or more Children | 0 (0.0%) | 0 (0.0%) |
| Total | 117 (5.2%) | 399 (48.4%) |
Race in Bay St Louis
The most populous races in Bay St Louis are White / Caucasian (7,445 | 76.1%), Black / African American (1,598 | 16.3%), and Two or more Races (350 | 3.6%).
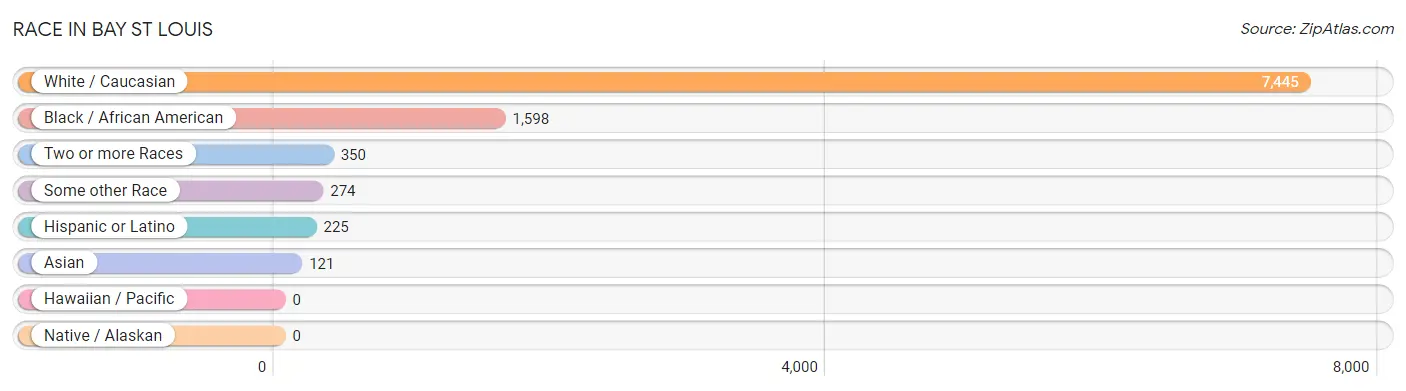
| Race | # Population | % Population |
| Asian | 121 | 1.2% |
| Black / African American | 1,598 | 16.3% |
| Hawaiian / Pacific | 0 | 0.0% |
| Hispanic or Latino | 225 | 2.3% |
| Native / Alaskan | 0 | 0.0% |
| White / Caucasian | 7,445 | 76.1% |
| Two or more Races | 350 | 3.6% |
| Some other Race | 274 | 2.8% |
| Total | 9,788 | 100.0% |
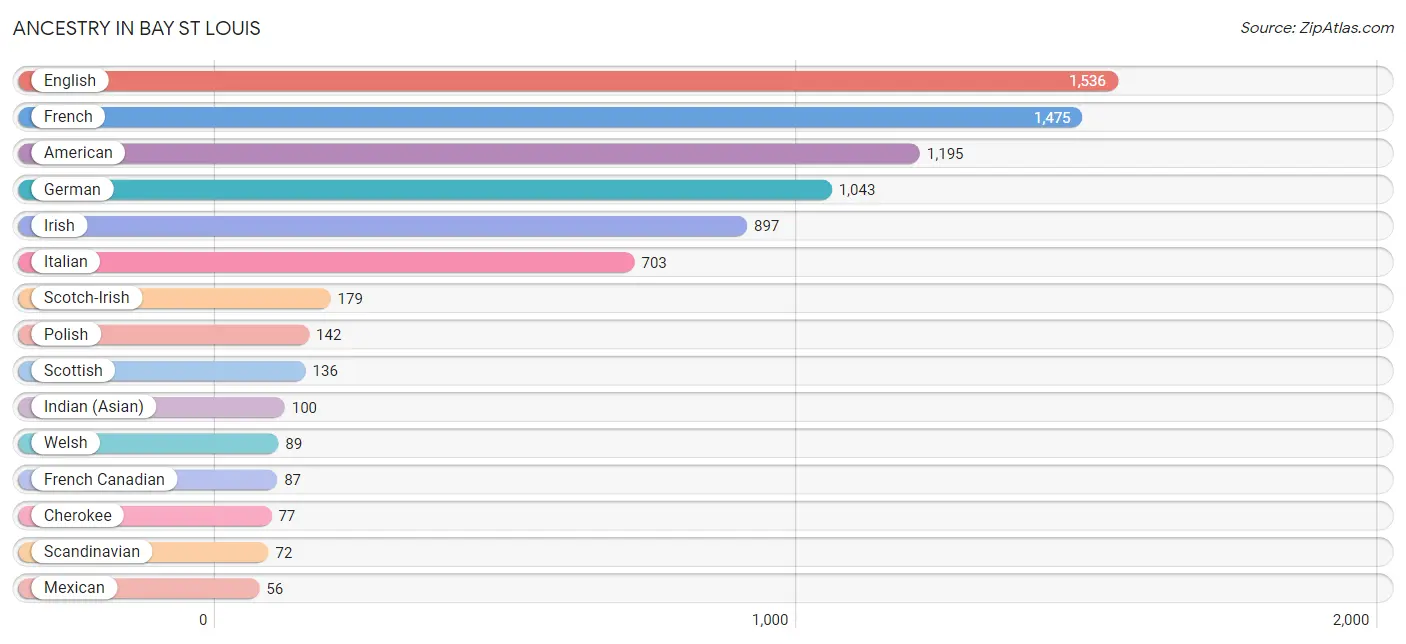
Ancestry in Bay St Louis
The most populous ancestries reported in Bay St Louis are English (1,536 | 15.7%), French (1,475 | 15.1%), American (1,195 | 12.2%), German (1,043 | 10.7%), and Irish (897 | 9.2%), together accounting for 62.8% of all Bay St Louis residents.
| Ancestry | # Population | % Population |
| African | 1 | 0.0% |
| American | 1,195 | 12.2% |
| Austrian | 15 | 0.2% |
| British | 12 | 0.1% |
| Cajun | 10 | 0.1% |
| Central American | 16 | 0.2% |
| Cherokee | 77 | 0.8% |
| Chippewa | 13 | 0.1% |
| Croatian | 19 | 0.2% |
| Dominican | 47 | 0.5% |
| Dutch | 43 | 0.4% |
| Eastern European | 11 | 0.1% |
| English | 1,536 | 15.7% |
| European | 31 | 0.3% |
| French | 1,475 | 15.1% |
| French Canadian | 87 | 0.9% |
| German | 1,043 | 10.7% |
| Indian (Asian) | 100 | 1.0% |
| Irish | 897 | 9.2% |
| Italian | 703 | 7.2% |
| Jamaican | 34 | 0.4% |
| Lithuanian | 6 | 0.1% |
| Mexican | 56 | 0.6% |
| Norwegian | 38 | 0.4% |
| Pennsylvania German | 23 | 0.2% |
| Polish | 142 | 1.5% |
| Puerto Rican | 41 | 0.4% |
| Russian | 11 | 0.1% |
| Salvadoran | 16 | 0.2% |
| Scandinavian | 72 | 0.7% |
| Scotch-Irish | 179 | 1.8% |
| Scottish | 136 | 1.4% |
| Slovak | 23 | 0.2% |
| Spaniard | 16 | 0.2% |
| Spanish | 49 | 0.5% |
| Subsaharan African | 1 | 0.0% |
| Swedish | 44 | 0.4% |
| Thai | 21 | 0.2% |
| Welsh | 89 | 0.9% | View All 39 Rows |
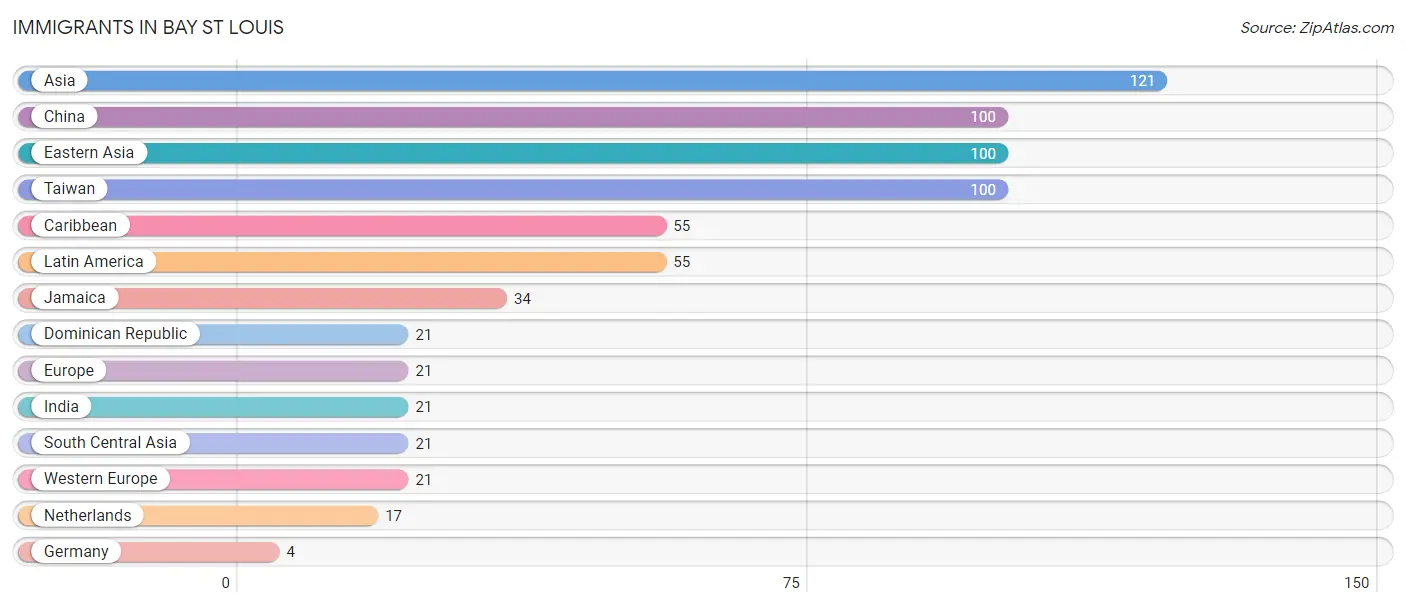
Immigrants in Bay St Louis
The most numerous immigrant groups reported in Bay St Louis came from Asia (121 | 1.2%), China (100 | 1.0%), Eastern Asia (100 | 1.0%), Taiwan (100 | 1.0%), and Caribbean (55 | 0.6%), together accounting for 4.9% of all Bay St Louis residents.
| Immigration Origin | # Population | % Population |
| Asia | 121 | 1.2% |
| Caribbean | 55 | 0.6% |
| China | 100 | 1.0% |
| Dominican Republic | 21 | 0.2% |
| Eastern Asia | 100 | 1.0% |
| Europe | 21 | 0.2% |
| Germany | 4 | 0.0% |
| India | 21 | 0.2% |
| Jamaica | 34 | 0.4% |
| Latin America | 55 | 0.6% |
| Netherlands | 17 | 0.2% |
| South Central Asia | 21 | 0.2% |
| Taiwan | 100 | 1.0% |
| Western Europe | 21 | 0.2% | View All 14 Rows |
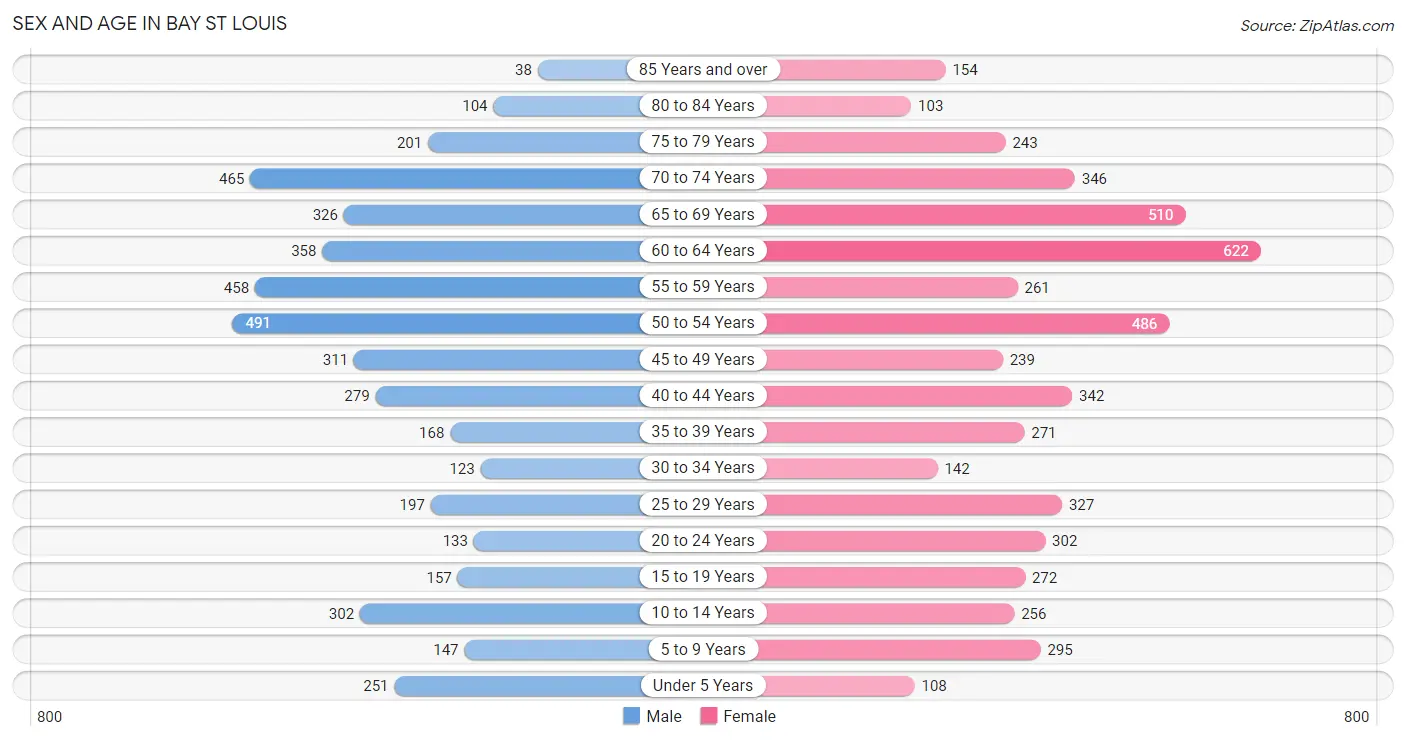
Sex and Age in Bay St Louis
Sex and Age in Bay St Louis
The most populous age groups in Bay St Louis are 50 to 54 Years (491 | 10.9%) for men and 60 to 64 Years (622 | 11.8%) for women.
| Age Bracket | Male | Female |
| Under 5 Years | 251 (5.6%) | 108 (2.1%) |
| 5 to 9 Years | 147 (3.3%) | 295 (5.6%) |
| 10 to 14 Years | 302 (6.7%) | 256 (4.9%) |
| 15 to 19 Years | 157 (3.5%) | 272 (5.1%) |
| 20 to 24 Years | 133 (2.9%) | 302 (5.7%) |
| 25 to 29 Years | 197 (4.4%) | 327 (6.2%) |
| 30 to 34 Years | 123 (2.7%) | 142 (2.7%) |
| 35 to 39 Years | 168 (3.7%) | 271 (5.1%) |
| 40 to 44 Years | 279 (6.2%) | 342 (6.5%) |
| 45 to 49 Years | 311 (6.9%) | 239 (4.5%) |
| 50 to 54 Years | 491 (10.9%) | 486 (9.2%) |
| 55 to 59 Years | 458 (10.2%) | 261 (4.9%) |
| 60 to 64 Years | 358 (7.9%) | 622 (11.8%) |
| 65 to 69 Years | 326 (7.2%) | 510 (9.7%) |
| 70 to 74 Years | 465 (10.3%) | 346 (6.6%) |
| 75 to 79 Years | 201 (4.5%) | 243 (4.6%) |
| 80 to 84 Years | 104 (2.3%) | 103 (1.9%) |
| 85 Years and over | 38 (0.8%) | 154 (2.9%) |
| Total | 4,509 (100.0%) | 5,279 (100.0%) |
Families and Households in Bay St Louis
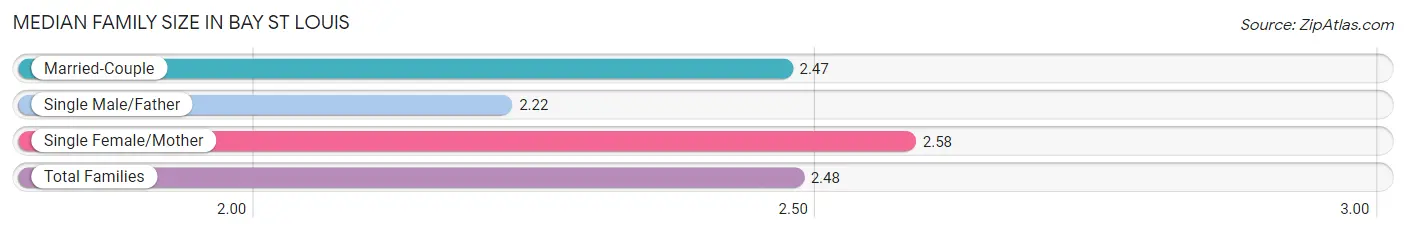
Median Family Size in Bay St Louis
The median family size in Bay St Louis is 2.48 persons per family, with single female/mother families (713 | 23.2%) accounting for the largest median family size of 2.58 persons per family. On the other hand, single male/father families (112 | 3.6%) represent the smallest median family size with 2.22 persons per family.
| Family Type | # Families | Family Size |
| Married-Couple | 2,248 (73.2%) | 2.47 |
| Single Male/Father | 112 (3.6%) | 2.22 |
| Single Female/Mother | 713 (23.2%) | 2.58 |
| Total Families | 3,073 (100.0%) | 2.48 |
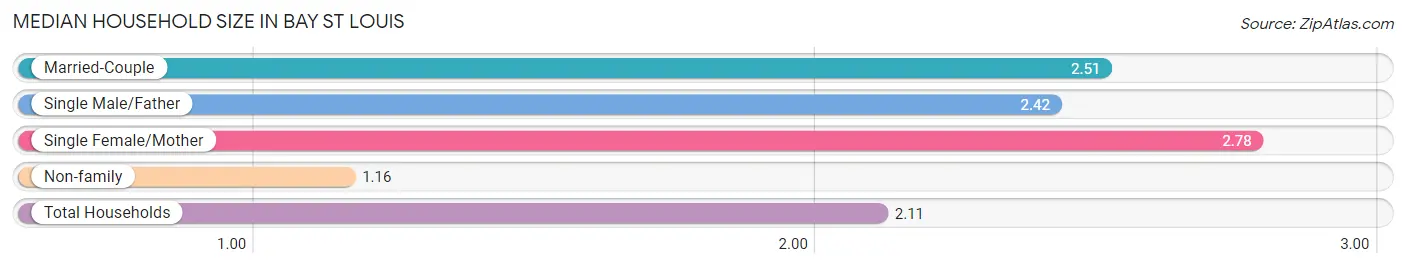
Median Household Size in Bay St Louis
The median household size in Bay St Louis is 2.11 persons per household, with single female/mother households (713 | 15.7%) accounting for the largest median household size of 2.78 persons per household. non-family households (1,465 | 32.3%) represent the smallest median household size with 1.16 persons per household.
| Household Type | # Households | Household Size |
| Married-Couple | 2,248 (49.5%) | 2.51 |
| Single Male/Father | 112 (2.5%) | 2.42 |
| Single Female/Mother | 713 (15.7%) | 2.78 |
| Non-family | 1,465 (32.3%) | 1.16 |
| Total Households | 4,538 (100.0%) | 2.11 |
Household Size by Marriage Status in Bay St Louis
Out of a total of 4,538 households in Bay St Louis, 3,073 (67.7%) are family households, while 1,465 (32.3%) are nonfamily households. The most numerous type of family households are 2-person households, comprising 1,787, and the most common type of nonfamily households are 1-person households, comprising 1,194.
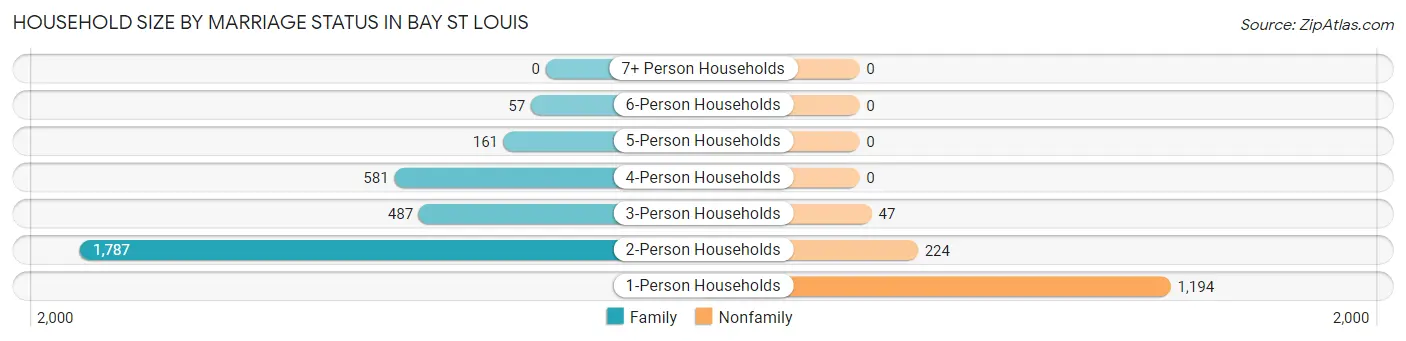
| Household Size | Family Households | Nonfamily Households |
| 1-Person Households | - | 1,194 (26.3%) |
| 2-Person Households | 1,787 (39.4%) | 224 (4.9%) |
| 3-Person Households | 487 (10.7%) | 47 (1.0%) |
| 4-Person Households | 581 (12.8%) | 0 (0.0%) |
| 5-Person Households | 161 (3.5%) | 0 (0.0%) |
| 6-Person Households | 57 (1.3%) | 0 (0.0%) |
| 7+ Person Households | 0 (0.0%) | 0 (0.0%) |
| Total | 3,073 (67.7%) | 1,465 (32.3%) |
Female Fertility in Bay St Louis
Fertility by Age in Bay St Louis
Average fertility rate in Bay St Louis is 120.0 births per 1,000 women. Women in the age bracket of 20 to 34 years have the highest fertility rate with 156.0 births per 1,000 women. Women in the age bracket of 20 to 34 years acount for 52.4% of all women with births.
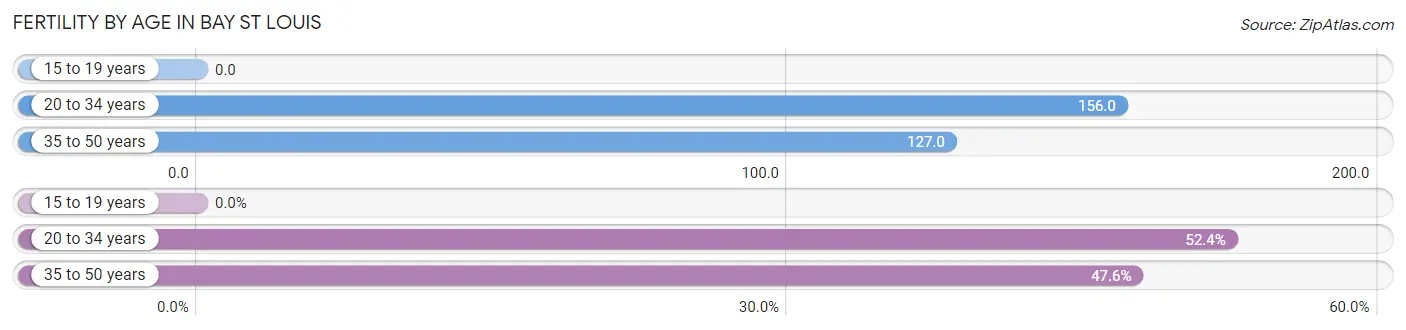
| Age Bracket | Women with Births | Births / 1,000 Women |
| 15 to 19 years | 0 (0.0%) | 0.0 |
| 20 to 34 years | 120 (52.4%) | 156.0 |
| 35 to 50 years | 109 (47.6%) | 127.0 |
| Total | 229 (100.0%) | 120.0 |
Fertility by Age by Marriage Status in Bay St Louis
22.7% of women with births (229) in Bay St Louis are married. The highest percentage of unmarried women with births falls into 20 to 34 years age bracket with 100.0% of them unmarried at the time of birth, while the lowest percentage of unmarried women with births belong to 35 to 50 years age bracket with 52.3% of them unmarried.
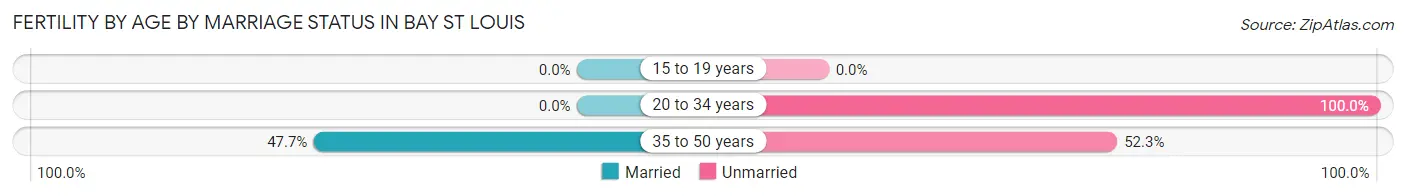
| Age Bracket | Married | Unmarried |
| 15 to 19 years | 0 (0.0%) | 0 (0.0%) |
| 20 to 34 years | 0 (0.0%) | 120 (100.0%) |
| 35 to 50 years | 52 (47.7%) | 57 (52.3%) |
| Total | 52 (22.7%) | 177 (77.3%) |
Fertility by Education in Bay St Louis
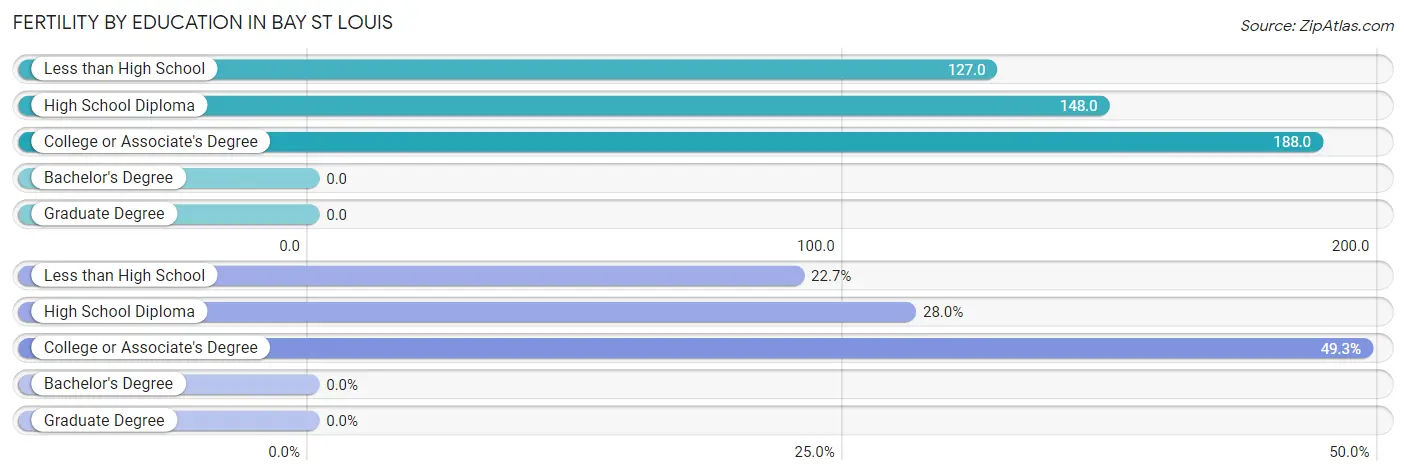
| Educational Attainment | Women with Births | Births / 1,000 Women |
| Less than High School | 52 (22.7%) | 127.0 |
| High School Diploma | 64 (28.0%) | 148.0 |
| College or Associate's Degree | 113 (49.3%) | 188.0 |
| Bachelor's Degree | 0 (0.0%) | 0.0 |
| Graduate Degree | 0 (0.0%) | 0.0 |
| Total | 229 (100.0%) | 120.0 |
Fertility by Education by Marriage Status in Bay St Louis
77.3% of women with births in Bay St Louis are unmarried. Women with the educational attainment of less than high school are most likely to be married with 100.0% of them married at childbirth, while women with the educational attainment of high school diploma are least likely to be married with 100.0% of them unmarried at childbirth.
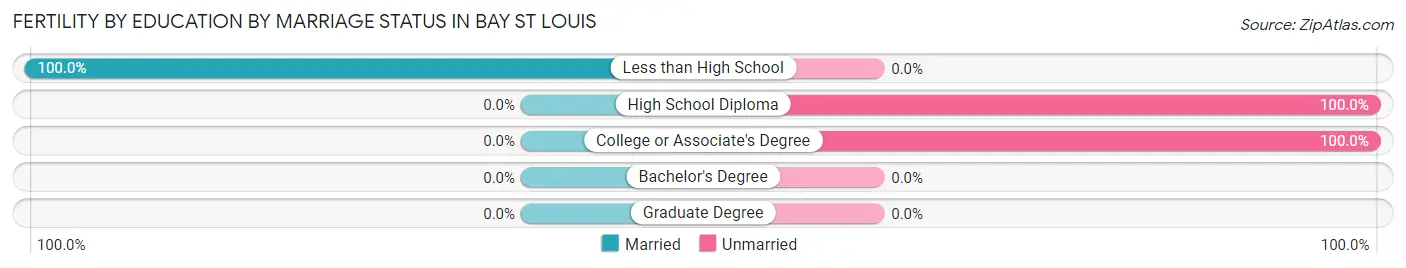
| Educational Attainment | Married | Unmarried |
| Less than High School | 52 (100.0%) | 0 (0.0%) |
| High School Diploma | 0 (0.0%) | 64 (100.0%) |
| College or Associate's Degree | 0 (0.0%) | 113 (100.0%) |
| Bachelor's Degree | 0 (0.0%) | 0 (0.0%) |
| Graduate Degree | 0 (0.0%) | 0 (0.0%) |
| Total | 52 (22.7%) | 177 (77.3%) |
Employment Characteristics in Bay St Louis
Employment by Class of Employer in Bay St Louis
Among the 4,131 employed individuals in Bay St Louis, private company employees (2,386 | 57.8%), local government employees (429 | 10.4%), and not-for-profit organizations (363 | 8.8%) make up the most common classes of employment.
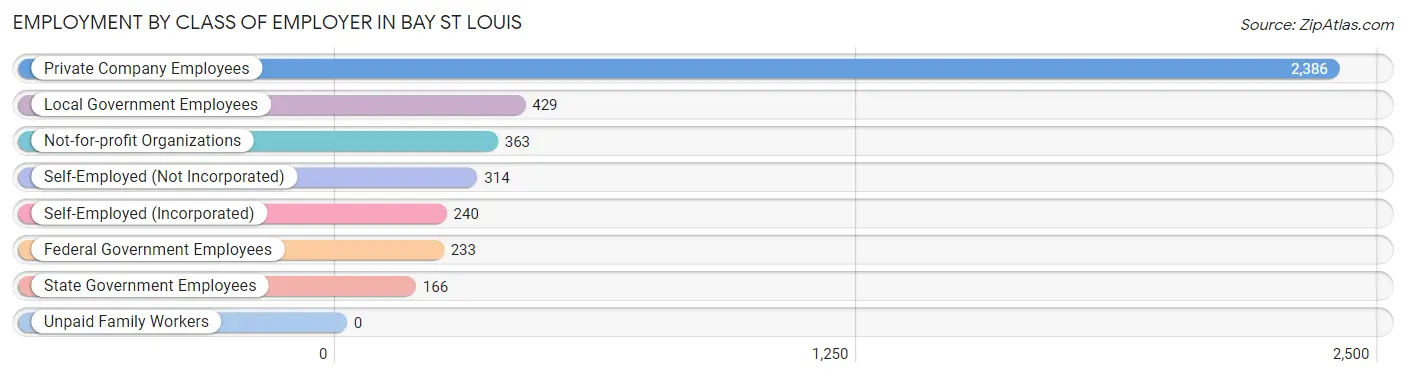
| Employer Class | # Employees | % Employees |
| Private Company Employees | 2,386 | 57.8% |
| Self-Employed (Incorporated) | 240 | 5.8% |
| Self-Employed (Not Incorporated) | 314 | 7.6% |
| Not-for-profit Organizations | 363 | 8.8% |
| Local Government Employees | 429 | 10.4% |
| State Government Employees | 166 | 4.0% |
| Federal Government Employees | 233 | 5.6% |
| Unpaid Family Workers | 0 | 0.0% |
| Total | 4,131 | 100.0% |
Employment Status by Age in Bay St Louis
According to the labor force statistics for Bay St Louis, out of the total population over 16 years of age (8,304), 56.3% or 4,675 individuals are in the labor force, with 9.2% or 430 of them unemployed. The age group with the highest labor force participation rate is 25 to 29 years, with 92.6% or 485 individuals in the labor force. Within the labor force, the 25 to 29 years age range has the highest percentage of unemployed individuals, with 32.8% or 159 of them being unemployed.
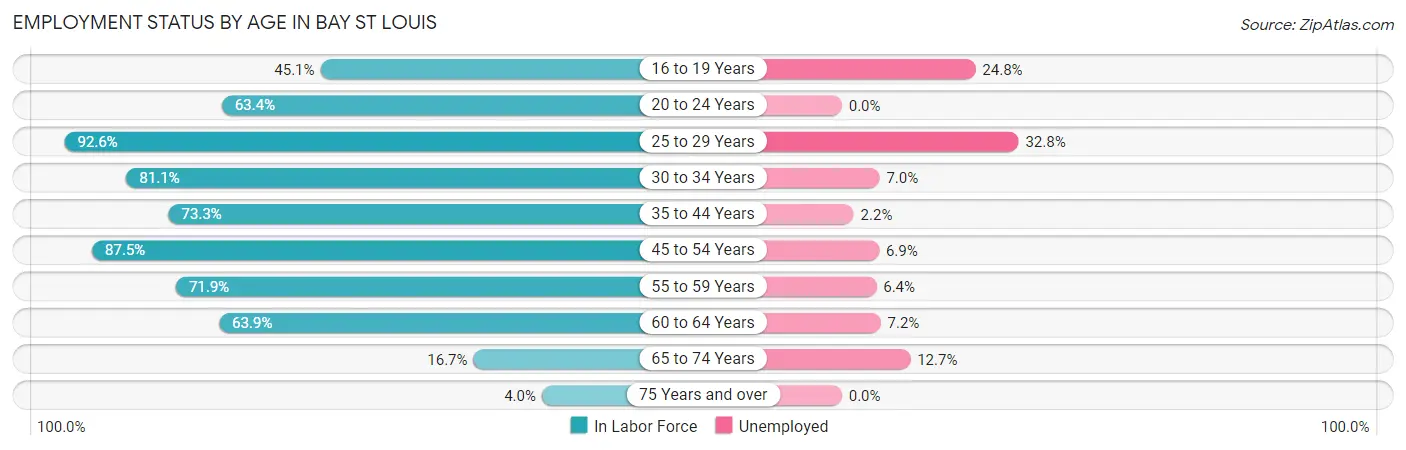
| Age Bracket | In Labor Force | Unemployed |
| 16 to 19 Years | 137 (45.1%) | 34 (24.8%) |
| 20 to 24 Years | 276 (63.4%) | 0 (0.0%) |
| 25 to 29 Years | 485 (92.6%) | 159 (32.8%) |
| 30 to 34 Years | 215 (81.1%) | 15 (7.0%) |
| 35 to 44 Years | 777 (73.3%) | 17 (2.2%) |
| 45 to 54 Years | 1,336 (87.5%) | 92 (6.9%) |
| 55 to 59 Years | 517 (71.9%) | 33 (6.4%) |
| 60 to 64 Years | 626 (63.9%) | 45 (7.2%) |
| 65 to 74 Years | 275 (16.7%) | 35 (12.7%) |
| 75 Years and over | 34 (4.0%) | 0 (0.0%) |
| Total | 4,675 (56.3%) | 430 (9.2%) |
Employment Status by Educational Attainment in Bay St Louis
According to labor force statistics for Bay St Louis, 78.0% of individuals (3,958) out of the total population between 25 and 64 years of age (5,075) are in the labor force, with 9.1% or 360 of them being unemployed. The group with the highest labor force participation rate are those with the educational attainment of bachelor's degree or higher, with 86.2% or 1,432 individuals in the labor force. Within the labor force, individuals with less than high school education have the highest percentage of unemployment, with 56.4% or 79 of them being unemployed.
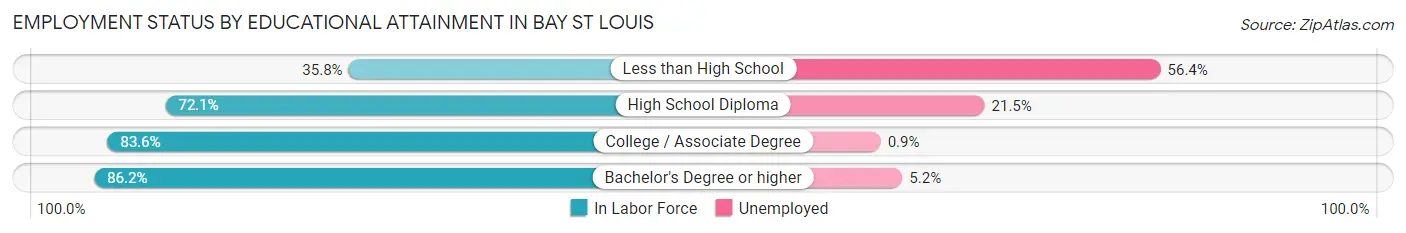
| Educational Attainment | In Labor Force | Unemployed |
| Less than High School | 140 (35.8%) | 221 (56.4%) |
| High School Diploma | 895 (72.1%) | 267 (21.5%) |
| College / Associate Degree | 1,489 (83.6%) | 16 (0.9%) |
| Bachelor's Degree or higher | 1,432 (86.2%) | 86 (5.2%) |
| Total | 3,958 (78.0%) | 462 (9.1%) |
Employment Occupations by Sex in Bay St Louis
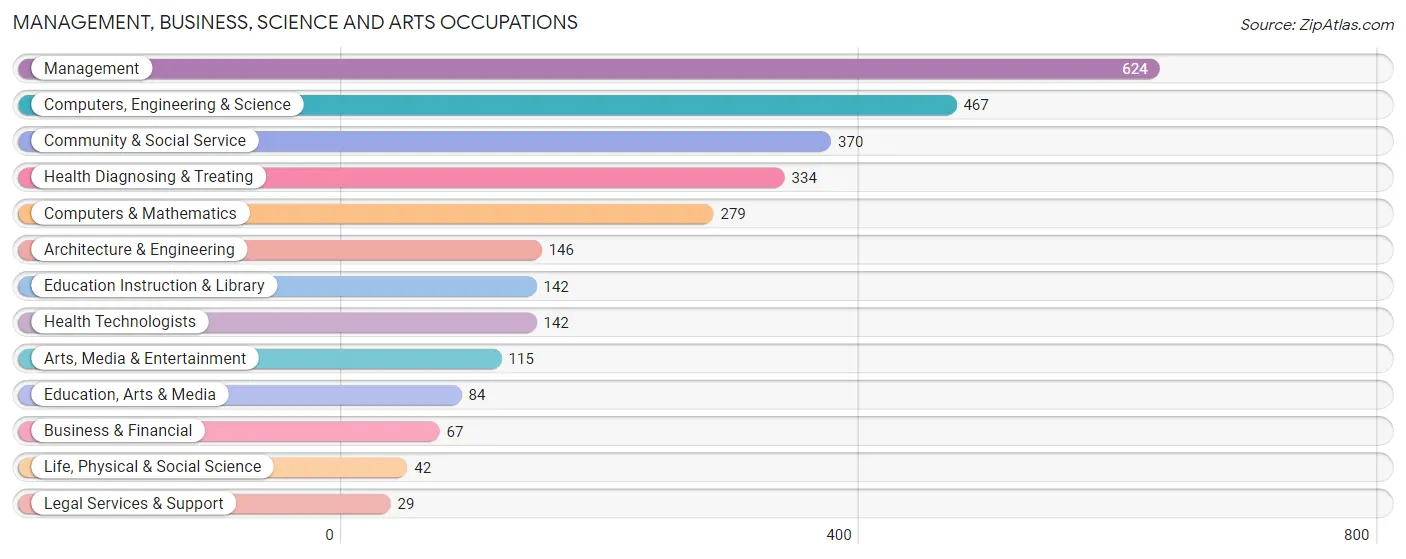
Management, Business, Science and Arts Occupations
The most common Management, Business, Science and Arts occupations in Bay St Louis are Management (624 | 14.9%), Computers, Engineering & Science (467 | 11.1%), Community & Social Service (370 | 8.8%), Health Diagnosing & Treating (334 | 8.0%), and Computers & Mathematics (279 | 6.7%).
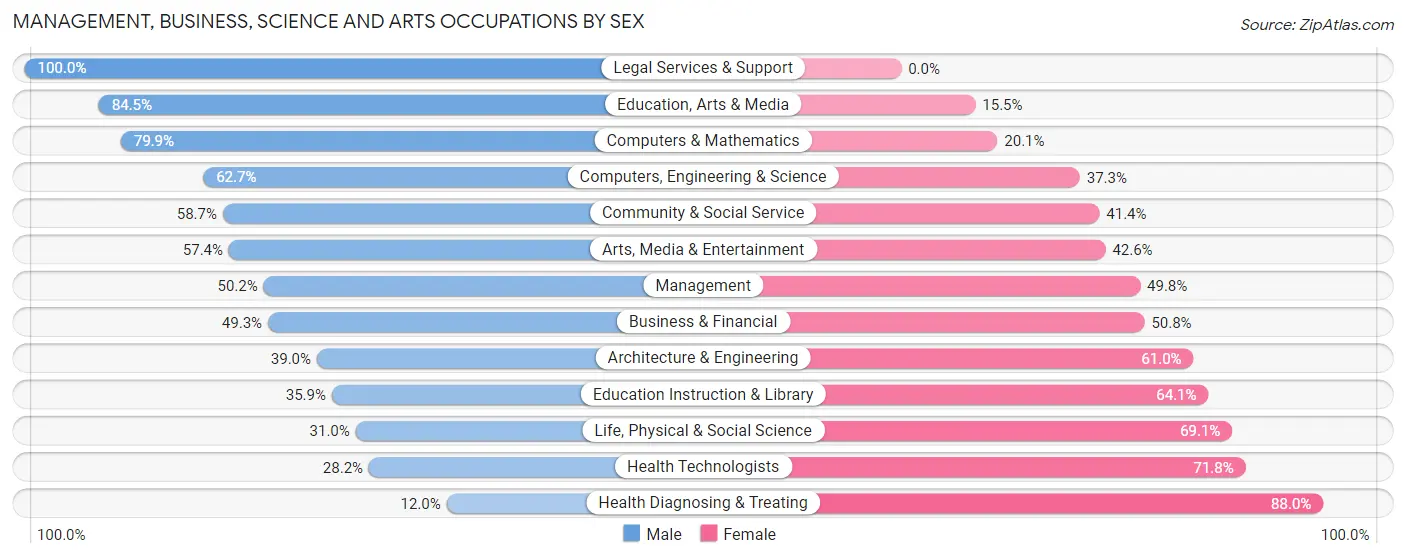
Management, Business, Science and Arts Occupations by Sex
Within the Management, Business, Science and Arts occupations in Bay St Louis, the most male-oriented occupations are Legal Services & Support (100.0%), Education, Arts & Media (84.5%), and Computers & Mathematics (79.9%), while the most female-oriented occupations are Health Diagnosing & Treating (88.0%), Health Technologists (71.8%), and Life, Physical & Social Science (69.1%).
| Occupation | Male | Female |
| Management | 313 (50.2%) | 311 (49.8%) |
| Business & Financial | 33 (49.2%) | 34 (50.7%) |
| Computers, Engineering & Science | 293 (62.7%) | 174 (37.3%) |
| Computers & Mathematics | 223 (79.9%) | 56 (20.1%) |
| Architecture & Engineering | 57 (39.0%) | 89 (61.0%) |
| Life, Physical & Social Science | 13 (30.9%) | 29 (69.1%) |
| Community & Social Service | 217 (58.7%) | 153 (41.3%) |
| Education, Arts & Media | 71 (84.5%) | 13 (15.5%) |
| Legal Services & Support | 29 (100.0%) | 0 (0.0%) |
| Education Instruction & Library | 51 (35.9%) | 91 (64.1%) |
| Arts, Media & Entertainment | 66 (57.4%) | 49 (42.6%) |
| Health Diagnosing & Treating | 40 (12.0%) | 294 (88.0%) |
| Health Technologists | 40 (28.2%) | 102 (71.8%) |
| Total (Category) | 896 (48.1%) | 966 (51.9%) |
| Total (Overall) | 2,048 (48.8%) | 2,150 (51.2%) |
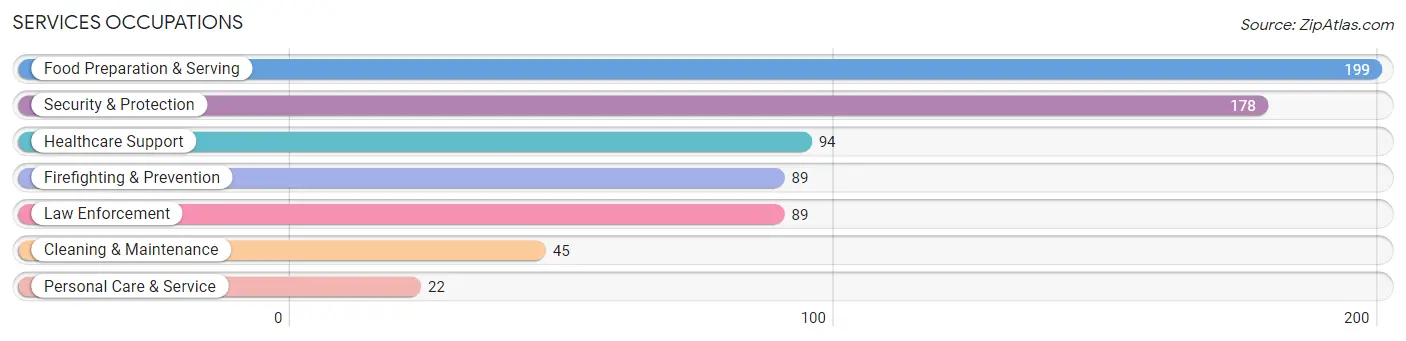
Services Occupations
The most common Services occupations in Bay St Louis are Food Preparation & Serving (199 | 4.7%), Security & Protection (178 | 4.2%), Healthcare Support (94 | 2.2%), Firefighting & Prevention (89 | 2.1%), and Law Enforcement (89 | 2.1%).
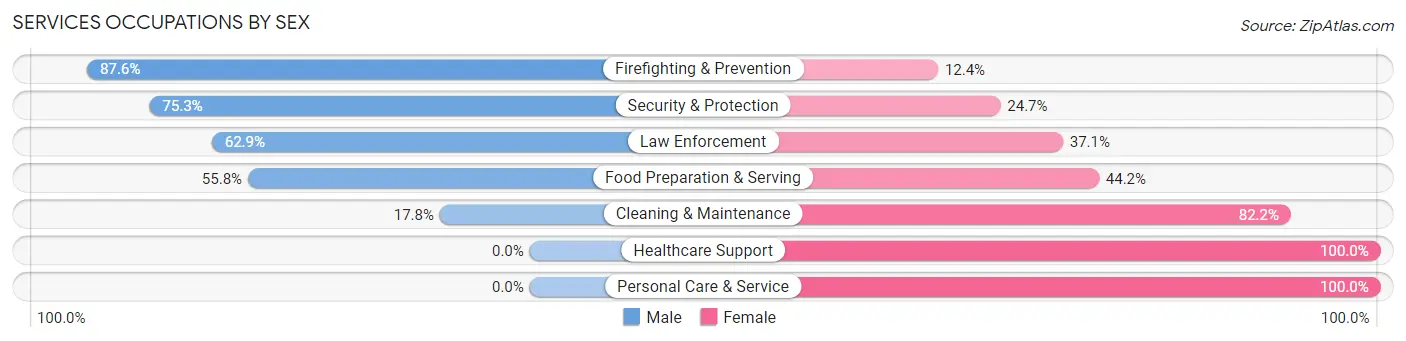
Services Occupations by Sex
Within the Services occupations in Bay St Louis, the most male-oriented occupations are Firefighting & Prevention (87.6%), Security & Protection (75.3%), and Law Enforcement (62.9%), while the most female-oriented occupations are Healthcare Support (100.0%), Personal Care & Service (100.0%), and Cleaning & Maintenance (82.2%).
| Occupation | Male | Female |
| Healthcare Support | 0 (0.0%) | 94 (100.0%) |
| Security & Protection | 134 (75.3%) | 44 (24.7%) |
| Firefighting & Prevention | 78 (87.6%) | 11 (12.4%) |
| Law Enforcement | 56 (62.9%) | 33 (37.1%) |
| Food Preparation & Serving | 111 (55.8%) | 88 (44.2%) |
| Cleaning & Maintenance | 8 (17.8%) | 37 (82.2%) |
| Personal Care & Service | 0 (0.0%) | 22 (100.0%) |
| Total (Category) | 253 (47.0%) | 285 (53.0%) |
| Total (Overall) | 2,048 (48.8%) | 2,150 (51.2%) |
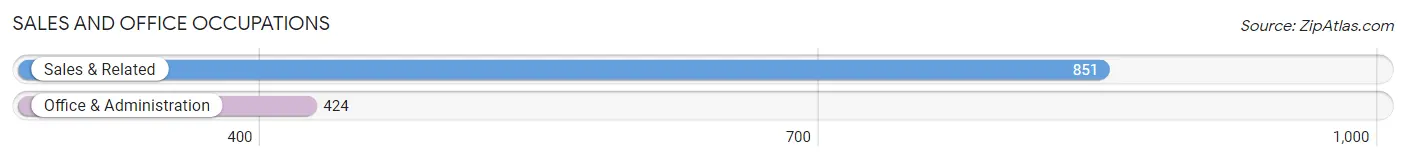
Sales and Office Occupations
The most common Sales and Office occupations in Bay St Louis are Sales & Related (851 | 20.3%), and Office & Administration (424 | 10.1%).
Sales and Office Occupations by Sex
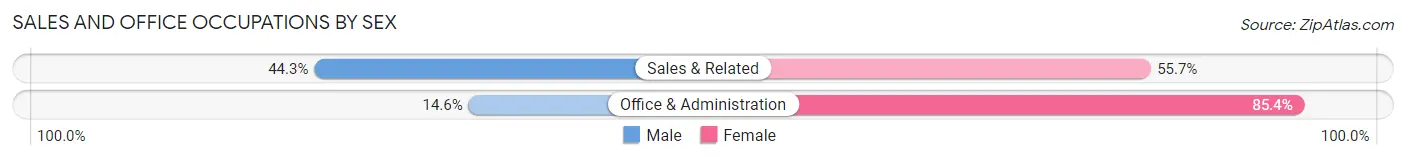
| Occupation | Male | Female |
| Sales & Related | 377 (44.3%) | 474 (55.7%) |
| Office & Administration | 62 (14.6%) | 362 (85.4%) |
| Total (Category) | 439 (34.4%) | 836 (65.6%) |
| Total (Overall) | 2,048 (48.8%) | 2,150 (51.2%) |
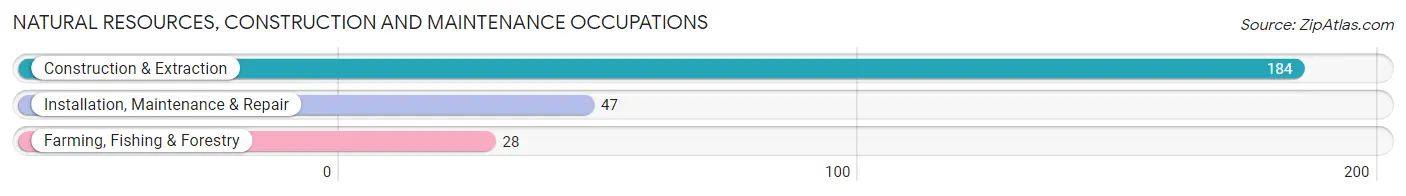
Natural Resources, Construction and Maintenance Occupations
The most common Natural Resources, Construction and Maintenance occupations in Bay St Louis are Construction & Extraction (184 | 4.4%), Installation, Maintenance & Repair (47 | 1.1%), and Farming, Fishing & Forestry (28 | 0.7%).
Natural Resources, Construction and Maintenance Occupations by Sex
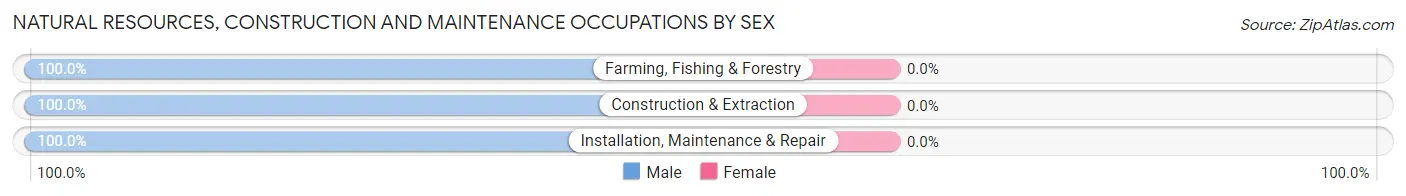
| Occupation | Male | Female |
| Farming, Fishing & Forestry | 28 (100.0%) | 0 (0.0%) |
| Construction & Extraction | 184 (100.0%) | 0 (0.0%) |
| Installation, Maintenance & Repair | 47 (100.0%) | 0 (0.0%) |
| Total (Category) | 259 (100.0%) | 0 (0.0%) |
| Total (Overall) | 2,048 (48.8%) | 2,150 (51.2%) |
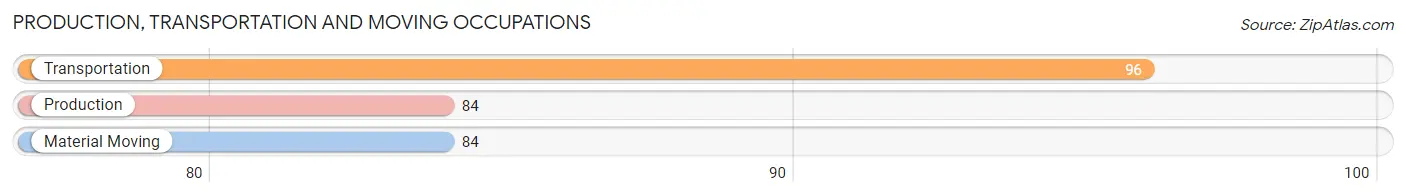
Production, Transportation and Moving Occupations
The most common Production, Transportation and Moving occupations in Bay St Louis are Transportation (96 | 2.3%), Production (84 | 2.0%), and Material Moving (84 | 2.0%).
Production, Transportation and Moving Occupations by Sex
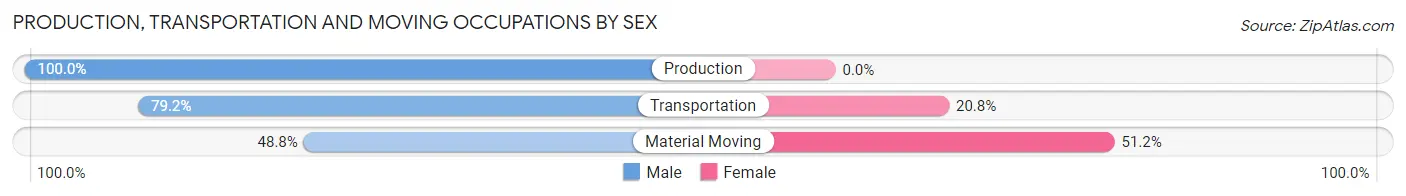
| Occupation | Male | Female |
| Production | 84 (100.0%) | 0 (0.0%) |
| Transportation | 76 (79.2%) | 20 (20.8%) |
| Material Moving | 41 (48.8%) | 43 (51.2%) |
| Total (Category) | 201 (76.1%) | 63 (23.9%) |
| Total (Overall) | 2,048 (48.8%) | 2,150 (51.2%) |
Employment Industries by Sex in Bay St Louis
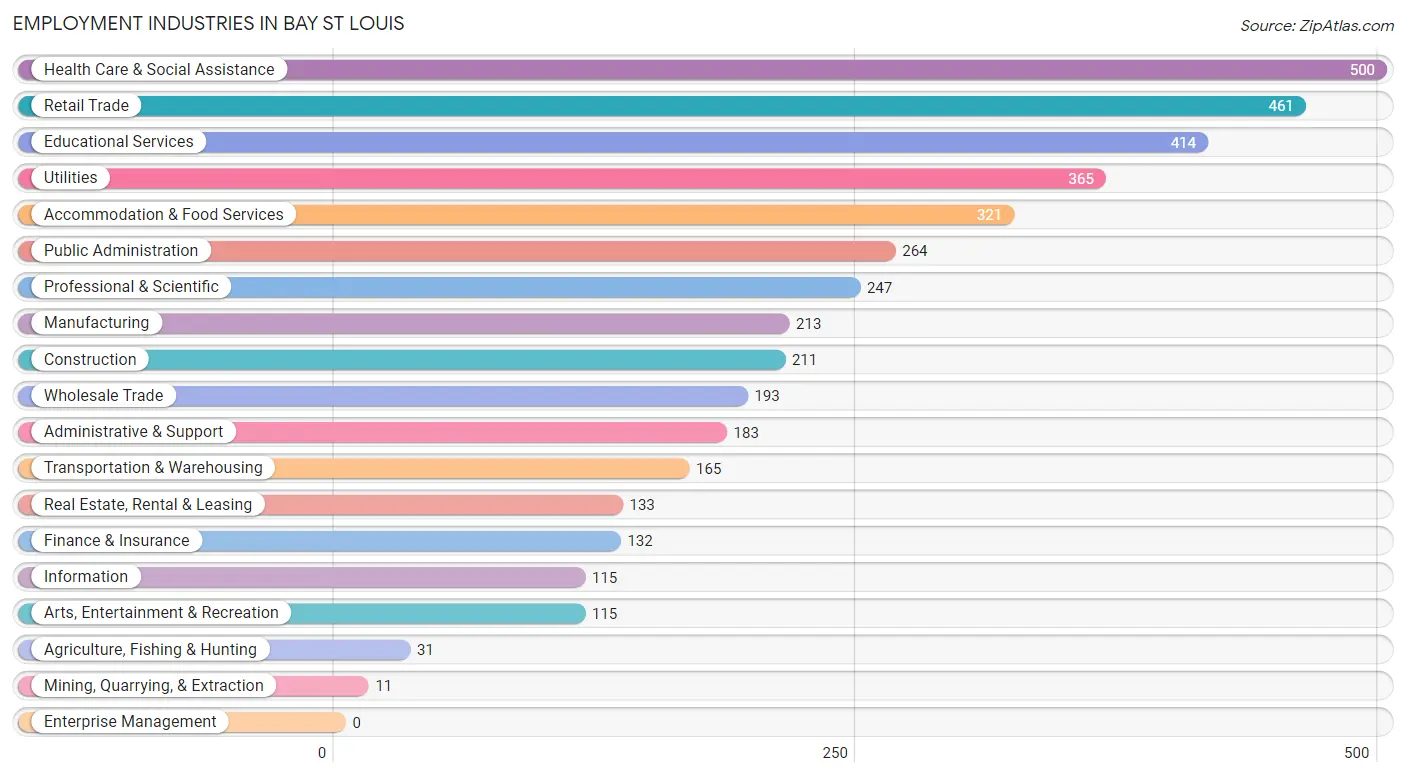
Employment Industries in Bay St Louis
The major employment industries in Bay St Louis include Health Care & Social Assistance (500 | 11.9%), Retail Trade (461 | 11.0%), Educational Services (414 | 9.9%), Utilities (365 | 8.7%), and Accommodation & Food Services (321 | 7.6%).
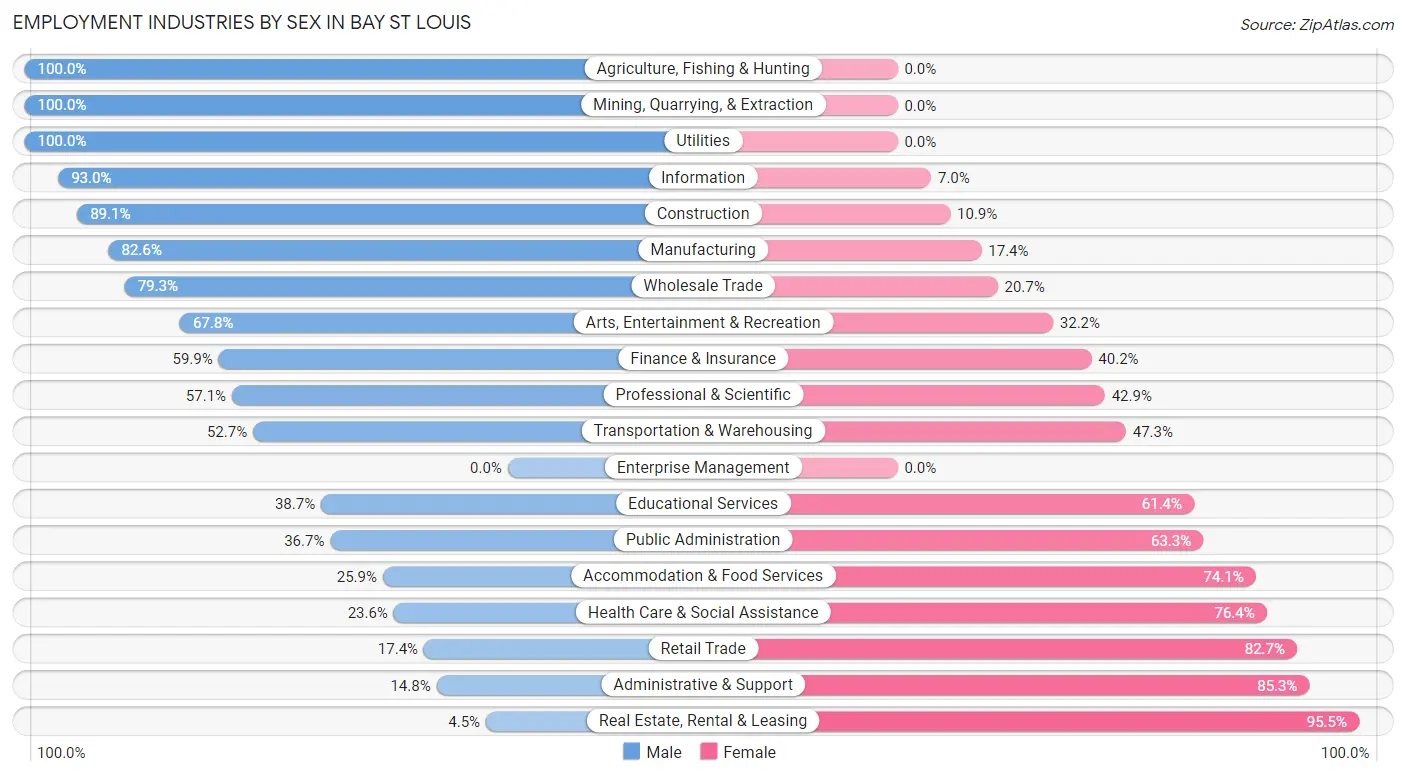
Employment Industries by Sex in Bay St Louis
The Bay St Louis industries that see more men than women are Agriculture, Fishing & Hunting (100.0%), Mining, Quarrying, & Extraction (100.0%), and Utilities (100.0%), whereas the industries that tend to have a higher number of women are Real Estate, Rental & Leasing (95.5%), Administrative & Support (85.3%), and Retail Trade (82.7%).
| Industry | Male | Female |
| Agriculture, Fishing & Hunting | 31 (100.0%) | 0 (0.0%) |
| Mining, Quarrying, & Extraction | 11 (100.0%) | 0 (0.0%) |
| Construction | 188 (89.1%) | 23 (10.9%) |
| Manufacturing | 176 (82.6%) | 37 (17.4%) |
| Wholesale Trade | 153 (79.3%) | 40 (20.7%) |
| Retail Trade | 80 (17.3%) | 381 (82.7%) |
| Transportation & Warehousing | 87 (52.7%) | 78 (47.3%) |
| Utilities | 365 (100.0%) | 0 (0.0%) |
| Information | 107 (93.0%) | 8 (7.0%) |
| Finance & Insurance | 79 (59.9%) | 53 (40.2%) |
| Real Estate, Rental & Leasing | 6 (4.5%) | 127 (95.5%) |
| Professional & Scientific | 141 (57.1%) | 106 (42.9%) |
| Enterprise Management | 0 (0.0%) | 0 (0.0%) |
| Administrative & Support | 27 (14.7%) | 156 (85.3%) |
| Educational Services | 160 (38.7%) | 254 (61.4%) |
| Health Care & Social Assistance | 118 (23.6%) | 382 (76.4%) |
| Arts, Entertainment & Recreation | 78 (67.8%) | 37 (32.2%) |
| Accommodation & Food Services | 83 (25.9%) | 238 (74.1%) |
| Public Administration | 97 (36.7%) | 167 (63.3%) |
| Total | 2,048 (48.8%) | 2,150 (51.2%) |
Education in Bay St Louis
School Enrollment in Bay St Louis
The most common levels of schooling among the 1,646 students in Bay St Louis are middle school (516 | 31.4%), high school (370 | 22.5%), and elementary school (359 | 21.8%).
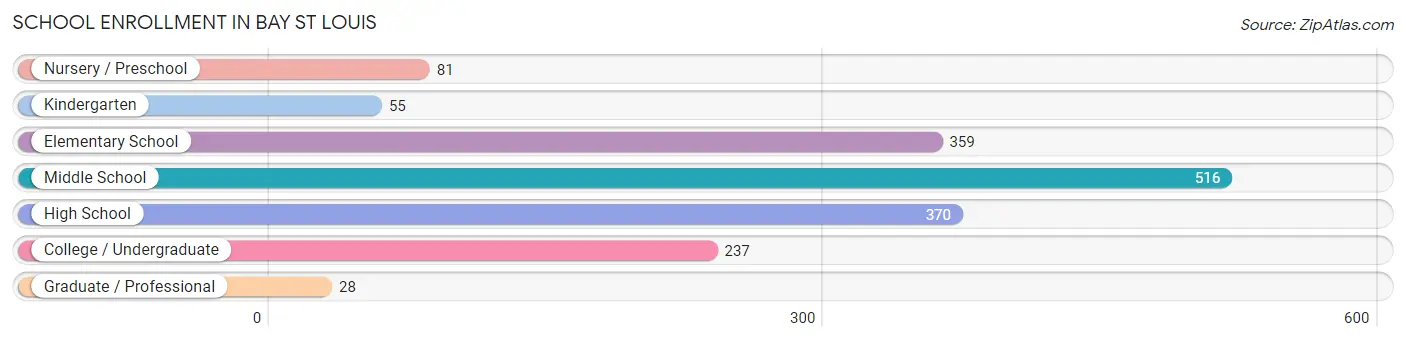
| School Level | # Students | % Students |
| Nursery / Preschool | 81 | 4.9% |
| Kindergarten | 55 | 3.3% |
| Elementary School | 359 | 21.8% |
| Middle School | 516 | 31.4% |
| High School | 370 | 22.5% |
| College / Undergraduate | 237 | 14.4% |
| Graduate / Professional | 28 | 1.7% |
| Total | 1,646 | 100.0% |
School Enrollment by Age by Funding Source in Bay St Louis
Out of a total of 1,646 students who are enrolled in schools in Bay St Louis, 235 (14.3%) attend a private institution, while the remaining 1,411 (85.7%) are enrolled in public schools. The age group of 35 years and over has the highest likelihood of being enrolled in private schools, with 19 (27.9% in the age bracket) enrolled. Conversely, the age group of 3 to 4 year olds has the lowest likelihood of being enrolled in a private school, with 50 (100.0% in the age bracket) attending a public institution.
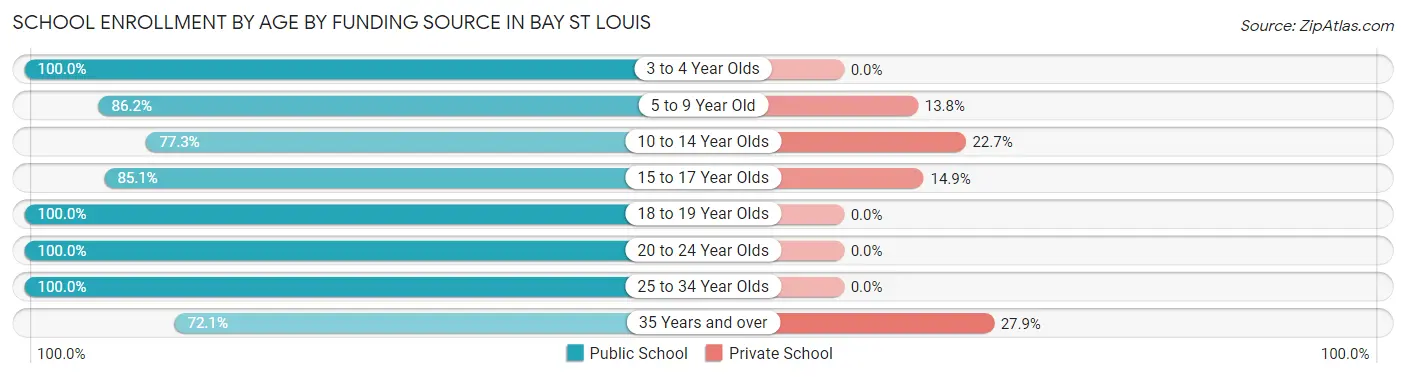
| Age Bracket | Public School | Private School |
| 3 to 4 Year Olds | 50 (100.0%) | 0 (0.0%) |
| 5 to 9 Year Old | 381 (86.2%) | 61 (13.8%) |
| 10 to 14 Year Olds | 419 (77.3%) | 123 (22.7%) |
| 15 to 17 Year Olds | 183 (85.1%) | 32 (14.9%) |
| 18 to 19 Year Olds | 169 (100.0%) | 0 (0.0%) |
| 20 to 24 Year Olds | 145 (100.0%) | 0 (0.0%) |
| 25 to 34 Year Olds | 15 (100.0%) | 0 (0.0%) |
| 35 Years and over | 49 (72.1%) | 19 (27.9%) |
| Total | 1,411 (85.7%) | 235 (14.3%) |
Educational Attainment by Field of Study in Bay St Louis
Education (691 | 24.1%), business (496 | 17.3%), psychology (253 | 8.8%), engineering (193 | 6.7%), and social sciences (171 | 6.0%) are the most common fields of study among 2,867 individuals in Bay St Louis who have obtained a bachelor's degree or higher.
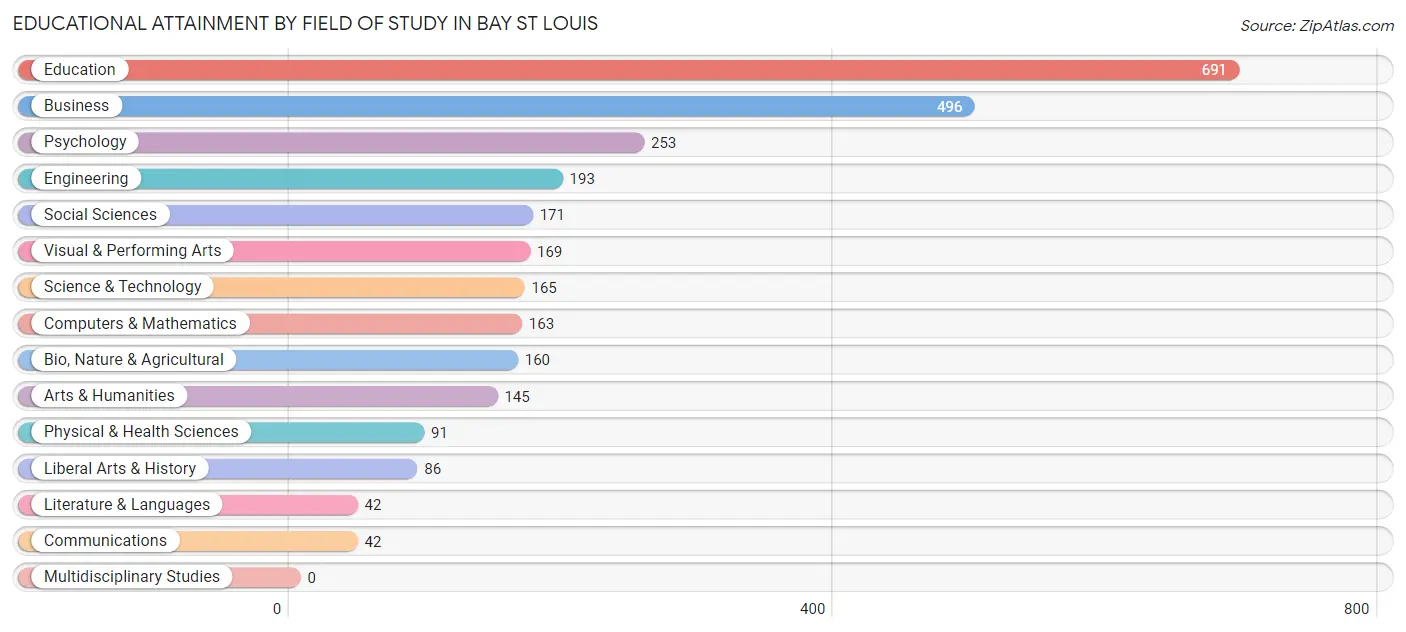
| Field of Study | # Graduates | % Graduates |
| Computers & Mathematics | 163 | 5.7% |
| Bio, Nature & Agricultural | 160 | 5.6% |
| Physical & Health Sciences | 91 | 3.2% |
| Psychology | 253 | 8.8% |
| Social Sciences | 171 | 6.0% |
| Engineering | 193 | 6.7% |
| Multidisciplinary Studies | 0 | 0.0% |
| Science & Technology | 165 | 5.8% |
| Business | 496 | 17.3% |
| Education | 691 | 24.1% |
| Literature & Languages | 42 | 1.5% |
| Liberal Arts & History | 86 | 3.0% |
| Visual & Performing Arts | 169 | 5.9% |
| Communications | 42 | 1.5% |
| Arts & Humanities | 145 | 5.1% |
| Total | 2,867 | 100.0% |
Transportation & Commute in Bay St Louis
Vehicle Availability by Sex in Bay St Louis
The most prevalent vehicle ownership categories in Bay St Louis are males with 2 vehicles (703, accounting for 35.2%) and females with 2 vehicles (1,019, making up 33.3%).
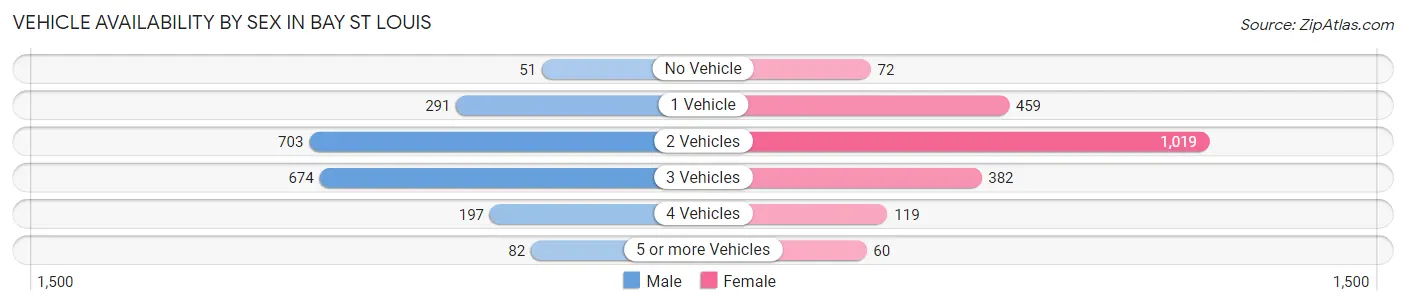
| Vehicles Available | Male | Female |
| No Vehicle | 51 (2.5%) | 72 (3.4%) |
| 1 Vehicle | 291 (14.6%) | 459 (21.7%) |
| 2 Vehicles | 703 (35.2%) | 1,019 (48.3%) |
| 3 Vehicles | 674 (33.7%) | 382 (18.1%) |
| 4 Vehicles | 197 (9.9%) | 119 (5.6%) |
| 5 or more Vehicles | 82 (4.1%) | 60 (2.8%) |
| Total | 1,998 (100.0%) | 2,111 (100.0%) |
Commute Time in Bay St Louis
The most frequently occuring commute durations in Bay St Louis are 5 to 9 minutes (616 commuters, 17.4%), 60 to 89 minutes (479 commuters, 13.5%), and 30 to 34 minutes (434 commuters, 12.3%).
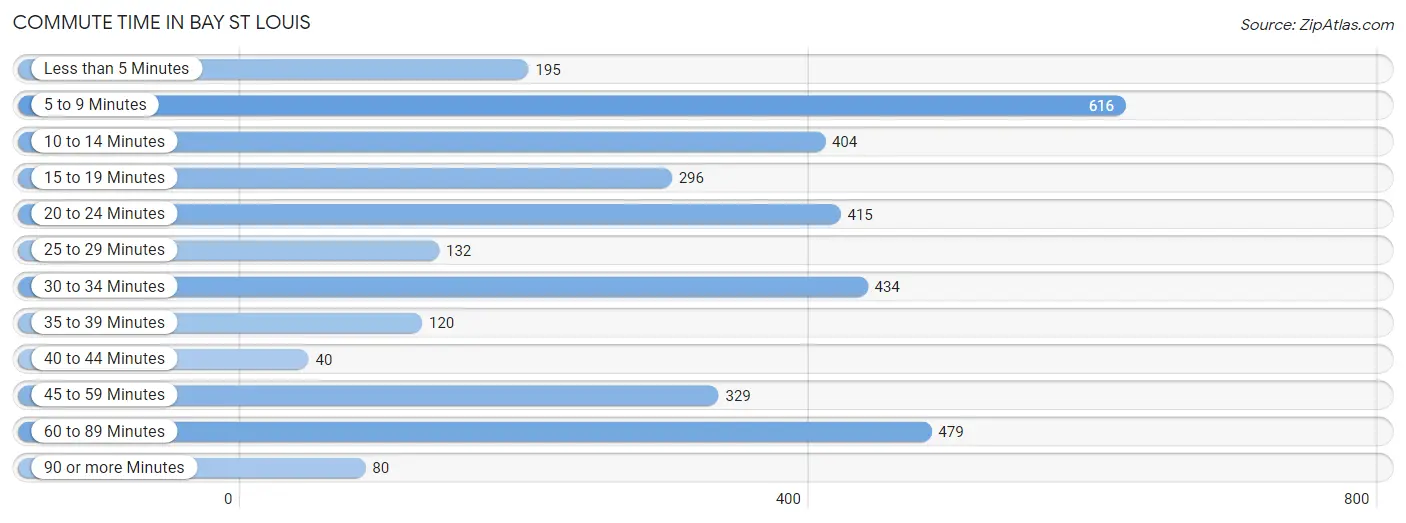
| Commute Time | # Commuters | % Commuters |
| Less than 5 Minutes | 195 | 5.5% |
| 5 to 9 Minutes | 616 | 17.4% |
| 10 to 14 Minutes | 404 | 11.4% |
| 15 to 19 Minutes | 296 | 8.4% |
| 20 to 24 Minutes | 415 | 11.7% |
| 25 to 29 Minutes | 132 | 3.7% |
| 30 to 34 Minutes | 434 | 12.3% |
| 35 to 39 Minutes | 120 | 3.4% |
| 40 to 44 Minutes | 40 | 1.1% |
| 45 to 59 Minutes | 329 | 9.3% |
| 60 to 89 Minutes | 479 | 13.5% |
| 90 or more Minutes | 80 | 2.3% |
Commute Time by Sex in Bay St Louis
The most common commute times in Bay St Louis are 60 to 89 minutes (395 commuters, 22.1%) for males and 5 to 9 minutes (467 commuters, 26.6%) for females.
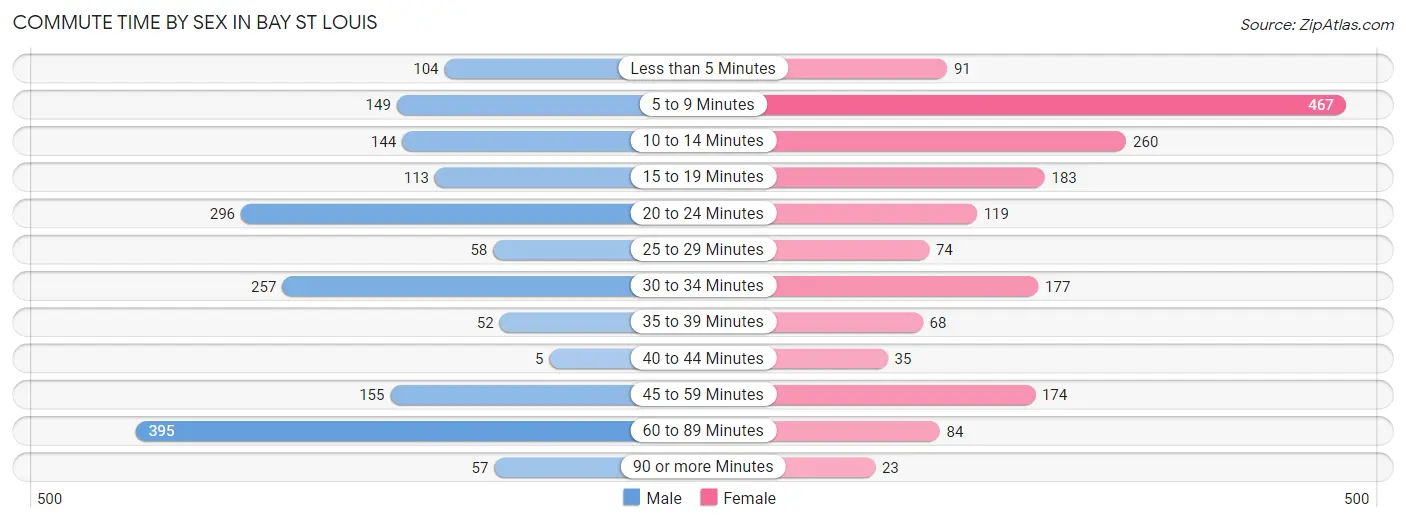
| Commute Time | Male | Female |
| Less than 5 Minutes | 104 (5.8%) | 91 (5.2%) |
| 5 to 9 Minutes | 149 (8.4%) | 467 (26.6%) |
| 10 to 14 Minutes | 144 (8.1%) | 260 (14.8%) |
| 15 to 19 Minutes | 113 (6.3%) | 183 (10.4%) |
| 20 to 24 Minutes | 296 (16.6%) | 119 (6.8%) |
| 25 to 29 Minutes | 58 (3.3%) | 74 (4.2%) |
| 30 to 34 Minutes | 257 (14.4%) | 177 (10.1%) |
| 35 to 39 Minutes | 52 (2.9%) | 68 (3.9%) |
| 40 to 44 Minutes | 5 (0.3%) | 35 (2.0%) |
| 45 to 59 Minutes | 155 (8.7%) | 174 (9.9%) |
| 60 to 89 Minutes | 395 (22.1%) | 84 (4.8%) |
| 90 or more Minutes | 57 (3.2%) | 23 (1.3%) |
Time of Departure to Work by Sex in Bay St Louis
The most frequent times of departure to work in Bay St Louis are 7:00 AM to 7:29 AM (413, 23.1%) for males and 7:00 AM to 7:29 AM (415, 23.6%) for females.
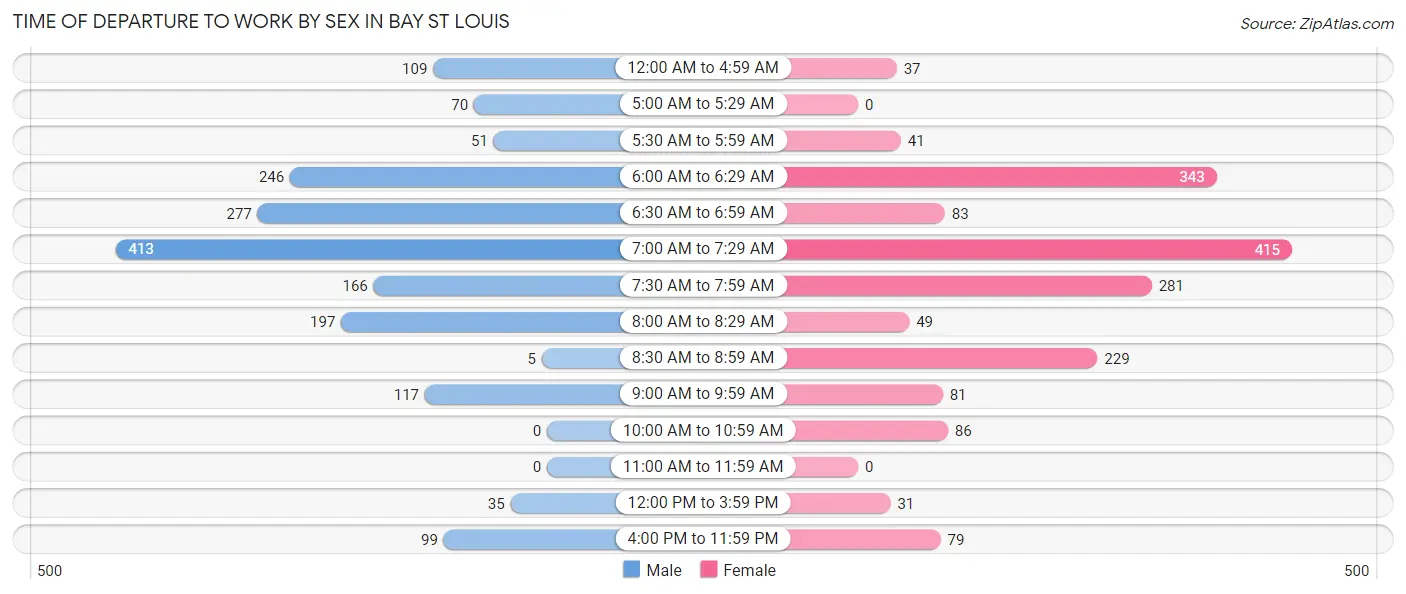
| Time of Departure | Male | Female |
| 12:00 AM to 4:59 AM | 109 (6.1%) | 37 (2.1%) |
| 5:00 AM to 5:29 AM | 70 (3.9%) | 0 (0.0%) |
| 5:30 AM to 5:59 AM | 51 (2.9%) | 41 (2.3%) |
| 6:00 AM to 6:29 AM | 246 (13.8%) | 343 (19.5%) |
| 6:30 AM to 6:59 AM | 277 (15.5%) | 83 (4.7%) |
| 7:00 AM to 7:29 AM | 413 (23.1%) | 415 (23.6%) |
| 7:30 AM to 7:59 AM | 166 (9.3%) | 281 (16.0%) |
| 8:00 AM to 8:29 AM | 197 (11.0%) | 49 (2.8%) |
| 8:30 AM to 8:59 AM | 5 (0.3%) | 229 (13.1%) |
| 9:00 AM to 9:59 AM | 117 (6.6%) | 81 (4.6%) |
| 10:00 AM to 10:59 AM | 0 (0.0%) | 86 (4.9%) |
| 11:00 AM to 11:59 AM | 0 (0.0%) | 0 (0.0%) |
| 12:00 PM to 3:59 PM | 35 (2.0%) | 31 (1.8%) |
| 4:00 PM to 11:59 PM | 99 (5.6%) | 79 (4.5%) |
| Total | 1,785 (100.0%) | 1,755 (100.0%) |
Housing Occupancy in Bay St Louis
Occupancy by Ownership in Bay St Louis
Of the total 4,538 dwellings in Bay St Louis, owner-occupied units account for 3,463 (76.3%), while renter-occupied units make up 1,075 (23.7%).
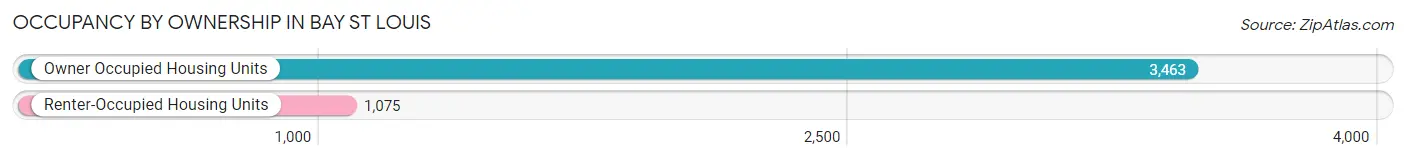
| Occupancy | # Housing Units | % Housing Units |
| Owner Occupied Housing Units | 3,463 | 76.3% |
| Renter-Occupied Housing Units | 1,075 | 23.7% |
| Total Occupied Housing Units | 4,538 | 100.0% |
Occupancy by Household Size in Bay St Louis
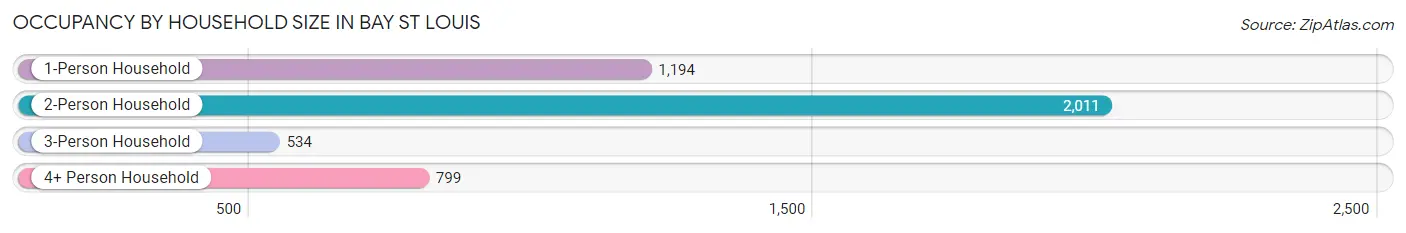
| Household Size | # Housing Units | % Housing Units |
| 1-Person Household | 1,194 | 26.3% |
| 2-Person Household | 2,011 | 44.3% |
| 3-Person Household | 534 | 11.8% |
| 4+ Person Household | 799 | 17.6% |
| Total Housing Units | 4,538 | 100.0% |
Occupancy by Ownership by Household Size in Bay St Louis
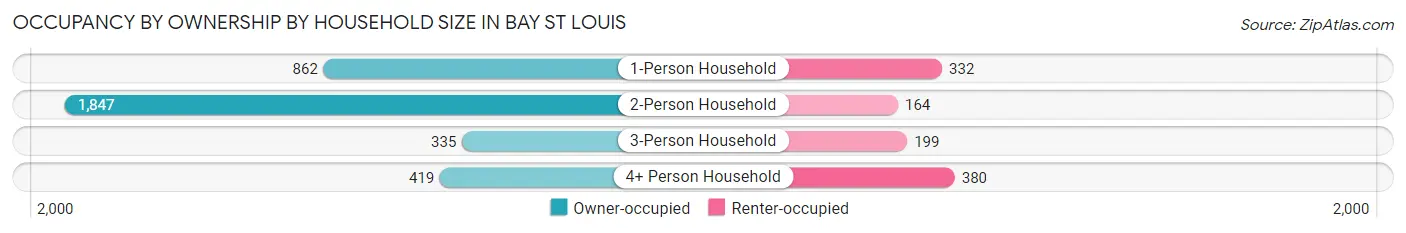
| Household Size | Owner-occupied | Renter-occupied |
| 1-Person Household | 862 (72.2%) | 332 (27.8%) |
| 2-Person Household | 1,847 (91.8%) | 164 (8.2%) |
| 3-Person Household | 335 (62.7%) | 199 (37.3%) |
| 4+ Person Household | 419 (52.4%) | 380 (47.6%) |
| Total Housing Units | 3,463 (76.3%) | 1,075 (23.7%) |
Occupancy by Educational Attainment in Bay St Louis
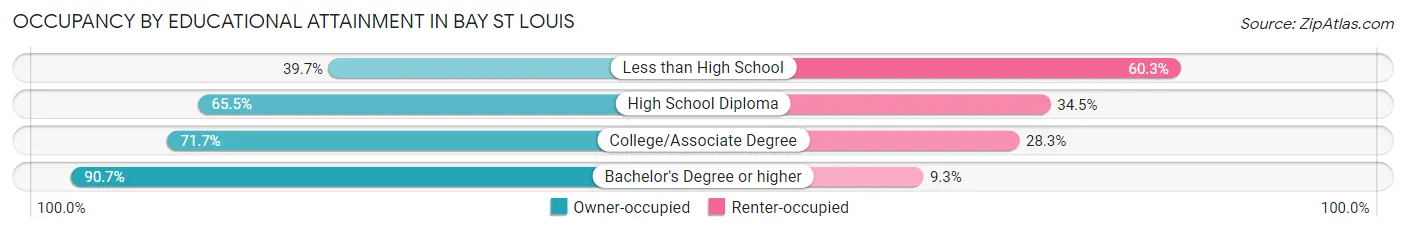
| Household Size | Owner-occupied | Renter-occupied |
| Less than High School | 115 (39.7%) | 175 (60.3%) |
| High School Diploma | 550 (65.5%) | 290 (34.5%) |
| College/Associate Degree | 1,106 (71.7%) | 437 (28.3%) |
| Bachelor's Degree or higher | 1,692 (90.7%) | 173 (9.3%) |
Occupancy by Age of Householder in Bay St Louis
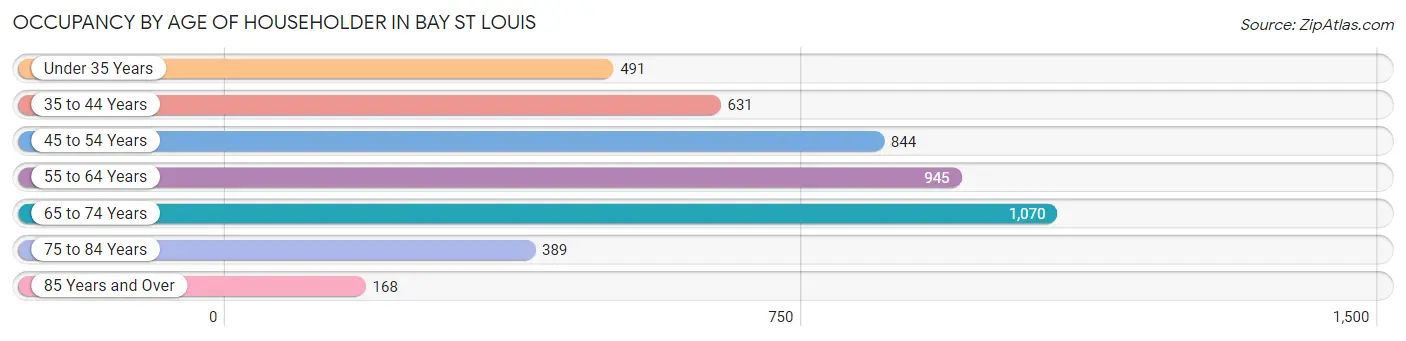
| Age Bracket | # Households | % Households |
| Under 35 Years | 491 | 10.8% |
| 35 to 44 Years | 631 | 13.9% |
| 45 to 54 Years | 844 | 18.6% |
| 55 to 64 Years | 945 | 20.8% |
| 65 to 74 Years | 1,070 | 23.6% |
| 75 to 84 Years | 389 | 8.6% |
| 85 Years and Over | 168 | 3.7% |
| Total | 4,538 | 100.0% |
Housing Finances in Bay St Louis
Median Income by Occupancy in Bay St Louis
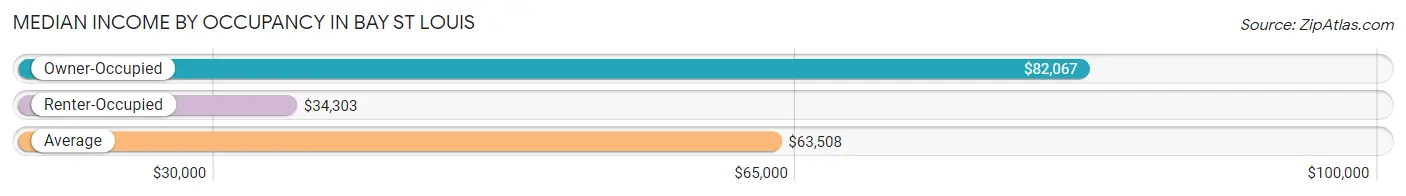
| Occupancy Type | # Households | Median Income |
| Owner-Occupied | 3,463 (76.3%) | $82,067 |
| Renter-Occupied | 1,075 (23.7%) | $34,303 |
| Average | 4,538 (100.0%) | $63,508 |
Occupancy by Householder Income Bracket in Bay St Louis
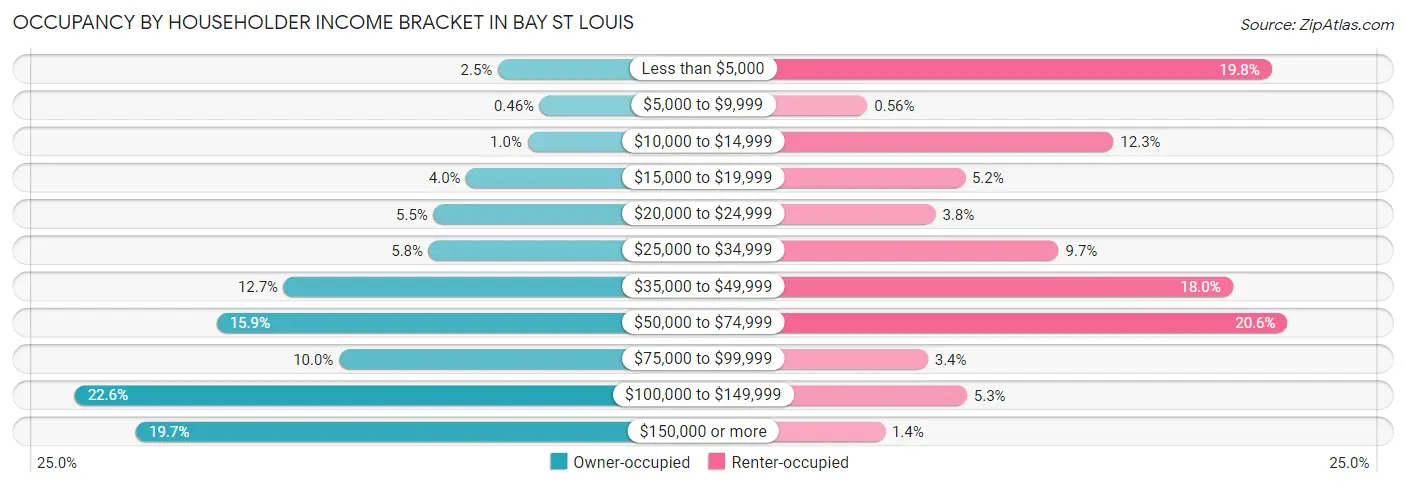
| Income Bracket | Owner-occupied | Renter-occupied |
| Less than $5,000 | 85 (2.5%) | 213 (19.8%) |
| $5,000 to $9,999 | 16 (0.5%) | 6 (0.6%) |
| $10,000 to $14,999 | 36 (1.0%) | 132 (12.3%) |
| $15,000 to $19,999 | 137 (4.0%) | 56 (5.2%) |
| $20,000 to $24,999 | 191 (5.5%) | 41 (3.8%) |
| $25,000 to $34,999 | 199 (5.8%) | 104 (9.7%) |
| $35,000 to $49,999 | 438 (12.7%) | 193 (17.9%) |
| $50,000 to $74,999 | 549 (15.9%) | 221 (20.6%) |
| $75,000 to $99,999 | 347 (10.0%) | 37 (3.4%) |
| $100,000 to $149,999 | 783 (22.6%) | 57 (5.3%) |
| $150,000 or more | 682 (19.7%) | 15 (1.4%) |
| Total | 3,463 (100.0%) | 1,075 (100.0%) |
Monthly Housing Cost Tiers in Bay St Louis
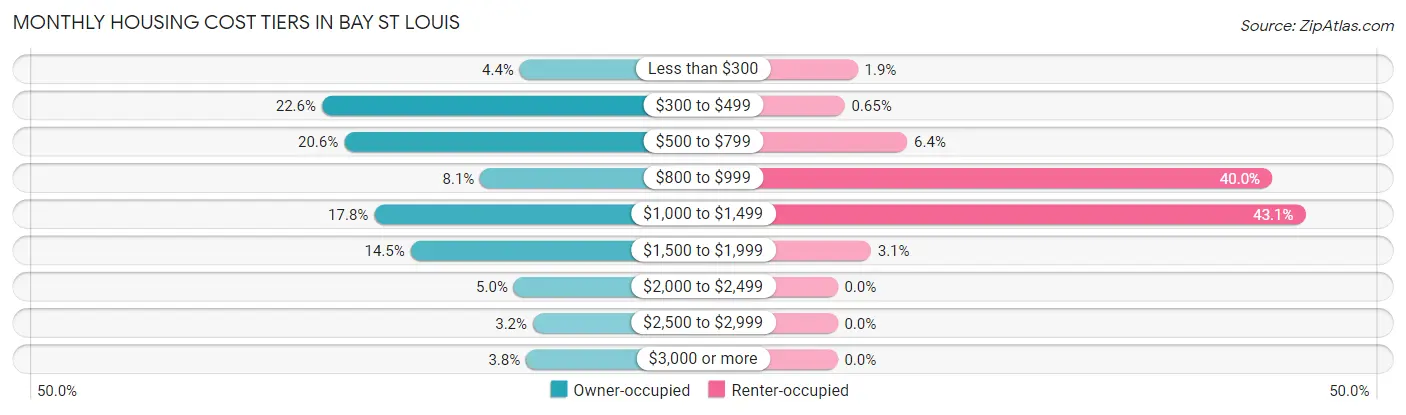
| Monthly Cost | Owner-occupied | Renter-occupied |
| Less than $300 | 153 (4.4%) | 20 (1.9%) |
| $300 to $499 | 784 (22.6%) | 7 (0.6%) |
| $500 to $799 | 713 (20.6%) | 69 (6.4%) |
| $800 to $999 | 279 (8.1%) | 430 (40.0%) |
| $1,000 to $1,499 | 617 (17.8%) | 463 (43.1%) |
| $1,500 to $1,999 | 501 (14.5%) | 33 (3.1%) |
| $2,000 to $2,499 | 172 (5.0%) | 0 (0.0%) |
| $2,500 to $2,999 | 111 (3.2%) | 0 (0.0%) |
| $3,000 or more | 133 (3.8%) | 0 (0.0%) |
| Total | 3,463 (100.0%) | 1,075 (100.0%) |
Physical Housing Characteristics in Bay St Louis
Housing Structures in Bay St Louis
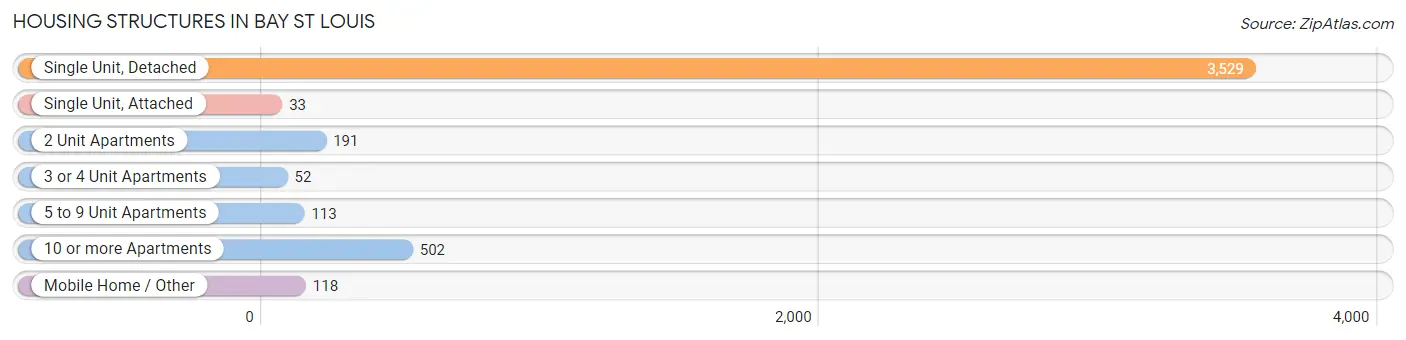
| Structure Type | # Housing Units | % Housing Units |
| Single Unit, Detached | 3,529 | 77.8% |
| Single Unit, Attached | 33 | 0.7% |
| 2 Unit Apartments | 191 | 4.2% |
| 3 or 4 Unit Apartments | 52 | 1.1% |
| 5 to 9 Unit Apartments | 113 | 2.5% |
| 10 or more Apartments | 502 | 11.1% |
| Mobile Home / Other | 118 | 2.6% |
| Total | 4,538 | 100.0% |
Housing Structures by Occupancy in Bay St Louis
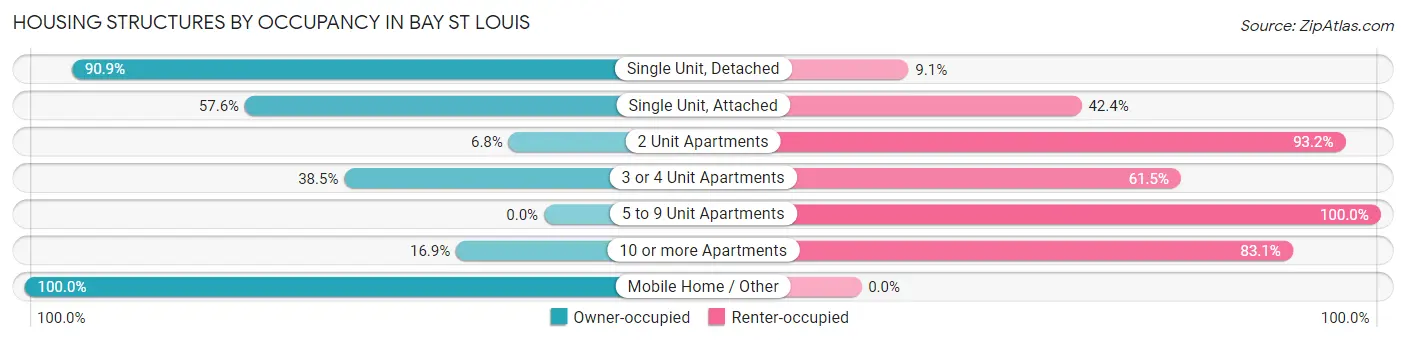
| Structure Type | Owner-occupied | Renter-occupied |
| Single Unit, Detached | 3,208 (90.9%) | 321 (9.1%) |
| Single Unit, Attached | 19 (57.6%) | 14 (42.4%) |
| 2 Unit Apartments | 13 (6.8%) | 178 (93.2%) |
| 3 or 4 Unit Apartments | 20 (38.5%) | 32 (61.5%) |
| 5 to 9 Unit Apartments | 0 (0.0%) | 113 (100.0%) |
| 10 or more Apartments | 85 (16.9%) | 417 (83.1%) |
| Mobile Home / Other | 118 (100.0%) | 0 (0.0%) |
| Total | 3,463 (76.3%) | 1,075 (23.7%) |
Housing Structures by Number of Rooms in Bay St Louis
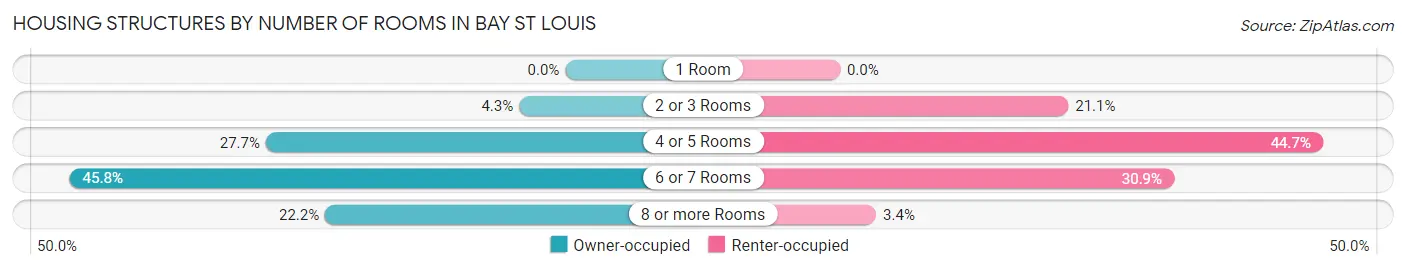
| Number of Rooms | Owner-occupied | Renter-occupied |
| 1 Room | 0 (0.0%) | 0 (0.0%) |
| 2 or 3 Rooms | 148 (4.3%) | 227 (21.1%) |
| 4 or 5 Rooms | 959 (27.7%) | 480 (44.7%) |
| 6 or 7 Rooms | 1,587 (45.8%) | 332 (30.9%) |
| 8 or more Rooms | 769 (22.2%) | 36 (3.4%) |
| Total | 3,463 (100.0%) | 1,075 (100.0%) |
Housing Structure by Heating Type in Bay St Louis
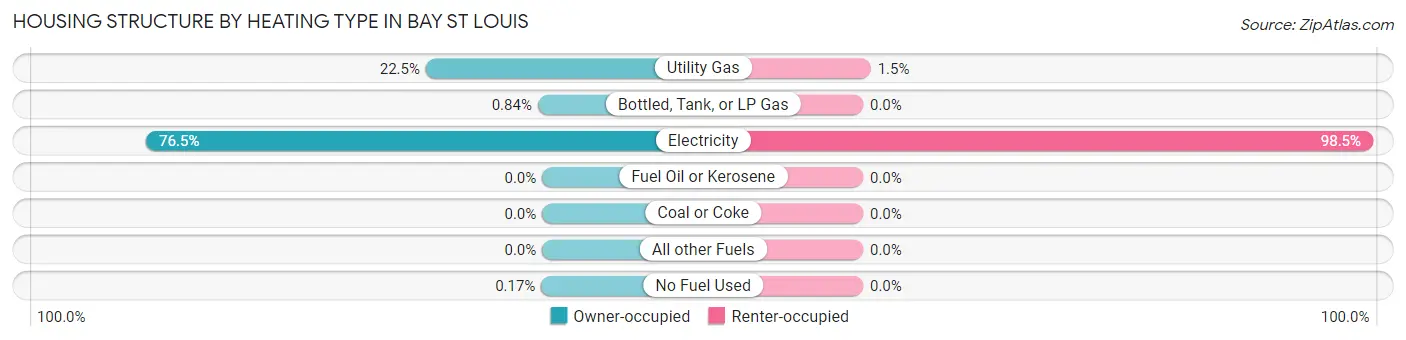
| Heating Type | Owner-occupied | Renter-occupied |
| Utility Gas | 778 (22.5%) | 16 (1.5%) |
| Bottled, Tank, or LP Gas | 29 (0.8%) | 0 (0.0%) |
| Electricity | 2,650 (76.5%) | 1,059 (98.5%) |
| Fuel Oil or Kerosene | 0 (0.0%) | 0 (0.0%) |
| Coal or Coke | 0 (0.0%) | 0 (0.0%) |
| All other Fuels | 0 (0.0%) | 0 (0.0%) |
| No Fuel Used | 6 (0.2%) | 0 (0.0%) |
| Total | 3,463 (100.0%) | 1,075 (100.0%) |
Household Vehicle Usage in Bay St Louis
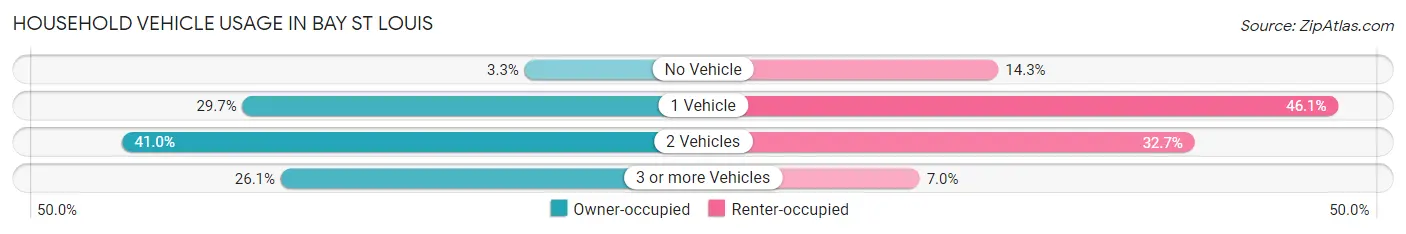
| Vehicles per Household | Owner-occupied | Renter-occupied |
| No Vehicle | 115 (3.3%) | 154 (14.3%) |
| 1 Vehicle | 1,027 (29.7%) | 495 (46.1%) |
| 2 Vehicles | 1,418 (40.9%) | 351 (32.7%) |
| 3 or more Vehicles | 903 (26.1%) | 75 (7.0%) |
| Total | 3,463 (100.0%) | 1,075 (100.0%) |
Real Estate & Mortgages in Bay St Louis
Real Estate and Mortgage Overview in Bay St Louis
| Characteristic | Without Mortgage | With Mortgage |
| Housing Units | 1,867 | 1,596 |
| Median Property Value | $202,200 | $244,200 |
| Median Household Income | $60,580 | $450 |
| Monthly Housing Costs | $502 | $133 |
| Real Estate Taxes | $1,283 | $131 |
Property Value by Mortgage Status in Bay St Louis
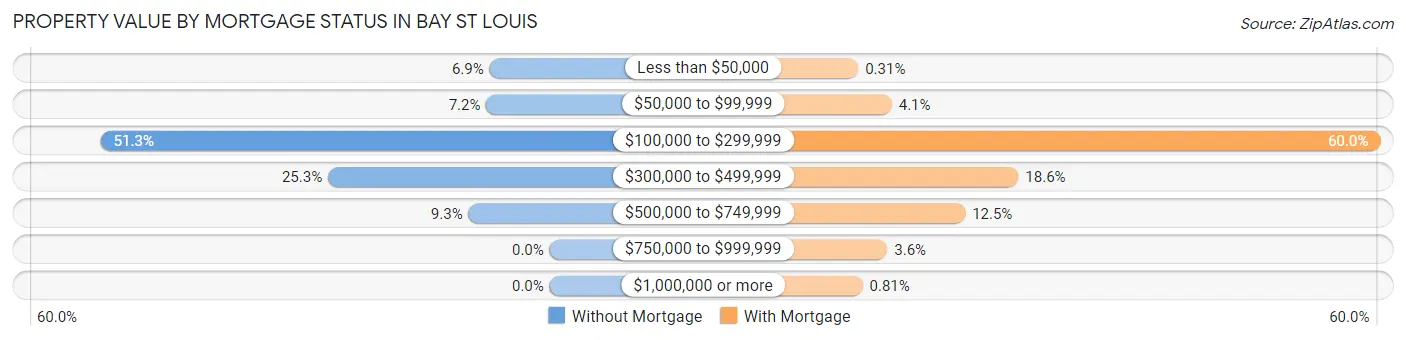
| Property Value | Without Mortgage | With Mortgage |
| Less than $50,000 | 128 (6.9%) | 5 (0.3%) |
| $50,000 to $99,999 | 135 (7.2%) | 66 (4.1%) |
| $100,000 to $299,999 | 958 (51.3%) | 957 (60.0%) |
| $300,000 to $499,999 | 473 (25.3%) | 297 (18.6%) |
| $500,000 to $749,999 | 173 (9.3%) | 200 (12.5%) |
| $750,000 to $999,999 | 0 (0.0%) | 58 (3.6%) |
| $1,000,000 or more | 0 (0.0%) | 13 (0.8%) |
| Total | 1,867 (100.0%) | 1,596 (100.0%) |
Household Income by Mortgage Status in Bay St Louis
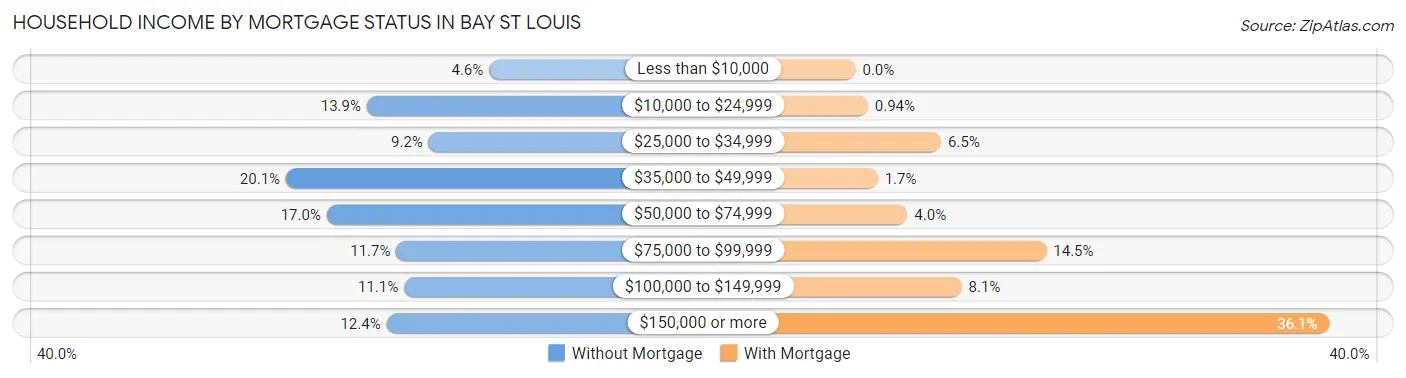
| Household Income | Without Mortgage | With Mortgage |
| Less than $10,000 | 86 (4.6%) | 0 (0.0%) |
| $10,000 to $24,999 | 260 (13.9%) | 15 (0.9%) |
| $25,000 to $34,999 | 172 (9.2%) | 104 (6.5%) |
| $35,000 to $49,999 | 375 (20.1%) | 27 (1.7%) |
| $50,000 to $74,999 | 317 (17.0%) | 63 (4.0%) |
| $75,000 to $99,999 | 218 (11.7%) | 232 (14.5%) |
| $100,000 to $149,999 | 207 (11.1%) | 129 (8.1%) |
| $150,000 or more | 232 (12.4%) | 576 (36.1%) |
| Total | 1,867 (100.0%) | 1,596 (100.0%) |
Property Value to Household Income Ratio in Bay St Louis
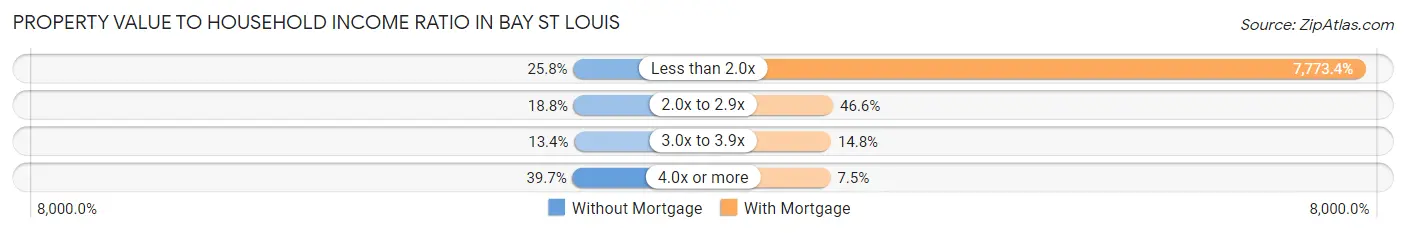
| Value-to-Income Ratio | Without Mortgage | With Mortgage |
| Less than 2.0x | 482 (25.8%) | 124,063 (7,773.4%) |
| 2.0x to 2.9x | 350 (18.8%) | 743 (46.6%) |
| 3.0x to 3.9x | 251 (13.4%) | 236 (14.8%) |
| 4.0x or more | 742 (39.7%) | 119 (7.5%) |
| Total | 1,867 (100.0%) | 1,596 (100.0%) |
Real Estate Taxes by Mortgage Status in Bay St Louis
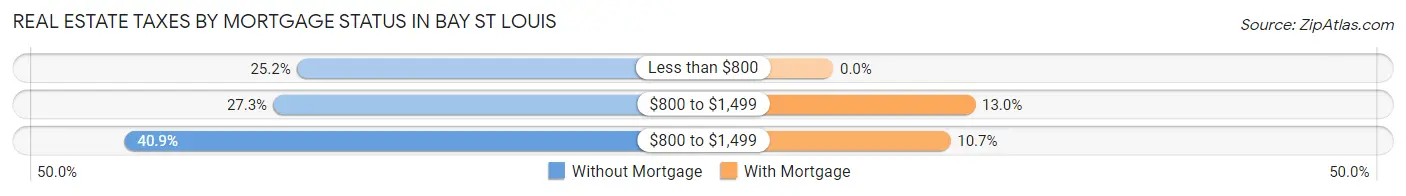
| Property Taxes | Without Mortgage | With Mortgage |
| Less than $800 | 470 (25.2%) | 0 (0.0%) |
| $800 to $1,499 | 510 (27.3%) | 207 (13.0%) |
| $800 to $1,499 | 763 (40.9%) | 171 (10.7%) |
| Total | 1,867 (100.0%) | 1,596 (100.0%) |
Health & Disability in Bay St Louis
Health Insurance Coverage by Age in Bay St Louis
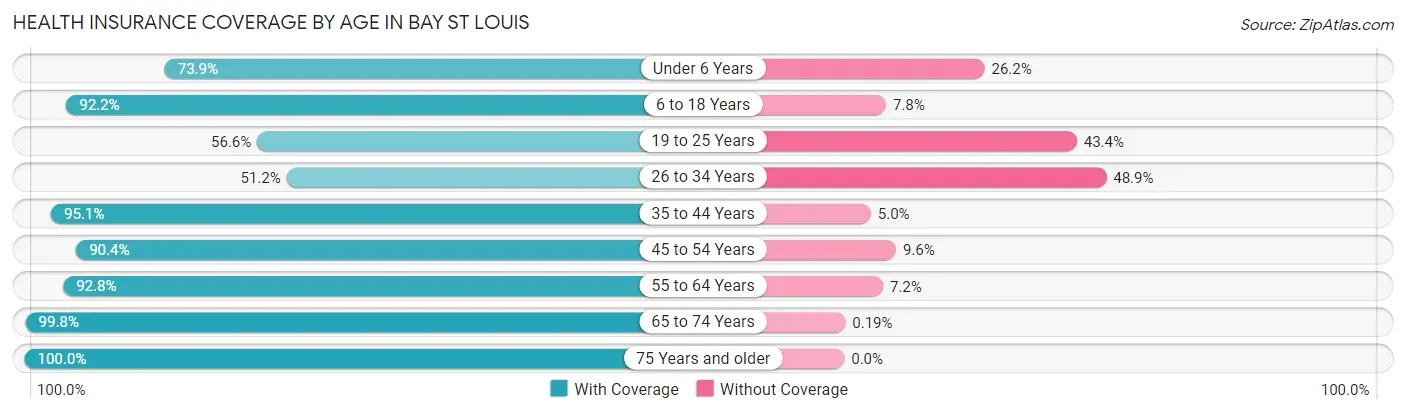
| Age Bracket | With Coverage | Without Coverage |
| Under 6 Years | 288 (73.9%) | 102 (26.2%) |
| 6 to 18 Years | 1,257 (92.2%) | 106 (7.8%) |
| 19 to 25 Years | 337 (56.6%) | 258 (43.4%) |
| 26 to 34 Years | 335 (51.1%) | 320 (48.8%) |
| 35 to 44 Years | 999 (95.1%) | 52 (5.0%) |
| 45 to 54 Years | 1,321 (90.4%) | 141 (9.6%) |
| 55 to 64 Years | 1,544 (92.8%) | 120 (7.2%) |
| 65 to 74 Years | 1,614 (99.8%) | 3 (0.2%) |
| 75 Years and older | 829 (100.0%) | 0 (0.0%) |
| Total | 8,524 (88.5%) | 1,102 (11.5%) |
Health Insurance Coverage by Citizenship Status in Bay St Louis
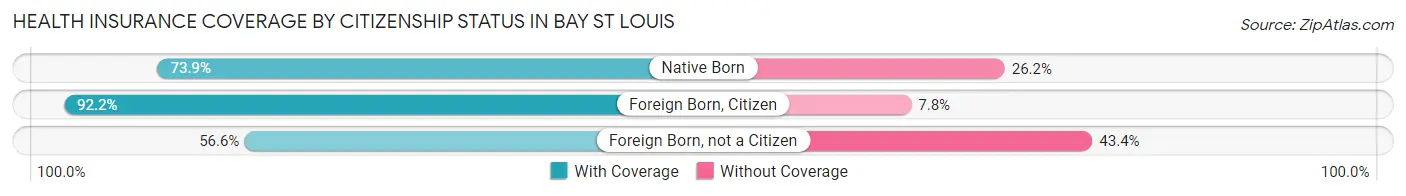
| Citizenship Status | With Coverage | Without Coverage |
| Native Born | 288 (73.9%) | 102 (26.2%) |
| Foreign Born, Citizen | 1,257 (92.2%) | 106 (7.8%) |
| Foreign Born, not a Citizen | 337 (56.6%) | 258 (43.4%) |
Health Insurance Coverage by Household Income in Bay St Louis
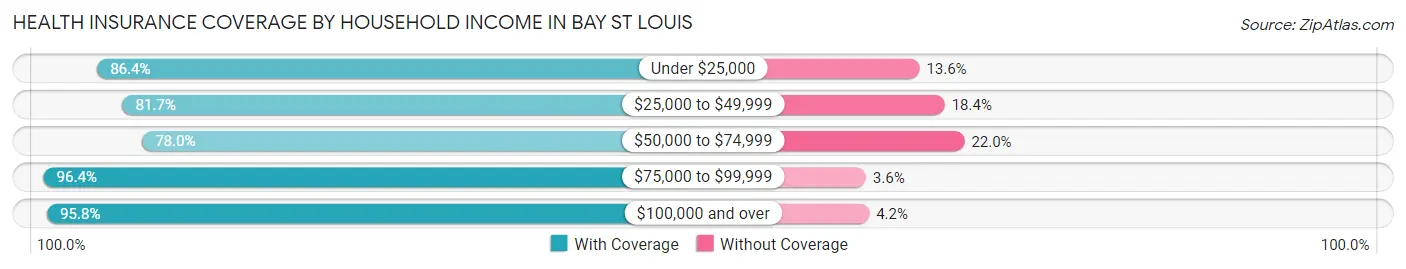
| Household Income | With Coverage | Without Coverage |
| Under $25,000 | 1,454 (86.4%) | 229 (13.6%) |
| $25,000 to $49,999 | 1,571 (81.7%) | 353 (18.3%) |
| $50,000 to $74,999 | 1,107 (78.0%) | 313 (22.0%) |
| $75,000 to $99,999 | 862 (96.4%) | 32 (3.6%) |
| $100,000 and over | 3,470 (95.8%) | 152 (4.2%) |
Public vs Private Health Insurance Coverage by Age in Bay St Louis
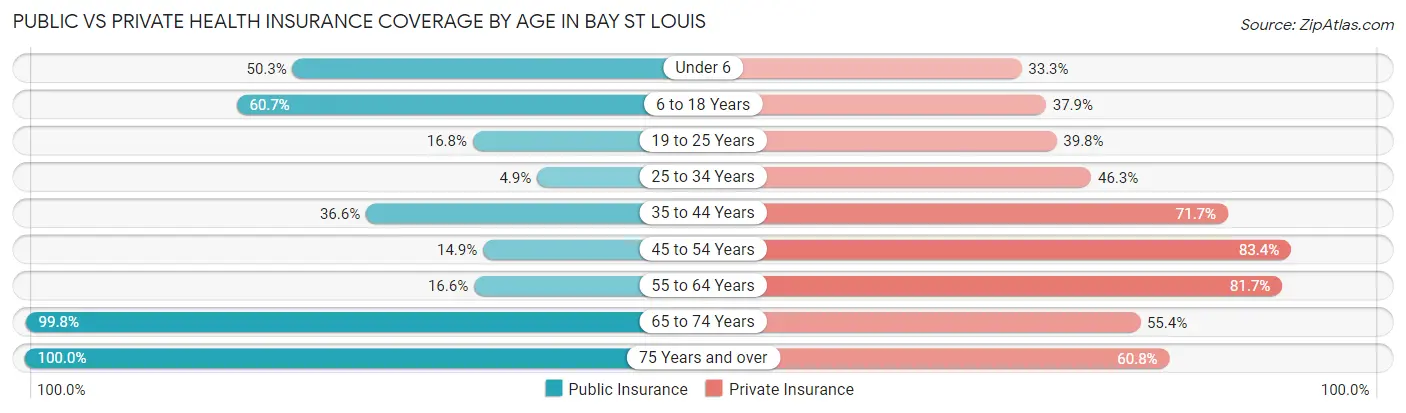
| Age Bracket | Public Insurance | Private Insurance |
| Under 6 | 196 (50.3%) | 130 (33.3%) |
| 6 to 18 Years | 827 (60.7%) | 516 (37.9%) |
| 19 to 25 Years | 100 (16.8%) | 237 (39.8%) |
| 25 to 34 Years | 32 (4.9%) | 303 (46.3%) |
| 35 to 44 Years | 385 (36.6%) | 753 (71.7%) |
| 45 to 54 Years | 218 (14.9%) | 1,219 (83.4%) |
| 55 to 64 Years | 276 (16.6%) | 1,360 (81.7%) |
| 65 to 74 Years | 1,614 (99.8%) | 895 (55.3%) |
| 75 Years and over | 829 (100.0%) | 504 (60.8%) |
| Total | 4,477 (46.5%) | 5,917 (61.5%) |
Disability Status by Sex by Age in Bay St Louis
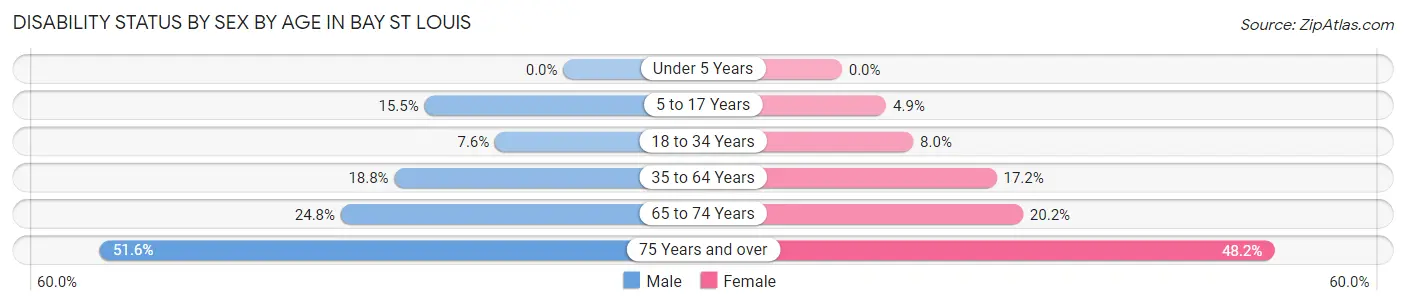
| Age Bracket | Male | Female |
| Under 5 Years | 0 (0.0%) | 0 (0.0%) |
| 5 to 17 Years | 83 (15.5%) | 34 (4.9%) |
| 18 to 34 Years | 39 (7.6%) | 72 (8.0%) |
| 35 to 64 Years | 385 (18.8%) | 367 (17.2%) |
| 65 to 74 Years | 193 (24.8%) | 169 (20.2%) |
| 75 Years and over | 177 (51.6%) | 234 (48.1%) |
Disability Class by Sex by Age in Bay St Louis
Disability Class: Hearing Difficulty
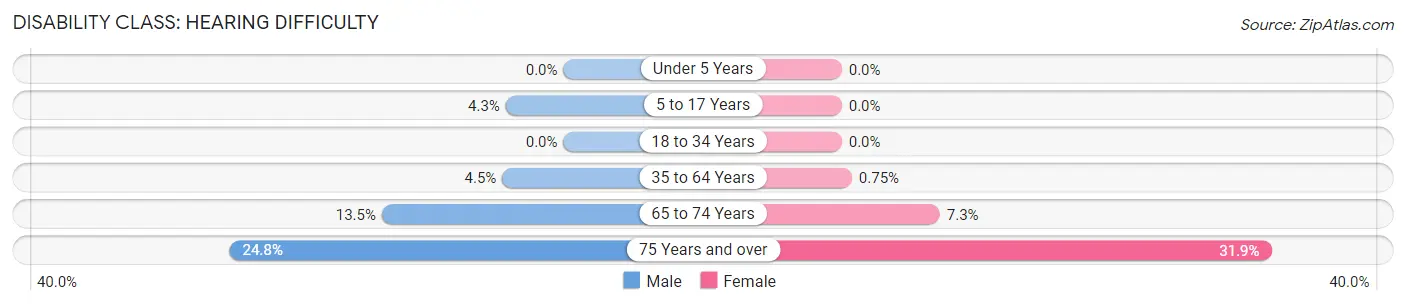
| Age Bracket | Male | Female |
| Under 5 Years | 0 (0.0%) | 0 (0.0%) |
| 5 to 17 Years | 23 (4.3%) | 0 (0.0%) |
| 18 to 34 Years | 0 (0.0%) | 0 (0.0%) |
| 35 to 64 Years | 93 (4.5%) | 16 (0.7%) |
| 65 to 74 Years | 105 (13.5%) | 61 (7.3%) |
| 75 Years and over | 85 (24.8%) | 155 (31.9%) |
Disability Class: Vision Difficulty
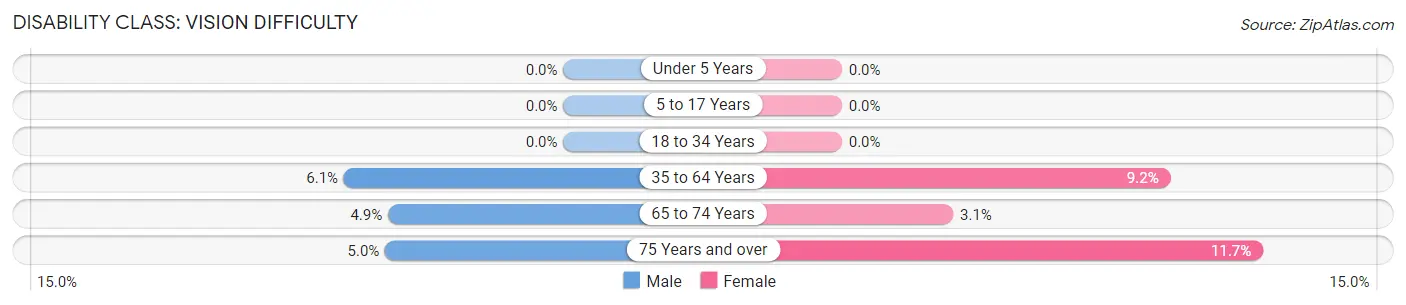
| Age Bracket | Male | Female |
| Under 5 Years | 0 (0.0%) | 0 (0.0%) |
| 5 to 17 Years | 0 (0.0%) | 0 (0.0%) |
| 18 to 34 Years | 0 (0.0%) | 0 (0.0%) |
| 35 to 64 Years | 125 (6.1%) | 195 (9.1%) |
| 65 to 74 Years | 38 (4.9%) | 26 (3.1%) |
| 75 Years and over | 17 (5.0%) | 57 (11.7%) |
Disability Class: Cognitive Difficulty
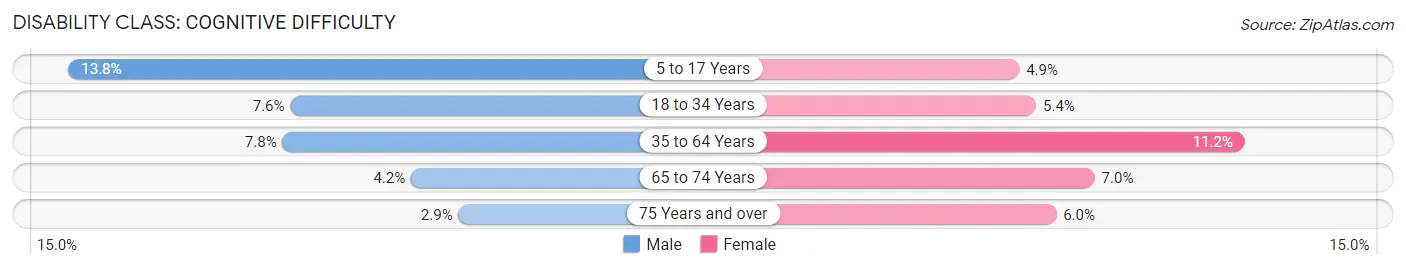
| Age Bracket | Male | Female |
| 5 to 17 Years | 74 (13.8%) | 34 (4.9%) |
| 18 to 34 Years | 39 (7.6%) | 49 (5.4%) |
| 35 to 64 Years | 160 (7.8%) | 239 (11.2%) |
| 65 to 74 Years | 33 (4.2%) | 59 (7.0%) |
| 75 Years and over | 10 (2.9%) | 29 (6.0%) |
Disability Class: Ambulatory Difficulty
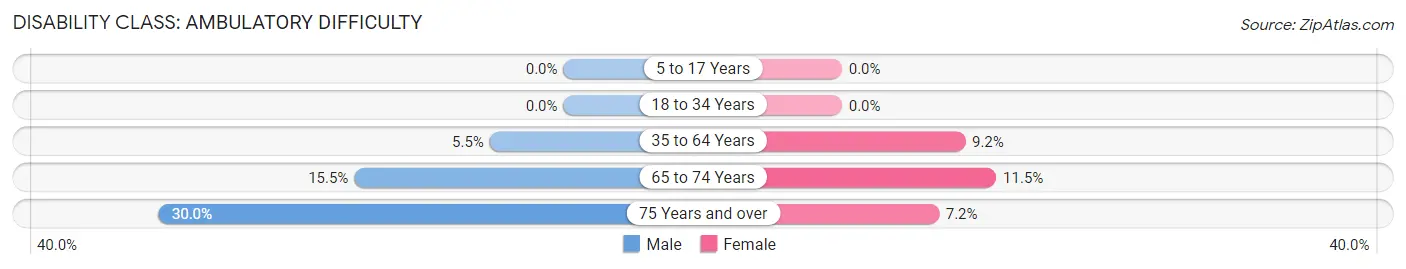
| Age Bracket | Male | Female |
| 5 to 17 Years | 0 (0.0%) | 0 (0.0%) |
| 18 to 34 Years | 0 (0.0%) | 0 (0.0%) |
| 35 to 64 Years | 112 (5.5%) | 195 (9.1%) |
| 65 to 74 Years | 121 (15.5%) | 96 (11.5%) |
| 75 Years and over | 103 (30.0%) | 35 (7.2%) |
Disability Class: Self-Care Difficulty
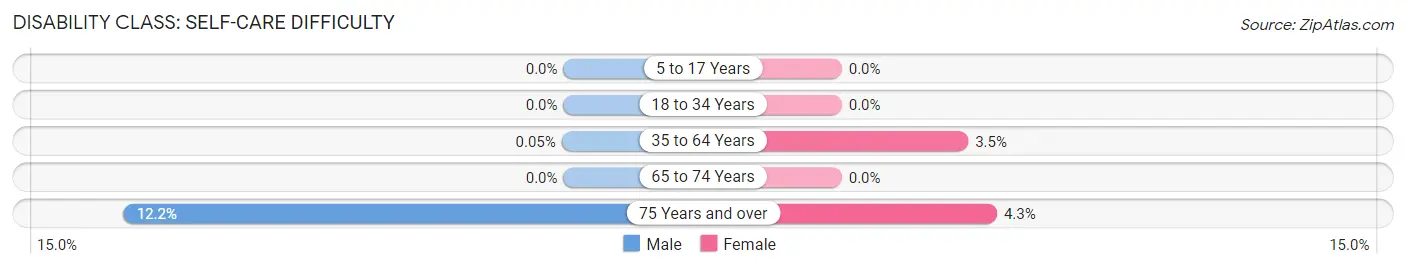
| Age Bracket | Male | Female |
| 5 to 17 Years | 0 (0.0%) | 0 (0.0%) |
| 18 to 34 Years | 0 (0.0%) | 0 (0.0%) |
| 35 to 64 Years | 1 (0.1%) | 75 (3.5%) |
| 65 to 74 Years | 0 (0.0%) | 0 (0.0%) |
| 75 Years and over | 42 (12.2%) | 21 (4.3%) |
Technology Access in Bay St Louis
Computing Device Access in Bay St Louis
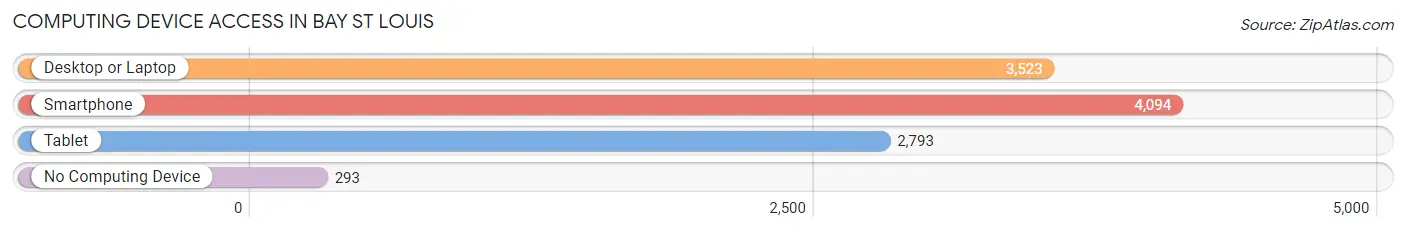
| Device Type | # Households | % Households |
| Desktop or Laptop | 3,523 | 77.6% |
| Smartphone | 4,094 | 90.2% |
| Tablet | 2,793 | 61.6% |
| No Computing Device | 293 | 6.5% |
| Total | 4,538 | 100.0% |
Internet Access in Bay St Louis
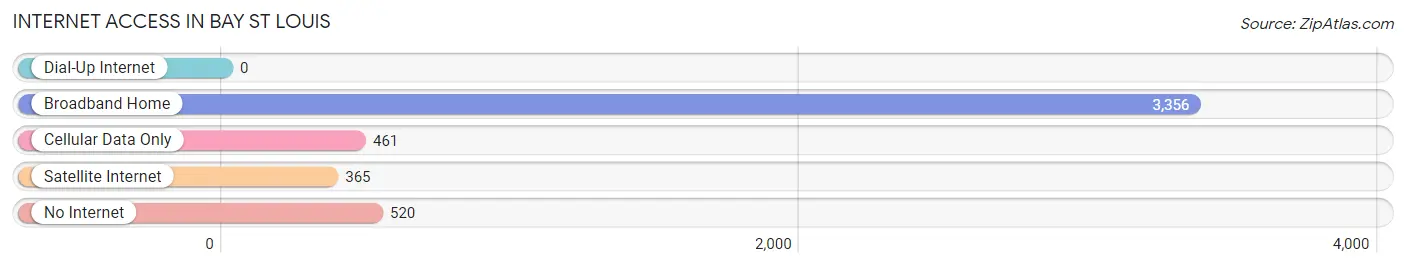
| Internet Type | # Households | % Households |
| Dial-Up Internet | 0 | 0.0% |
| Broadband Home | 3,356 | 74.0% |
| Cellular Data Only | 461 | 10.2% |
| Satellite Internet | 365 | 8.0% |
| No Internet | 520 | 11.5% |
| Total | 4,538 | 100.0% |
Bay St Louis Summary
Bay St. Louis is a city located in Hancock County, Mississippi, United States. It is part of the Gulfport–Biloxi Metropolitan Statistical Area. As of the 2010 census, the city had a total population of 12,332. It is the county seat of Hancock County.
History
Bay St. Louis was founded in 1817 as a port city on the Mississippi Sound. It was named after Louis IX of France, who was canonized as a saint in 1297. The city was incorporated in 1882.
During the American Civil War, the city was occupied by Union forces in 1863. It was the site of a major battle in 1864, when Confederate forces attempted to retake the city. The city was destroyed by a hurricane in 1947, but was rebuilt and is now a popular tourist destination.
Geography
Bay St. Louis is located at 30°17'N 89°20'W (30.28, -89.33). According to the United States Census Bureau, the city has a total area of 11.2 square miles (29.0 km2), of which 10.9 square miles (28.2 km2) is land and 0.3 square miles (0.8 km2) is water.
Economy
The economy of Bay St. Louis is largely based on tourism, with many visitors coming to the city to enjoy its beaches, fishing, and other recreational activities. The city is also home to several casinos, which attract visitors from all over the Gulf Coast region.
The city is also home to several manufacturing and industrial companies, including a shipbuilding company, a paper mill, and a chemical plant.
Demographics
As of the 2010 census, there were 12,332 people, 5,093 households, and 3,092 families residing in the city. The population density was 1,133.2 people per square mile (437.7/km2). There were 5,845 housing units at an average density of 537.2 per square mile (207.6/km2). The racial makeup of the city was 79.2% White, 15.7% African American, 0.3% Native American, 0.7% Asian, 0.1% Pacific Islander, 2.2% from other races, and 2.0% from two or more races. Hispanic or Latino of any race were 4.7% of the population.
There were 5,093 households, out of which 24.2% had children under the age of 18 living with them, 41.2% were married couples living together, 15.3% had a female householder with no husband present, and 38.7% were non-families. 32.2% of all households were made up of individuals, and 12.3% had someone living alone who was 65 years of age or older. The average household size was 2.35 and the average family size was 2.94.
In the city, the population was spread out, with 22.7% under the age of 18, 8.3% from 18 to 24, 25.2% from 25 to 44, 26.2% from 45 to 64, and 17.6% who were 65 years of age or older. The median age was 40 years. For every 100 females, there were 91.2 males. For every 100 females age 18 and over, there were 88.2 males.
The median income for a household in the city was $35,921, and the median income for a family was $45,945. Males had a median income of $35,921 versus $25,921 for females. The per capita income for the city was $20,945. About 11.7% of families and 15.2% of the population were below the poverty line, including 22.2% of those under age 18 and 11.2% of those age 65 or over.
Common Questions
What is Per Capita Income in Bay St Louis?
Per Capita income in Bay St Louis is $45,280.
What is the Median Family Income in Bay St Louis?
Median Family Income in Bay St Louis is $76,107.
What is the Median Household income in Bay St Louis?
Median Household Income in Bay St Louis is $63,508.
What is Income or Wage Gap in Bay St Louis?
Income or Wage Gap in Bay St Louis is 43.6%.
Women in Bay St Louis earn 56.4 cents for every dollar earned by a man.
What is Inequality or Gini Index in Bay St Louis?
Inequality or Gini Index in Bay St Louis is 0.55.
What is the Total Population of Bay St Louis?
Total Population of Bay St Louis is 9,788.
What is the Total Male Population of Bay St Louis?
Total Male Population of Bay St Louis is 4,509.
What is the Total Female Population of Bay St Louis?
Total Female Population of Bay St Louis is 5,279.
What is the Ratio of Males per 100 Females in Bay St Louis?
There are 85.41 Males per 100 Females in Bay St Louis.
What is the Ratio of Females per 100 Males in Bay St Louis?
There are 117.08 Females per 100 Males in Bay St Louis.
What is the Median Population Age in Bay St Louis?
Median Population Age in Bay St Louis is 51.6 Years.
What is the Average Family Size in Bay St Louis
Average Family Size in Bay St Louis is 2.5 People.
What is the Average Household Size in Bay St Louis
Average Household Size in Bay St Louis is 2.1 People.
How Large is the Labor Force in Bay St Louis?
There are 4,675 People in the Labor Forcein in Bay St Louis.
What is the Percentage of People in the Labor Force in Bay St Louis?
56.3% of People are in the Labor Force in Bay St Louis.
What is the Unemployment Rate in Bay St Louis?
Unemployment Rate in Bay St Louis is 9.2%.