Morgantown, MS Map & Demographics
Morgantown Map
Morgantown Overview
$36,003
PER CAPITA INCOME
9.0%
WAGE / INCOME GAP [ % ]
91.0¢/ $1
WAGE / INCOME GAP [ $ ]
0.59
INEQUALITY / GINI INDEX
930
TOTAL POPULATION
475
MALE POPULATION
455
FEMALE POPULATION
104.40
MALES / 100 FEMALES
95.79
FEMALES / 100 MALES
53.7
MEDIAN AGE
2.6
AVG FAMILY SIZE
1.9
AVG HOUSEHOLD SIZE
427
LABOR FORCE [ PEOPLE ]
49.5%
PERCENT IN LABOR FORCE
9.6%
UNEMPLOYMENT RATE
Morgantown Area Codes
Income in Morgantown
Income Overview in Morgantown
| Characteristic | Number | Measure |
| Per Capita Income | 930 | $36,003 |
| Median Family Income | 245 | $0 |
| Mean Family Income | 245 | $103,091 |
| Median Household Income | 490 | $0 |
| Mean Household Income | 490 | $66,581 |
| Income Deficit | 245 | $0 |
| Wage / Income Gap (%) | 930 | 9.03% |
| Wage / Income Gap ($) | 930 | 90.97¢ per $1 |
| Gini / Inequality Index | 930 | 0.59 |
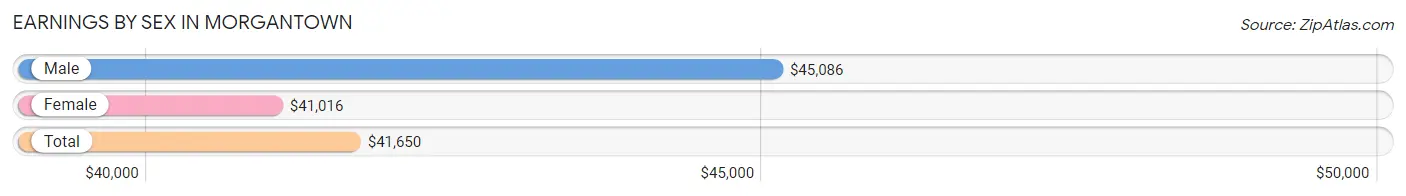
Earnings by Sex in Morgantown
Average Earnings in Morgantown are $41,650, $45,086 for men and $41,016 for women, a difference of 9.0%.
| Sex | Number | Average Earnings |
| Male | 250 (50.7%) | $45,086 |
| Female | 243 (49.3%) | $41,016 |
| Total | 493 (100.0%) | $41,650 |
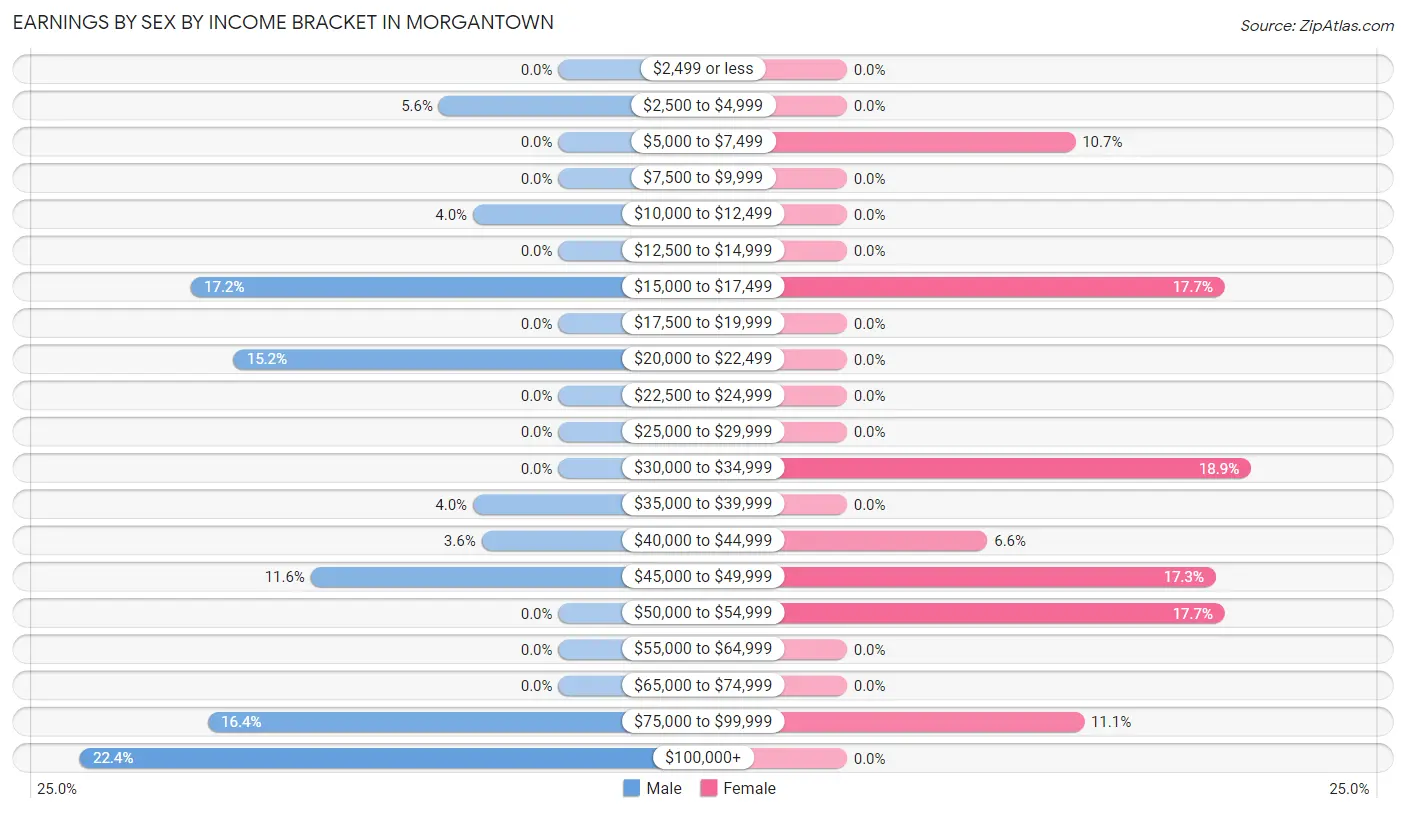
Earnings by Sex by Income Bracket in Morgantown
The most common earnings brackets in Morgantown are $100,000+ for men (56 | 22.4%) and $30,000 to $34,999 for women (46 | 18.9%).
| Income | Male | Female |
| $2,499 or less | 0 (0.0%) | 0 (0.0%) |
| $2,500 to $4,999 | 14 (5.6%) | 0 (0.0%) |
| $5,000 to $7,499 | 0 (0.0%) | 26 (10.7%) |
| $7,500 to $9,999 | 0 (0.0%) | 0 (0.0%) |
| $10,000 to $12,499 | 10 (4.0%) | 0 (0.0%) |
| $12,500 to $14,999 | 0 (0.0%) | 0 (0.0%) |
| $15,000 to $17,499 | 43 (17.2%) | 43 (17.7%) |
| $17,500 to $19,999 | 0 (0.0%) | 0 (0.0%) |
| $20,000 to $22,499 | 38 (15.2%) | 0 (0.0%) |
| $22,500 to $24,999 | 0 (0.0%) | 0 (0.0%) |
| $25,000 to $29,999 | 0 (0.0%) | 0 (0.0%) |
| $30,000 to $34,999 | 0 (0.0%) | 46 (18.9%) |
| $35,000 to $39,999 | 10 (4.0%) | 0 (0.0%) |
| $40,000 to $44,999 | 9 (3.6%) | 16 (6.6%) |
| $45,000 to $49,999 | 29 (11.6%) | 42 (17.3%) |
| $50,000 to $54,999 | 0 (0.0%) | 43 (17.7%) |
| $55,000 to $64,999 | 0 (0.0%) | 0 (0.0%) |
| $65,000 to $74,999 | 0 (0.0%) | 0 (0.0%) |
| $75,000 to $99,999 | 41 (16.4%) | 27 (11.1%) |
| $100,000+ | 56 (22.4%) | 0 (0.0%) |
| Total | 250 (100.0%) | 243 (100.0%) |
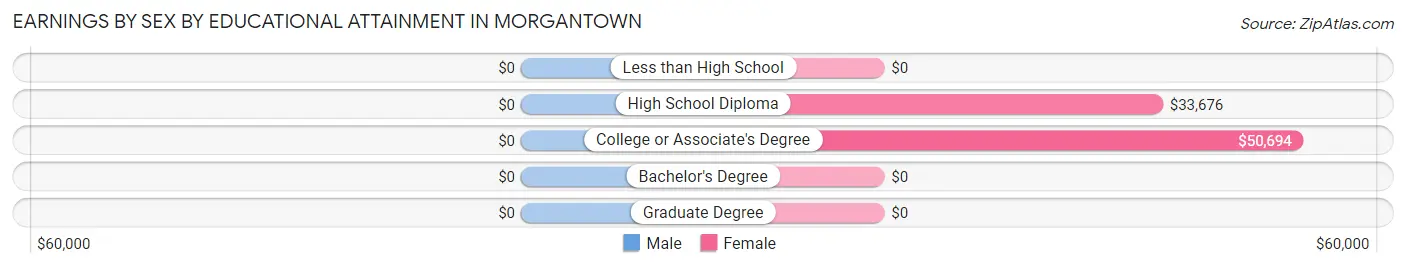
Earnings by Sex by Educational Attainment in Morgantown
| Educational Attainment | Male Income | Female Income |
| Less than High School | - | - |
| High School Diploma | - | - |
| College or Associate's Degree | - | - |
| Bachelor's Degree | - | - |
| Graduate Degree | - | - |
| Total | $45,862 | $41,016 |
Family Income in Morgantown
Family Income Brackets in Morgantown
According to the Morgantown family income data, there are 60 families falling into the $15,000 to $24,999 income range, which is the most common income bracket and makes up 24.5% of all families.
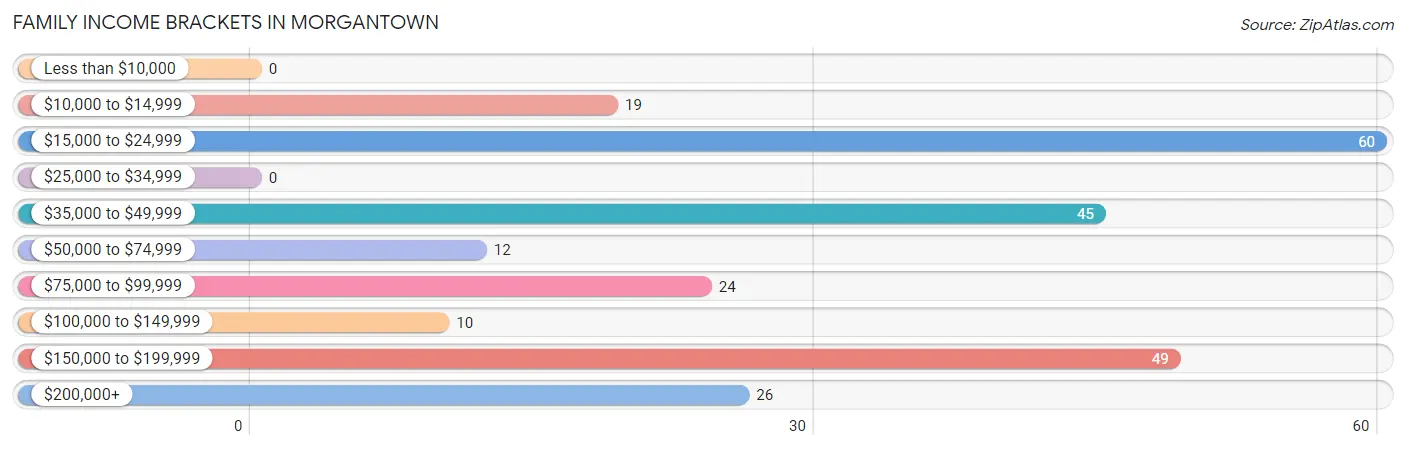
| Income Bracket | # Families | % Families |
| Less than $10,000 | 0 | 0.0% |
| $10,000 to $14,999 | 19 | 7.8% |
| $15,000 to $24,999 | 60 | 24.5% |
| $25,000 to $34,999 | 0 | 0.0% |
| $35,000 to $49,999 | 45 | 18.4% |
| $50,000 to $74,999 | 12 | 4.9% |
| $75,000 to $99,999 | 24 | 9.8% |
| $100,000 to $149,999 | 10 | 4.1% |
| $150,000 to $199,999 | 49 | 20.0% |
| $200,000+ | 26 | 10.6% |
Family Income by Famaliy Size in Morgantown
2-person families (219 | 89.4%) account for the highest median family income in Morgantown with $46,050 per family, while 2-person families (219 | 89.4%) have the highest median income of $23,025 per family member.
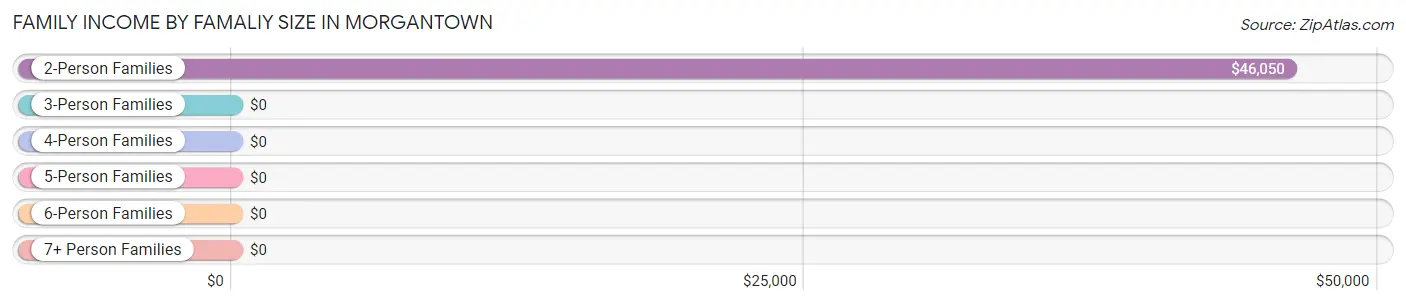
| Income Bracket | # Families | Median Income |
| 2-Person Families | 219 (89.4%) | $46,050 |
| 3-Person Families | 11 (4.5%) | $0 |
| 4-Person Families | 0 (0.0%) | $0 |
| 5-Person Families | 15 (6.1%) | $0 |
| 6-Person Families | 0 (0.0%) | $0 |
| 7+ Person Families | 0 (0.0%) | $0 |
| Total | 245 (100.0%) | $0 |
Family Income by Number of Earners in Morgantown
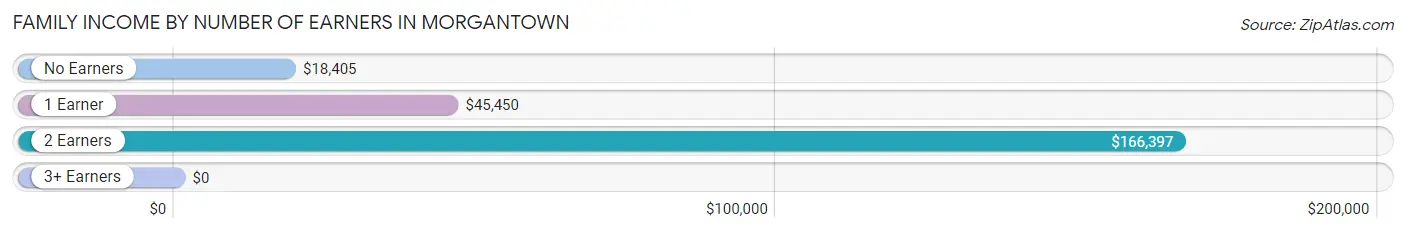
| Number of Earners | # Families | Median Income |
| No Earners | 59 (24.1%) | $18,405 |
| 1 Earner | 89 (36.3%) | $45,450 |
| 2 Earners | 82 (33.5%) | $166,397 |
| 3+ Earners | 15 (6.1%) | $0 |
| Total | 245 (100.0%) | $0 |
Household Income in Morgantown
Household Income Brackets in Morgantown
With 115 households falling in the category, the $15,000 to $24,999 income range is the most frequent in Morgantown, accounting for 23.5% of all households.
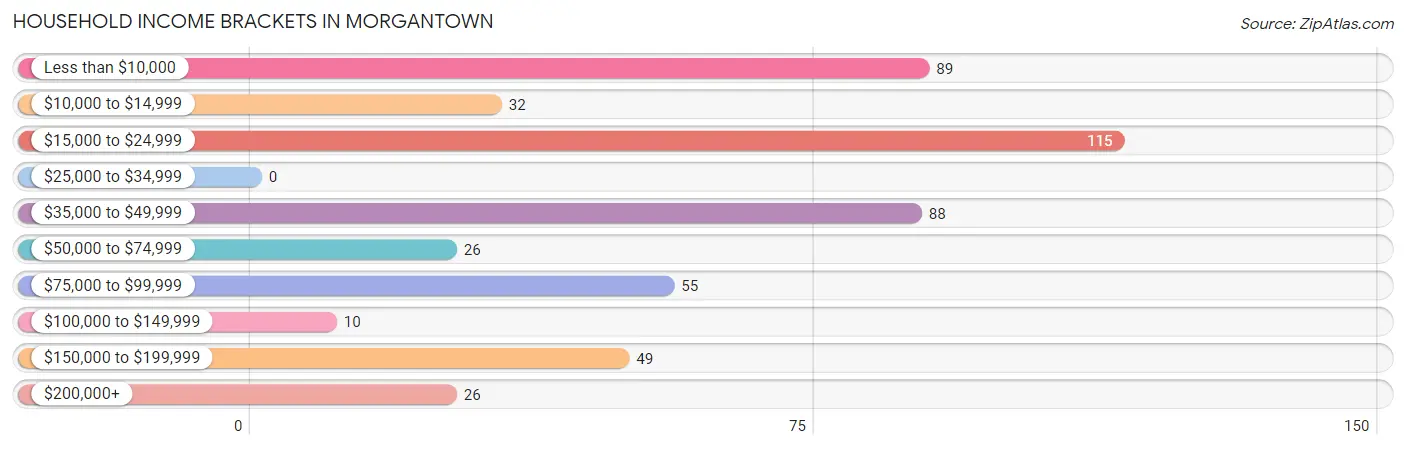
| Income Bracket | # Households | % Households |
| Less than $10,000 | 89 | 18.2% |
| $10,000 to $14,999 | 32 | 6.5% |
| $15,000 to $24,999 | 115 | 23.5% |
| $25,000 to $34,999 | 0 | 0.0% |
| $35,000 to $49,999 | 88 | 18.0% |
| $50,000 to $74,999 | 26 | 5.3% |
| $75,000 to $99,999 | 55 | 11.2% |
| $100,000 to $149,999 | 10 | 2.0% |
| $150,000 to $199,999 | 49 | 10.0% |
| $200,000+ | 26 | 5.3% |
Household Income by Householder Age in Morgantown
The median household income in Morgantown is $0, with the highest median household income of $97,778 found in the 45 to 64 years age bracket for the primary householder. A total of 198 households (40.4%) fall into this category.
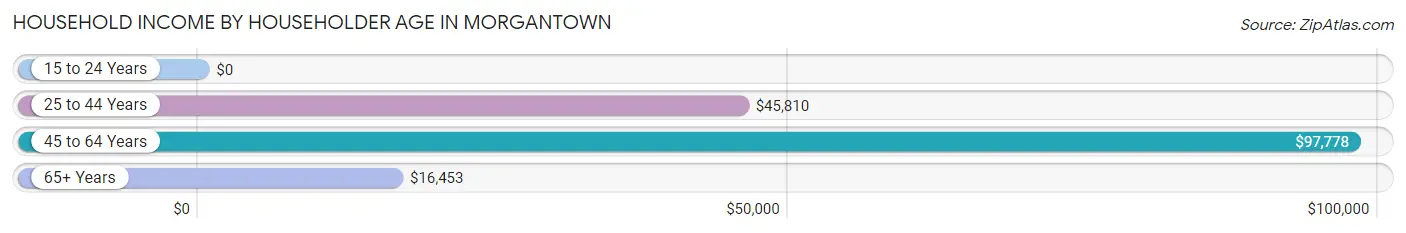
| Income Bracket | # Households | Median Income |
| 15 to 24 Years | 0 (0.0%) | $0 |
| 25 to 44 Years | 97 (19.8%) | $45,810 |
| 45 to 64 Years | 198 (40.4%) | $97,778 |
| 65+ Years | 195 (39.8%) | $16,453 |
| Total | 490 (100.0%) | $0 |
Poverty in Morgantown
Income Below Poverty by Sex and Age in Morgantown
With 11.6% poverty level for males and 39.3% for females among the residents of Morgantown, 75 year old and over males and 65 to 74 year old females are the most vulnerable to poverty, with 3 males (60.0%) and 107 females (90.7%) in their respective age groups living below the poverty level.
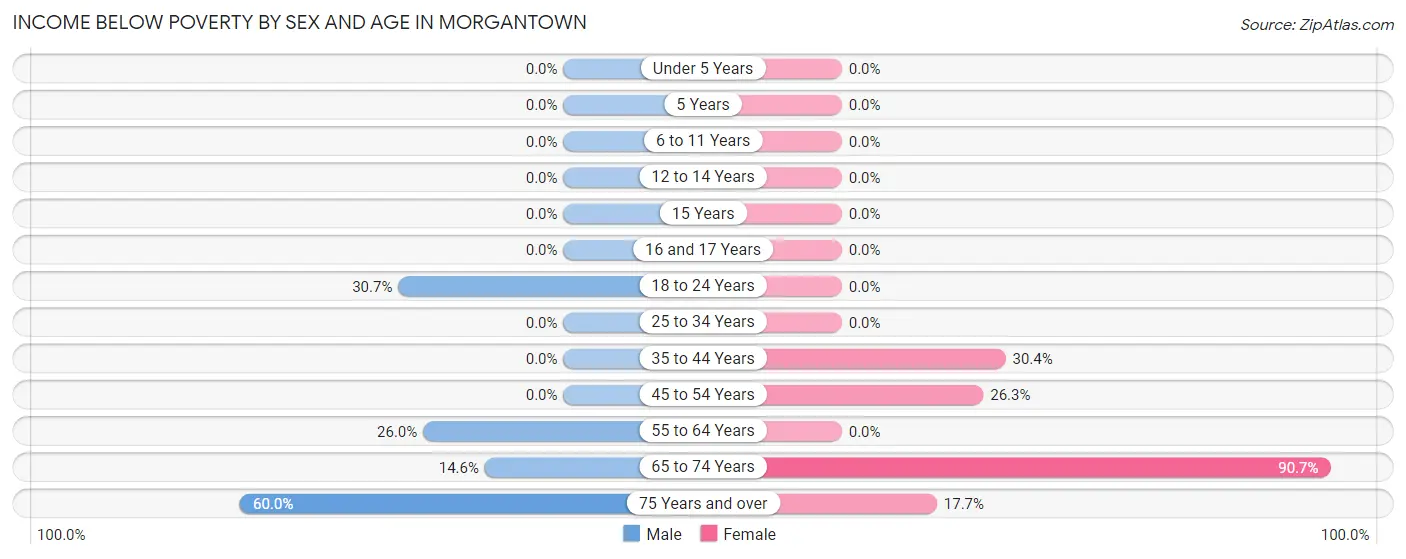
| Age Bracket | Male | Female |
| Under 5 Years | 0 (0.0%) | 0 (0.0%) |
| 5 Years | 0 (0.0%) | 0 (0.0%) |
| 6 to 11 Years | 0 (0.0%) | 0 (0.0%) |
| 12 to 14 Years | 0 (0.0%) | 0 (0.0%) |
| 15 Years | 0 (0.0%) | 0 (0.0%) |
| 16 and 17 Years | 0 (0.0%) | 0 (0.0%) |
| 18 to 24 Years | 19 (30.6%) | 0 (0.0%) |
| 25 to 34 Years | 0 (0.0%) | 0 (0.0%) |
| 35 to 44 Years | 0 (0.0%) | 31 (30.4%) |
| 45 to 54 Years | 0 (0.0%) | 26 (26.3%) |
| 55 to 64 Years | 19 (26.0%) | 0 (0.0%) |
| 65 to 74 Years | 14 (14.6%) | 107 (90.7%) |
| 75 Years and over | 3 (60.0%) | 15 (17.6%) |
| Total | 55 (11.6%) | 179 (39.3%) |
Income Above Poverty by Sex and Age in Morgantown
According to the poverty statistics in Morgantown, males aged 6 to 11 years and females aged 25 to 34 years are the age groups that are most secure financially, with 100.0% of males and 100.0% of females in these age groups living above the poverty line.
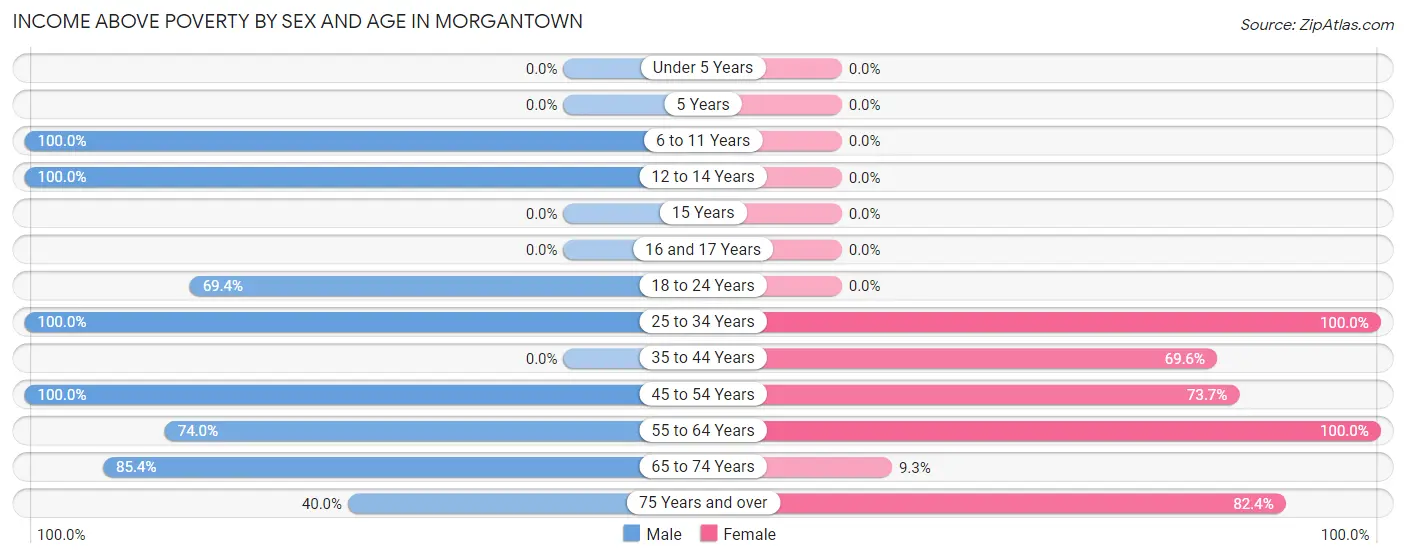
| Age Bracket | Male | Female |
| Under 5 Years | 0 (0.0%) | 0 (0.0%) |
| 5 Years | 0 (0.0%) | 0 (0.0%) |
| 6 to 11 Years | 45 (100.0%) | 0 (0.0%) |
| 12 to 14 Years | 23 (100.0%) | 0 (0.0%) |
| 15 Years | 0 (0.0%) | 0 (0.0%) |
| 16 and 17 Years | 0 (0.0%) | 0 (0.0%) |
| 18 to 24 Years | 43 (69.4%) | 0 (0.0%) |
| 25 to 34 Years | 80 (100.0%) | 17 (100.0%) |
| 35 to 44 Years | 0 (0.0%) | 71 (69.6%) |
| 45 to 54 Years | 91 (100.0%) | 73 (73.7%) |
| 55 to 64 Years | 54 (74.0%) | 34 (100.0%) |
| 65 to 74 Years | 82 (85.4%) | 11 (9.3%) |
| 75 Years and over | 2 (40.0%) | 70 (82.4%) |
| Total | 420 (88.4%) | 276 (60.7%) |
Income Below Poverty Among Married-Couple Families in Morgantown
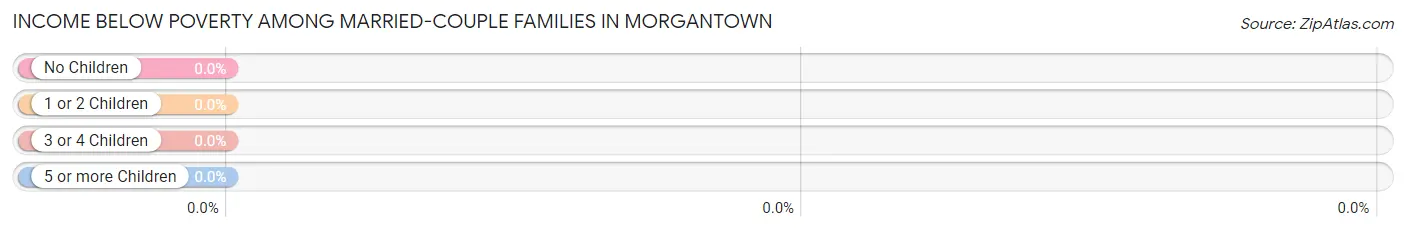
| Children | Above Poverty | Below Poverty |
| No Children | 81 (100.0%) | 0 (0.0%) |
| 1 or 2 Children | 15 (100.0%) | 0 (0.0%) |
| 3 or 4 Children | 0 (0.0%) | 0 (0.0%) |
| 5 or more Children | 0 (0.0%) | 0 (0.0%) |
| Total | 96 (100.0%) | 0 (0.0%) |
Income Below Poverty Among Single-Parent Households in Morgantown
According to the poverty data in Morgantown, 46.3% or 19 single-father households and 28.7% or 31 single-mother households are living below the poverty line. Among single-father households, those with no children have the highest poverty rate, with 19 households (46.3%) experiencing poverty. Likewise, among single-mother households, those with no children have the highest poverty rate, with 31 households (37.3%) falling below the poverty line.
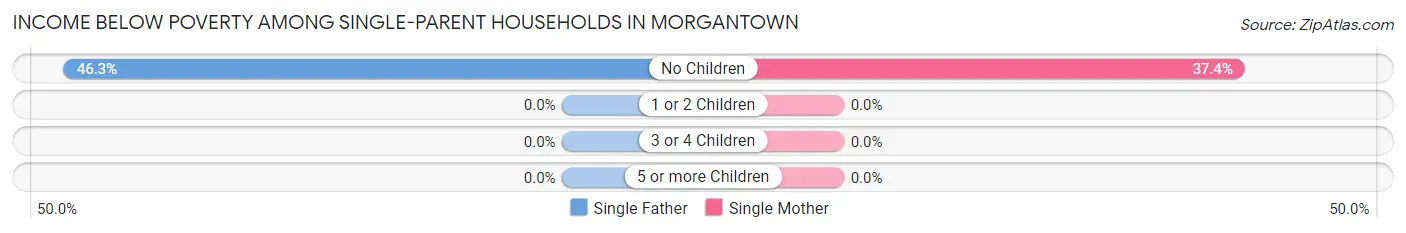
| Children | Single Father | Single Mother |
| No Children | 19 (46.3%) | 31 (37.3%) |
| 1 or 2 Children | 0 (0.0%) | 0 (0.0%) |
| 3 or 4 Children | 0 (0.0%) | 0 (0.0%) |
| 5 or more Children | 0 (0.0%) | 0 (0.0%) |
| Total | 19 (46.3%) | 31 (28.7%) |
Income Below Poverty Among Married-Couple vs Single-Parent Households in Morgantown
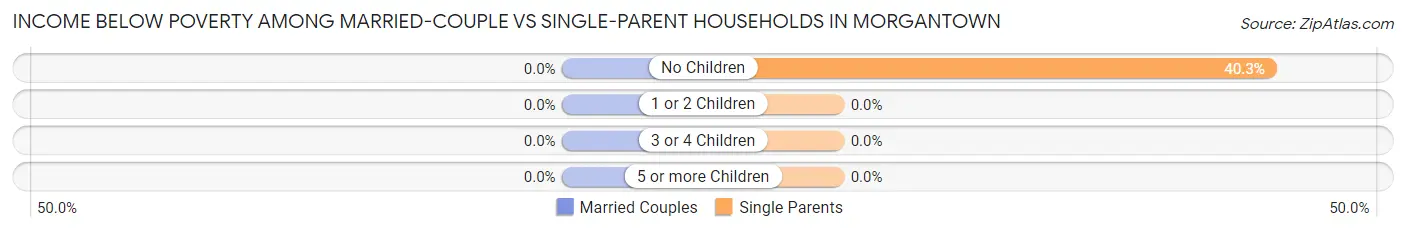
| Children | Married-Couple Families | Single-Parent Households |
| No Children | 0 (0.0%) | 50 (40.3%) |
| 1 or 2 Children | 0 (0.0%) | 0 (0.0%) |
| 3 or 4 Children | 0 (0.0%) | 0 (0.0%) |
| 5 or more Children | 0 (0.0%) | 0 (0.0%) |
| Total | 0 (0.0%) | 50 (33.6%) |
Race in Morgantown
The most populous races in Morgantown are Black / African American (594 | 63.9%), White / Caucasian (321 | 34.5%), and Two or more Races (15 | 1.6%).
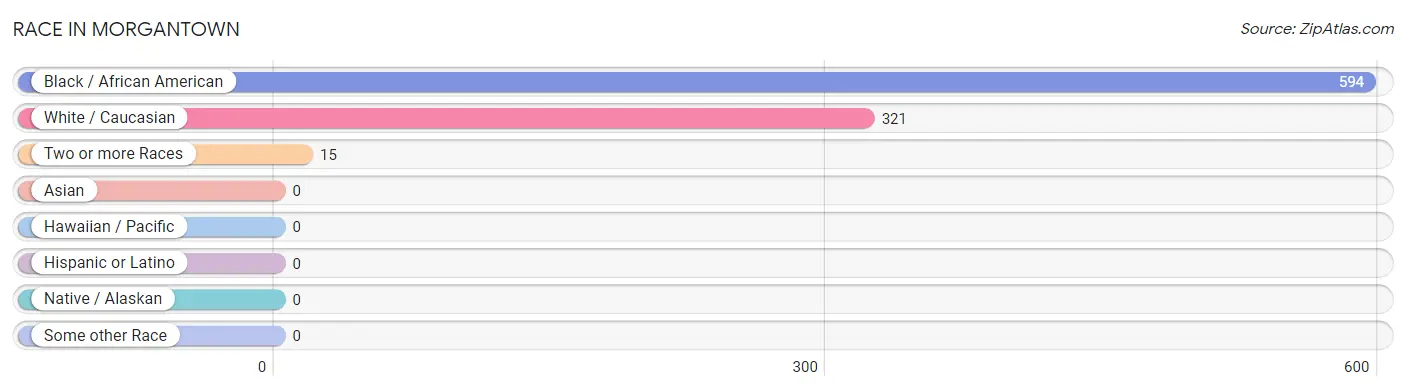
| Race | # Population | % Population |
| Asian | 0 | 0.0% |
| Black / African American | 594 | 63.9% |
| Hawaiian / Pacific | 0 | 0.0% |
| Hispanic or Latino | 0 | 0.0% |
| Native / Alaskan | 0 | 0.0% |
| White / Caucasian | 321 | 34.5% |
| Two or more Races | 15 | 1.6% |
| Some other Race | 0 | 0.0% |
| Total | 930 | 100.0% |
Ancestry in Morgantown
The most populous ancestries reported in Morgantown are English (39 | 4.2%), Irish (31 | 3.3%), American (24 | 2.6%), and Italian (10 | 1.1%), together accounting for 11.2% of all Morgantown residents.
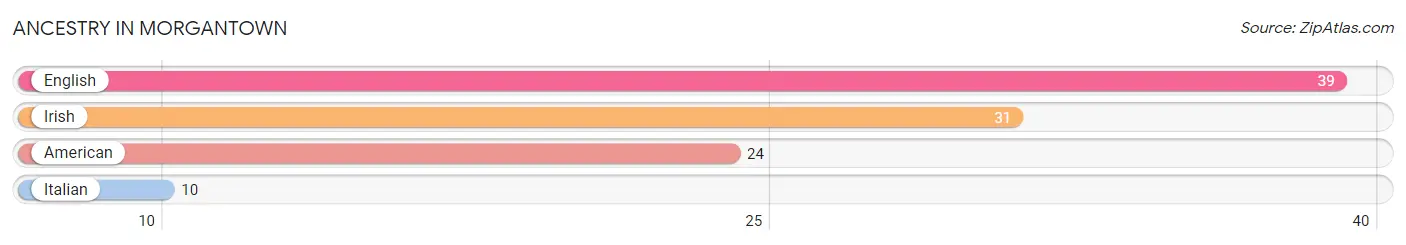
| Ancestry | # Population | % Population |
| American | 24 | 2.6% |
| English | 39 | 4.2% |
| Irish | 31 | 3.3% |
| Italian | 10 | 1.1% | View All 4 Rows |
Immigrants in Morgantown

| Immigration Origin | # Population | % Population | View All 0 Rows |
Sex and Age in Morgantown
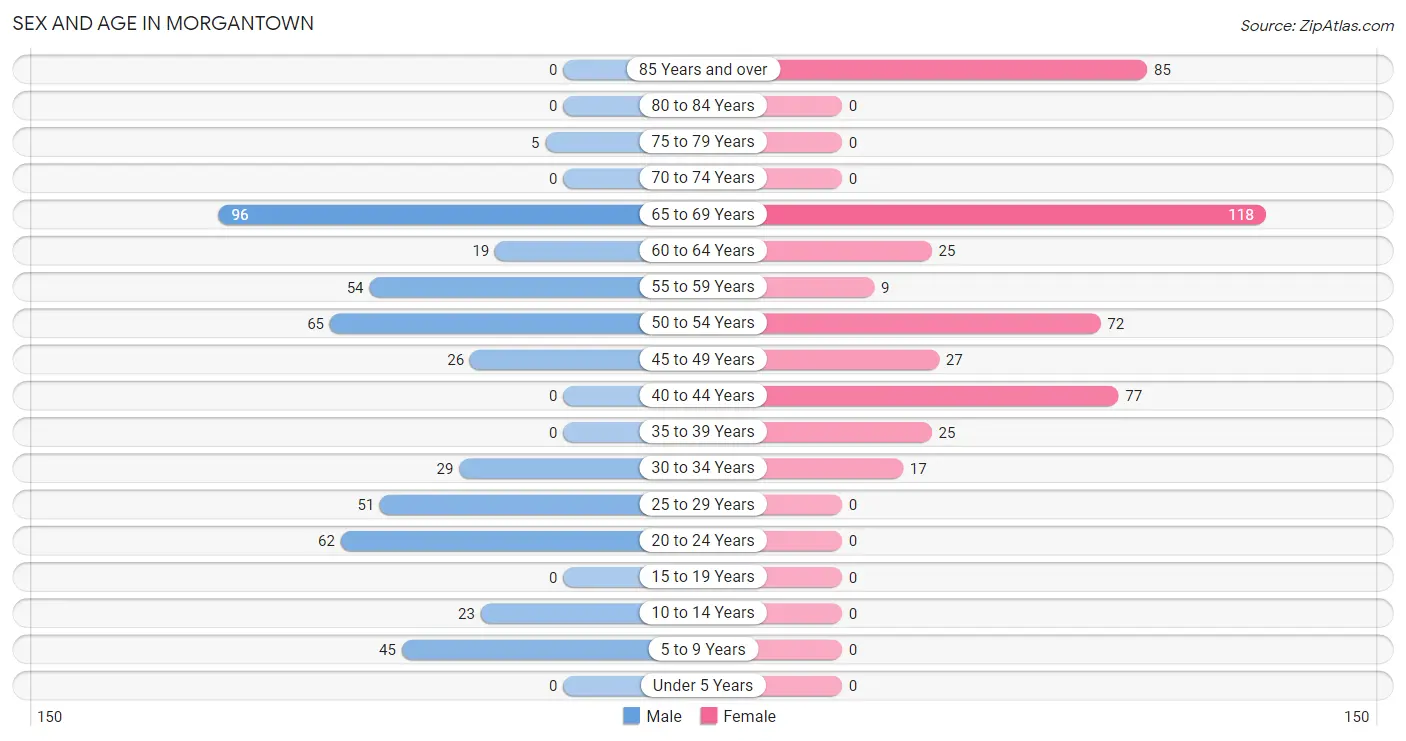
Sex and Age in Morgantown
The most populous age groups in Morgantown are 65 to 69 Years (96 | 20.2%) for men and 65 to 69 Years (118 | 25.9%) for women.
| Age Bracket | Male | Female |
| Under 5 Years | 0 (0.0%) | 0 (0.0%) |
| 5 to 9 Years | 45 (9.5%) | 0 (0.0%) |
| 10 to 14 Years | 23 (4.8%) | 0 (0.0%) |
| 15 to 19 Years | 0 (0.0%) | 0 (0.0%) |
| 20 to 24 Years | 62 (13.1%) | 0 (0.0%) |
| 25 to 29 Years | 51 (10.7%) | 0 (0.0%) |
| 30 to 34 Years | 29 (6.1%) | 17 (3.7%) |
| 35 to 39 Years | 0 (0.0%) | 25 (5.5%) |
| 40 to 44 Years | 0 (0.0%) | 77 (16.9%) |
| 45 to 49 Years | 26 (5.5%) | 27 (5.9%) |
| 50 to 54 Years | 65 (13.7%) | 72 (15.8%) |
| 55 to 59 Years | 54 (11.4%) | 9 (2.0%) |
| 60 to 64 Years | 19 (4.0%) | 25 (5.5%) |
| 65 to 69 Years | 96 (20.2%) | 118 (25.9%) |
| 70 to 74 Years | 0 (0.0%) | 0 (0.0%) |
| 75 to 79 Years | 5 (1.1%) | 0 (0.0%) |
| 80 to 84 Years | 0 (0.0%) | 0 (0.0%) |
| 85 Years and over | 0 (0.0%) | 85 (18.7%) |
| Total | 475 (100.0%) | 455 (100.0%) |
Families and Households in Morgantown
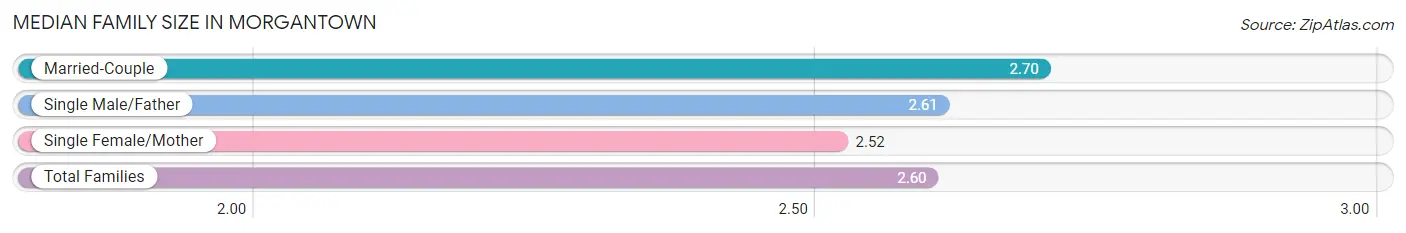
Median Family Size in Morgantown
The median family size in Morgantown is 2.60 persons per family, with married-couple families (96 | 39.2%) accounting for the largest median family size of 2.7 persons per family. On the other hand, single female/mother families (108 | 44.1%) represent the smallest median family size with 2.52 persons per family.
| Family Type | # Families | Family Size |
| Married-Couple | 96 (39.2%) | 2.70 |
| Single Male/Father | 41 (16.7%) | 2.61 |
| Single Female/Mother | 108 (44.1%) | 2.52 |
| Total Families | 245 (100.0%) | 2.60 |
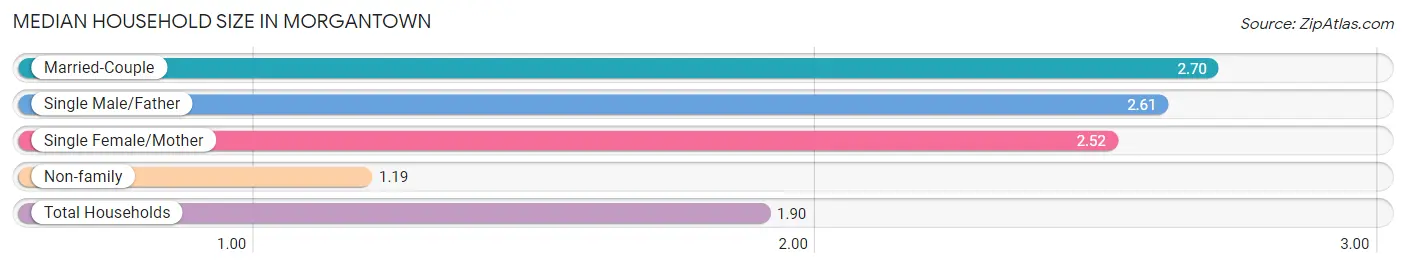
Median Household Size in Morgantown
The median household size in Morgantown is 1.90 persons per household, with married-couple households (96 | 19.6%) accounting for the largest median household size of 2.7 persons per household. non-family households (245 | 50.0%) represent the smallest median household size with 1.19 persons per household.
| Household Type | # Households | Household Size |
| Married-Couple | 96 (19.6%) | 2.70 |
| Single Male/Father | 41 (8.4%) | 2.61 |
| Single Female/Mother | 108 (22.0%) | 2.52 |
| Non-family | 245 (50.0%) | 1.19 |
| Total Households | 490 (100.0%) | 1.90 |
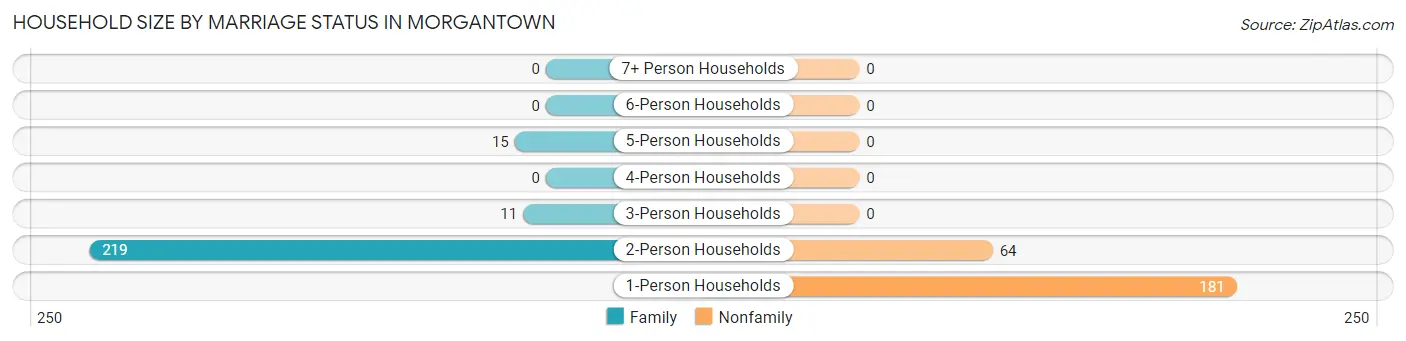
Household Size by Marriage Status in Morgantown
Out of a total of 490 households in Morgantown, 245 (50.0%) are family households, while 245 (50.0%) are nonfamily households. The most numerous type of family households are 2-person households, comprising 219, and the most common type of nonfamily households are 1-person households, comprising 181.
| Household Size | Family Households | Nonfamily Households |
| 1-Person Households | - | 181 (36.9%) |
| 2-Person Households | 219 (44.7%) | 64 (13.1%) |
| 3-Person Households | 11 (2.2%) | 0 (0.0%) |
| 4-Person Households | 0 (0.0%) | 0 (0.0%) |
| 5-Person Households | 15 (3.1%) | 0 (0.0%) |
| 6-Person Households | 0 (0.0%) | 0 (0.0%) |
| 7+ Person Households | 0 (0.0%) | 0 (0.0%) |
| Total | 245 (50.0%) | 245 (50.0%) |
Female Fertility in Morgantown
Fertility by Age in Morgantown
| Age Bracket | Women with Births | Births / 1,000 Women |
| 15 to 19 years | 0 (0.0%) | 0.0 |
| 20 to 34 years | 0 (0.0%) | 0.0 |
| 35 to 50 years | 0 (0.0%) | 0.0 |
| Total | 0 (0.0%) | 0.0 |
Fertility by Age by Marriage Status in Morgantown
| Age Bracket | Married | Unmarried |
| 15 to 19 years | 0 (0.0%) | 0 (0.0%) |
| 20 to 34 years | 0 (0.0%) | 0 (0.0%) |
| 35 to 50 years | 0 (0.0%) | 0 (0.0%) |
| Total | 0 (0.0%) | 0 (0.0%) |
Fertility by Education in Morgantown
| Educational Attainment | Women with Births | Births / 1,000 Women |
| Less than High School | 0 (0.0%) | 0.0 |
| High School Diploma | 0 (0.0%) | 0.0 |
| College or Associate's Degree | 0 (0.0%) | 0.0 |
| Bachelor's Degree | 0 (0.0%) | 0.0 |
| Graduate Degree | 0 (0.0%) | 0.0 |
| Total | 0 (0.0%) | 0.0 |
Fertility by Education by Marriage Status in Morgantown
| Educational Attainment | Married | Unmarried |
| Less than High School | 0 (0.0%) | 0 (0.0%) |
| High School Diploma | 0 (0.0%) | 0 (0.0%) |
| College or Associate's Degree | 0 (0.0%) | 0 (0.0%) |
| Bachelor's Degree | 0 (0.0%) | 0 (0.0%) |
| Graduate Degree | 0 (0.0%) | 0 (0.0%) |
| Total | 0 (0.0%) | 0 (0.0%) |
Employment Characteristics in Morgantown
Employment by Class of Employer in Morgantown
Among the 359 employed individuals in Morgantown, private company employees (186 | 51.8%), state government employees (63 | 17.5%), and self-employed (incorporated) (52 | 14.5%) make up the most common classes of employment.
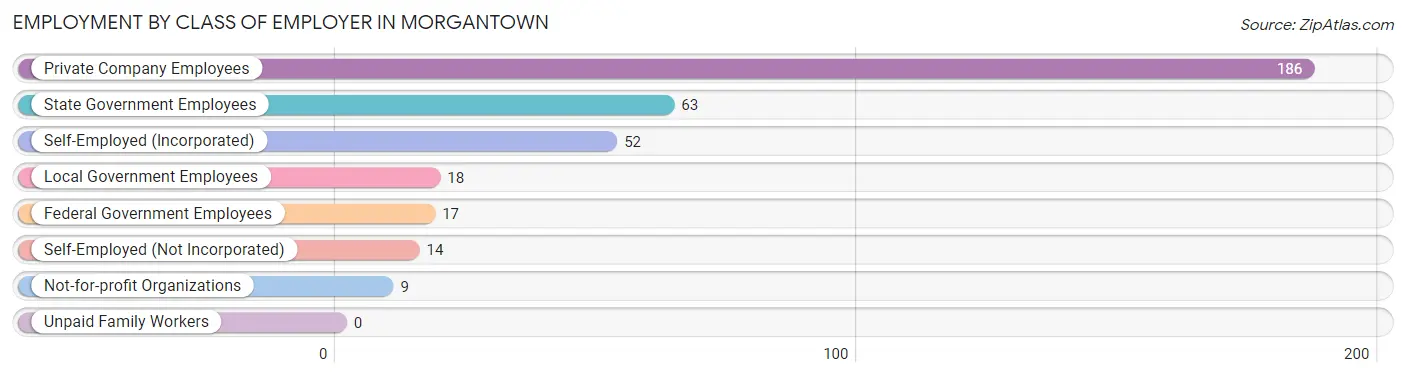
| Employer Class | # Employees | % Employees |
| Private Company Employees | 186 | 51.8% |
| Self-Employed (Incorporated) | 52 | 14.5% |
| Self-Employed (Not Incorporated) | 14 | 3.9% |
| Not-for-profit Organizations | 9 | 2.5% |
| Local Government Employees | 18 | 5.0% |
| State Government Employees | 63 | 17.5% |
| Federal Government Employees | 17 | 4.7% |
| Unpaid Family Workers | 0 | 0.0% |
| Total | 359 | 100.0% |
Employment Status by Age in Morgantown
According to the labor force statistics for Morgantown, out of the total population over 16 years of age (862), 49.5% or 427 individuals are in the labor force, with 9.6% or 41 of them unemployed. The age group with the highest labor force participation rate is 25 to 29 years, with 100.0% or 51 individuals in the labor force. Within the labor force, the 20 to 24 years age range has the highest percentage of unemployed individuals, with 51.4% or 19 of them being unemployed.
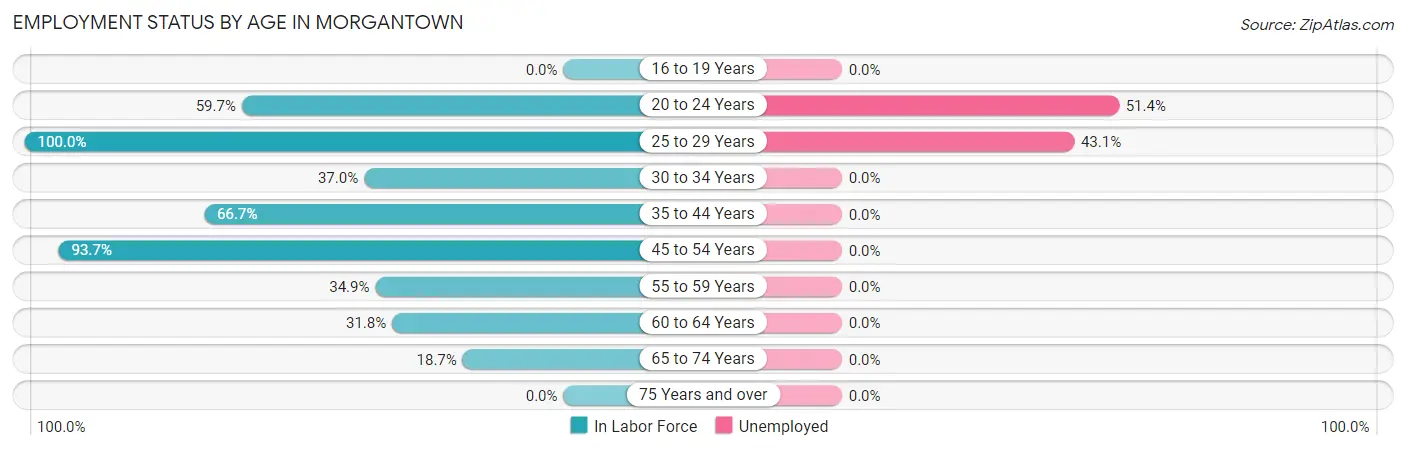
| Age Bracket | In Labor Force | Unemployed |
| 16 to 19 Years | 0 (0.0%) | 0 (0.0%) |
| 20 to 24 Years | 37 (59.7%) | 19 (51.4%) |
| 25 to 29 Years | 51 (100.0%) | 22 (43.1%) |
| 30 to 34 Years | 17 (37.0%) | 0 (0.0%) |
| 35 to 44 Years | 68 (66.7%) | 0 (0.0%) |
| 45 to 54 Years | 178 (93.7%) | 0 (0.0%) |
| 55 to 59 Years | 22 (34.9%) | 0 (0.0%) |
| 60 to 64 Years | 14 (31.8%) | 0 (0.0%) |
| 65 to 74 Years | 40 (18.7%) | 0 (0.0%) |
| 75 Years and over | 0 (0.0%) | 0 (0.0%) |
| Total | 427 (49.5%) | 41 (9.6%) |
Employment Status by Educational Attainment in Morgantown
According to labor force statistics for Morgantown, 70.6% of individuals (350) out of the total population between 25 and 64 years of age (496) are in the labor force, with 6.3% or 22 of them being unemployed. The group with the highest labor force participation rate are those with the educational attainment of bachelor's degree or higher, with 100.0% or 81 individuals in the labor force. Within the labor force, individuals with college / associate degree education have the highest percentage of unemployment, with 24.7% or 22 of them being unemployed.
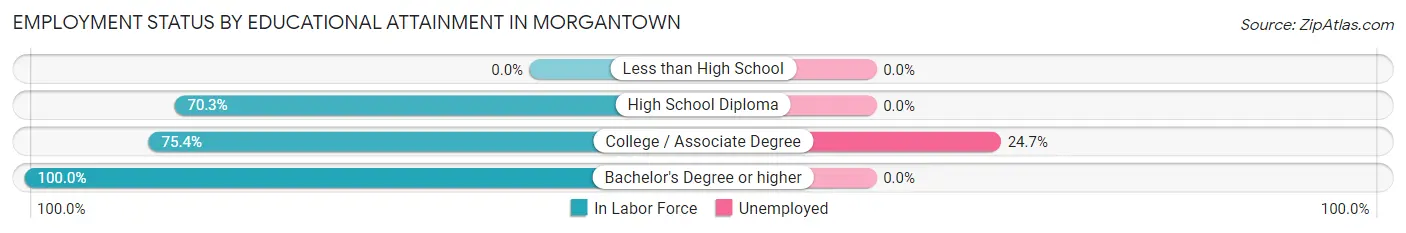
| Educational Attainment | In Labor Force | Unemployed |
| Less than High School | 0 (0.0%) | 0 (0.0%) |
| High School Diploma | 180 (70.3%) | 0 (0.0%) |
| College / Associate Degree | 89 (75.4%) | 29 (24.7%) |
| Bachelor's Degree or higher | 81 (100.0%) | 0 (0.0%) |
| Total | 350 (70.6%) | 31 (6.3%) |
Employment Occupations by Sex in Morgantown
Management, Business, Science and Arts Occupations
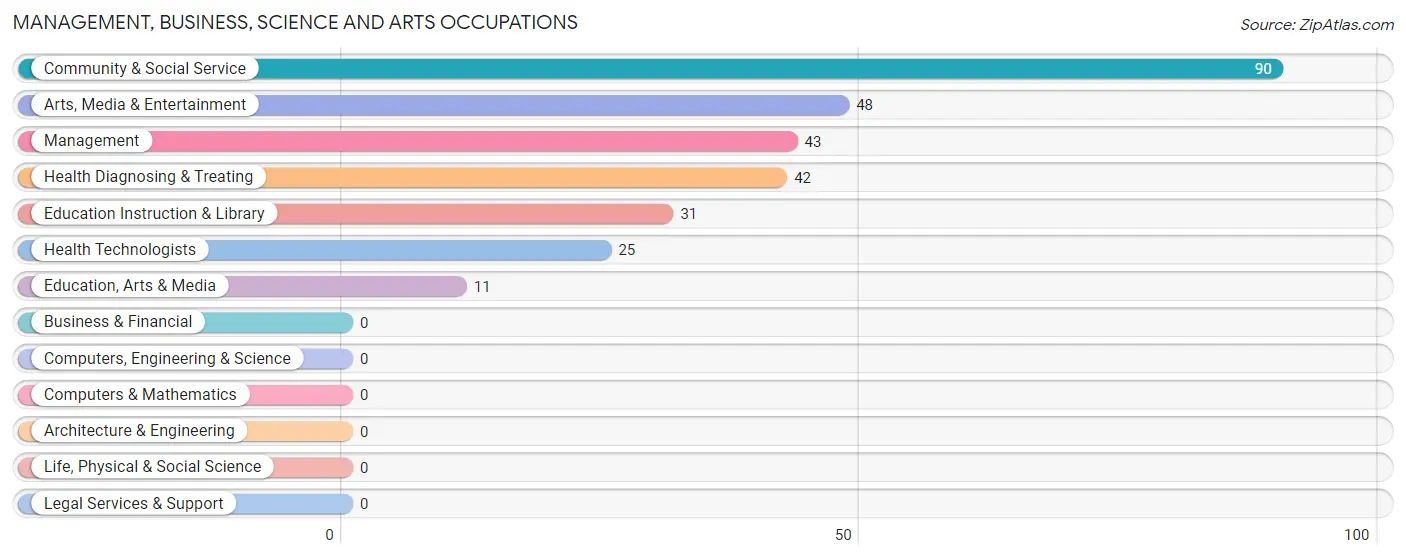
The most common Management, Business, Science and Arts occupations in Morgantown are Community & Social Service (90 | 23.3%), Arts, Media & Entertainment (48 | 12.4%), Management (43 | 11.1%), Health Diagnosing & Treating (42 | 10.9%), and Education Instruction & Library (31 | 8.0%).
Management, Business, Science and Arts Occupations by Sex
Within the Management, Business, Science and Arts occupations in Morgantown, the most male-oriented occupations are Education, Arts & Media (81.8%), Community & Social Service (10.0%), and Management (9.3%), while the most female-oriented occupations are Education Instruction & Library (100.0%), Arts, Media & Entertainment (100.0%), and Health Diagnosing & Treating (100.0%).
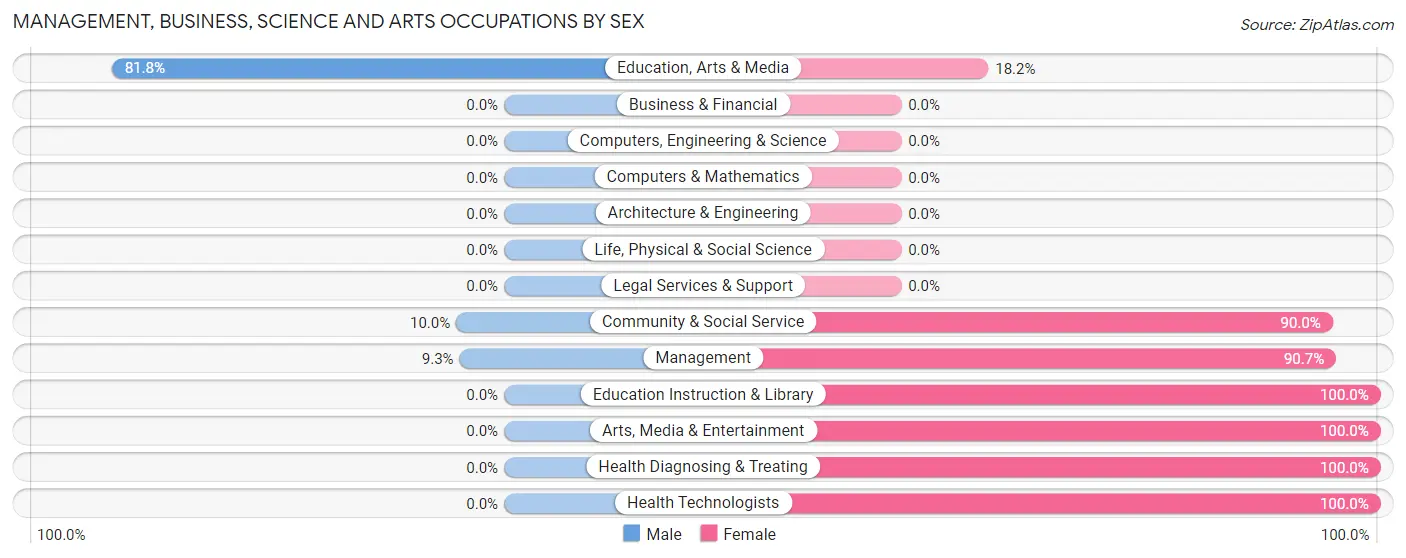
| Occupation | Male | Female |
| Management | 4 (9.3%) | 39 (90.7%) |
| Business & Financial | 0 (0.0%) | 0 (0.0%) |
| Computers, Engineering & Science | 0 (0.0%) | 0 (0.0%) |
| Computers & Mathematics | 0 (0.0%) | 0 (0.0%) |
| Architecture & Engineering | 0 (0.0%) | 0 (0.0%) |
| Life, Physical & Social Science | 0 (0.0%) | 0 (0.0%) |
| Community & Social Service | 9 (10.0%) | 81 (90.0%) |
| Education, Arts & Media | 9 (81.8%) | 2 (18.2%) |
| Legal Services & Support | 0 (0.0%) | 0 (0.0%) |
| Education Instruction & Library | 0 (0.0%) | 31 (100.0%) |
| Arts, Media & Entertainment | 0 (0.0%) | 48 (100.0%) |
| Health Diagnosing & Treating | 0 (0.0%) | 42 (100.0%) |
| Health Technologists | 0 (0.0%) | 25 (100.0%) |
| Total (Category) | 13 (7.4%) | 162 (92.6%) |
| Total (Overall) | 189 (49.0%) | 197 (51.0%) |
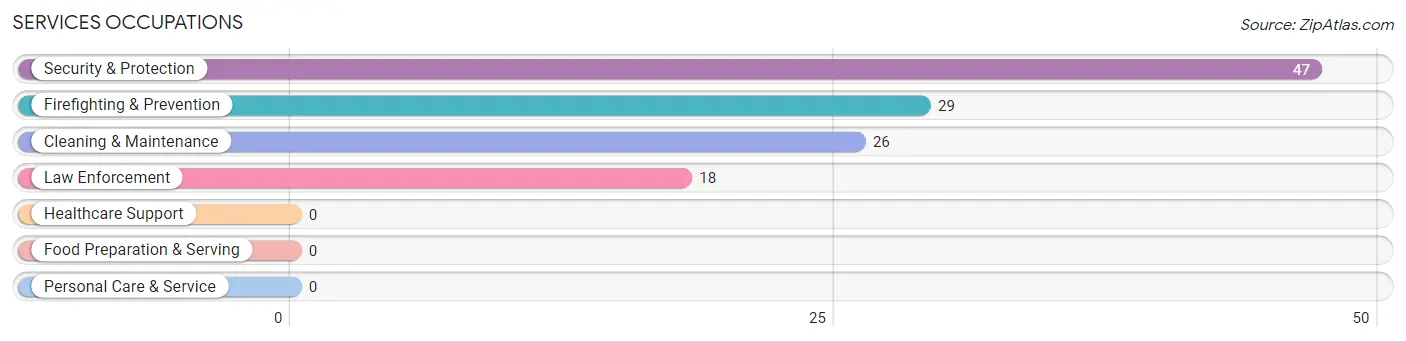
Services Occupations
The most common Services occupations in Morgantown are Security & Protection (47 | 12.2%), Firefighting & Prevention (29 | 7.5%), Cleaning & Maintenance (26 | 6.7%), and Law Enforcement (18 | 4.7%).
Services Occupations by Sex
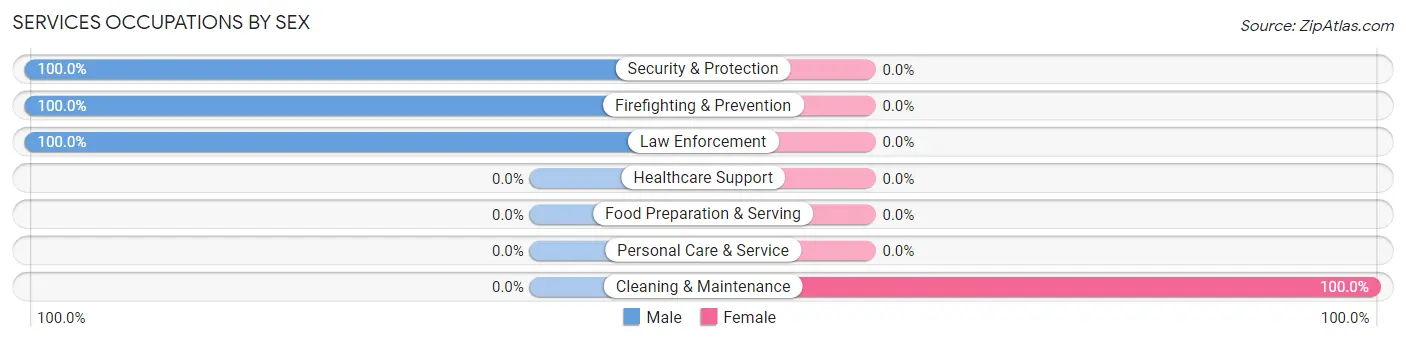
| Occupation | Male | Female |
| Healthcare Support | 0 (0.0%) | 0 (0.0%) |
| Security & Protection | 47 (100.0%) | 0 (0.0%) |
| Firefighting & Prevention | 29 (100.0%) | 0 (0.0%) |
| Law Enforcement | 18 (100.0%) | 0 (0.0%) |
| Food Preparation & Serving | 0 (0.0%) | 0 (0.0%) |
| Cleaning & Maintenance | 0 (0.0%) | 26 (100.0%) |
| Personal Care & Service | 0 (0.0%) | 0 (0.0%) |
| Total (Category) | 47 (64.4%) | 26 (35.6%) |
| Total (Overall) | 189 (49.0%) | 197 (51.0%) |
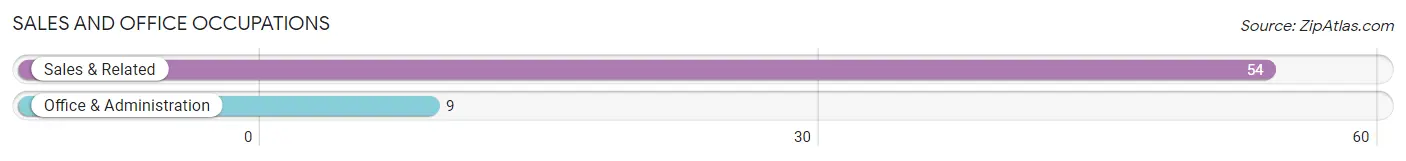
Sales and Office Occupations
The most common Sales and Office occupations in Morgantown are Sales & Related (54 | 14.0%), and Office & Administration (9 | 2.3%).
Sales and Office Occupations by Sex
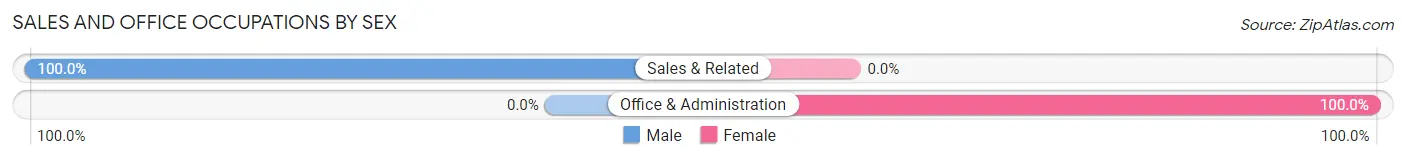
| Occupation | Male | Female |
| Sales & Related | 54 (100.0%) | 0 (0.0%) |
| Office & Administration | 0 (0.0%) | 9 (100.0%) |
| Total (Category) | 54 (85.7%) | 9 (14.3%) |
| Total (Overall) | 189 (49.0%) | 197 (51.0%) |
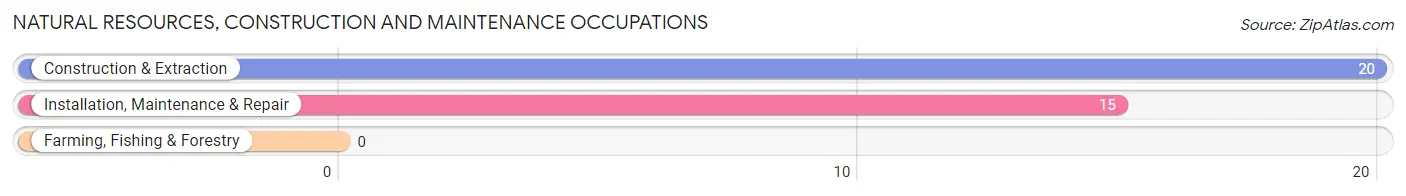
Natural Resources, Construction and Maintenance Occupations
The most common Natural Resources, Construction and Maintenance occupations in Morgantown are Construction & Extraction (20 | 5.2%), and Installation, Maintenance & Repair (15 | 3.9%).
Natural Resources, Construction and Maintenance Occupations by Sex
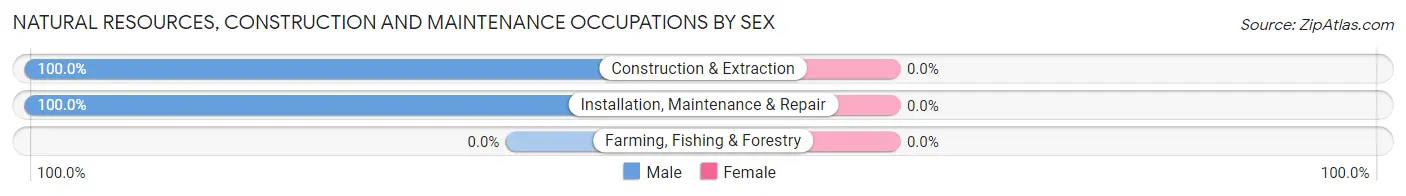
| Occupation | Male | Female |
| Farming, Fishing & Forestry | 0 (0.0%) | 0 (0.0%) |
| Construction & Extraction | 20 (100.0%) | 0 (0.0%) |
| Installation, Maintenance & Repair | 15 (100.0%) | 0 (0.0%) |
| Total (Category) | 35 (100.0%) | 0 (0.0%) |
| Total (Overall) | 189 (49.0%) | 197 (51.0%) |
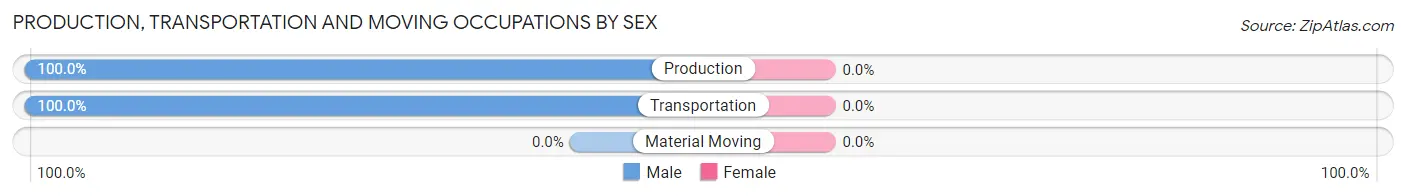
Production, Transportation and Moving Occupations
The most common Production, Transportation and Moving occupations in Morgantown are Transportation (26 | 6.7%), and Production (14 | 3.6%).
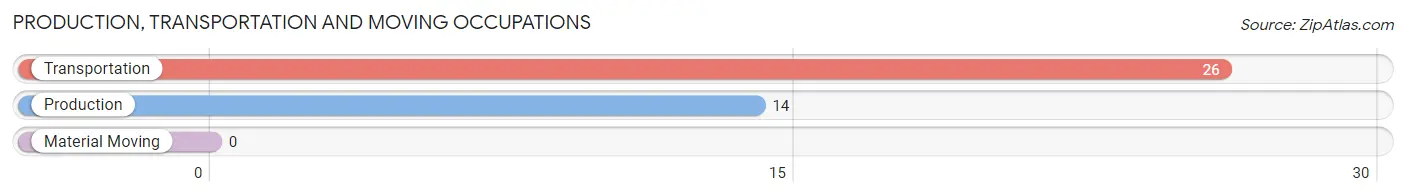
Production, Transportation and Moving Occupations by Sex
| Occupation | Male | Female |
| Production | 14 (100.0%) | 0 (0.0%) |
| Transportation | 26 (100.0%) | 0 (0.0%) |
| Material Moving | 0 (0.0%) | 0 (0.0%) |
| Total (Category) | 40 (100.0%) | 0 (0.0%) |
| Total (Overall) | 189 (49.0%) | 197 (51.0%) |
Employment Industries by Sex in Morgantown
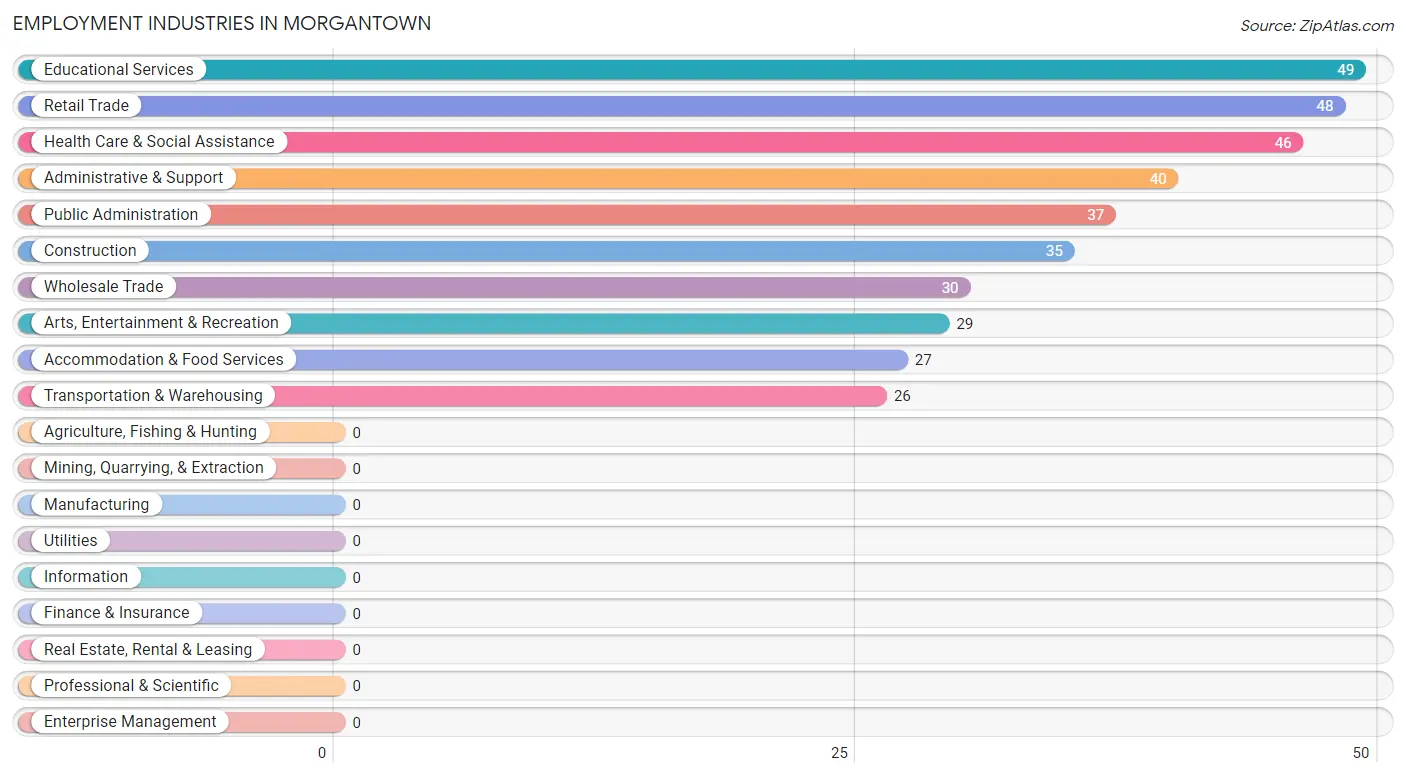
Employment Industries in Morgantown
The major employment industries in Morgantown include Educational Services (49 | 12.7%), Retail Trade (48 | 12.4%), Health Care & Social Assistance (46 | 11.9%), Administrative & Support (40 | 10.4%), and Public Administration (37 | 9.6%).
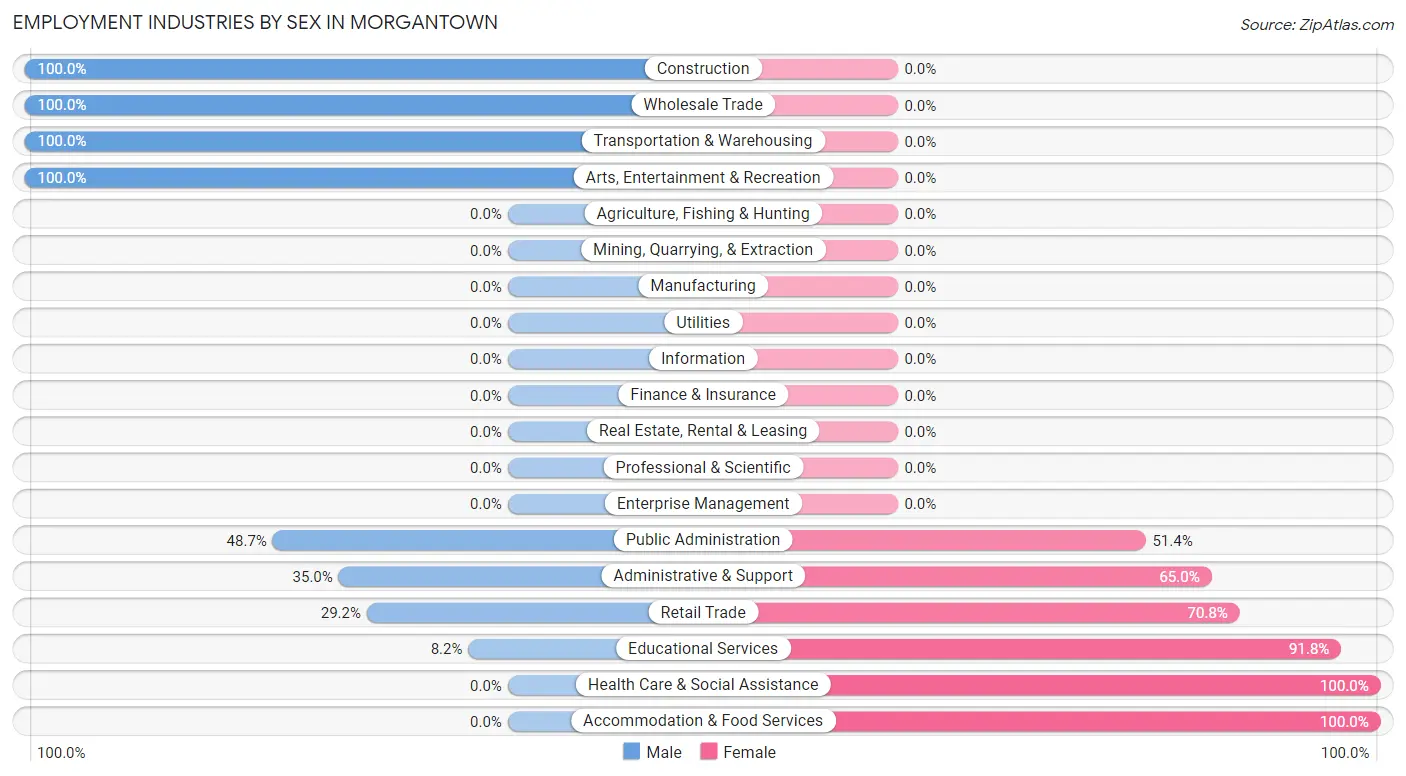
Employment Industries by Sex in Morgantown
The Morgantown industries that see more men than women are Construction (100.0%), Wholesale Trade (100.0%), and Transportation & Warehousing (100.0%), whereas the industries that tend to have a higher number of women are Health Care & Social Assistance (100.0%), Accommodation & Food Services (100.0%), and Educational Services (91.8%).
| Industry | Male | Female |
| Agriculture, Fishing & Hunting | 0 (0.0%) | 0 (0.0%) |
| Mining, Quarrying, & Extraction | 0 (0.0%) | 0 (0.0%) |
| Construction | 35 (100.0%) | 0 (0.0%) |
| Manufacturing | 0 (0.0%) | 0 (0.0%) |
| Wholesale Trade | 30 (100.0%) | 0 (0.0%) |
| Retail Trade | 14 (29.2%) | 34 (70.8%) |
| Transportation & Warehousing | 26 (100.0%) | 0 (0.0%) |
| Utilities | 0 (0.0%) | 0 (0.0%) |
| Information | 0 (0.0%) | 0 (0.0%) |
| Finance & Insurance | 0 (0.0%) | 0 (0.0%) |
| Real Estate, Rental & Leasing | 0 (0.0%) | 0 (0.0%) |
| Professional & Scientific | 0 (0.0%) | 0 (0.0%) |
| Enterprise Management | 0 (0.0%) | 0 (0.0%) |
| Administrative & Support | 14 (35.0%) | 26 (65.0%) |
| Educational Services | 4 (8.2%) | 45 (91.8%) |
| Health Care & Social Assistance | 0 (0.0%) | 46 (100.0%) |
| Arts, Entertainment & Recreation | 29 (100.0%) | 0 (0.0%) |
| Accommodation & Food Services | 0 (0.0%) | 27 (100.0%) |
| Public Administration | 18 (48.6%) | 19 (51.3%) |
| Total | 189 (49.0%) | 197 (51.0%) |
Education in Morgantown
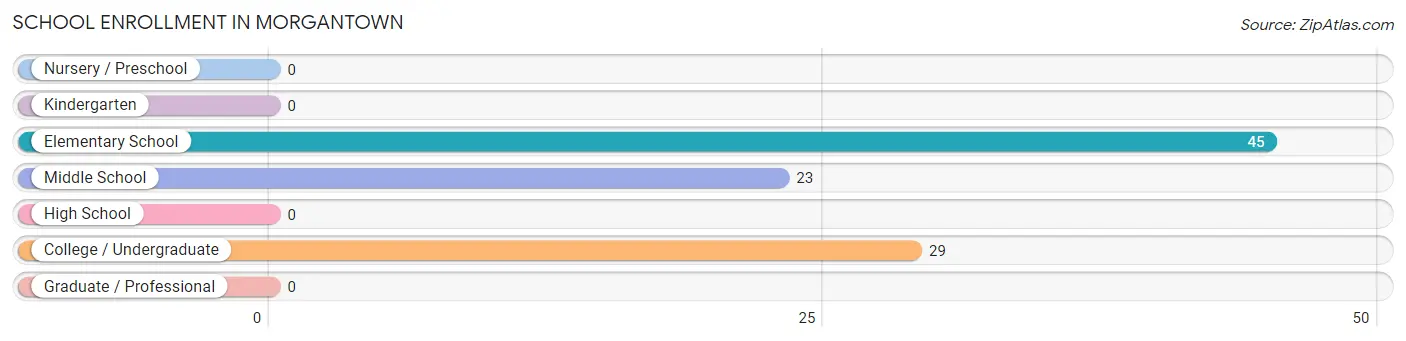
School Enrollment in Morgantown
The most common levels of schooling among the 97 students in Morgantown are elementary school (45 | 46.4%), college / undergraduate (29 | 29.9%), and middle school (23 | 23.7%).
| School Level | # Students | % Students |
| Nursery / Preschool | 0 | 0.0% |
| Kindergarten | 0 | 0.0% |
| Elementary School | 45 | 46.4% |
| Middle School | 23 | 23.7% |
| High School | 0 | 0.0% |
| College / Undergraduate | 29 | 29.9% |
| Graduate / Professional | 0 | 0.0% |
| Total | 97 | 100.0% |
School Enrollment by Age by Funding Source in Morgantown
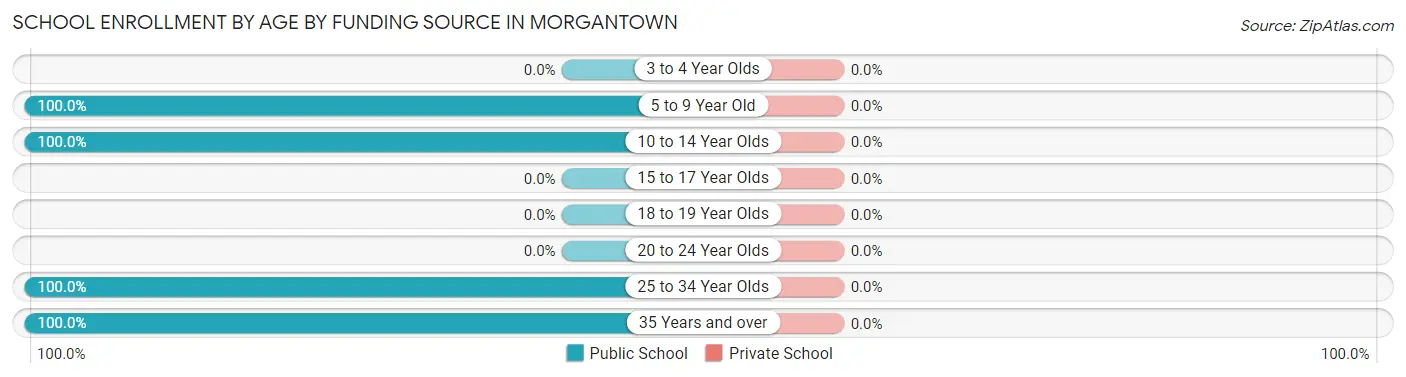
| Age Bracket | Public School | Private School |
| 3 to 4 Year Olds | 0 (0.0%) | 0 (0.0%) |
| 5 to 9 Year Old | 45 (100.0%) | 0 (0.0%) |
| 10 to 14 Year Olds | 23 (100.0%) | 0 (0.0%) |
| 15 to 17 Year Olds | 0 (0.0%) | 0 (0.0%) |
| 18 to 19 Year Olds | 0 (0.0%) | 0 (0.0%) |
| 20 to 24 Year Olds | 0 (0.0%) | 0 (0.0%) |
| 25 to 34 Year Olds | 17 (100.0%) | 0 (0.0%) |
| 35 Years and over | 12 (100.0%) | 0 (0.0%) |
| Total | 97 (100.0%) | 0 (0.0%) |
Educational Attainment by Field of Study in Morgantown
Literature & languages (31 | 37.3%), science & technology (25 | 30.1%), liberal arts & history (21 | 25.3%), education (4 | 4.8%), and engineering (2 | 2.4%) are the most common fields of study among 83 individuals in Morgantown who have obtained a bachelor's degree or higher.
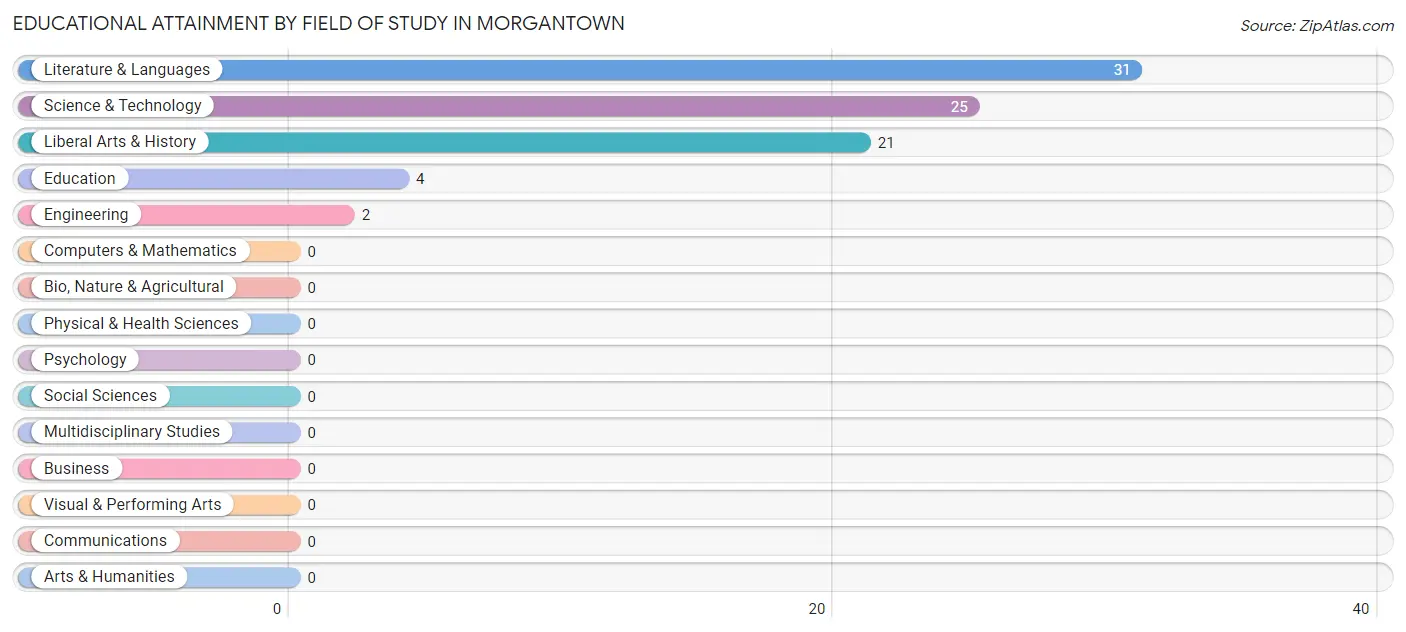
| Field of Study | # Graduates | % Graduates |
| Computers & Mathematics | 0 | 0.0% |
| Bio, Nature & Agricultural | 0 | 0.0% |
| Physical & Health Sciences | 0 | 0.0% |
| Psychology | 0 | 0.0% |
| Social Sciences | 0 | 0.0% |
| Engineering | 2 | 2.4% |
| Multidisciplinary Studies | 0 | 0.0% |
| Science & Technology | 25 | 30.1% |
| Business | 0 | 0.0% |
| Education | 4 | 4.8% |
| Literature & Languages | 31 | 37.3% |
| Liberal Arts & History | 21 | 25.3% |
| Visual & Performing Arts | 0 | 0.0% |
| Communications | 0 | 0.0% |
| Arts & Humanities | 0 | 0.0% |
| Total | 83 | 100.0% |
Transportation & Commute in Morgantown
Vehicle Availability by Sex in Morgantown
The most prevalent vehicle ownership categories in Morgantown are males with 4 vehicles (64, accounting for 33.9%) and females with 4 vehicles (17, making up 37.7%).
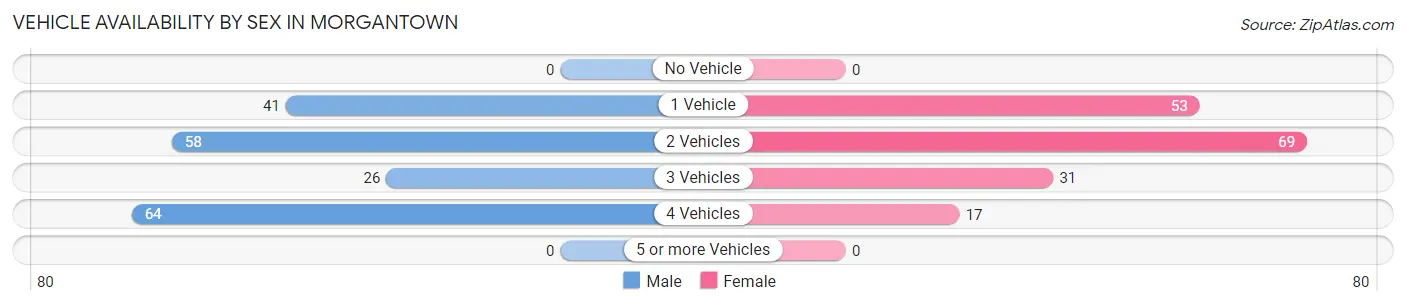
| Vehicles Available | Male | Female |
| No Vehicle | 0 (0.0%) | 0 (0.0%) |
| 1 Vehicle | 41 (21.7%) | 53 (31.2%) |
| 2 Vehicles | 58 (30.7%) | 69 (40.6%) |
| 3 Vehicles | 26 (13.8%) | 31 (18.2%) |
| 4 Vehicles | 64 (33.9%) | 17 (10.0%) |
| 5 or more Vehicles | 0 (0.0%) | 0 (0.0%) |
| Total | 189 (100.0%) | 170 (100.0%) |
Commute Time in Morgantown
The most frequently occuring commute durations in Morgantown are 10 to 14 minutes (198 commuters, 55.1%), 5 to 9 minutes (68 commuters, 18.9%), and 15 to 19 minutes (45 commuters, 12.5%).
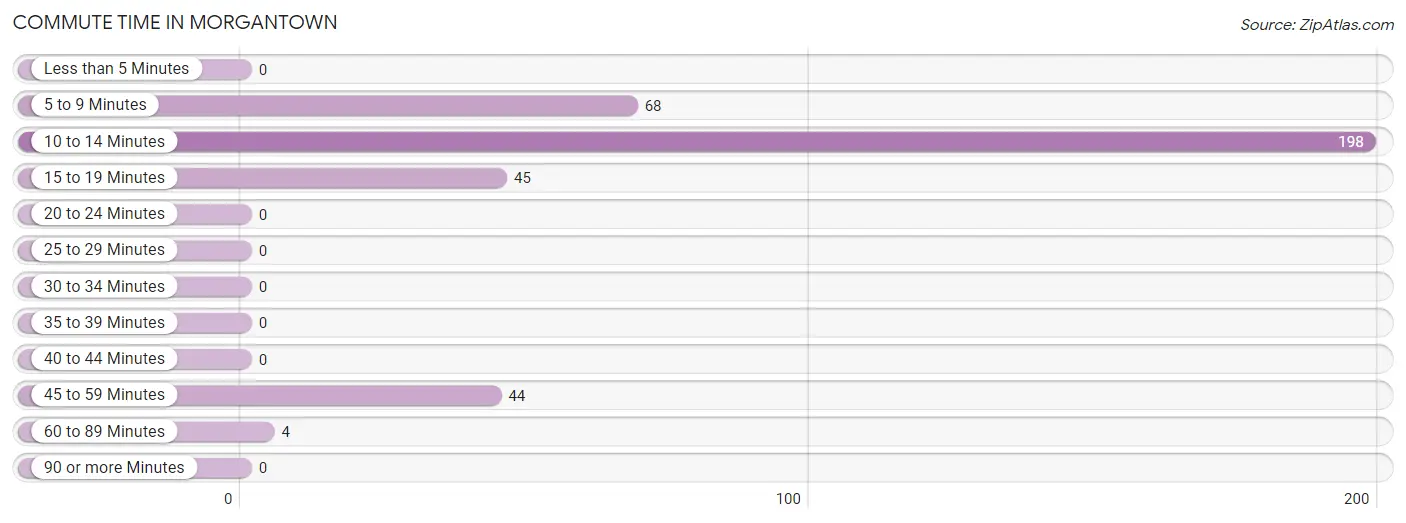
| Commute Time | # Commuters | % Commuters |
| Less than 5 Minutes | 0 | 0.0% |
| 5 to 9 Minutes | 68 | 18.9% |
| 10 to 14 Minutes | 198 | 55.1% |
| 15 to 19 Minutes | 45 | 12.5% |
| 20 to 24 Minutes | 0 | 0.0% |
| 25 to 29 Minutes | 0 | 0.0% |
| 30 to 34 Minutes | 0 | 0.0% |
| 35 to 39 Minutes | 0 | 0.0% |
| 40 to 44 Minutes | 0 | 0.0% |
| 45 to 59 Minutes | 44 | 12.3% |
| 60 to 89 Minutes | 4 | 1.1% |
| 90 or more Minutes | 0 | 0.0% |
Commute Time by Sex in Morgantown
The most common commute times in Morgantown are 5 to 9 minutes (68 commuters, 36.0%) for males and 10 to 14 minutes (168 commuters, 98.8%) for females.
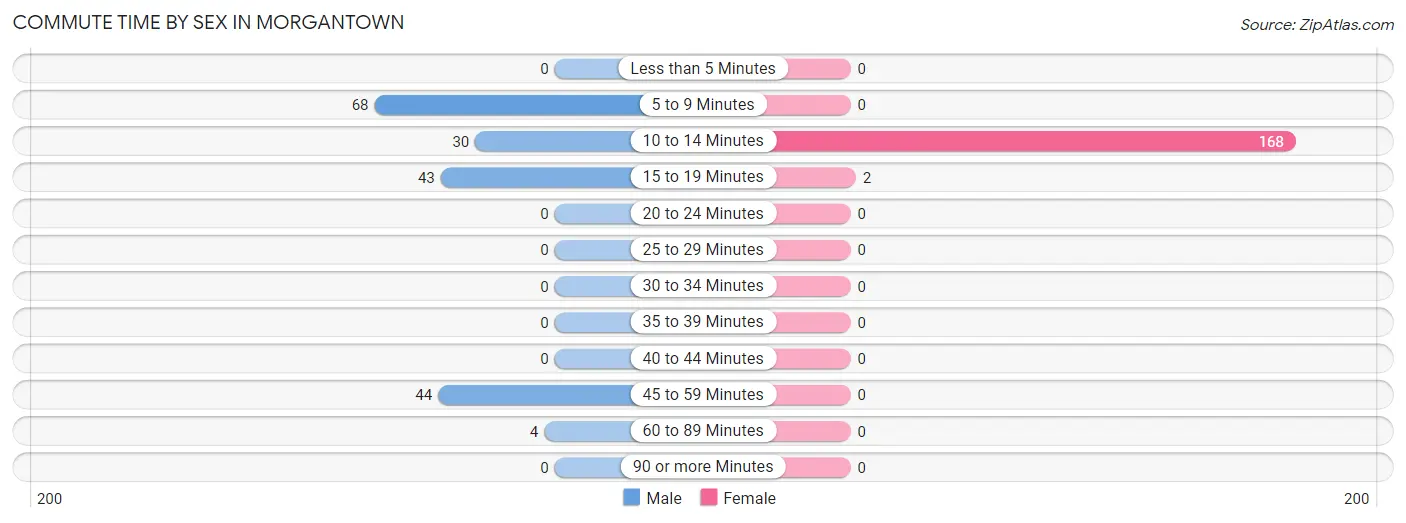
| Commute Time | Male | Female |
| Less than 5 Minutes | 0 (0.0%) | 0 (0.0%) |
| 5 to 9 Minutes | 68 (36.0%) | 0 (0.0%) |
| 10 to 14 Minutes | 30 (15.9%) | 168 (98.8%) |
| 15 to 19 Minutes | 43 (22.8%) | 2 (1.2%) |
| 20 to 24 Minutes | 0 (0.0%) | 0 (0.0%) |
| 25 to 29 Minutes | 0 (0.0%) | 0 (0.0%) |
| 30 to 34 Minutes | 0 (0.0%) | 0 (0.0%) |
| 35 to 39 Minutes | 0 (0.0%) | 0 (0.0%) |
| 40 to 44 Minutes | 0 (0.0%) | 0 (0.0%) |
| 45 to 59 Minutes | 44 (23.3%) | 0 (0.0%) |
| 60 to 89 Minutes | 4 (2.1%) | 0 (0.0%) |
| 90 or more Minutes | 0 (0.0%) | 0 (0.0%) |
Time of Departure to Work by Sex in Morgantown
The most frequent times of departure to work in Morgantown are 6:00 AM to 6:29 AM (74, 39.2%) for males and 6:30 AM to 6:59 AM (66, 38.8%) for females.
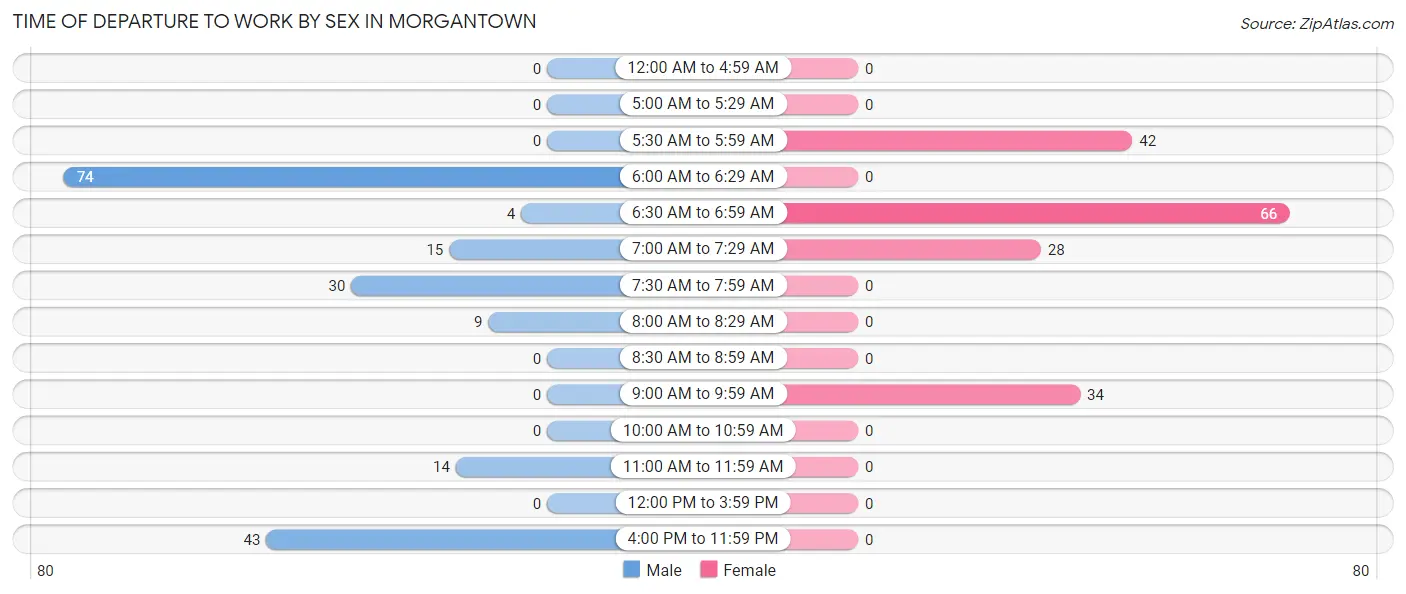
| Time of Departure | Male | Female |
| 12:00 AM to 4:59 AM | 0 (0.0%) | 0 (0.0%) |
| 5:00 AM to 5:29 AM | 0 (0.0%) | 0 (0.0%) |
| 5:30 AM to 5:59 AM | 0 (0.0%) | 42 (24.7%) |
| 6:00 AM to 6:29 AM | 74 (39.2%) | 0 (0.0%) |
| 6:30 AM to 6:59 AM | 4 (2.1%) | 66 (38.8%) |
| 7:00 AM to 7:29 AM | 15 (7.9%) | 28 (16.5%) |
| 7:30 AM to 7:59 AM | 30 (15.9%) | 0 (0.0%) |
| 8:00 AM to 8:29 AM | 9 (4.8%) | 0 (0.0%) |
| 8:30 AM to 8:59 AM | 0 (0.0%) | 0 (0.0%) |
| 9:00 AM to 9:59 AM | 0 (0.0%) | 34 (20.0%) |
| 10:00 AM to 10:59 AM | 0 (0.0%) | 0 (0.0%) |
| 11:00 AM to 11:59 AM | 14 (7.4%) | 0 (0.0%) |
| 12:00 PM to 3:59 PM | 0 (0.0%) | 0 (0.0%) |
| 4:00 PM to 11:59 PM | 43 (22.8%) | 0 (0.0%) |
| Total | 189 (100.0%) | 170 (100.0%) |
Housing Occupancy in Morgantown
Occupancy by Ownership in Morgantown
Of the total 490 dwellings in Morgantown, owner-occupied units account for 378 (77.1%), while renter-occupied units make up 112 (22.9%).
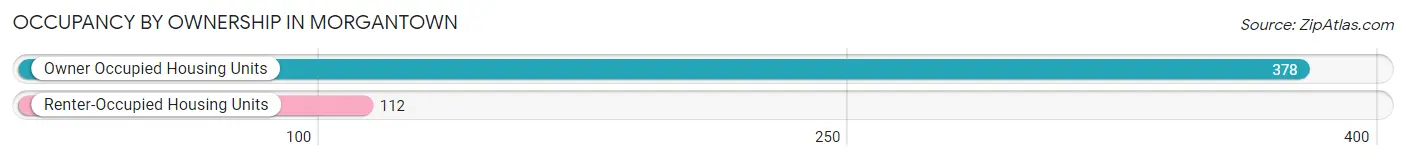
| Occupancy | # Housing Units | % Housing Units |
| Owner Occupied Housing Units | 378 | 77.1% |
| Renter-Occupied Housing Units | 112 | 22.9% |
| Total Occupied Housing Units | 490 | 100.0% |
Occupancy by Household Size in Morgantown
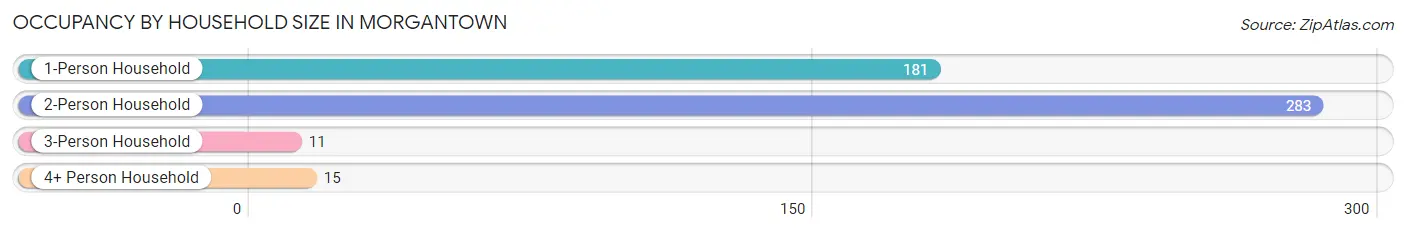
| Household Size | # Housing Units | % Housing Units |
| 1-Person Household | 181 | 36.9% |
| 2-Person Household | 283 | 57.8% |
| 3-Person Household | 11 | 2.2% |
| 4+ Person Household | 15 | 3.1% |
| Total Housing Units | 490 | 100.0% |
Occupancy by Ownership by Household Size in Morgantown
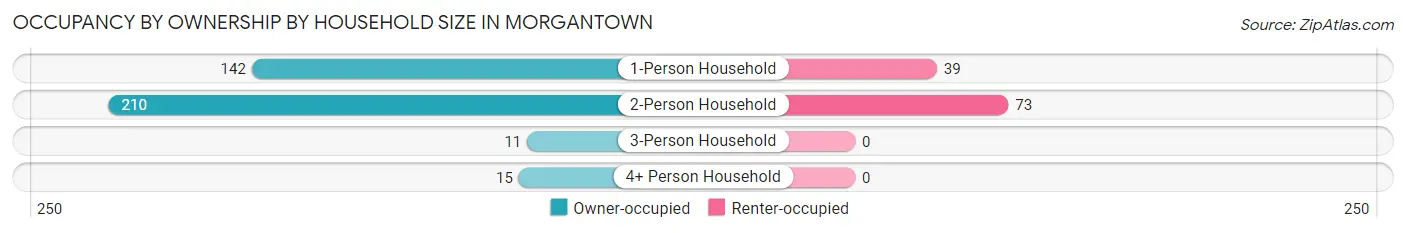
| Household Size | Owner-occupied | Renter-occupied |
| 1-Person Household | 142 (78.4%) | 39 (21.5%) |
| 2-Person Household | 210 (74.2%) | 73 (25.8%) |
| 3-Person Household | 11 (100.0%) | 0 (0.0%) |
| 4+ Person Household | 15 (100.0%) | 0 (0.0%) |
| Total Housing Units | 378 (77.1%) | 112 (22.9%) |
Occupancy by Educational Attainment in Morgantown
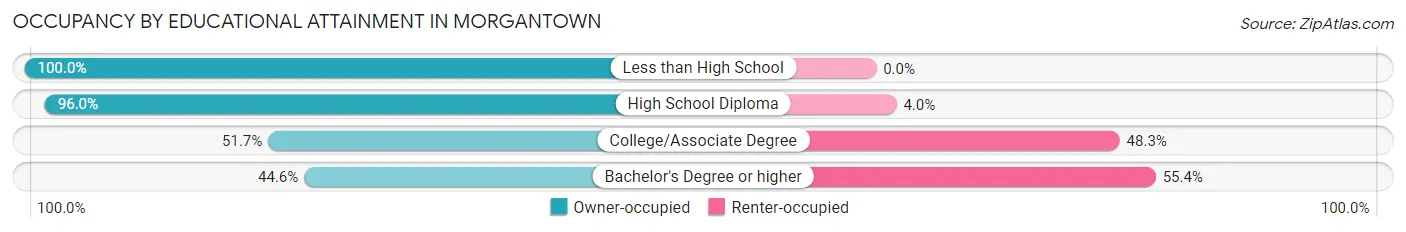
| Household Size | Owner-occupied | Renter-occupied |
| Less than High School | 42 (100.0%) | 0 (0.0%) |
| High School Diploma | 239 (96.0%) | 10 (4.0%) |
| College/Associate Degree | 60 (51.7%) | 56 (48.3%) |
| Bachelor's Degree or higher | 37 (44.6%) | 46 (55.4%) |
Occupancy by Age of Householder in Morgantown
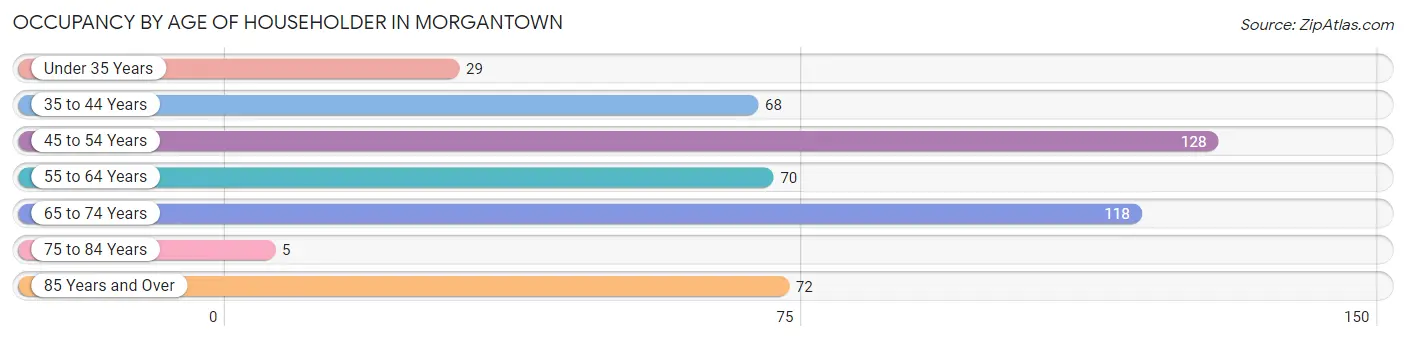
| Age Bracket | # Households | % Households |
| Under 35 Years | 29 | 5.9% |
| 35 to 44 Years | 68 | 13.9% |
| 45 to 54 Years | 128 | 26.1% |
| 55 to 64 Years | 70 | 14.3% |
| 65 to 74 Years | 118 | 24.1% |
| 75 to 84 Years | 5 | 1.0% |
| 85 Years and Over | 72 | 14.7% |
| Total | 490 | 100.0% |
Housing Finances in Morgantown
Median Income by Occupancy in Morgantown
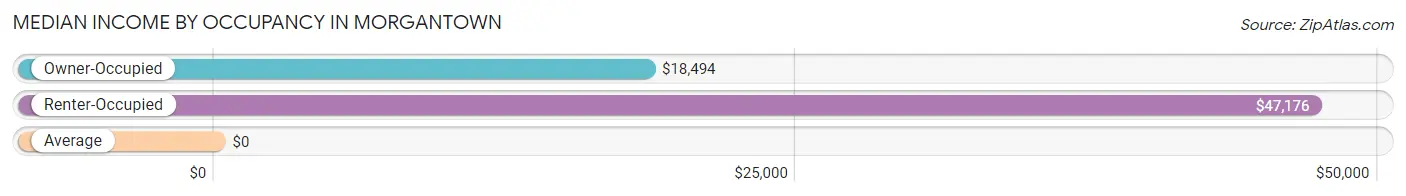
| Occupancy Type | # Households | Median Income |
| Owner-Occupied | 378 (77.1%) | $18,494 |
| Renter-Occupied | 112 (22.9%) | $47,176 |
| Average | 490 (100.0%) | $0 |
Occupancy by Householder Income Bracket in Morgantown
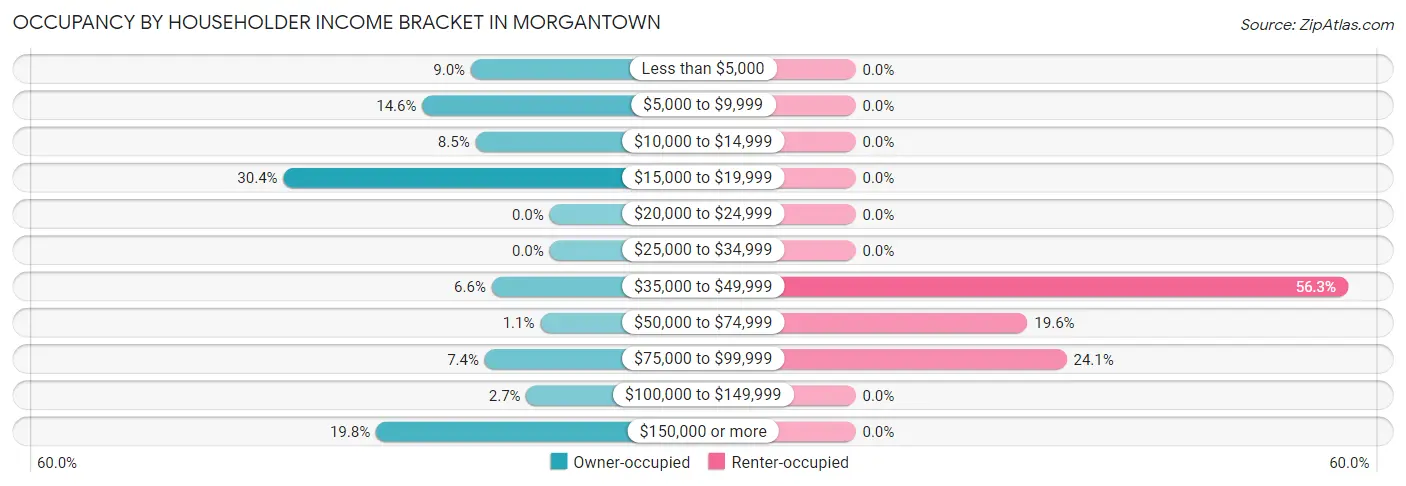
| Income Bracket | Owner-occupied | Renter-occupied |
| Less than $5,000 | 34 (9.0%) | 0 (0.0%) |
| $5,000 to $9,999 | 55 (14.5%) | 0 (0.0%) |
| $10,000 to $14,999 | 32 (8.5%) | 0 (0.0%) |
| $15,000 to $19,999 | 115 (30.4%) | 0 (0.0%) |
| $20,000 to $24,999 | 0 (0.0%) | 0 (0.0%) |
| $25,000 to $34,999 | 0 (0.0%) | 0 (0.0%) |
| $35,000 to $49,999 | 25 (6.6%) | 63 (56.2%) |
| $50,000 to $74,999 | 4 (1.1%) | 22 (19.6%) |
| $75,000 to $99,999 | 28 (7.4%) | 27 (24.1%) |
| $100,000 to $149,999 | 10 (2.6%) | 0 (0.0%) |
| $150,000 or more | 75 (19.8%) | 0 (0.0%) |
| Total | 378 (100.0%) | 112 (100.0%) |
Monthly Housing Cost Tiers in Morgantown
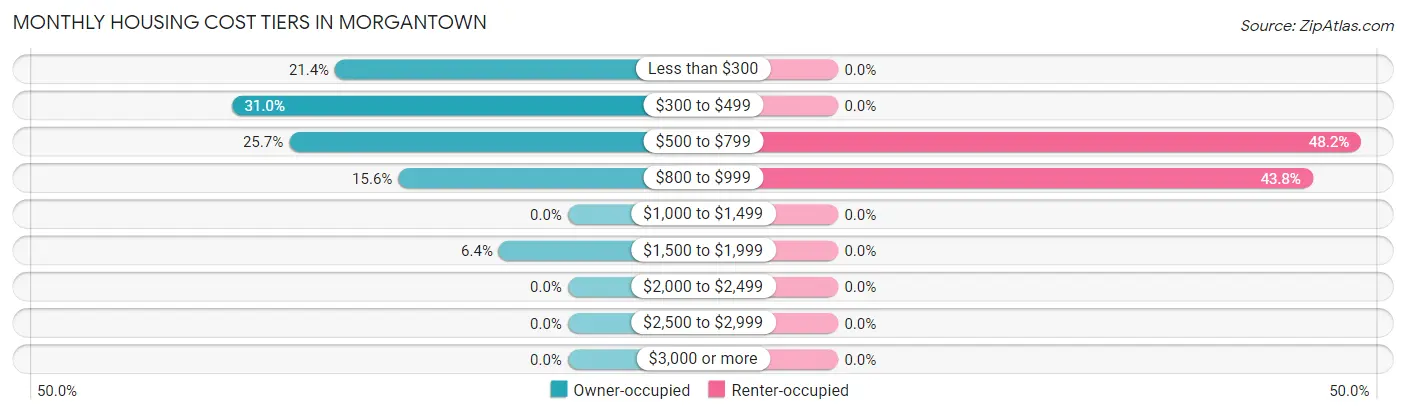
| Monthly Cost | Owner-occupied | Renter-occupied |
| Less than $300 | 81 (21.4%) | 0 (0.0%) |
| $300 to $499 | 117 (30.9%) | 0 (0.0%) |
| $500 to $799 | 97 (25.7%) | 54 (48.2%) |
| $800 to $999 | 59 (15.6%) | 49 (43.8%) |
| $1,000 to $1,499 | 0 (0.0%) | 0 (0.0%) |
| $1,500 to $1,999 | 24 (6.4%) | 0 (0.0%) |
| $2,000 to $2,499 | 0 (0.0%) | 0 (0.0%) |
| $2,500 to $2,999 | 0 (0.0%) | 0 (0.0%) |
| $3,000 or more | 0 (0.0%) | 0 (0.0%) |
| Total | 378 (100.0%) | 112 (100.0%) |
Physical Housing Characteristics in Morgantown
Housing Structures in Morgantown
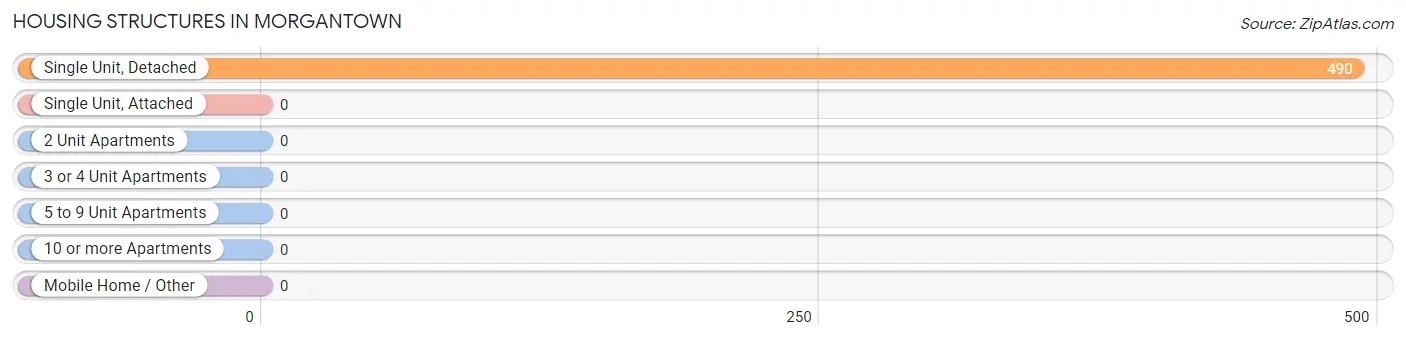
| Structure Type | # Housing Units | % Housing Units |
| Single Unit, Detached | 490 | 100.0% |
| Single Unit, Attached | 0 | 0.0% |
| 2 Unit Apartments | 0 | 0.0% |
| 3 or 4 Unit Apartments | 0 | 0.0% |
| 5 to 9 Unit Apartments | 0 | 0.0% |
| 10 or more Apartments | 0 | 0.0% |
| Mobile Home / Other | 0 | 0.0% |
| Total | 490 | 100.0% |
Housing Structures by Occupancy in Morgantown
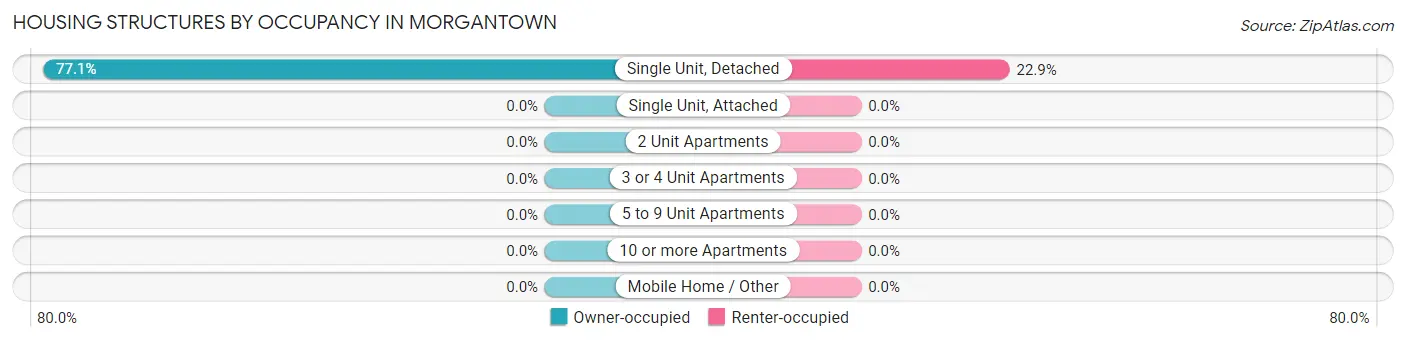
| Structure Type | Owner-occupied | Renter-occupied |
| Single Unit, Detached | 378 (77.1%) | 112 (22.9%) |
| Single Unit, Attached | 0 (0.0%) | 0 (0.0%) |
| 2 Unit Apartments | 0 (0.0%) | 0 (0.0%) |
| 3 or 4 Unit Apartments | 0 (0.0%) | 0 (0.0%) |
| 5 to 9 Unit Apartments | 0 (0.0%) | 0 (0.0%) |
| 10 or more Apartments | 0 (0.0%) | 0 (0.0%) |
| Mobile Home / Other | 0 (0.0%) | 0 (0.0%) |
| Total | 378 (77.1%) | 112 (22.9%) |
Housing Structures by Number of Rooms in Morgantown
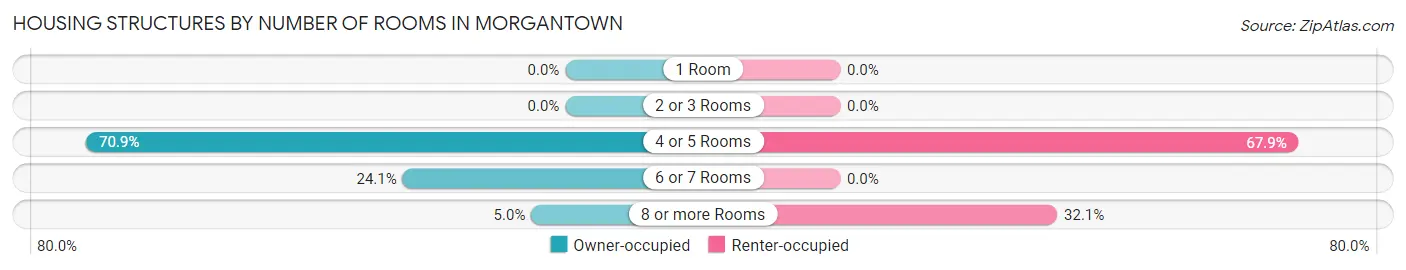
| Number of Rooms | Owner-occupied | Renter-occupied |
| 1 Room | 0 (0.0%) | 0 (0.0%) |
| 2 or 3 Rooms | 0 (0.0%) | 0 (0.0%) |
| 4 or 5 Rooms | 268 (70.9%) | 76 (67.9%) |
| 6 or 7 Rooms | 91 (24.1%) | 0 (0.0%) |
| 8 or more Rooms | 19 (5.0%) | 36 (32.1%) |
| Total | 378 (100.0%) | 112 (100.0%) |
Housing Structure by Heating Type in Morgantown
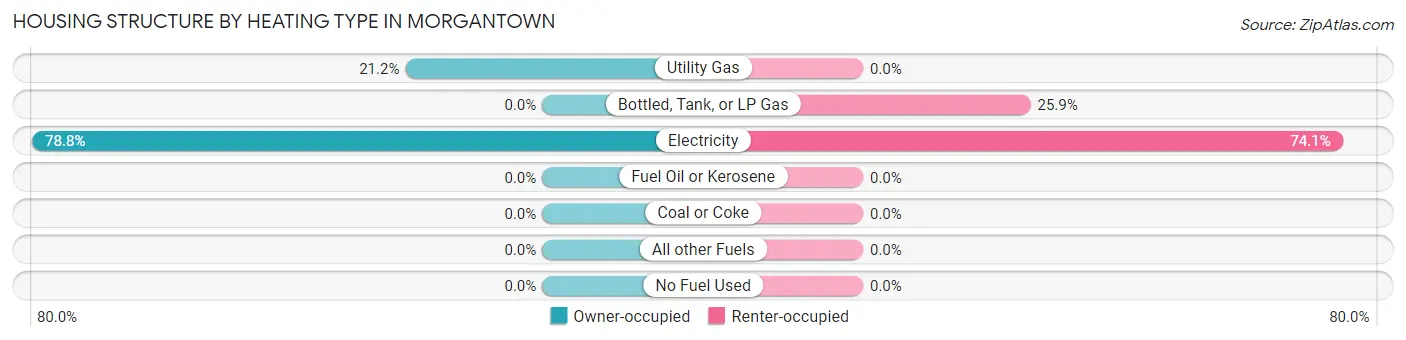
| Heating Type | Owner-occupied | Renter-occupied |
| Utility Gas | 80 (21.2%) | 0 (0.0%) |
| Bottled, Tank, or LP Gas | 0 (0.0%) | 29 (25.9%) |
| Electricity | 298 (78.8%) | 83 (74.1%) |
| Fuel Oil or Kerosene | 0 (0.0%) | 0 (0.0%) |
| Coal or Coke | 0 (0.0%) | 0 (0.0%) |
| All other Fuels | 0 (0.0%) | 0 (0.0%) |
| No Fuel Used | 0 (0.0%) | 0 (0.0%) |
| Total | 378 (100.0%) | 112 (100.0%) |
Household Vehicle Usage in Morgantown
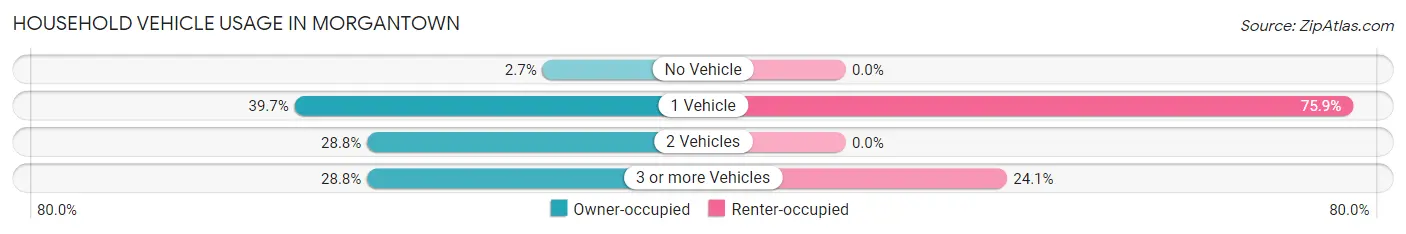
| Vehicles per Household | Owner-occupied | Renter-occupied |
| No Vehicle | 10 (2.6%) | 0 (0.0%) |
| 1 Vehicle | 150 (39.7%) | 85 (75.9%) |
| 2 Vehicles | 109 (28.8%) | 0 (0.0%) |
| 3 or more Vehicles | 109 (28.8%) | 27 (24.1%) |
| Total | 378 (100.0%) | 112 (100.0%) |
Real Estate & Mortgages in Morgantown
Real Estate and Mortgage Overview in Morgantown
| Characteristic | Without Mortgage | With Mortgage |
| Housing Units | 198 | 180 |
| Median Property Value | $83,900 | $87,100 |
| Median Household Income | - | - |
| Monthly Housing Costs | $327 | $0 |
| Real Estate Taxes | $903 | $52 |
Property Value by Mortgage Status in Morgantown
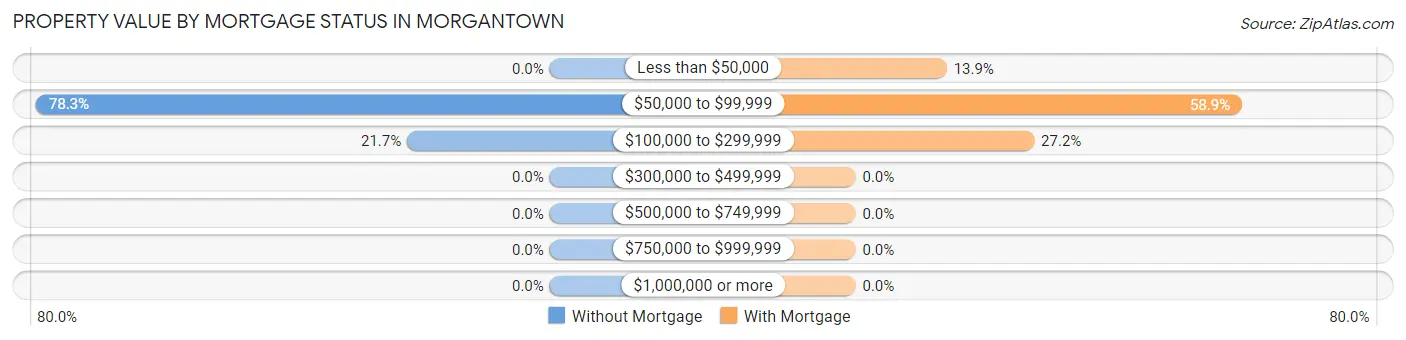
| Property Value | Without Mortgage | With Mortgage |
| Less than $50,000 | 0 (0.0%) | 25 (13.9%) |
| $50,000 to $99,999 | 155 (78.3%) | 106 (58.9%) |
| $100,000 to $299,999 | 43 (21.7%) | 49 (27.2%) |
| $300,000 to $499,999 | 0 (0.0%) | 0 (0.0%) |
| $500,000 to $749,999 | 0 (0.0%) | 0 (0.0%) |
| $750,000 to $999,999 | 0 (0.0%) | 0 (0.0%) |
| $1,000,000 or more | 0 (0.0%) | 0 (0.0%) |
| Total | 198 (100.0%) | 180 (100.0%) |
Household Income by Mortgage Status in Morgantown
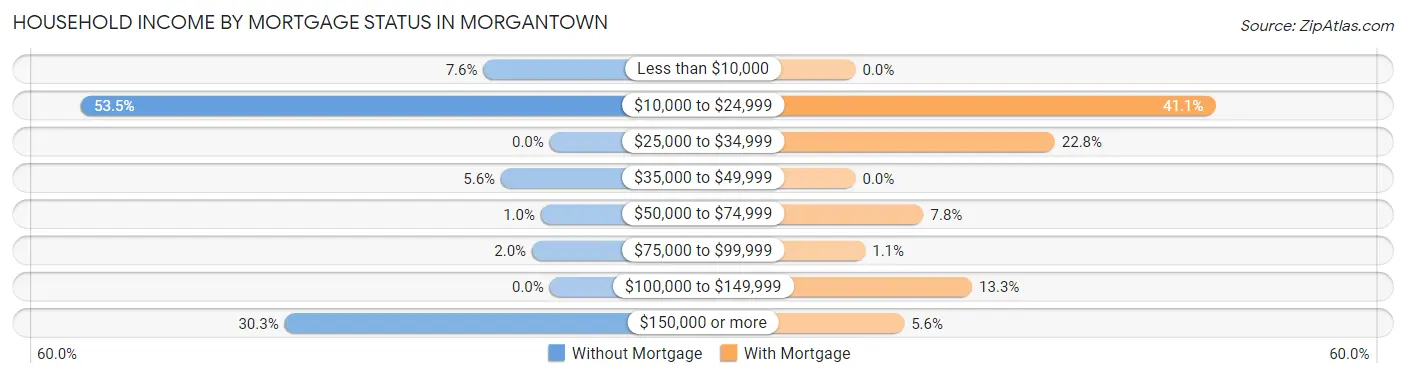
| Household Income | Without Mortgage | With Mortgage |
| Less than $10,000 | 15 (7.6%) | 0 (0.0%) |
| $10,000 to $24,999 | 106 (53.5%) | 74 (41.1%) |
| $25,000 to $34,999 | 0 (0.0%) | 41 (22.8%) |
| $35,000 to $49,999 | 11 (5.6%) | 0 (0.0%) |
| $50,000 to $74,999 | 2 (1.0%) | 14 (7.8%) |
| $75,000 to $99,999 | 4 (2.0%) | 2 (1.1%) |
| $100,000 to $149,999 | 0 (0.0%) | 24 (13.3%) |
| $150,000 or more | 60 (30.3%) | 10 (5.6%) |
| Total | 198 (100.0%) | 180 (100.0%) |
Property Value to Household Income Ratio in Morgantown
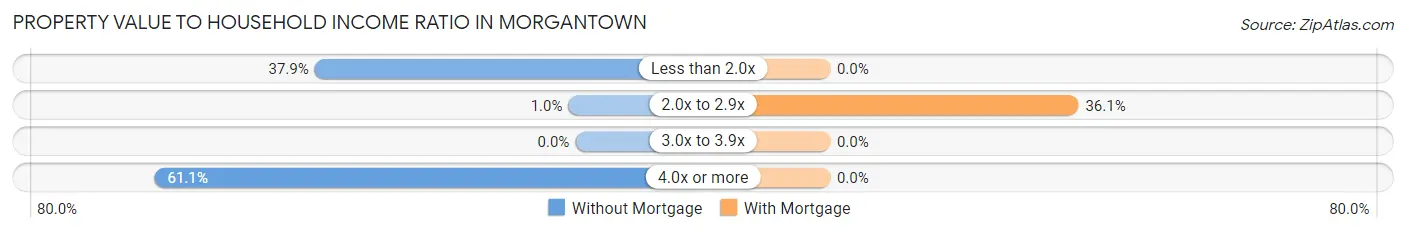
| Value-to-Income Ratio | Without Mortgage | With Mortgage |
| Less than 2.0x | 75 (37.9%) | 0 (0.0%) |
| 2.0x to 2.9x | 2 (1.0%) | 65 (36.1%) |
| 3.0x to 3.9x | 0 (0.0%) | 0 (0.0%) |
| 4.0x or more | 121 (61.1%) | 0 (0.0%) |
| Total | 198 (100.0%) | 180 (100.0%) |
Real Estate Taxes by Mortgage Status in Morgantown
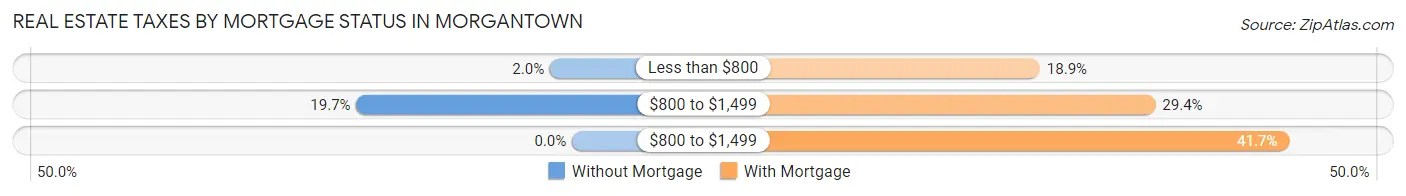
| Property Taxes | Without Mortgage | With Mortgage |
| Less than $800 | 4 (2.0%) | 34 (18.9%) |
| $800 to $1,499 | 39 (19.7%) | 53 (29.4%) |
| $800 to $1,499 | 0 (0.0%) | 75 (41.7%) |
| Total | 198 (100.0%) | 180 (100.0%) |
Health & Disability in Morgantown
Health Insurance Coverage by Age in Morgantown
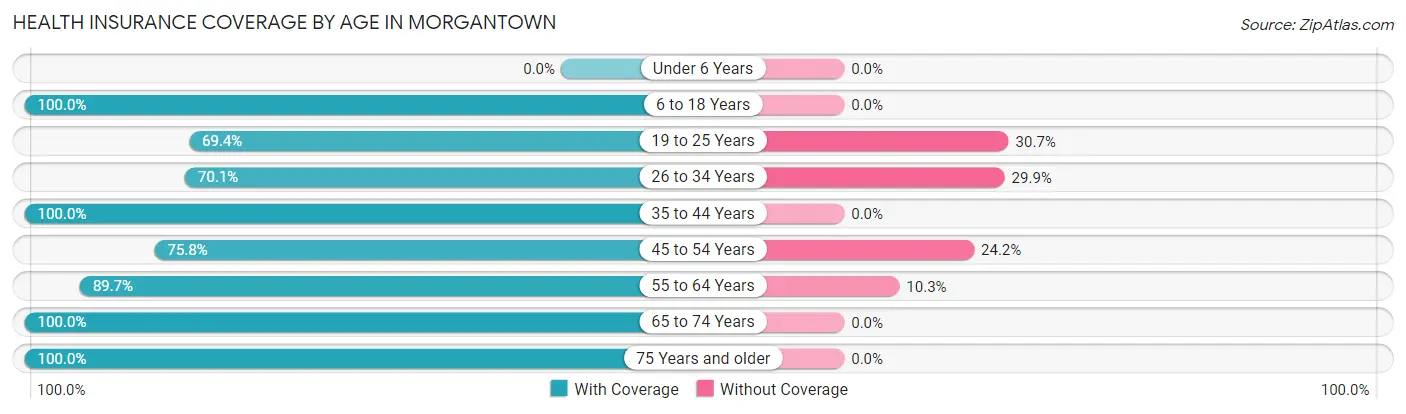
| Age Bracket | With Coverage | Without Coverage |
| Under 6 Years | 0 (0.0%) | 0 (0.0%) |
| 6 to 18 Years | 68 (100.0%) | 0 (0.0%) |
| 19 to 25 Years | 43 (69.4%) | 19 (30.6%) |
| 26 to 34 Years | 68 (70.1%) | 29 (29.9%) |
| 35 to 44 Years | 102 (100.0%) | 0 (0.0%) |
| 45 to 54 Years | 144 (75.8%) | 46 (24.2%) |
| 55 to 64 Years | 96 (89.7%) | 11 (10.3%) |
| 65 to 74 Years | 214 (100.0%) | 0 (0.0%) |
| 75 Years and older | 90 (100.0%) | 0 (0.0%) |
| Total | 825 (88.7%) | 105 (11.3%) |
Health Insurance Coverage by Citizenship Status in Morgantown
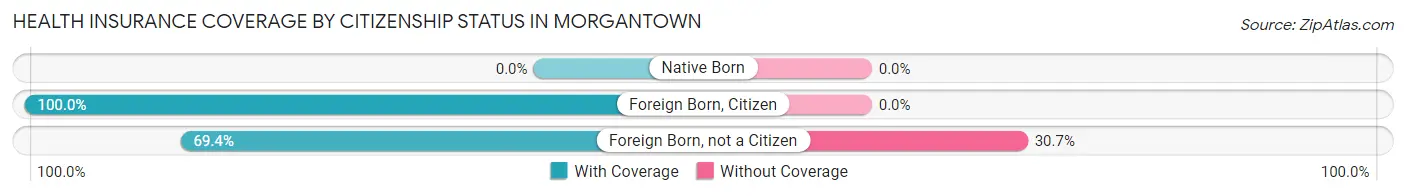
| Citizenship Status | With Coverage | Without Coverage |
| Native Born | 0 (0.0%) | 0 (0.0%) |
| Foreign Born, Citizen | 68 (100.0%) | 0 (0.0%) |
| Foreign Born, not a Citizen | 43 (69.4%) | 19 (30.6%) |
Health Insurance Coverage by Household Income in Morgantown
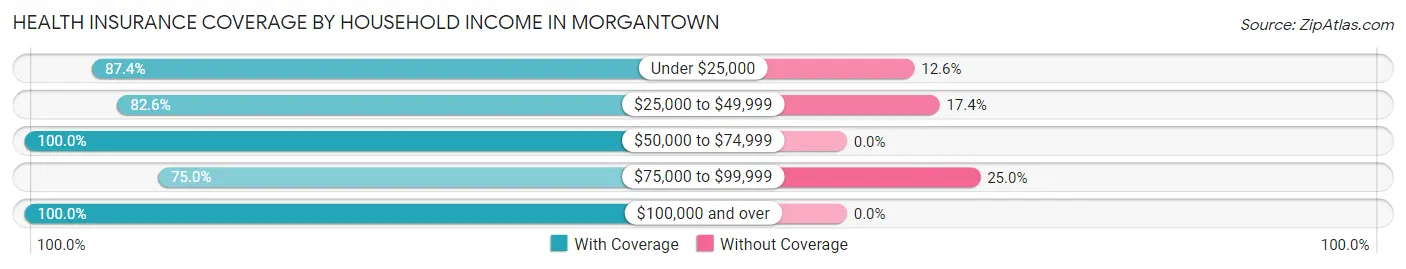
| Household Income | With Coverage | Without Coverage |
| Under $25,000 | 311 (87.4%) | 45 (12.6%) |
| $25,000 to $49,999 | 138 (82.6%) | 29 (17.4%) |
| $50,000 to $74,999 | 44 (100.0%) | 0 (0.0%) |
| $75,000 to $99,999 | 93 (75.0%) | 31 (25.0%) |
| $100,000 and over | 239 (100.0%) | 0 (0.0%) |
Public vs Private Health Insurance Coverage by Age in Morgantown
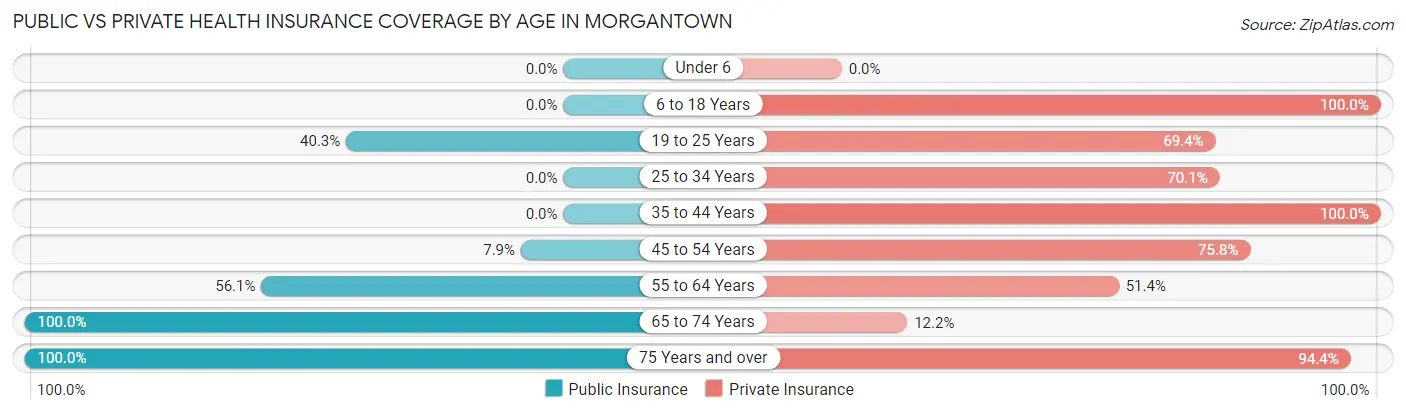
| Age Bracket | Public Insurance | Private Insurance |
| Under 6 | 0 (0.0%) | 0 (0.0%) |
| 6 to 18 Years | 0 (0.0%) | 68 (100.0%) |
| 19 to 25 Years | 25 (40.3%) | 43 (69.4%) |
| 25 to 34 Years | 0 (0.0%) | 68 (70.1%) |
| 35 to 44 Years | 0 (0.0%) | 102 (100.0%) |
| 45 to 54 Years | 15 (7.9%) | 144 (75.8%) |
| 55 to 64 Years | 60 (56.1%) | 55 (51.4%) |
| 65 to 74 Years | 214 (100.0%) | 26 (12.1%) |
| 75 Years and over | 90 (100.0%) | 85 (94.4%) |
| Total | 404 (43.4%) | 591 (63.5%) |
Disability Status by Sex by Age in Morgantown
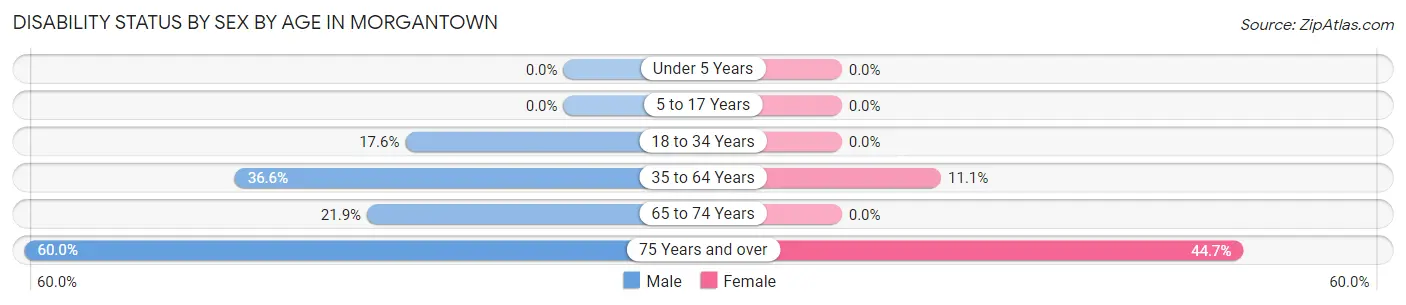
| Age Bracket | Male | Female |
| Under 5 Years | 0 (0.0%) | 0 (0.0%) |
| 5 to 17 Years | 0 (0.0%) | 0 (0.0%) |
| 18 to 34 Years | 25 (17.6%) | 0 (0.0%) |
| 35 to 64 Years | 60 (36.6%) | 26 (11.1%) |
| 65 to 74 Years | 21 (21.9%) | 0 (0.0%) |
| 75 Years and over | 3 (60.0%) | 38 (44.7%) |
Disability Class by Sex by Age in Morgantown
Disability Class: Hearing Difficulty
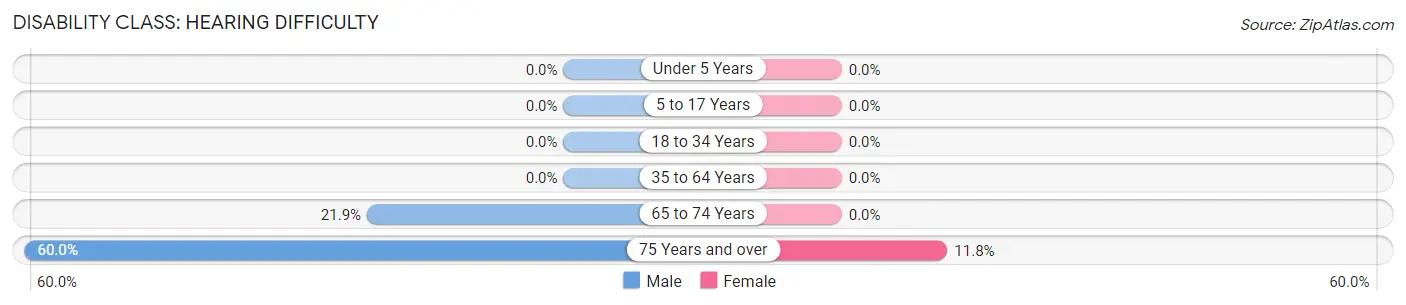
| Age Bracket | Male | Female |
| Under 5 Years | 0 (0.0%) | 0 (0.0%) |
| 5 to 17 Years | 0 (0.0%) | 0 (0.0%) |
| 18 to 34 Years | 0 (0.0%) | 0 (0.0%) |
| 35 to 64 Years | 0 (0.0%) | 0 (0.0%) |
| 65 to 74 Years | 21 (21.9%) | 0 (0.0%) |
| 75 Years and over | 3 (60.0%) | 10 (11.8%) |
Disability Class: Vision Difficulty
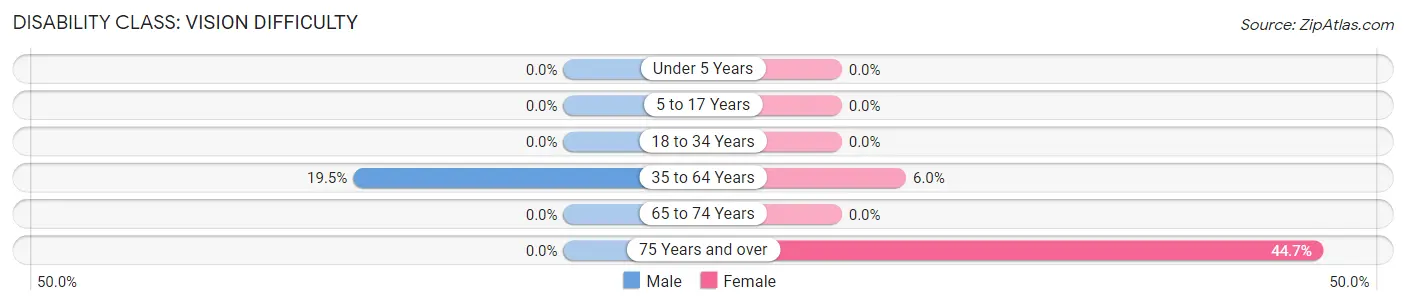
| Age Bracket | Male | Female |
| Under 5 Years | 0 (0.0%) | 0 (0.0%) |
| 5 to 17 Years | 0 (0.0%) | 0 (0.0%) |
| 18 to 34 Years | 0 (0.0%) | 0 (0.0%) |
| 35 to 64 Years | 32 (19.5%) | 14 (6.0%) |
| 65 to 74 Years | 0 (0.0%) | 0 (0.0%) |
| 75 Years and over | 0 (0.0%) | 38 (44.7%) |
Disability Class: Cognitive Difficulty
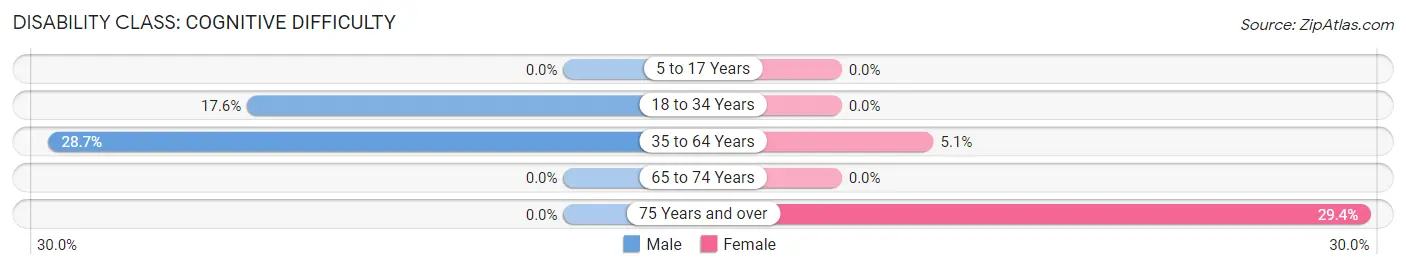
| Age Bracket | Male | Female |
| 5 to 17 Years | 0 (0.0%) | 0 (0.0%) |
| 18 to 34 Years | 25 (17.6%) | 0 (0.0%) |
| 35 to 64 Years | 47 (28.7%) | 12 (5.1%) |
| 65 to 74 Years | 0 (0.0%) | 0 (0.0%) |
| 75 Years and over | 0 (0.0%) | 25 (29.4%) |
Disability Class: Ambulatory Difficulty
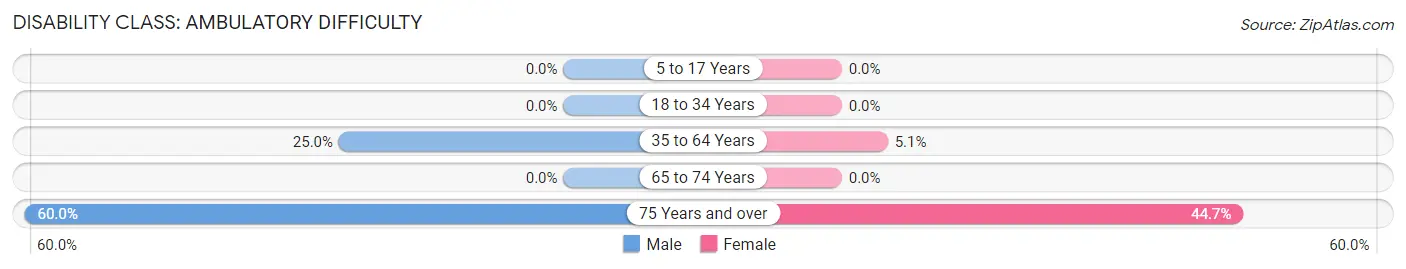
| Age Bracket | Male | Female |
| 5 to 17 Years | 0 (0.0%) | 0 (0.0%) |
| 18 to 34 Years | 0 (0.0%) | 0 (0.0%) |
| 35 to 64 Years | 41 (25.0%) | 12 (5.1%) |
| 65 to 74 Years | 0 (0.0%) | 0 (0.0%) |
| 75 Years and over | 3 (60.0%) | 38 (44.7%) |
Disability Class: Self-Care Difficulty
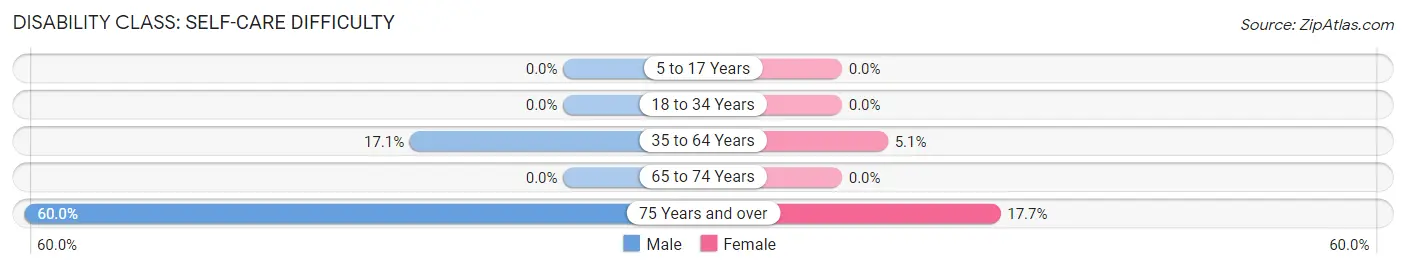
| Age Bracket | Male | Female |
| 5 to 17 Years | 0 (0.0%) | 0 (0.0%) |
| 18 to 34 Years | 0 (0.0%) | 0 (0.0%) |
| 35 to 64 Years | 28 (17.1%) | 12 (5.1%) |
| 65 to 74 Years | 0 (0.0%) | 0 (0.0%) |
| 75 Years and over | 3 (60.0%) | 15 (17.6%) |
Technology Access in Morgantown
Computing Device Access in Morgantown
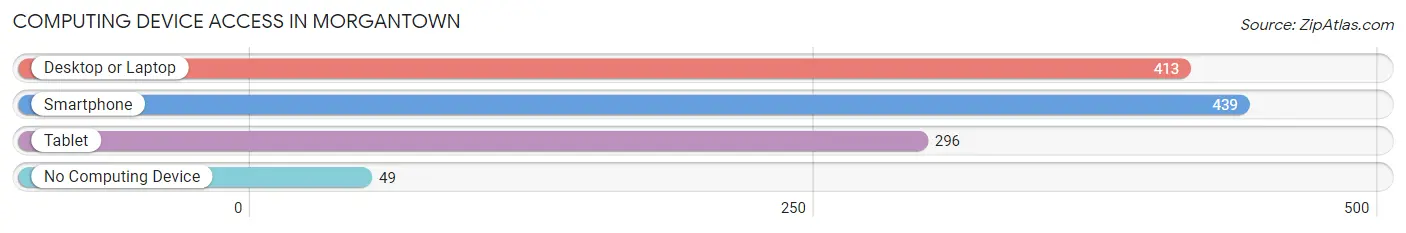
| Device Type | # Households | % Households |
| Desktop or Laptop | 413 | 84.3% |
| Smartphone | 439 | 89.6% |
| Tablet | 296 | 60.4% |
| No Computing Device | 49 | 10.0% |
| Total | 490 | 100.0% |
Internet Access in Morgantown
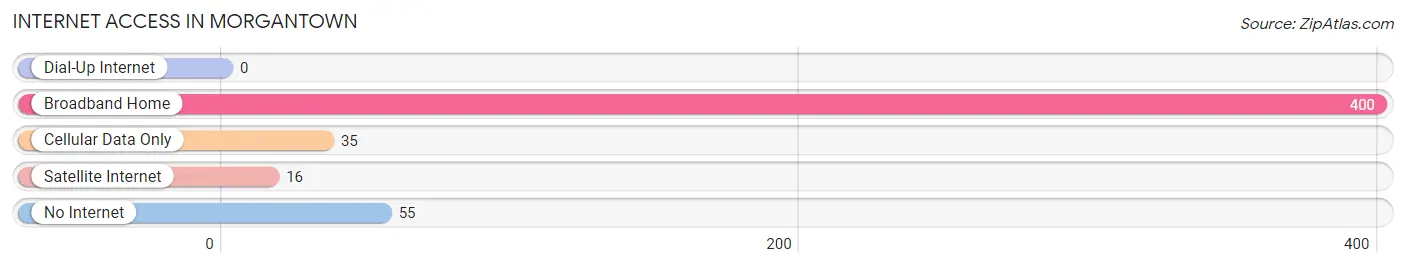
| Internet Type | # Households | % Households |
| Dial-Up Internet | 0 | 0.0% |
| Broadband Home | 400 | 81.6% |
| Cellular Data Only | 35 | 7.1% |
| Satellite Internet | 16 | 3.3% |
| No Internet | 55 | 11.2% |
| Total | 490 | 100.0% |
Morgantown Summary
Morgantown is a small town located in the state of Mississippi, in the United States. It is situated in the northern part of the state, in the county of Monroe. The town has a population of approximately 1,000 people, and is part of the Tupelo metropolitan area.
History
Morgantown was founded in 1837 by a group of settlers from North Carolina. The town was named after the first settler, William Morgan, who had purchased the land from the Chickasaw Indians. The town was originally a farming community, and the main crops grown were cotton and corn.
In the late 19th century, the town began to grow and develop. The railroad was built through the town, and the first post office was established in 1887. The town also had a school, a bank, and a few stores.
In the early 20th century, the town experienced a period of growth and prosperity. The population increased, and new businesses were established. The town also had a newspaper, a movie theater, and a hotel.
Geography
Morgantown is located in the northern part of Mississippi, in the county of Monroe. The town is situated on the banks of the Tombigbee River, and is surrounded by rolling hills and forests. The town is located about 30 miles south of Tupelo, and about 50 miles north of Columbus.
The climate in Morgantown is humid subtropical, with hot summers and mild winters. The average annual temperature is around 70 degrees Fahrenheit, and the average annual precipitation is around 50 inches.
Economy
Morgantown’s economy is largely based on agriculture. The main crops grown in the area are cotton, corn, soybeans, and wheat. The town also has a few small businesses, including a grocery store, a hardware store, and a few restaurants.
Demographics
As of the 2010 census, the population of Morgantown was 1,000 people. The racial makeup of the town was 95.2% White, 3.2% African American, 0.2% Native American, 0.2% Asian, and 1.2% from other races. The median household income was $30,000, and the median family income was $35,000.
Morgantown is a small town with a rich history and a strong sense of community. The town is surrounded by beautiful scenery, and the people are friendly and welcoming. The town has a few small businesses, and the economy is largely based on agriculture. The town is a great place to live, work, and raise a family.
Common Questions
What is Per Capita Income in Morgantown?
Per Capita income in Morgantown is $36,003.
What is Income or Wage Gap in Morgantown?
Income or Wage Gap in Morgantown is 9.0%.
Women in Morgantown earn 91.0 cents for every dollar earned by a man.
What is Inequality or Gini Index in Morgantown?
Inequality or Gini Index in Morgantown is 0.59.
What is the Total Population of Morgantown?
Total Population of Morgantown is 930.
What is the Total Male Population of Morgantown?
Total Male Population of Morgantown is 475.
What is the Total Female Population of Morgantown?
Total Female Population of Morgantown is 455.
What is the Ratio of Males per 100 Females in Morgantown?
There are 104.40 Males per 100 Females in Morgantown.
What is the Ratio of Females per 100 Males in Morgantown?
There are 95.79 Females per 100 Males in Morgantown.
What is the Median Population Age in Morgantown?
Median Population Age in Morgantown is 53.7 Years.
What is the Average Family Size in Morgantown
Average Family Size in Morgantown is 2.6 People.
What is the Average Household Size in Morgantown
Average Household Size in Morgantown is 1.9 People.
How Large is the Labor Force in Morgantown?
There are 427 People in the Labor Forcein in Morgantown.
What is the Percentage of People in the Labor Force in Morgantown?
49.5% of People are in the Labor Force in Morgantown.
What is the Unemployment Rate in Morgantown?
Unemployment Rate in Morgantown is 9.6%.