Mathiston, MS Map & Demographics
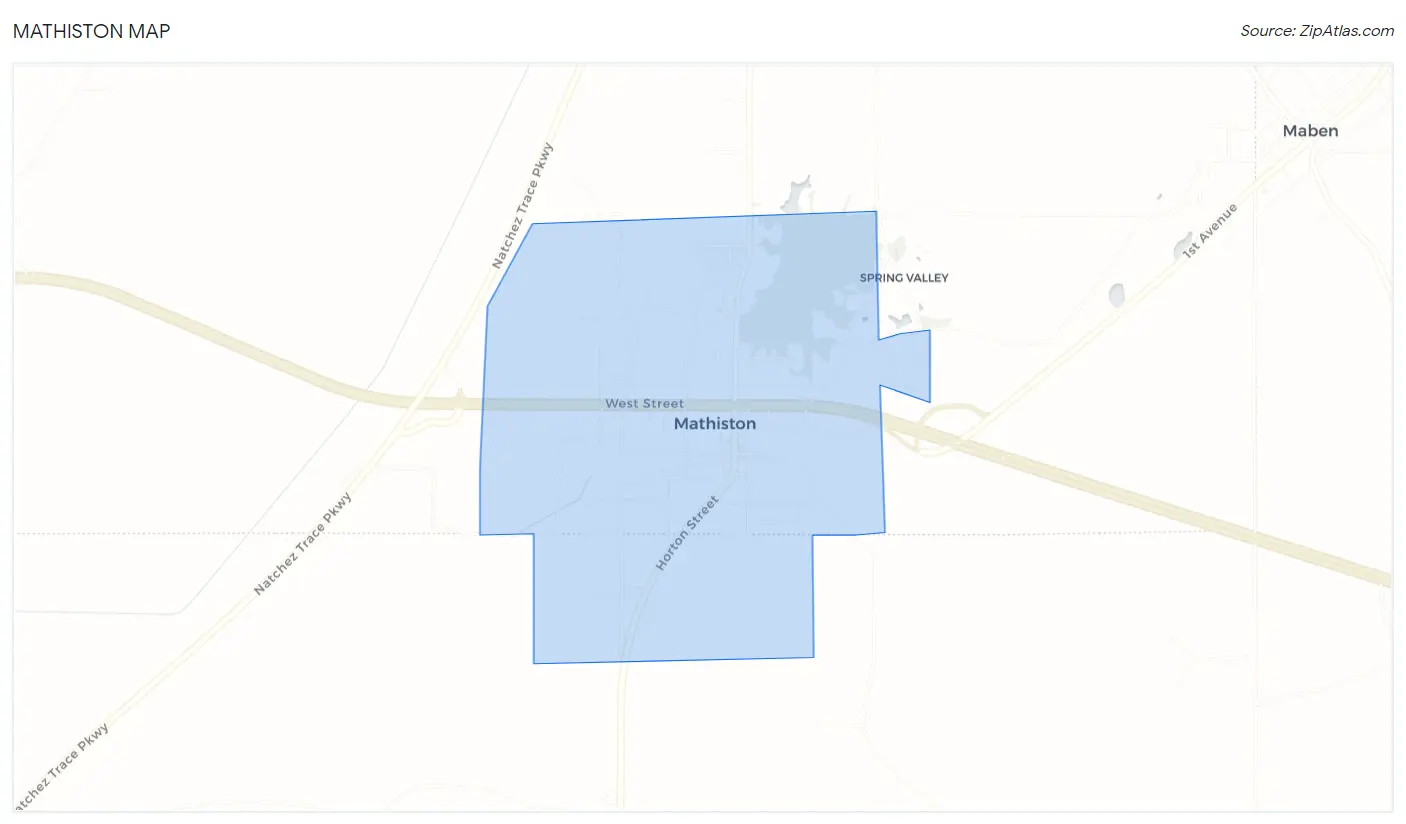
Mathiston Map
Mathiston Overview
$33,109
PER CAPITA INCOME
$74,330
AVG FAMILY INCOME
$62,708
AVG HOUSEHOLD INCOME
24.0%
WAGE / INCOME GAP [ % ]
76.0¢/ $1
WAGE / INCOME GAP [ $ ]
$6,289
FAMILY INCOME DEFICIT
0.42
INEQUALITY / GINI INDEX
807
TOTAL POPULATION
402
MALE POPULATION
405
FEMALE POPULATION
99.26
MALES / 100 FEMALES
100.75
FEMALES / 100 MALES
43.4
MEDIAN AGE
2.7
AVG FAMILY SIZE
2.3
AVG HOUSEHOLD SIZE
365
LABOR FORCE [ PEOPLE ]
55.1%
PERCENT IN LABOR FORCE
5.2%
UNEMPLOYMENT RATE
Mathiston Zip Codes
Income in Mathiston
Income Overview in Mathiston
Per Capita Income in Mathiston is $33,109, while median incomes of families and households are $74,330 and $62,708 respectively.
| Characteristic | Number | Measure |
| Per Capita Income | 807 | $33,109 |
| Median Family Income | 245 | $74,330 |
| Mean Family Income | 245 | $91,404 |
| Median Household Income | 349 | $62,708 |
| Mean Household Income | 349 | $75,323 |
| Income Deficit | 245 | $6,289 |
| Wage / Income Gap (%) | 807 | 23.98% |
| Wage / Income Gap ($) | 807 | 76.02¢ per $1 |
| Gini / Inequality Index | 807 | 0.42 |
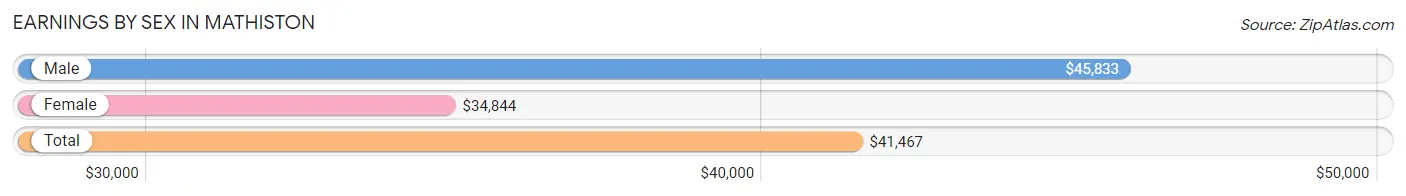
Earnings by Sex in Mathiston
Average Earnings in Mathiston are $41,467, $45,833 for men and $34,844 for women, a difference of 24.0%.
| Sex | Number | Average Earnings |
| Male | 234 (57.8%) | $45,833 |
| Female | 171 (42.2%) | $34,844 |
| Total | 405 (100.0%) | $41,467 |
Earnings by Sex by Income Bracket in Mathiston
The most common earnings brackets in Mathiston are $45,000 to $49,999 for men (33 | 14.1%) and $55,000 to $64,999 for women (45 | 26.3%).
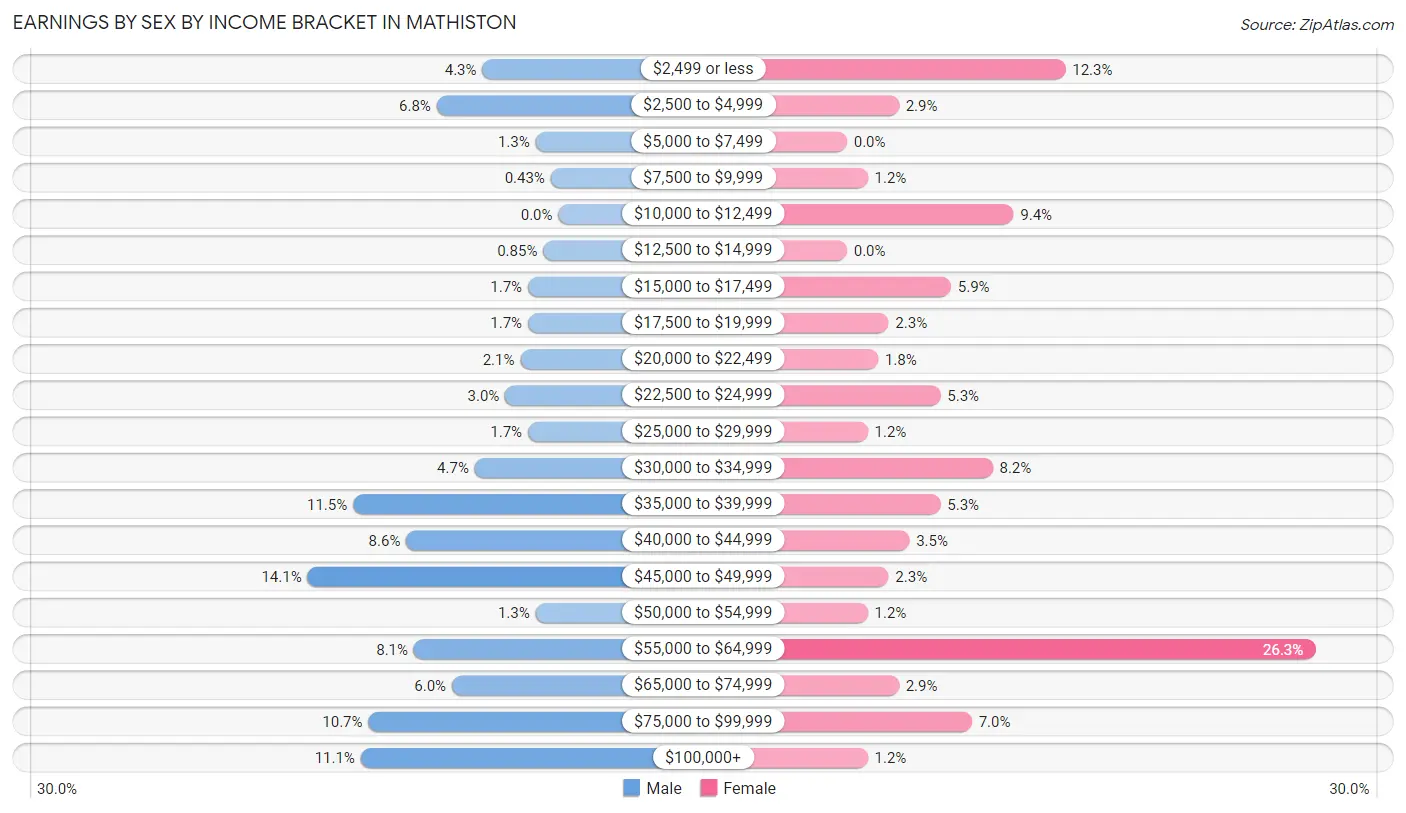
| Income | Male | Female |
| $2,499 or less | 10 (4.3%) | 21 (12.3%) |
| $2,500 to $4,999 | 16 (6.8%) | 5 (2.9%) |
| $5,000 to $7,499 | 3 (1.3%) | 0 (0.0%) |
| $7,500 to $9,999 | 1 (0.4%) | 2 (1.2%) |
| $10,000 to $12,499 | 0 (0.0%) | 16 (9.4%) |
| $12,500 to $14,999 | 2 (0.9%) | 0 (0.0%) |
| $15,000 to $17,499 | 4 (1.7%) | 10 (5.9%) |
| $17,500 to $19,999 | 4 (1.7%) | 4 (2.3%) |
| $20,000 to $22,499 | 5 (2.1%) | 3 (1.8%) |
| $22,500 to $24,999 | 7 (3.0%) | 9 (5.3%) |
| $25,000 to $29,999 | 4 (1.7%) | 2 (1.2%) |
| $30,000 to $34,999 | 11 (4.7%) | 14 (8.2%) |
| $35,000 to $39,999 | 27 (11.5%) | 9 (5.3%) |
| $40,000 to $44,999 | 20 (8.6%) | 6 (3.5%) |
| $45,000 to $49,999 | 33 (14.1%) | 4 (2.3%) |
| $50,000 to $54,999 | 3 (1.3%) | 2 (1.2%) |
| $55,000 to $64,999 | 19 (8.1%) | 45 (26.3%) |
| $65,000 to $74,999 | 14 (6.0%) | 5 (2.9%) |
| $75,000 to $99,999 | 25 (10.7%) | 12 (7.0%) |
| $100,000+ | 26 (11.1%) | 2 (1.2%) |
| Total | 234 (100.0%) | 171 (100.0%) |
Earnings by Sex by Educational Attainment in Mathiston
Average earnings in Mathiston are $48,229 for men and $41,667 for women, a difference of 13.6%. Men with an educational attainment of college or associate's degree enjoy the highest average annual earnings of $66,429, while those with high school diploma education earn the least with $40,268. Women with an educational attainment of bachelor's degree earn the most with the average annual earnings of $68,750, while those with high school diploma education have the smallest earnings of $24,861.
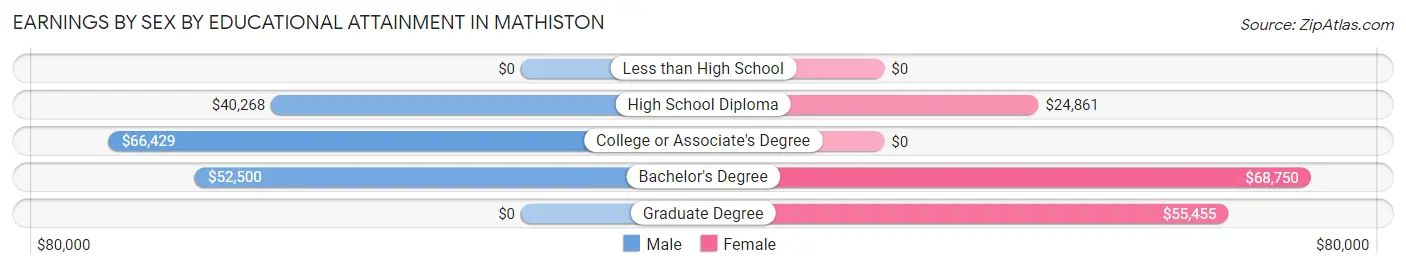
| Educational Attainment | Male Income | Female Income |
| Less than High School | - | - |
| High School Diploma | $40,268 | $24,861 |
| College or Associate's Degree | $66,429 | $0 |
| Bachelor's Degree | $52,500 | $68,750 |
| Graduate Degree | - | - |
| Total | $48,229 | $41,667 |
Family Income in Mathiston
Family Income Brackets in Mathiston
According to the Mathiston family income data, there are 61 families falling into the $50,000 to $74,999 income range, which is the most common income bracket and makes up 24.9% of all families. Conversely, the less than $10,000 income bracket is the least frequent group with only 3 families (1.2%) belonging to this category.
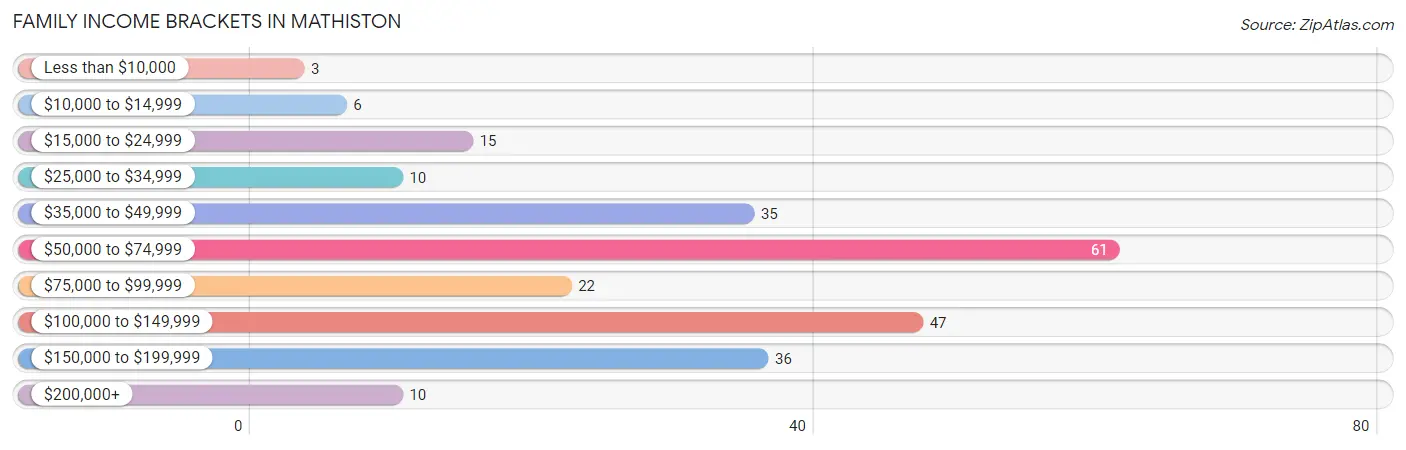
| Income Bracket | # Families | % Families |
| Less than $10,000 | 3 | 1.2% |
| $10,000 to $14,999 | 6 | 2.4% |
| $15,000 to $24,999 | 15 | 6.1% |
| $25,000 to $34,999 | 10 | 4.1% |
| $35,000 to $49,999 | 35 | 14.3% |
| $50,000 to $74,999 | 61 | 24.9% |
| $75,000 to $99,999 | 22 | 9.0% |
| $100,000 to $149,999 | 47 | 19.2% |
| $150,000 to $199,999 | 36 | 14.7% |
| $200,000+ | 10 | 4.1% |
Family Income by Famaliy Size in Mathiston
3-person families (66 | 26.9%) account for the highest median family income in Mathiston with $88,750 per family, while 2-person families (138 | 56.3%) have the highest median income of $31,666 per family member.
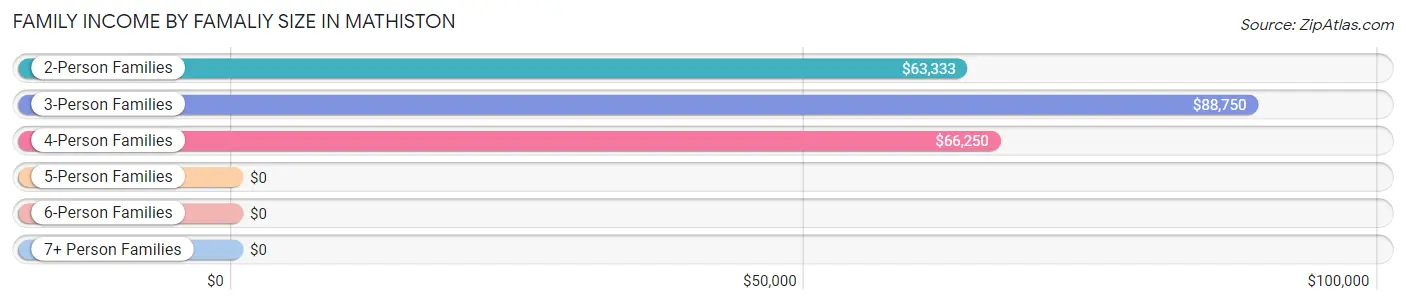
| Income Bracket | # Families | Median Income |
| 2-Person Families | 138 (56.3%) | $63,333 |
| 3-Person Families | 66 (26.9%) | $88,750 |
| 4-Person Families | 20 (8.2%) | $66,250 |
| 5-Person Families | 15 (6.1%) | $0 |
| 6-Person Families | 6 (2.5%) | $0 |
| 7+ Person Families | 0 (0.0%) | $0 |
| Total | 245 (100.0%) | $74,330 |
Family Income by Number of Earners in Mathiston
The median family income in Mathiston is $74,330, with families comprising 3+ earners (29) having the highest median family income of $163,304, while families with no earners (58) have the lowest median family income of $55,179, accounting for 11.8% and 23.7% of families, respectively.
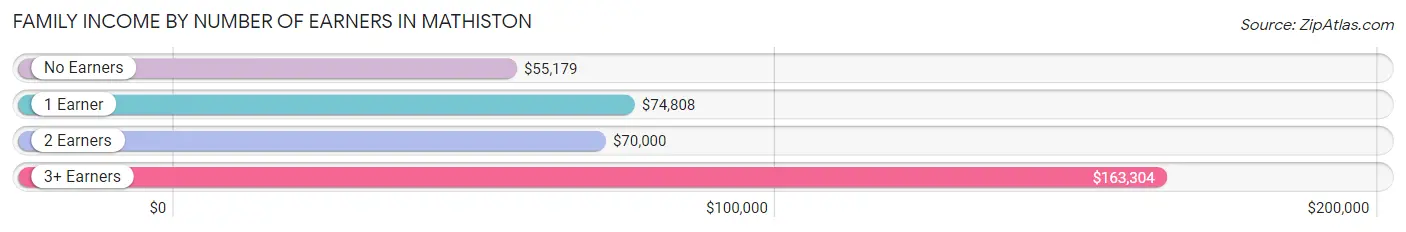
| Number of Earners | # Families | Median Income |
| No Earners | 58 (23.7%) | $55,179 |
| 1 Earner | 78 (31.8%) | $74,808 |
| 2 Earners | 80 (32.7%) | $70,000 |
| 3+ Earners | 29 (11.8%) | $163,304 |
| Total | 245 (100.0%) | $74,330 |
Household Income in Mathiston
Household Income Brackets in Mathiston
With 74 households falling in the category, the $50,000 to $74,999 income range is the most frequent in Mathiston, accounting for 21.2% of all households. In contrast, only 11 households (3.2%) fall into the $200,000+ income bracket, making it the least populous group.
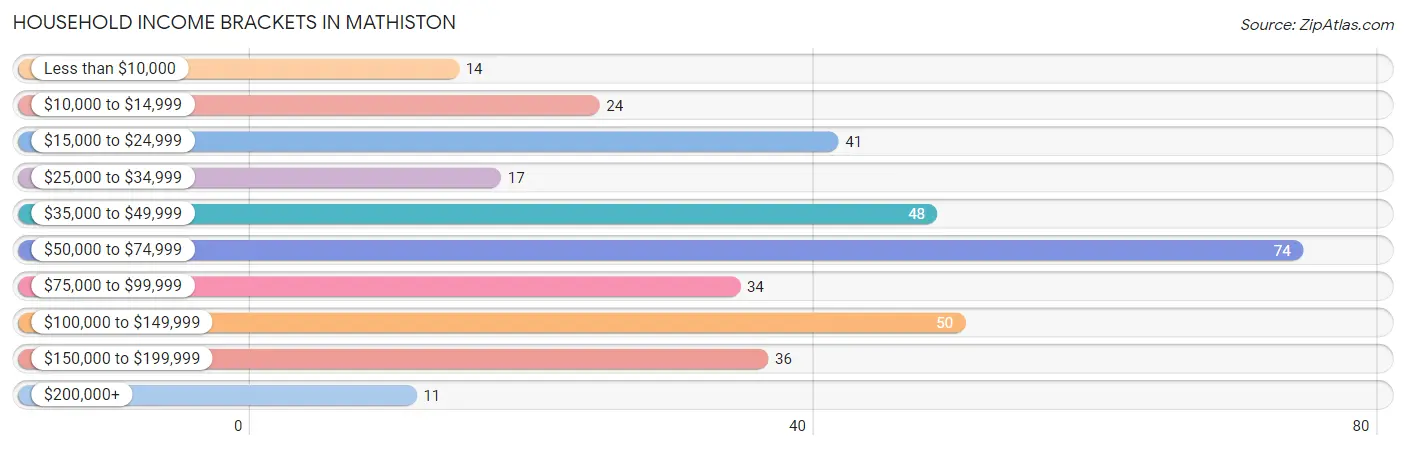
| Income Bracket | # Households | % Households |
| Less than $10,000 | 14 | 4.0% |
| $10,000 to $14,999 | 24 | 6.9% |
| $15,000 to $24,999 | 41 | 11.7% |
| $25,000 to $34,999 | 17 | 4.9% |
| $35,000 to $49,999 | 48 | 13.8% |
| $50,000 to $74,999 | 74 | 21.2% |
| $75,000 to $99,999 | 34 | 9.7% |
| $100,000 to $149,999 | 50 | 14.3% |
| $150,000 to $199,999 | 36 | 10.3% |
| $200,000+ | 11 | 3.2% |
Household Income by Householder Age in Mathiston
The median household income in Mathiston is $62,708, with the highest median household income of $78,750 found in the 45 to 64 years age bracket for the primary householder. A total of 108 households (30.9%) fall into this category. Meanwhile, the 15 to 24 years age bracket for the primary householder has the lowest median household income of $0, with 2 households (0.6%) in this group.
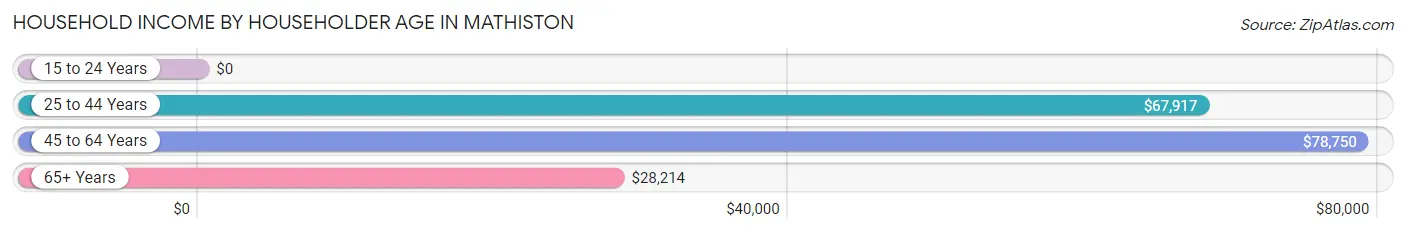
| Income Bracket | # Households | Median Income |
| 15 to 24 Years | 2 (0.6%) | $0 |
| 25 to 44 Years | 119 (34.1%) | $67,917 |
| 45 to 64 Years | 108 (30.9%) | $78,750 |
| 65+ Years | 120 (34.4%) | $28,214 |
| Total | 349 (100.0%) | $62,708 |
Poverty in Mathiston
Income Below Poverty by Sex and Age in Mathiston
With 9.4% poverty level for males and 10.3% for females among the residents of Mathiston, 75 year old and over males and 6 to 11 year old females are the most vulnerable to poverty, with 4 males (50.0%) and 8 females (27.6%) in their respective age groups living below the poverty level.
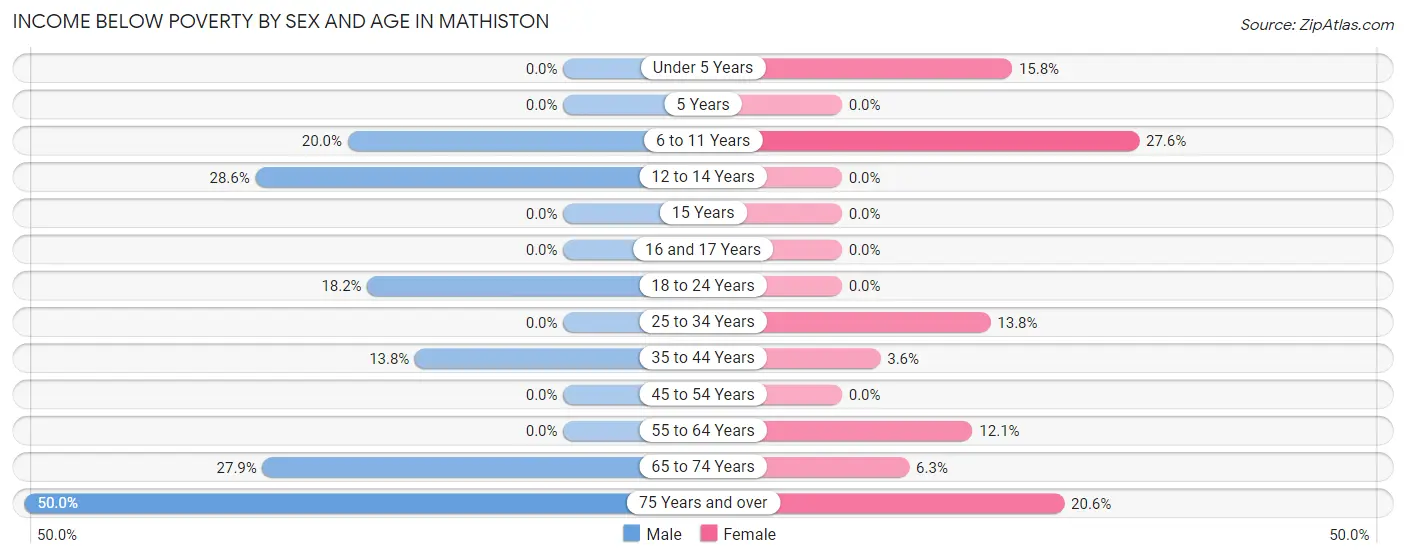
| Age Bracket | Male | Female |
| Under 5 Years | 0 (0.0%) | 6 (15.8%) |
| 5 Years | 0 (0.0%) | 0 (0.0%) |
| 6 to 11 Years | 3 (20.0%) | 8 (27.6%) |
| 12 to 14 Years | 4 (28.6%) | 0 (0.0%) |
| 15 Years | 0 (0.0%) | 0 (0.0%) |
| 16 and 17 Years | 0 (0.0%) | 0 (0.0%) |
| 18 to 24 Years | 2 (18.2%) | 0 (0.0%) |
| 25 to 34 Years | 0 (0.0%) | 4 (13.8%) |
| 35 to 44 Years | 11 (13.8%) | 2 (3.6%) |
| 45 to 54 Years | 0 (0.0%) | 0 (0.0%) |
| 55 to 64 Years | 0 (0.0%) | 4 (12.1%) |
| 65 to 74 Years | 12 (27.9%) | 4 (6.2%) |
| 75 Years and over | 4 (50.0%) | 13 (20.6%) |
| Total | 36 (9.4%) | 41 (10.3%) |
Income Above Poverty by Sex and Age in Mathiston
According to the poverty statistics in Mathiston, males aged under 5 years and females aged 12 to 14 years are the age groups that are most secure financially, with 100.0% of males and 100.0% of females in these age groups living above the poverty line.
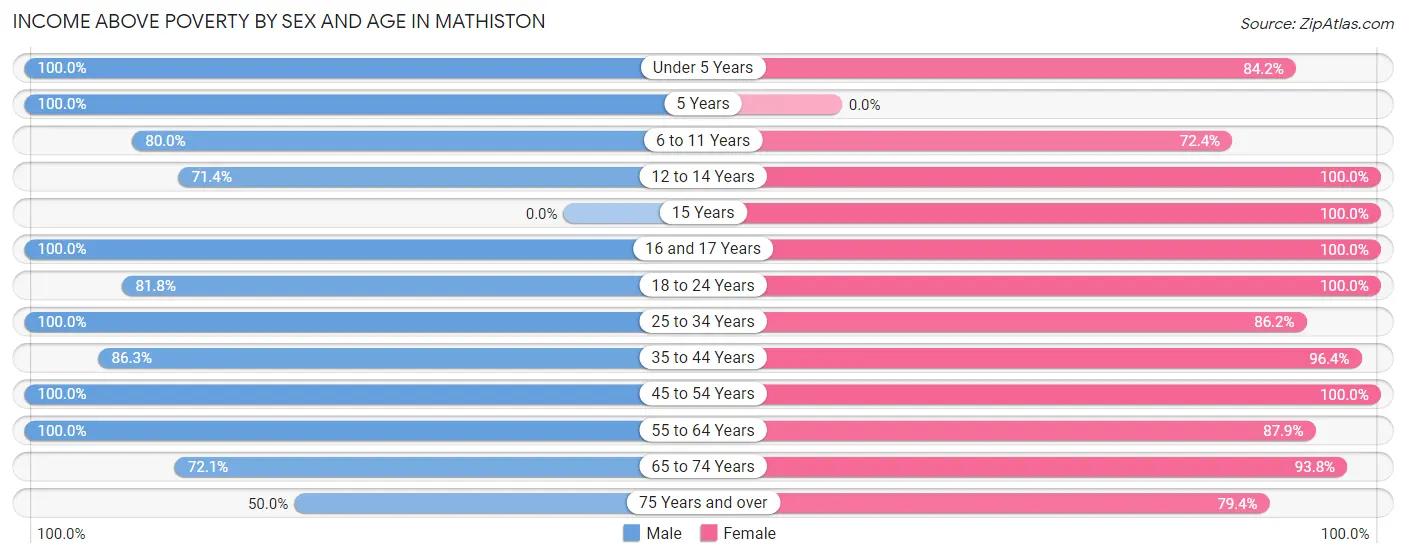
| Age Bracket | Male | Female |
| Under 5 Years | 26 (100.0%) | 32 (84.2%) |
| 5 Years | 1 (100.0%) | 0 (0.0%) |
| 6 to 11 Years | 12 (80.0%) | 21 (72.4%) |
| 12 to 14 Years | 10 (71.4%) | 8 (100.0%) |
| 15 Years | 0 (0.0%) | 4 (100.0%) |
| 16 and 17 Years | 21 (100.0%) | 9 (100.0%) |
| 18 to 24 Years | 9 (81.8%) | 27 (100.0%) |
| 25 to 34 Years | 59 (100.0%) | 25 (86.2%) |
| 35 to 44 Years | 69 (86.3%) | 54 (96.4%) |
| 45 to 54 Years | 45 (100.0%) | 38 (100.0%) |
| 55 to 64 Years | 61 (100.0%) | 29 (87.9%) |
| 65 to 74 Years | 31 (72.1%) | 60 (93.8%) |
| 75 Years and over | 4 (50.0%) | 50 (79.4%) |
| Total | 348 (90.6%) | 357 (89.7%) |
Income Below Poverty Among Married-Couple Families in Mathiston
The poverty statistics for married-couple families in Mathiston show that 5.8% or 9 of the total 156 families live below the poverty line. Families with no children have the highest poverty rate of 9.1%, comprising of 9 families. On the other hand, families with 1 or 2 children have the lowest poverty rate of 0.0%, which includes 0 families.
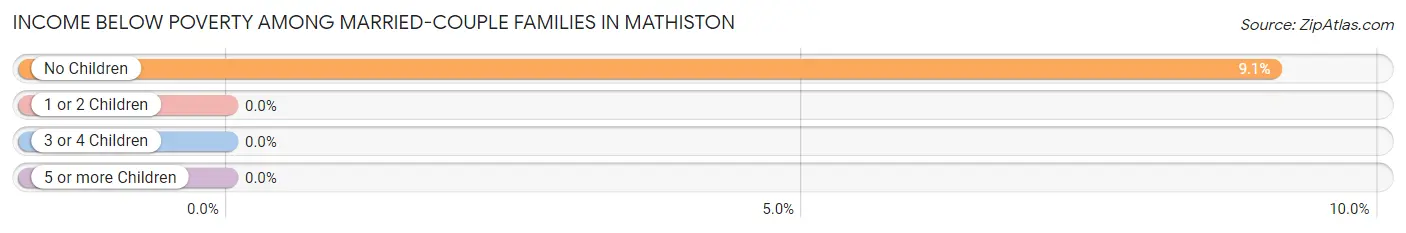
| Children | Above Poverty | Below Poverty |
| No Children | 90 (90.9%) | 9 (9.1%) |
| 1 or 2 Children | 44 (100.0%) | 0 (0.0%) |
| 3 or 4 Children | 13 (100.0%) | 0 (0.0%) |
| 5 or more Children | 0 (0.0%) | 0 (0.0%) |
| Total | 147 (94.2%) | 9 (5.8%) |
Income Below Poverty Among Single-Parent Households in Mathiston
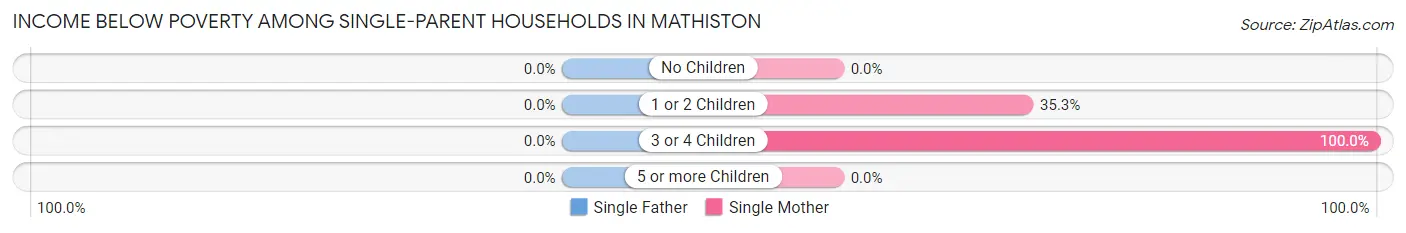
| Children | Single Father | Single Mother |
| No Children | 0 (0.0%) | 0 (0.0%) |
| 1 or 2 Children | 0 (0.0%) | 6 (35.3%) |
| 3 or 4 Children | 0 (0.0%) | 3 (100.0%) |
| 5 or more Children | 0 (0.0%) | 0 (0.0%) |
| Total | 0 (0.0%) | 9 (23.1%) |
Income Below Poverty Among Married-Couple vs Single-Parent Households in Mathiston
The poverty data for Mathiston shows that 9 of the married-couple family households (5.8%) and 9 of the single-parent households (10.1%) are living below the poverty level. Within the married-couple family households, those with no children have the highest poverty rate, with 9 households (9.1%) falling below the poverty line. Among the single-parent households, those with 3 or 4 children have the highest poverty rate, with 3 household (100.0%) living below poverty.
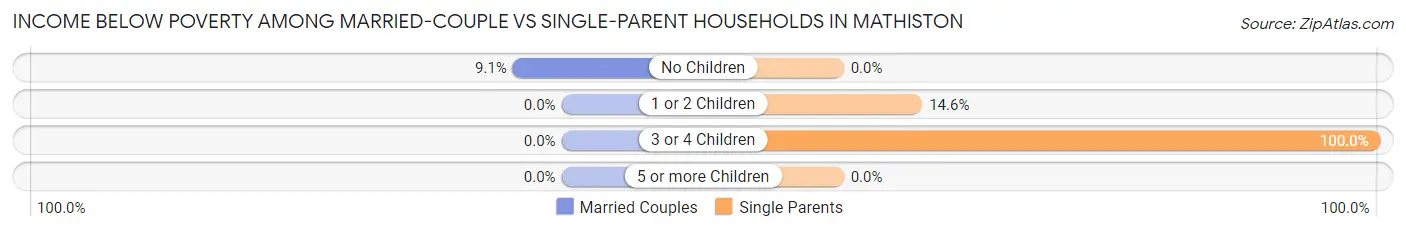
| Children | Married-Couple Families | Single-Parent Households |
| No Children | 9 (9.1%) | 0 (0.0%) |
| 1 or 2 Children | 0 (0.0%) | 6 (14.6%) |
| 3 or 4 Children | 0 (0.0%) | 3 (100.0%) |
| 5 or more Children | 0 (0.0%) | 0 (0.0%) |
| Total | 9 (5.8%) | 9 (10.1%) |
Race in Mathiston
The most populous races in Mathiston are White / Caucasian (697 | 86.4%), Black / African American (71 | 8.8%), and Two or more Races (22 | 2.7%).
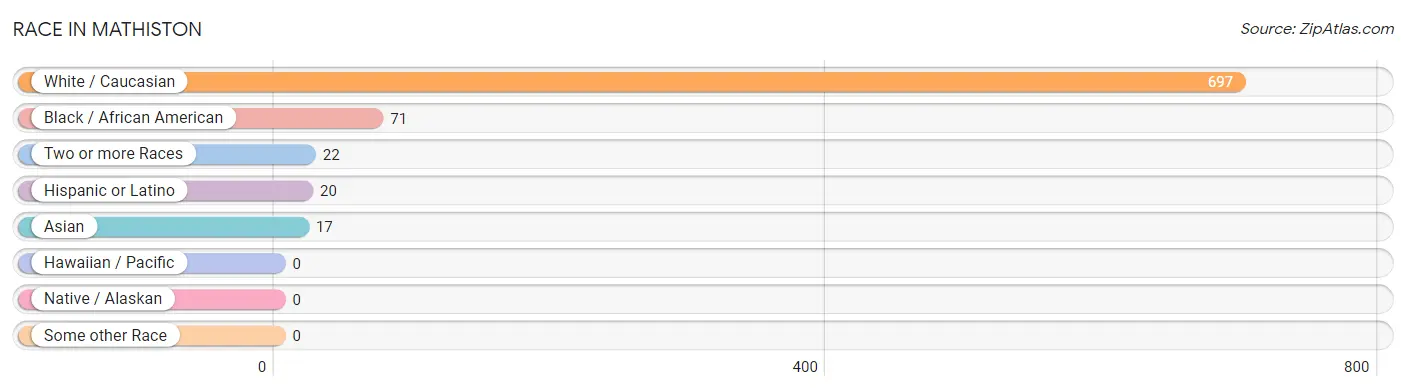
| Race | # Population | % Population |
| Asian | 17 | 2.1% |
| Black / African American | 71 | 8.8% |
| Hawaiian / Pacific | 0 | 0.0% |
| Hispanic or Latino | 20 | 2.5% |
| Native / Alaskan | 0 | 0.0% |
| White / Caucasian | 697 | 86.4% |
| Two or more Races | 22 | 2.7% |
| Some other Race | 0 | 0.0% |
| Total | 807 | 100.0% |
Ancestry in Mathiston
The most populous ancestries reported in Mathiston are American (161 | 20.0%), English (129 | 16.0%), Irish (109 | 13.5%), European (32 | 4.0%), and German (23 | 2.9%), together accounting for 56.3% of all Mathiston residents.
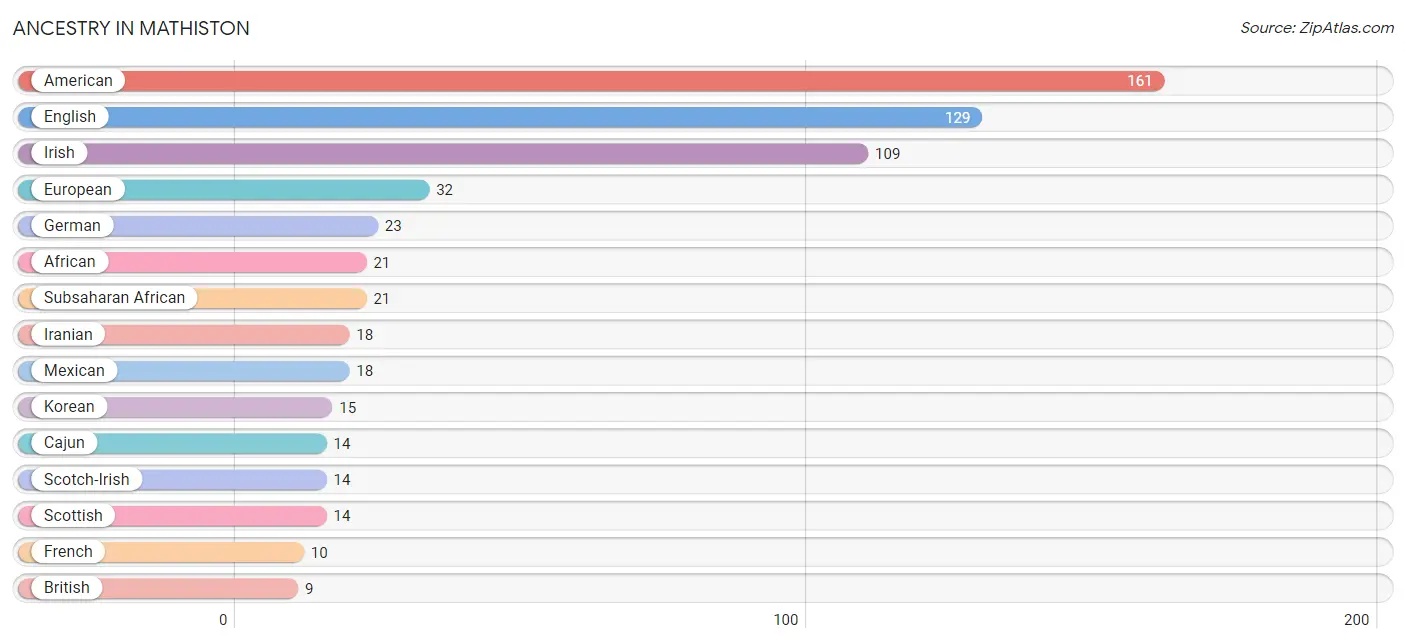
| Ancestry | # Population | % Population |
| African | 21 | 2.6% |
| American | 161 | 20.0% |
| British | 9 | 1.1% |
| Cajun | 14 | 1.7% |
| Canadian | 5 | 0.6% |
| Dutch | 5 | 0.6% |
| English | 129 | 16.0% |
| European | 32 | 4.0% |
| French | 10 | 1.2% |
| German | 23 | 2.9% |
| Iranian | 18 | 2.2% |
| Irish | 109 | 13.5% |
| Korean | 15 | 1.9% |
| Mexican | 18 | 2.2% |
| Polish | 4 | 0.5% |
| Puerto Rican | 2 | 0.3% |
| Scotch-Irish | 14 | 1.7% |
| Scottish | 14 | 1.7% |
| Subsaharan African | 21 | 2.6% |
| Thai | 9 | 1.1% | View All 20 Rows |
Immigrants in Mathiston
The most numerous immigrant groups reported in Mathiston came from Asia (24 | 3.0%), South Central Asia (16 | 2.0%), India (9 | 1.1%), Philippines (8 | 1.0%), and South Eastern Asia (8 | 1.0%), together accounting for 8.1% of all Mathiston residents.
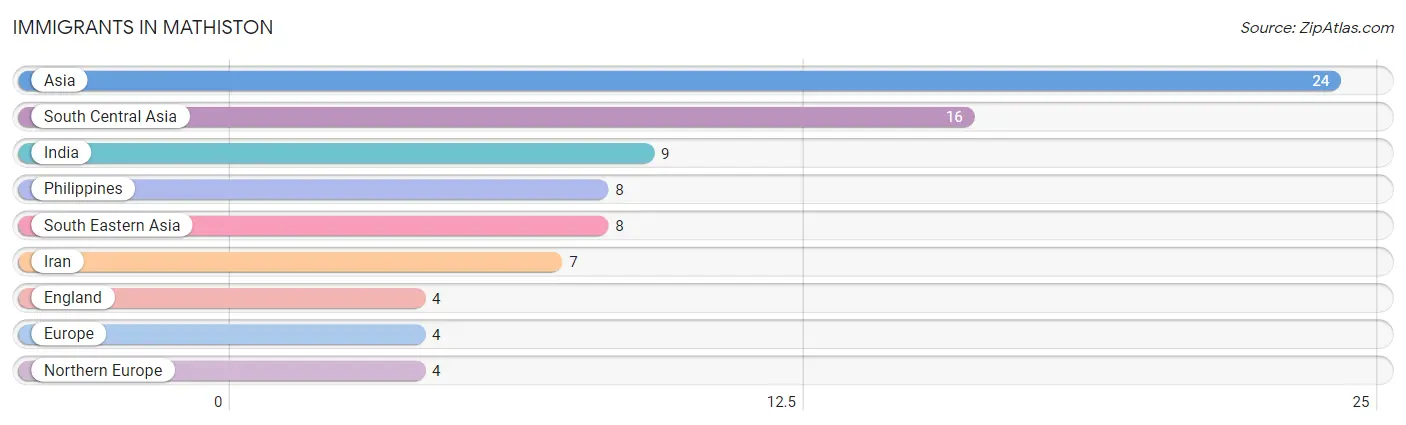
| Immigration Origin | # Population | % Population |
| Asia | 24 | 3.0% |
| England | 4 | 0.5% |
| Europe | 4 | 0.5% |
| India | 9 | 1.1% |
| Iran | 7 | 0.9% |
| Northern Europe | 4 | 0.5% |
| Philippines | 8 | 1.0% |
| South Central Asia | 16 | 2.0% |
| South Eastern Asia | 8 | 1.0% | View All 9 Rows |
Sex and Age in Mathiston
Sex and Age in Mathiston
The most populous age groups in Mathiston are 60 to 64 Years (51 | 12.7%) for men and 70 to 74 Years (39 | 9.6%) for women.
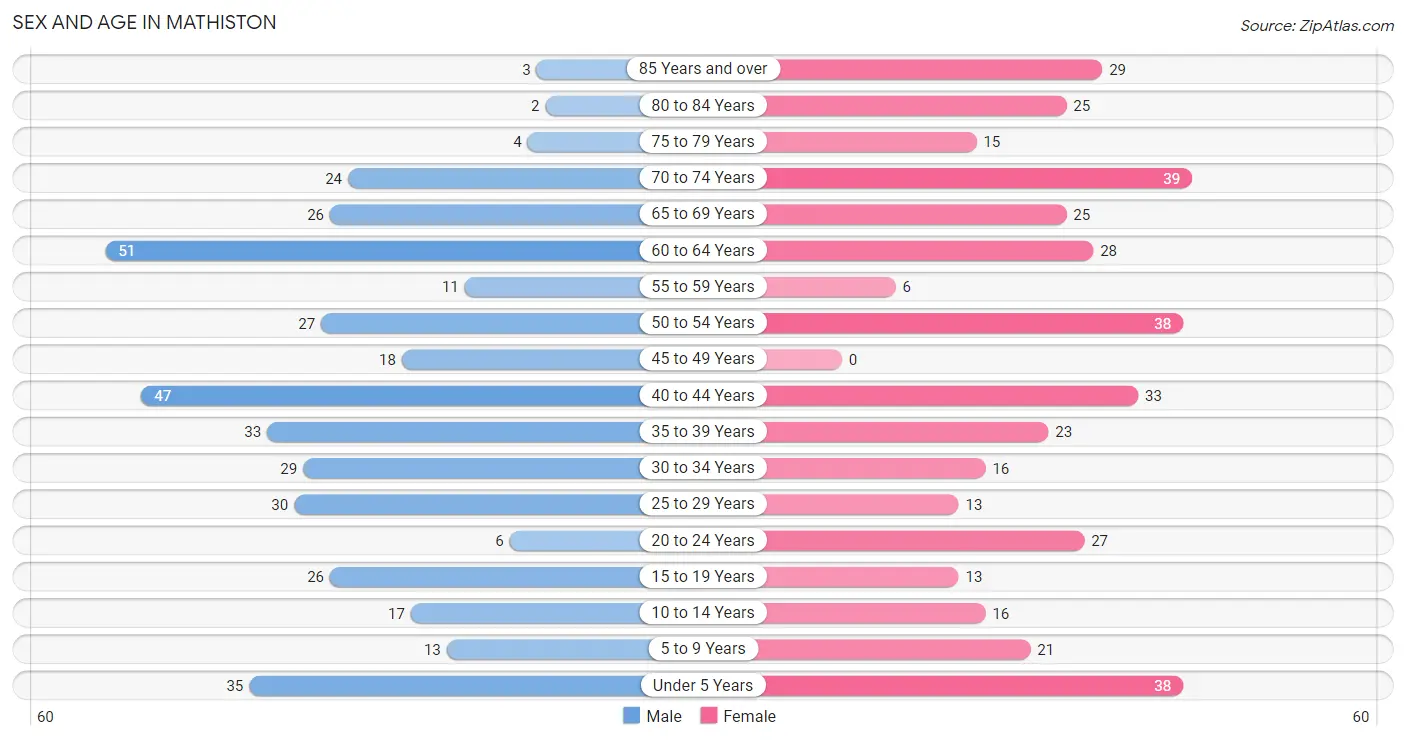
| Age Bracket | Male | Female |
| Under 5 Years | 35 (8.7%) | 38 (9.4%) |
| 5 to 9 Years | 13 (3.2%) | 21 (5.2%) |
| 10 to 14 Years | 17 (4.2%) | 16 (4.0%) |
| 15 to 19 Years | 26 (6.5%) | 13 (3.2%) |
| 20 to 24 Years | 6 (1.5%) | 27 (6.7%) |
| 25 to 29 Years | 30 (7.5%) | 13 (3.2%) |
| 30 to 34 Years | 29 (7.2%) | 16 (4.0%) |
| 35 to 39 Years | 33 (8.2%) | 23 (5.7%) |
| 40 to 44 Years | 47 (11.7%) | 33 (8.2%) |
| 45 to 49 Years | 18 (4.5%) | 0 (0.0%) |
| 50 to 54 Years | 27 (6.7%) | 38 (9.4%) |
| 55 to 59 Years | 11 (2.7%) | 6 (1.5%) |
| 60 to 64 Years | 51 (12.7%) | 28 (6.9%) |
| 65 to 69 Years | 26 (6.5%) | 25 (6.2%) |
| 70 to 74 Years | 24 (6.0%) | 39 (9.6%) |
| 75 to 79 Years | 4 (1.0%) | 15 (3.7%) |
| 80 to 84 Years | 2 (0.5%) | 25 (6.2%) |
| 85 Years and over | 3 (0.7%) | 29 (7.2%) |
| Total | 402 (100.0%) | 405 (100.0%) |
Families and Households in Mathiston
Median Family Size in Mathiston
The median family size in Mathiston is 2.71 persons per family, with single female/mother families (39 | 15.9%) accounting for the largest median family size of 3.08 persons per family. On the other hand, single male/father families (50 | 20.4%) represent the smallest median family size with 2.34 persons per family.
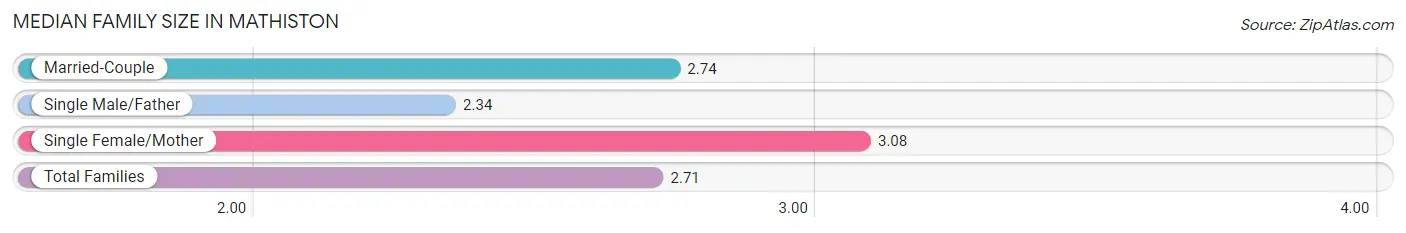
| Family Type | # Families | Family Size |
| Married-Couple | 156 (63.7%) | 2.74 |
| Single Male/Father | 50 (20.4%) | 2.34 |
| Single Female/Mother | 39 (15.9%) | 3.08 |
| Total Families | 245 (100.0%) | 2.71 |
Median Household Size in Mathiston
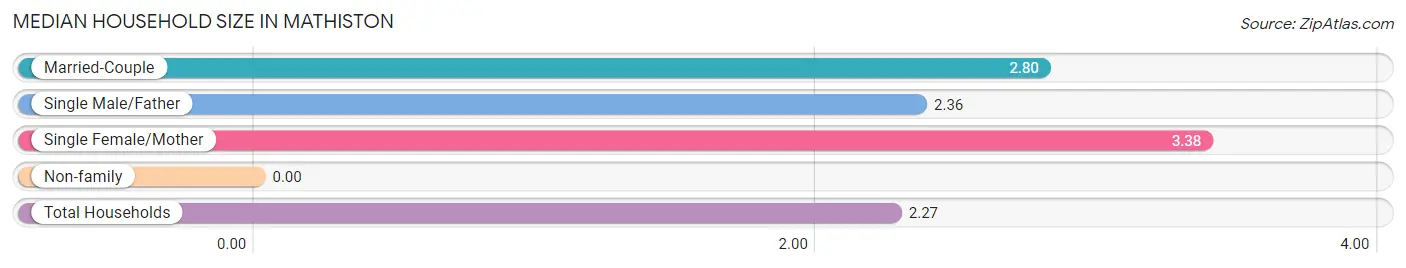
| Household Type | # Households | Household Size |
| Married-Couple | 156 (44.7%) | 2.80 |
| Single Male/Father | 50 (14.3%) | 2.36 |
| Single Female/Mother | 39 (11.2%) | 3.38 |
| Non-family | 104 (29.8%) | - |
| Total Households | 349 (100.0%) | 2.27 |
Household Size by Marriage Status in Mathiston
Out of a total of 349 households in Mathiston, 245 (70.2%) are family households, while 104 (29.8%) are nonfamily households. The most numerous type of family households are 2-person households, comprising 138, and the most common type of nonfamily households are 1-person households, comprising 104.
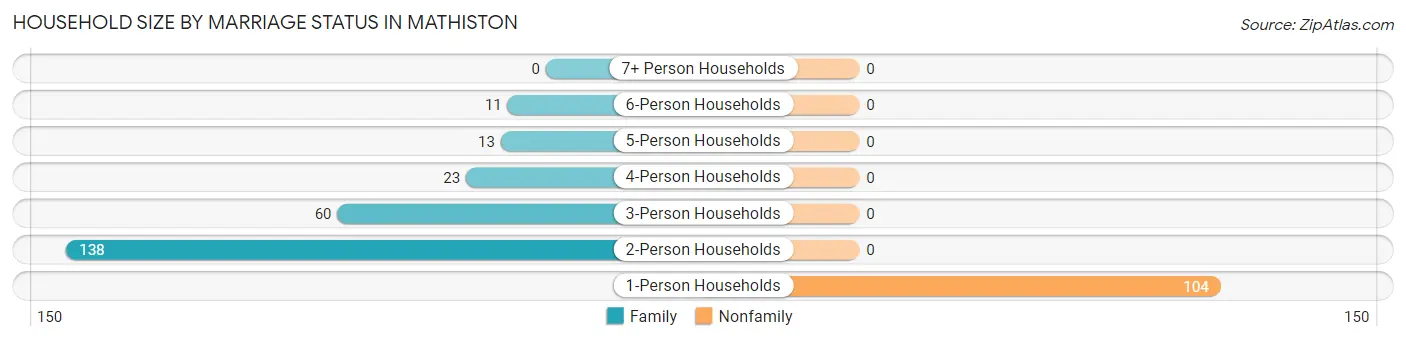
| Household Size | Family Households | Nonfamily Households |
| 1-Person Households | - | 104 (29.8%) |
| 2-Person Households | 138 (39.5%) | 0 (0.0%) |
| 3-Person Households | 60 (17.2%) | 0 (0.0%) |
| 4-Person Households | 23 (6.6%) | 0 (0.0%) |
| 5-Person Households | 13 (3.7%) | 0 (0.0%) |
| 6-Person Households | 11 (3.2%) | 0 (0.0%) |
| 7+ Person Households | 0 (0.0%) | 0 (0.0%) |
| Total | 245 (70.2%) | 104 (29.8%) |
Female Fertility in Mathiston
Fertility by Age in Mathiston
Average fertility rate in Mathiston is 46.0 births per 1,000 women. Women in the age bracket of 20 to 34 years have the highest fertility rate with 89.0 births per 1,000 women. Women in the age bracket of 20 to 34 years acount for 83.3% of all women with births.
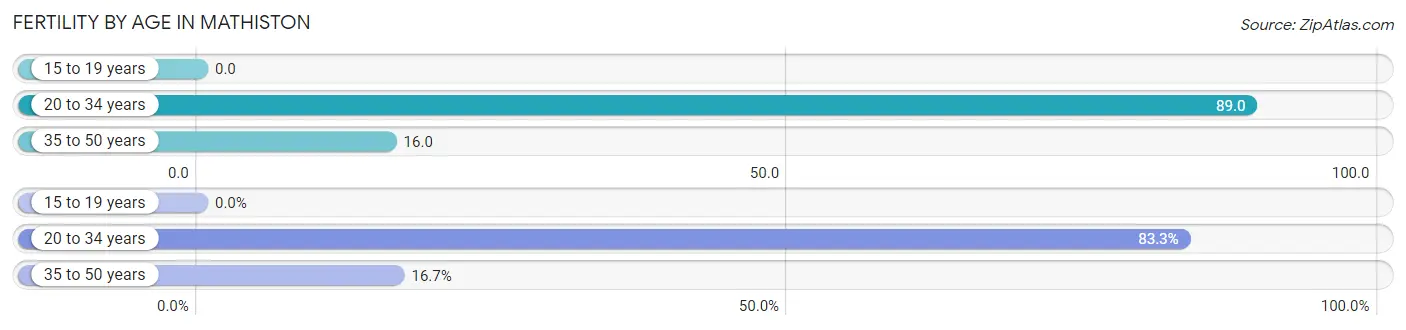
| Age Bracket | Women with Births | Births / 1,000 Women |
| 15 to 19 years | 0 (0.0%) | 0.0 |
| 20 to 34 years | 5 (83.3%) | 89.0 |
| 35 to 50 years | 1 (16.7%) | 16.0 |
| Total | 6 (100.0%) | 46.0 |
Fertility by Age by Marriage Status in Mathiston
83.3% of women with births (6) in Mathiston are married. The highest percentage of unmarried women with births falls into 35 to 50 years age bracket with 100.0% of them unmarried at the time of birth, while the lowest percentage of unmarried women with births belong to 20 to 34 years age bracket with 0.0% of them unmarried.
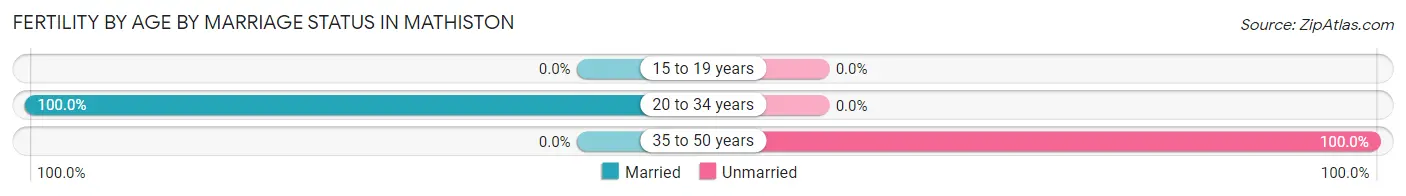
| Age Bracket | Married | Unmarried |
| 15 to 19 years | 0 (0.0%) | 0 (0.0%) |
| 20 to 34 years | 5 (100.0%) | 0 (0.0%) |
| 35 to 50 years | 0 (0.0%) | 1 (100.0%) |
| Total | 5 (83.3%) | 1 (16.7%) |
Fertility by Education in Mathiston
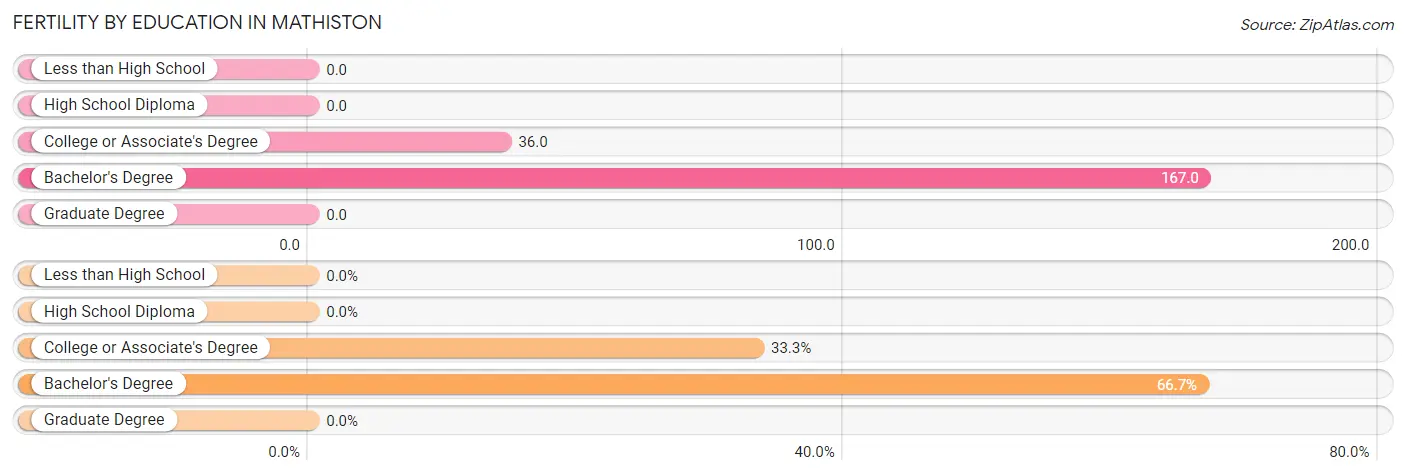
| Educational Attainment | Women with Births | Births / 1,000 Women |
| Less than High School | 0 (0.0%) | 0.0 |
| High School Diploma | 0 (0.0%) | 0.0 |
| College or Associate's Degree | 2 (33.3%) | 36.0 |
| Bachelor's Degree | 4 (66.7%) | 167.0 |
| Graduate Degree | 0 (0.0%) | 0.0 |
| Total | 6 (100.0%) | 46.0 |
Fertility by Education by Marriage Status in Mathiston
16.7% of women with births in Mathiston are unmarried. Women with the educational attainment of bachelor's degree are most likely to be married with 100.0% of them married at childbirth, while women with the educational attainment of college or associate's degree are least likely to be married with 50.0% of them unmarried at childbirth.
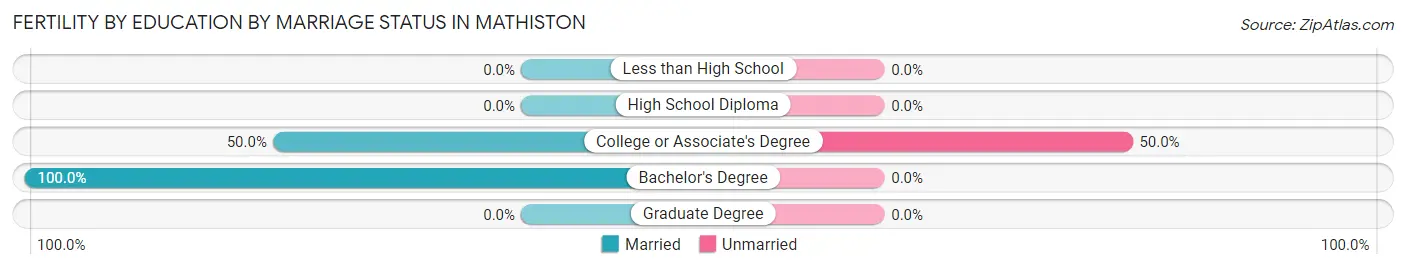
| Educational Attainment | Married | Unmarried |
| Less than High School | 0 (0.0%) | 0 (0.0%) |
| High School Diploma | 0 (0.0%) | 0 (0.0%) |
| College or Associate's Degree | 1 (50.0%) | 1 (50.0%) |
| Bachelor's Degree | 4 (100.0%) | 0 (0.0%) |
| Graduate Degree | 0 (0.0%) | 0 (0.0%) |
| Total | 5 (83.3%) | 1 (16.7%) |
Employment Characteristics in Mathiston
Employment by Class of Employer in Mathiston
Among the 337 employed individuals in Mathiston, private company employees (212 | 62.9%), state government employees (55 | 16.3%), and self-employed (not incorporated) (21 | 6.2%) make up the most common classes of employment.
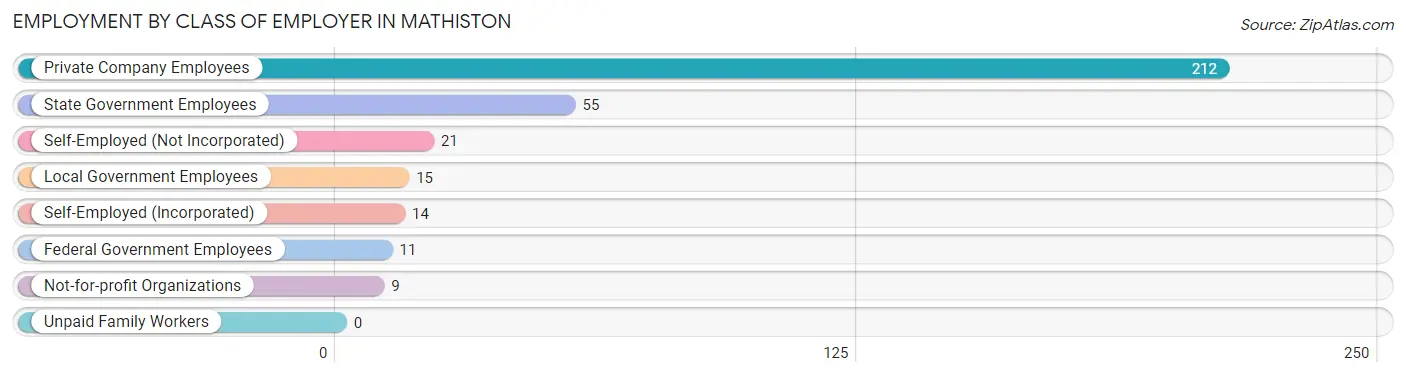
| Employer Class | # Employees | % Employees |
| Private Company Employees | 212 | 62.9% |
| Self-Employed (Incorporated) | 14 | 4.2% |
| Self-Employed (Not Incorporated) | 21 | 6.2% |
| Not-for-profit Organizations | 9 | 2.7% |
| Local Government Employees | 15 | 4.4% |
| State Government Employees | 55 | 16.3% |
| Federal Government Employees | 11 | 3.3% |
| Unpaid Family Workers | 0 | 0.0% |
| Total | 337 | 100.0% |
Employment Status by Age in Mathiston
According to the labor force statistics for Mathiston, out of the total population over 16 years of age (663), 55.1% or 365 individuals are in the labor force, with 5.2% or 19 of them unemployed. The age group with the highest labor force participation rate is 25 to 29 years, with 100.0% or 43 individuals in the labor force. Within the labor force, the 35 to 44 years age range has the highest percentage of unemployed individuals, with 12.8% or 11 of them being unemployed.
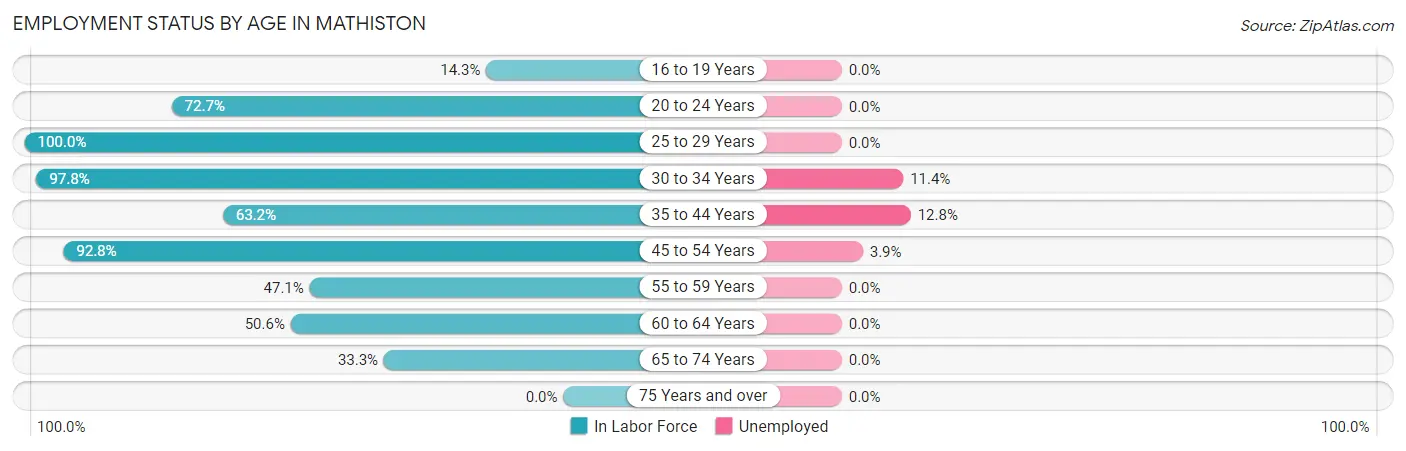
| Age Bracket | In Labor Force | Unemployed |
| 16 to 19 Years | 5 (14.3%) | 0 (0.0%) |
| 20 to 24 Years | 24 (72.7%) | 0 (0.0%) |
| 25 to 29 Years | 43 (100.0%) | 0 (0.0%) |
| 30 to 34 Years | 44 (97.8%) | 5 (11.4%) |
| 35 to 44 Years | 86 (63.2%) | 11 (12.8%) |
| 45 to 54 Years | 77 (92.8%) | 3 (3.9%) |
| 55 to 59 Years | 8 (47.1%) | 0 (0.0%) |
| 60 to 64 Years | 40 (50.6%) | 0 (0.0%) |
| 65 to 74 Years | 38 (33.3%) | 0 (0.0%) |
| 75 Years and over | 0 (0.0%) | 0 (0.0%) |
| Total | 365 (55.1%) | 19 (5.2%) |
Employment Status by Educational Attainment in Mathiston
According to labor force statistics for Mathiston, 73.9% of individuals (298) out of the total population between 25 and 64 years of age (403) are in the labor force, with 6.4% or 19 of them being unemployed. The group with the highest labor force participation rate are those with the educational attainment of bachelor's degree or higher, with 96.6% or 115 individuals in the labor force. Within the labor force, individuals with high school diploma education have the highest percentage of unemployment, with 9.3% or 5 of them being unemployed.
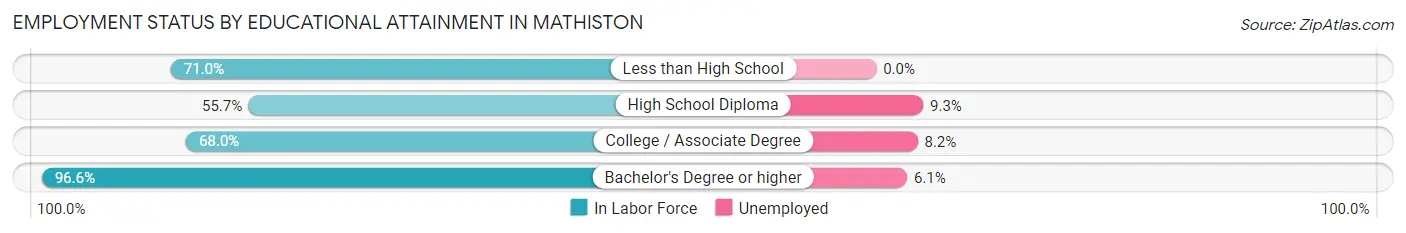
| Educational Attainment | In Labor Force | Unemployed |
| Less than High School | 44 (71.0%) | 0 (0.0%) |
| High School Diploma | 54 (55.7%) | 9 (9.3%) |
| College / Associate Degree | 85 (68.0%) | 10 (8.2%) |
| Bachelor's Degree or higher | 115 (96.6%) | 7 (6.1%) |
| Total | 298 (73.9%) | 26 (6.4%) |
Employment Occupations by Sex in Mathiston
Management, Business, Science and Arts Occupations
The most common Management, Business, Science and Arts occupations in Mathiston are Management (44 | 12.7%), Community & Social Service (40 | 11.6%), Education Instruction & Library (26 | 7.5%), Health Diagnosing & Treating (20 | 5.8%), and Health Technologists (18 | 5.2%).
Management, Business, Science and Arts Occupations by Sex
Within the Management, Business, Science and Arts occupations in Mathiston, the most male-oriented occupations are Computers & Mathematics (100.0%), Architecture & Engineering (100.0%), and Computers, Engineering & Science (93.8%), while the most female-oriented occupations are Life, Physical & Social Science (100.0%), Education, Arts & Media (100.0%), and Health Technologists (100.0%).
| Occupation | Male | Female |
| Management | 33 (75.0%) | 11 (25.0%) |
| Business & Financial | 0 (0.0%) | 0 (0.0%) |
| Computers, Engineering & Science | 15 (93.8%) | 1 (6.2%) |
| Computers & Mathematics | 12 (100.0%) | 0 (0.0%) |
| Architecture & Engineering | 3 (100.0%) | 0 (0.0%) |
| Life, Physical & Social Science | 0 (0.0%) | 1 (100.0%) |
| Community & Social Service | 18 (45.0%) | 22 (55.0%) |
| Education, Arts & Media | 0 (0.0%) | 3 (100.0%) |
| Legal Services & Support | 0 (0.0%) | 0 (0.0%) |
| Education Instruction & Library | 15 (57.7%) | 11 (42.3%) |
| Arts, Media & Entertainment | 3 (27.3%) | 8 (72.7%) |
| Health Diagnosing & Treating | 2 (10.0%) | 18 (90.0%) |
| Health Technologists | 0 (0.0%) | 18 (100.0%) |
| Total (Category) | 68 (56.7%) | 52 (43.3%) |
| Total (Overall) | 209 (60.4%) | 137 (39.6%) |
Services Occupations
The most common Services occupations in Mathiston are Cleaning & Maintenance (35 | 10.1%), Security & Protection (28 | 8.1%), Law Enforcement (23 | 6.7%), Firefighting & Prevention (5 | 1.5%), and Personal Care & Service (1 | 0.3%).
Services Occupations by Sex
Within the Services occupations in Mathiston, the most male-oriented occupations are Security & Protection (100.0%), Firefighting & Prevention (100.0%), and Law Enforcement (100.0%), while the most female-oriented occupations are Personal Care & Service (100.0%), and Cleaning & Maintenance (80.0%).
| Occupation | Male | Female |
| Healthcare Support | 0 (0.0%) | 0 (0.0%) |
| Security & Protection | 28 (100.0%) | 0 (0.0%) |
| Firefighting & Prevention | 5 (100.0%) | 0 (0.0%) |
| Law Enforcement | 23 (100.0%) | 0 (0.0%) |
| Food Preparation & Serving | 0 (0.0%) | 0 (0.0%) |
| Cleaning & Maintenance | 7 (20.0%) | 28 (80.0%) |
| Personal Care & Service | 0 (0.0%) | 1 (100.0%) |
| Total (Category) | 35 (54.7%) | 29 (45.3%) |
| Total (Overall) | 209 (60.4%) | 137 (39.6%) |
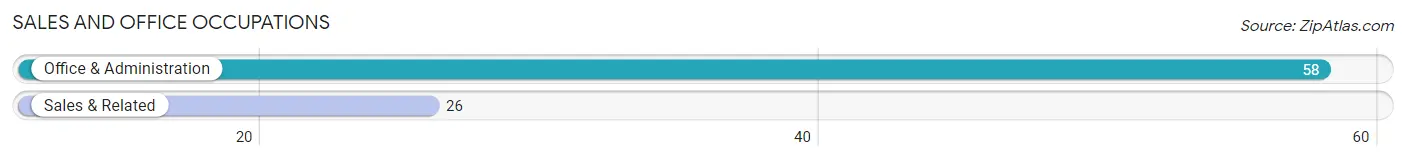
Sales and Office Occupations
The most common Sales and Office occupations in Mathiston are Office & Administration (58 | 16.8%), and Sales & Related (26 | 7.5%).
Sales and Office Occupations by Sex
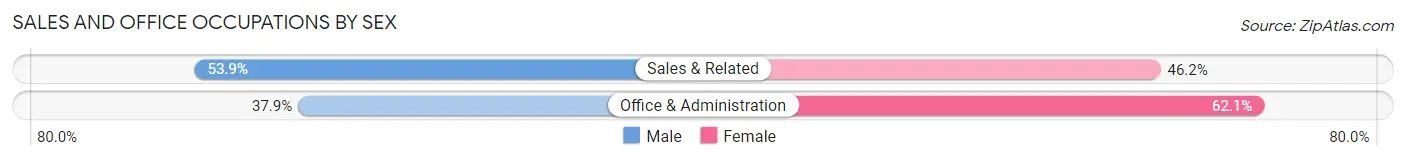
| Occupation | Male | Female |
| Sales & Related | 14 (53.8%) | 12 (46.2%) |
| Office & Administration | 22 (37.9%) | 36 (62.1%) |
| Total (Category) | 36 (42.9%) | 48 (57.1%) |
| Total (Overall) | 209 (60.4%) | 137 (39.6%) |
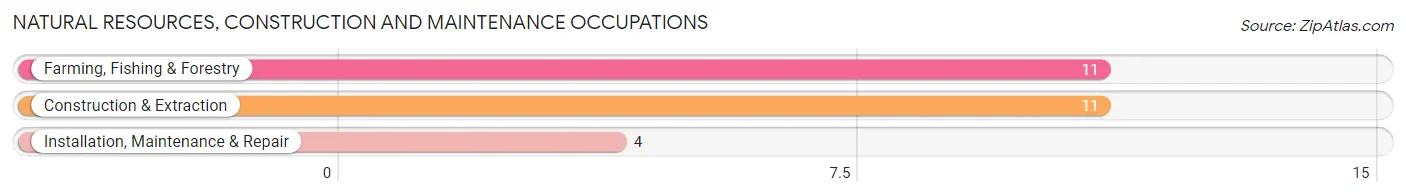
Natural Resources, Construction and Maintenance Occupations
The most common Natural Resources, Construction and Maintenance occupations in Mathiston are Farming, Fishing & Forestry (11 | 3.2%), Construction & Extraction (11 | 3.2%), and Installation, Maintenance & Repair (4 | 1.2%).
Natural Resources, Construction and Maintenance Occupations by Sex
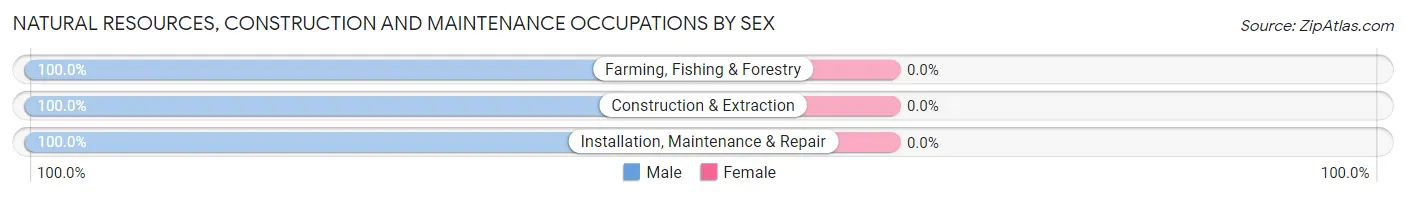
| Occupation | Male | Female |
| Farming, Fishing & Forestry | 11 (100.0%) | 0 (0.0%) |
| Construction & Extraction | 11 (100.0%) | 0 (0.0%) |
| Installation, Maintenance & Repair | 4 (100.0%) | 0 (0.0%) |
| Total (Category) | 26 (100.0%) | 0 (0.0%) |
| Total (Overall) | 209 (60.4%) | 137 (39.6%) |
Production, Transportation and Moving Occupations
The most common Production, Transportation and Moving occupations in Mathiston are Production (19 | 5.5%), Material Moving (18 | 5.2%), and Transportation (15 | 4.3%).
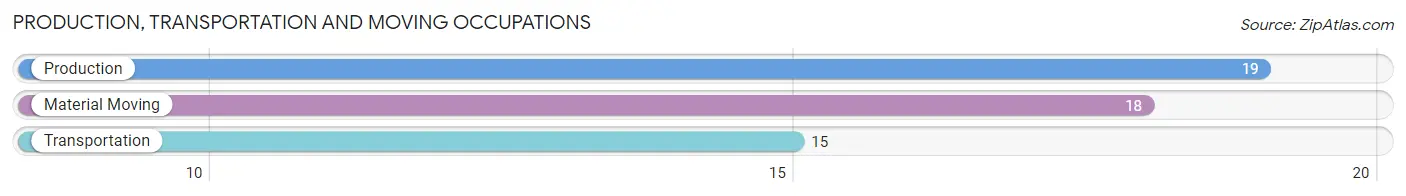
Production, Transportation and Moving Occupations by Sex
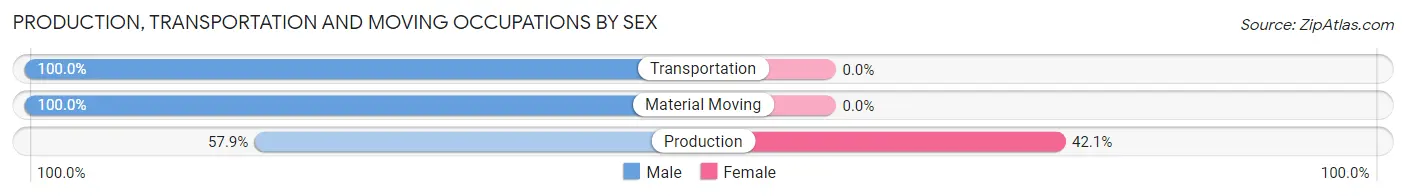
| Occupation | Male | Female |
| Production | 11 (57.9%) | 8 (42.1%) |
| Transportation | 15 (100.0%) | 0 (0.0%) |
| Material Moving | 18 (100.0%) | 0 (0.0%) |
| Total (Category) | 44 (84.6%) | 8 (15.4%) |
| Total (Overall) | 209 (60.4%) | 137 (39.6%) |
Employment Industries by Sex in Mathiston
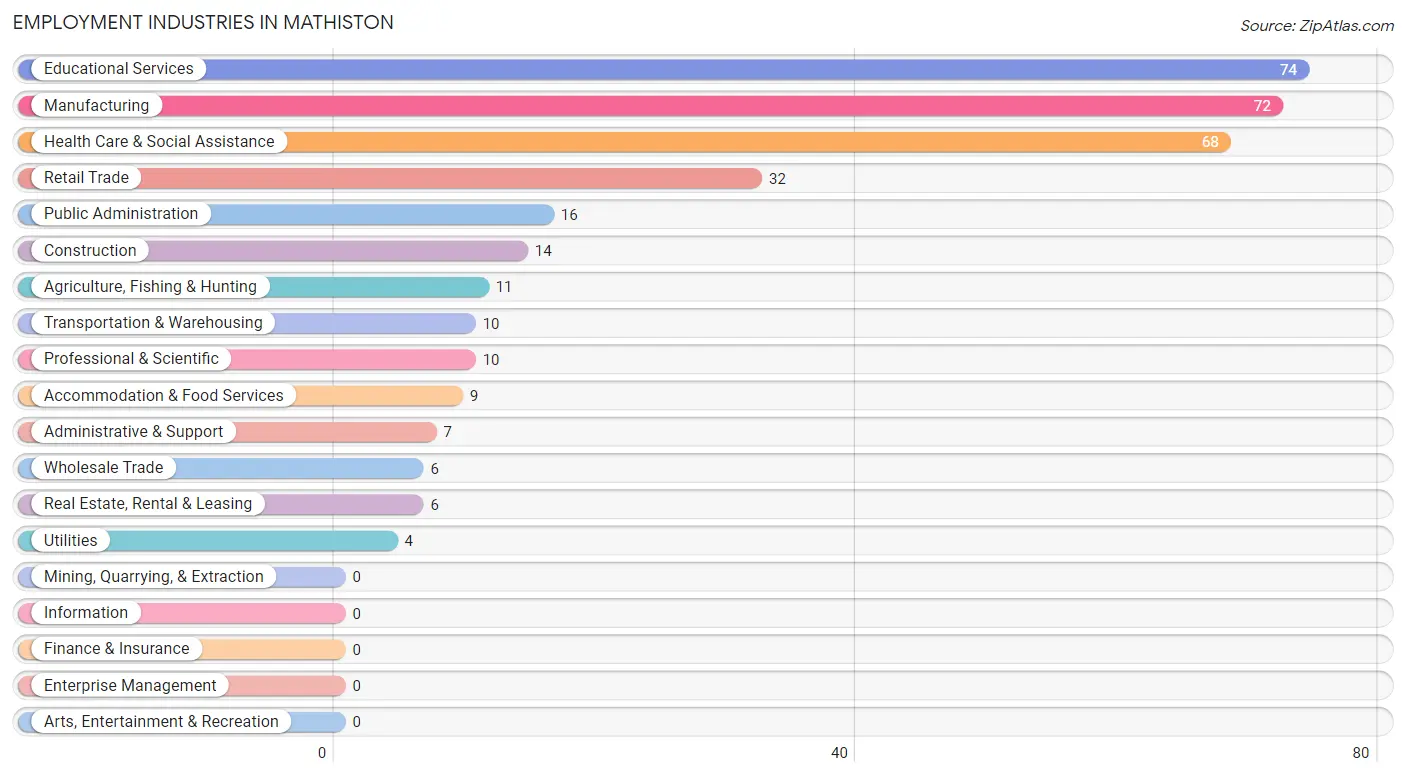
Employment Industries in Mathiston
The major employment industries in Mathiston include Educational Services (74 | 21.4%), Manufacturing (72 | 20.8%), Health Care & Social Assistance (68 | 19.7%), Retail Trade (32 | 9.2%), and Public Administration (16 | 4.6%).
Employment Industries by Sex in Mathiston
The Mathiston industries that see more men than women are Agriculture, Fishing & Hunting (100.0%), Wholesale Trade (100.0%), and Utilities (100.0%), whereas the industries that tend to have a higher number of women are Real Estate, Rental & Leasing (100.0%), Health Care & Social Assistance (97.1%), and Retail Trade (50.0%).
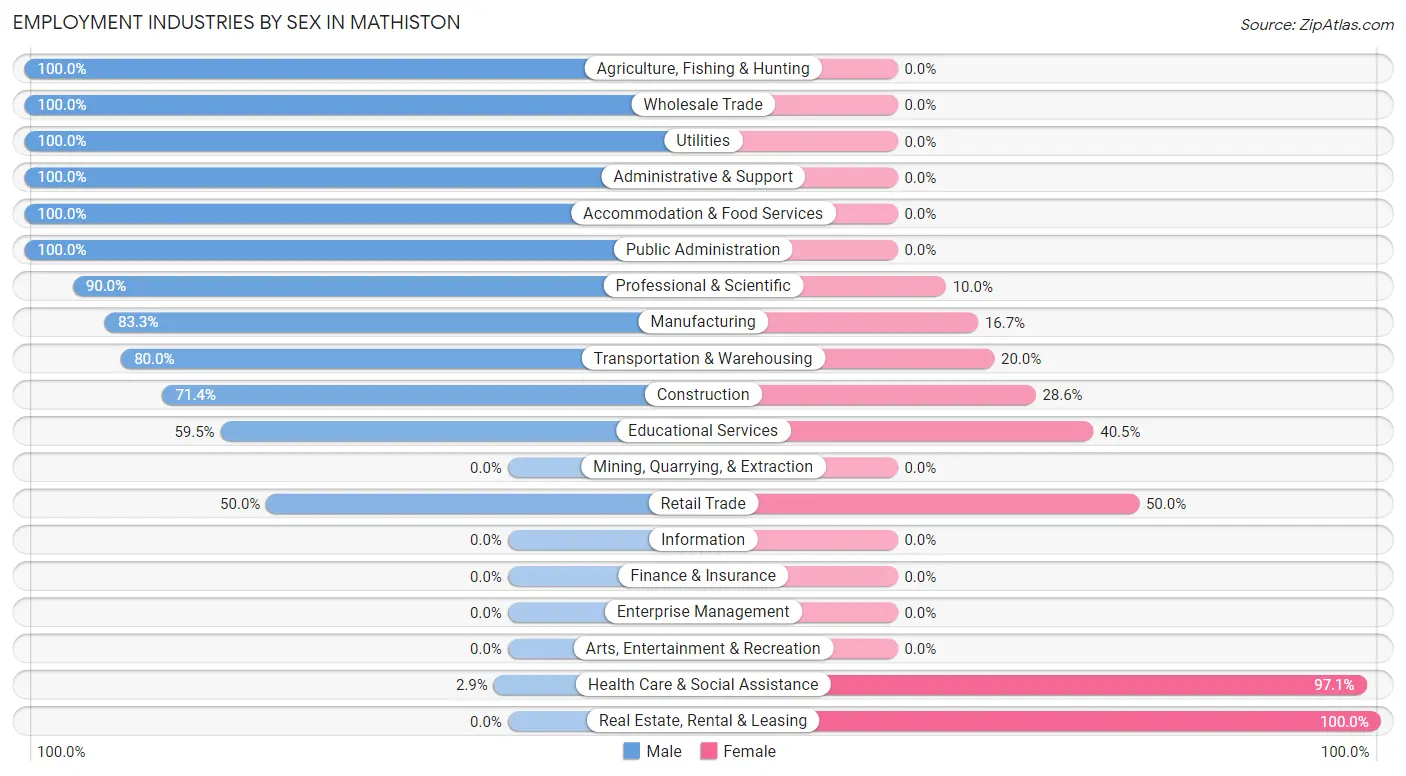
| Industry | Male | Female |
| Agriculture, Fishing & Hunting | 11 (100.0%) | 0 (0.0%) |
| Mining, Quarrying, & Extraction | 0 (0.0%) | 0 (0.0%) |
| Construction | 10 (71.4%) | 4 (28.6%) |
| Manufacturing | 60 (83.3%) | 12 (16.7%) |
| Wholesale Trade | 6 (100.0%) | 0 (0.0%) |
| Retail Trade | 16 (50.0%) | 16 (50.0%) |
| Transportation & Warehousing | 8 (80.0%) | 2 (20.0%) |
| Utilities | 4 (100.0%) | 0 (0.0%) |
| Information | 0 (0.0%) | 0 (0.0%) |
| Finance & Insurance | 0 (0.0%) | 0 (0.0%) |
| Real Estate, Rental & Leasing | 0 (0.0%) | 6 (100.0%) |
| Professional & Scientific | 9 (90.0%) | 1 (10.0%) |
| Enterprise Management | 0 (0.0%) | 0 (0.0%) |
| Administrative & Support | 7 (100.0%) | 0 (0.0%) |
| Educational Services | 44 (59.5%) | 30 (40.5%) |
| Health Care & Social Assistance | 2 (2.9%) | 66 (97.1%) |
| Arts, Entertainment & Recreation | 0 (0.0%) | 0 (0.0%) |
| Accommodation & Food Services | 9 (100.0%) | 0 (0.0%) |
| Public Administration | 16 (100.0%) | 0 (0.0%) |
| Total | 209 (60.4%) | 137 (39.6%) |
Education in Mathiston
School Enrollment in Mathiston
The most common levels of schooling among the 155 students in Mathiston are high school (41 | 26.5%), elementary school (32 | 20.6%), and middle school (30 | 19.4%).
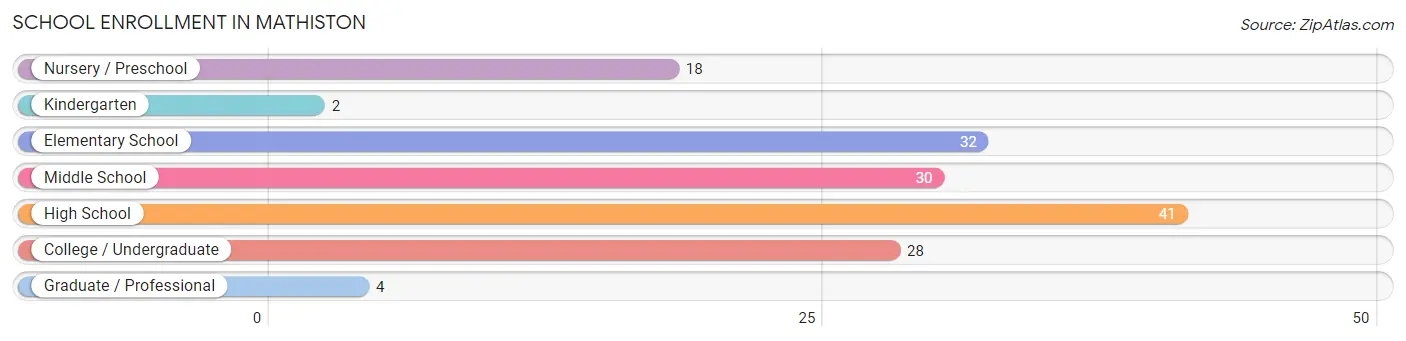
| School Level | # Students | % Students |
| Nursery / Preschool | 18 | 11.6% |
| Kindergarten | 2 | 1.3% |
| Elementary School | 32 | 20.6% |
| Middle School | 30 | 19.4% |
| High School | 41 | 26.5% |
| College / Undergraduate | 28 | 18.1% |
| Graduate / Professional | 4 | 2.6% |
| Total | 155 | 100.0% |
School Enrollment by Age by Funding Source in Mathiston
Out of a total of 155 students who are enrolled in schools in Mathiston, 27 (17.4%) attend a private institution, while the remaining 128 (82.6%) are enrolled in public schools. The age group of 3 to 4 year olds has the highest likelihood of being enrolled in private schools, with 18 (100.0% in the age bracket) enrolled. Conversely, the age group of 20 to 24 year olds has the lowest likelihood of being enrolled in a private school, with 11 (100.0% in the age bracket) attending a public institution.
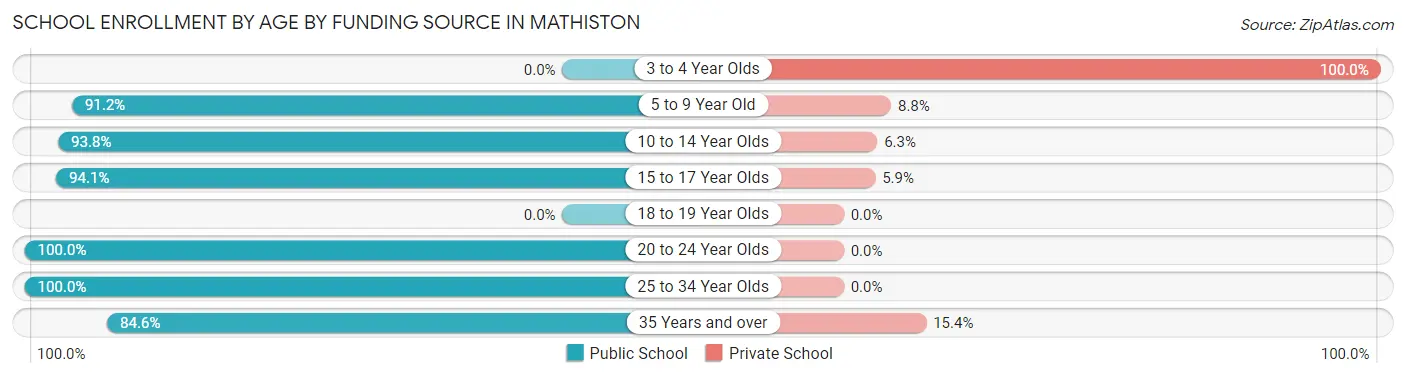
| Age Bracket | Public School | Private School |
| 3 to 4 Year Olds | 0 (0.0%) | 18 (100.0%) |
| 5 to 9 Year Old | 31 (91.2%) | 3 (8.8%) |
| 10 to 14 Year Olds | 30 (93.8%) | 2 (6.2%) |
| 15 to 17 Year Olds | 32 (94.1%) | 2 (5.9%) |
| 18 to 19 Year Olds | 0 (0.0%) | 0 (0.0%) |
| 20 to 24 Year Olds | 11 (100.0%) | 0 (0.0%) |
| 25 to 34 Year Olds | 13 (100.0%) | 0 (0.0%) |
| 35 Years and over | 11 (84.6%) | 2 (15.4%) |
| Total | 128 (82.6%) | 27 (17.4%) |
Educational Attainment by Field of Study in Mathiston
Education (23 | 15.9%), bio, nature & agricultural (21 | 14.5%), engineering (21 | 14.5%), arts & humanities (19 | 13.1%), and science & technology (18 | 12.4%) are the most common fields of study among 145 individuals in Mathiston who have obtained a bachelor's degree or higher.
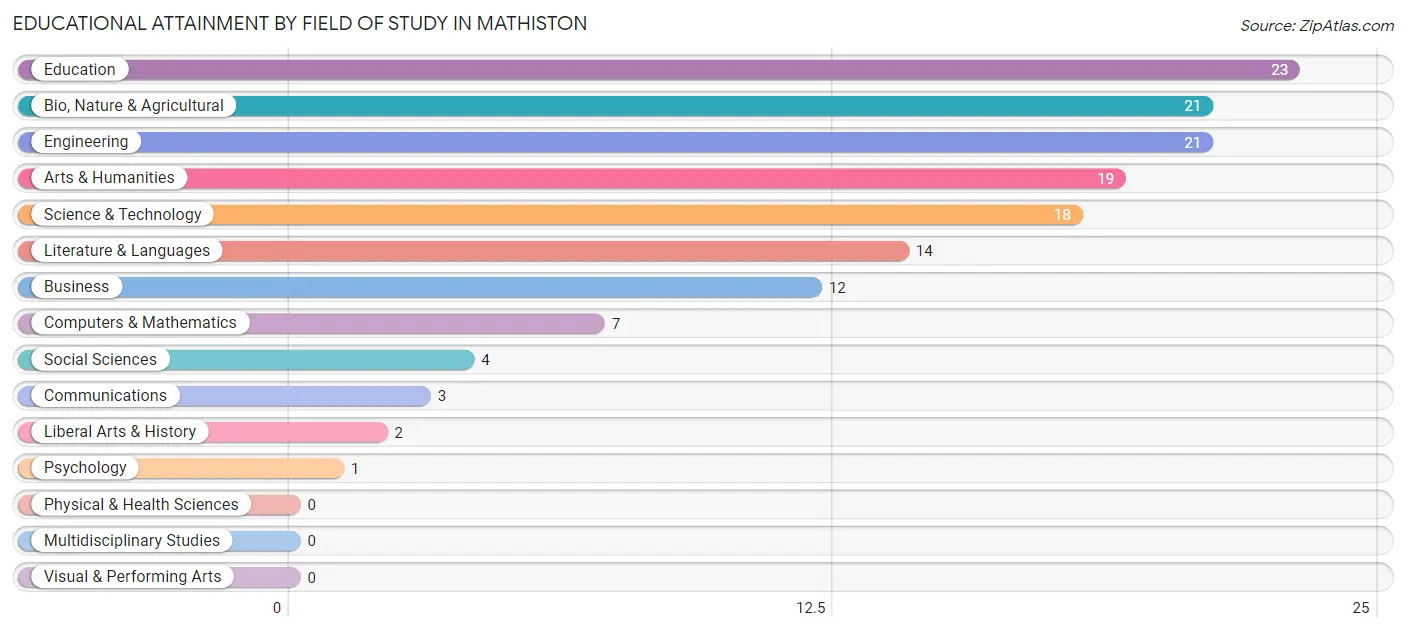
| Field of Study | # Graduates | % Graduates |
| Computers & Mathematics | 7 | 4.8% |
| Bio, Nature & Agricultural | 21 | 14.5% |
| Physical & Health Sciences | 0 | 0.0% |
| Psychology | 1 | 0.7% |
| Social Sciences | 4 | 2.8% |
| Engineering | 21 | 14.5% |
| Multidisciplinary Studies | 0 | 0.0% |
| Science & Technology | 18 | 12.4% |
| Business | 12 | 8.3% |
| Education | 23 | 15.9% |
| Literature & Languages | 14 | 9.7% |
| Liberal Arts & History | 2 | 1.4% |
| Visual & Performing Arts | 0 | 0.0% |
| Communications | 3 | 2.1% |
| Arts & Humanities | 19 | 13.1% |
| Total | 145 | 100.0% |
Transportation & Commute in Mathiston
Vehicle Availability by Sex in Mathiston
The most prevalent vehicle ownership categories in Mathiston are males with 2 vehicles (101, accounting for 50.5%) and females with 2 vehicles (66, making up 73.7%).
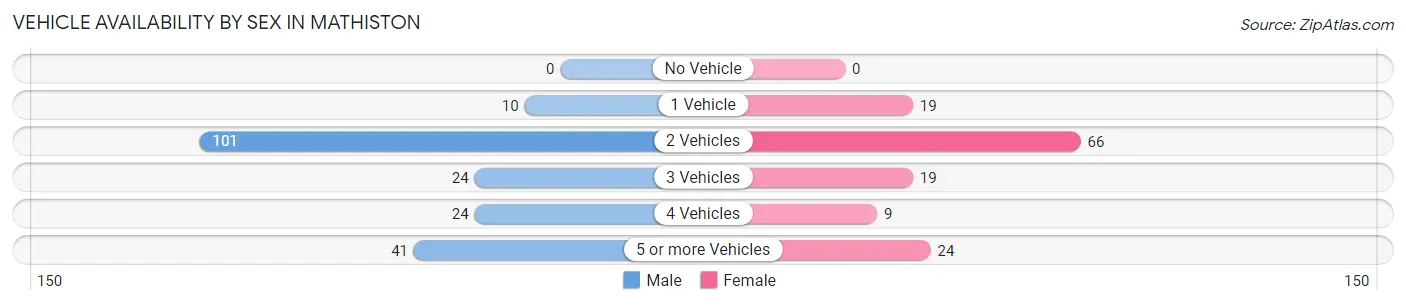
| Vehicles Available | Male | Female |
| No Vehicle | 0 (0.0%) | 0 (0.0%) |
| 1 Vehicle | 10 (5.0%) | 19 (13.9%) |
| 2 Vehicles | 101 (50.5%) | 66 (48.2%) |
| 3 Vehicles | 24 (12.0%) | 19 (13.9%) |
| 4 Vehicles | 24 (12.0%) | 9 (6.6%) |
| 5 or more Vehicles | 41 (20.5%) | 24 (17.5%) |
| Total | 200 (100.0%) | 137 (100.0%) |
Commute Time in Mathiston
The most frequently occuring commute durations in Mathiston are 25 to 29 minutes (59 commuters, 20.3%), 20 to 24 minutes (46 commuters, 15.9%), and 10 to 14 minutes (40 commuters, 13.8%).
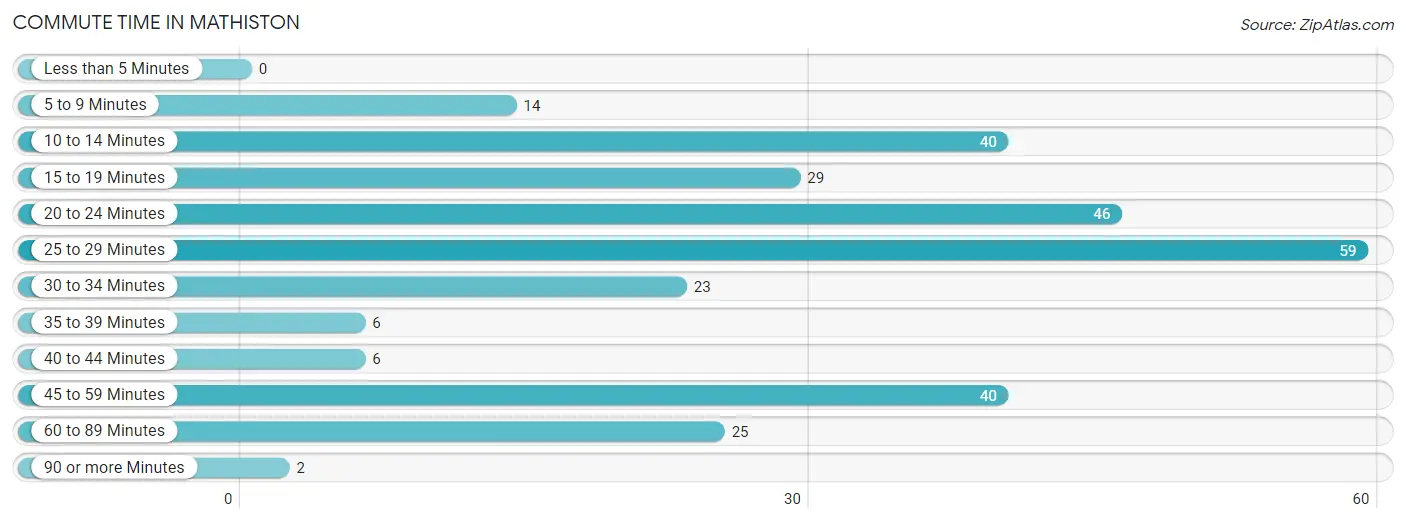
| Commute Time | # Commuters | % Commuters |
| Less than 5 Minutes | 0 | 0.0% |
| 5 to 9 Minutes | 14 | 4.8% |
| 10 to 14 Minutes | 40 | 13.8% |
| 15 to 19 Minutes | 29 | 10.0% |
| 20 to 24 Minutes | 46 | 15.9% |
| 25 to 29 Minutes | 59 | 20.3% |
| 30 to 34 Minutes | 23 | 7.9% |
| 35 to 39 Minutes | 6 | 2.1% |
| 40 to 44 Minutes | 6 | 2.1% |
| 45 to 59 Minutes | 40 | 13.8% |
| 60 to 89 Minutes | 25 | 8.6% |
| 90 or more Minutes | 2 | 0.7% |
Commute Time by Sex in Mathiston
The most common commute times in Mathiston are 25 to 29 minutes (43 commuters, 24.7%) for males and 10 to 14 minutes (38 commuters, 32.8%) for females.
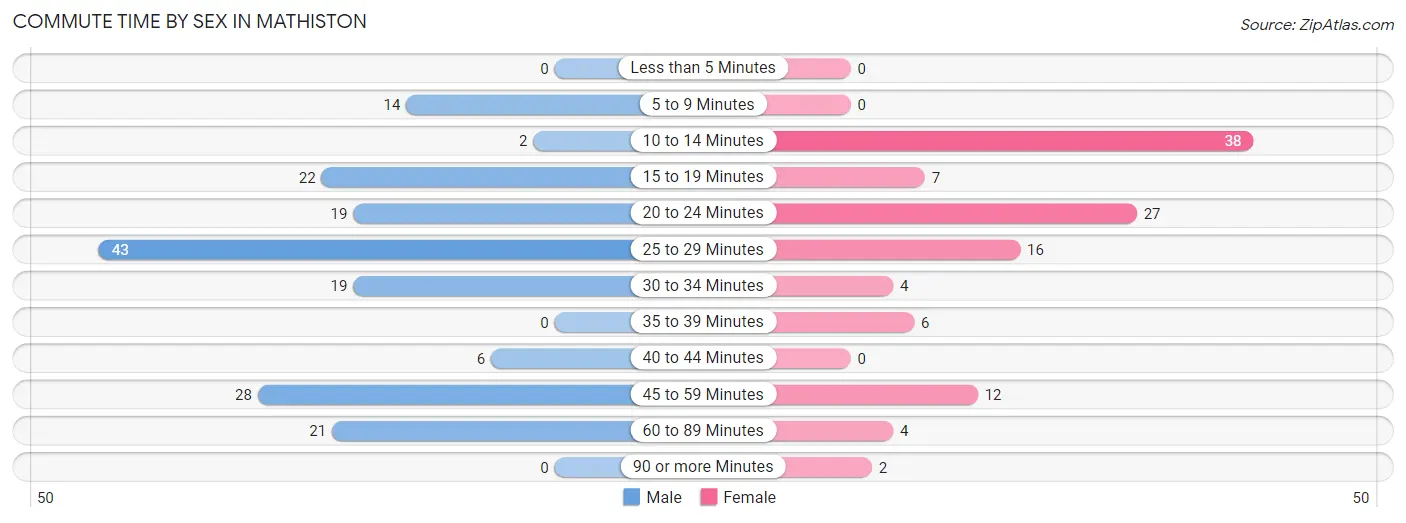
| Commute Time | Male | Female |
| Less than 5 Minutes | 0 (0.0%) | 0 (0.0%) |
| 5 to 9 Minutes | 14 (8.1%) | 0 (0.0%) |
| 10 to 14 Minutes | 2 (1.1%) | 38 (32.8%) |
| 15 to 19 Minutes | 22 (12.6%) | 7 (6.0%) |
| 20 to 24 Minutes | 19 (10.9%) | 27 (23.3%) |
| 25 to 29 Minutes | 43 (24.7%) | 16 (13.8%) |
| 30 to 34 Minutes | 19 (10.9%) | 4 (3.5%) |
| 35 to 39 Minutes | 0 (0.0%) | 6 (5.2%) |
| 40 to 44 Minutes | 6 (3.5%) | 0 (0.0%) |
| 45 to 59 Minutes | 28 (16.1%) | 12 (10.3%) |
| 60 to 89 Minutes | 21 (12.1%) | 4 (3.5%) |
| 90 or more Minutes | 0 (0.0%) | 2 (1.7%) |
Time of Departure to Work by Sex in Mathiston
The most frequent times of departure to work in Mathiston are 6:30 AM to 6:59 AM (47, 27.0%) for males and 6:30 AM to 6:59 AM (44, 37.9%) for females.
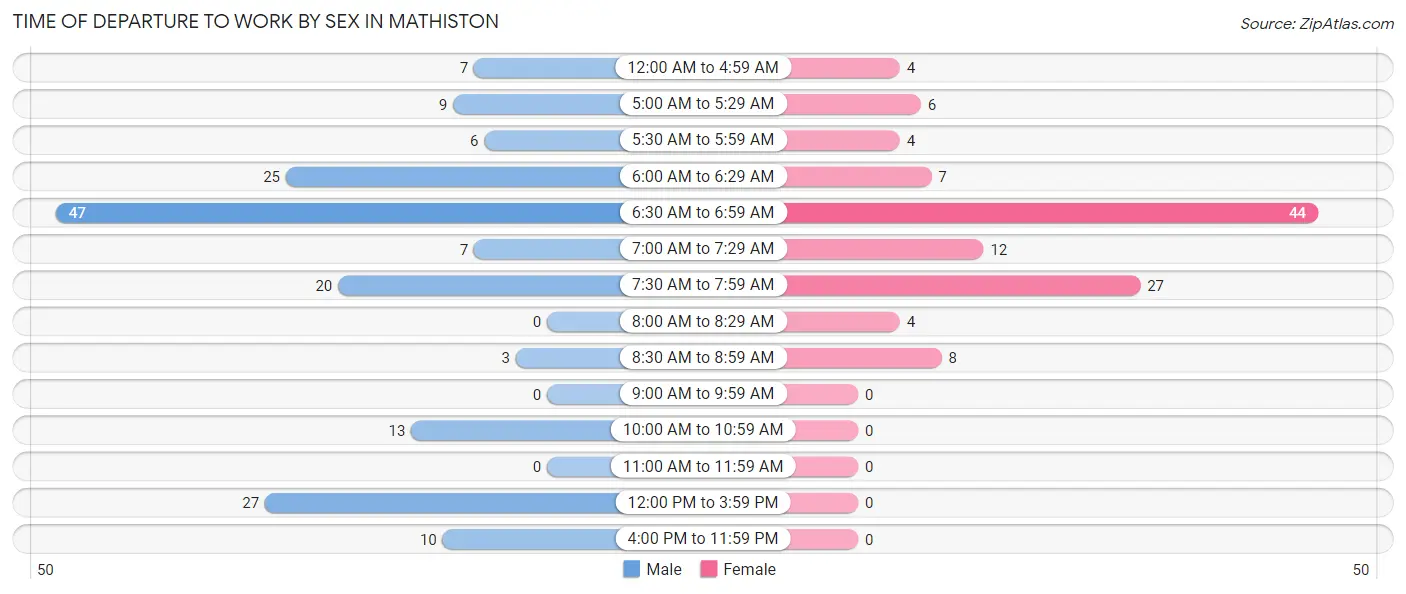
| Time of Departure | Male | Female |
| 12:00 AM to 4:59 AM | 7 (4.0%) | 4 (3.5%) |
| 5:00 AM to 5:29 AM | 9 (5.2%) | 6 (5.2%) |
| 5:30 AM to 5:59 AM | 6 (3.5%) | 4 (3.5%) |
| 6:00 AM to 6:29 AM | 25 (14.4%) | 7 (6.0%) |
| 6:30 AM to 6:59 AM | 47 (27.0%) | 44 (37.9%) |
| 7:00 AM to 7:29 AM | 7 (4.0%) | 12 (10.3%) |
| 7:30 AM to 7:59 AM | 20 (11.5%) | 27 (23.3%) |
| 8:00 AM to 8:29 AM | 0 (0.0%) | 4 (3.5%) |
| 8:30 AM to 8:59 AM | 3 (1.7%) | 8 (6.9%) |
| 9:00 AM to 9:59 AM | 0 (0.0%) | 0 (0.0%) |
| 10:00 AM to 10:59 AM | 13 (7.5%) | 0 (0.0%) |
| 11:00 AM to 11:59 AM | 0 (0.0%) | 0 (0.0%) |
| 12:00 PM to 3:59 PM | 27 (15.5%) | 0 (0.0%) |
| 4:00 PM to 11:59 PM | 10 (5.8%) | 0 (0.0%) |
| Total | 174 (100.0%) | 116 (100.0%) |
Housing Occupancy in Mathiston
Occupancy by Ownership in Mathiston
Of the total 349 dwellings in Mathiston, owner-occupied units account for 258 (73.9%), while renter-occupied units make up 91 (26.1%).
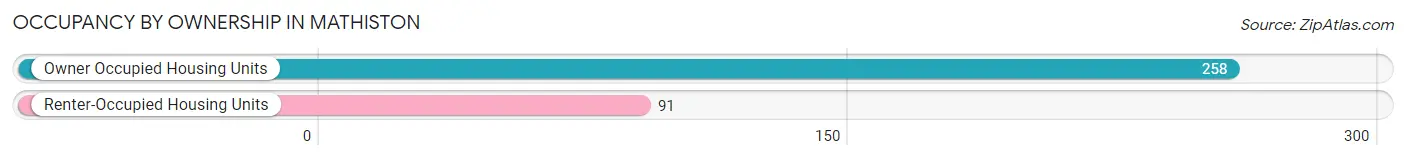
| Occupancy | # Housing Units | % Housing Units |
| Owner Occupied Housing Units | 258 | 73.9% |
| Renter-Occupied Housing Units | 91 | 26.1% |
| Total Occupied Housing Units | 349 | 100.0% |
Occupancy by Household Size in Mathiston
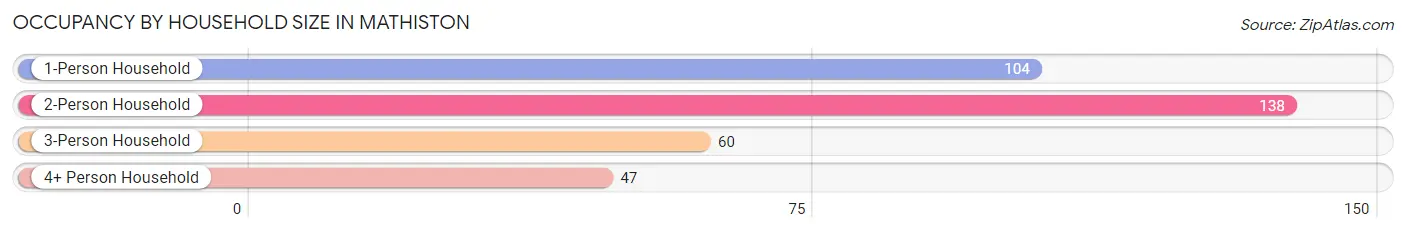
| Household Size | # Housing Units | % Housing Units |
| 1-Person Household | 104 | 29.8% |
| 2-Person Household | 138 | 39.5% |
| 3-Person Household | 60 | 17.2% |
| 4+ Person Household | 47 | 13.5% |
| Total Housing Units | 349 | 100.0% |
Occupancy by Ownership by Household Size in Mathiston
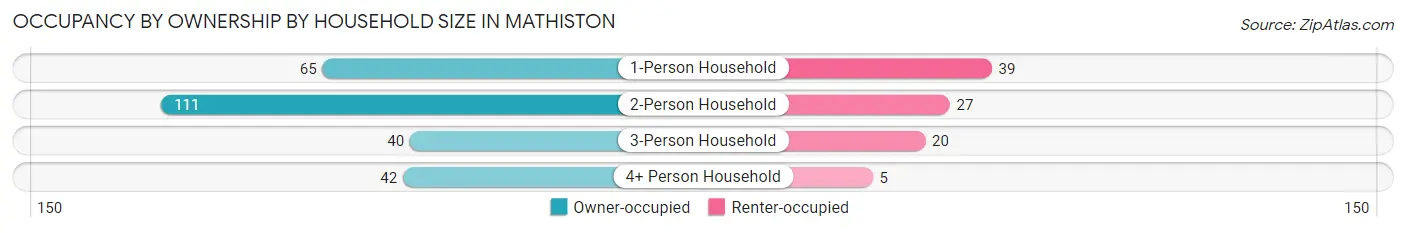
| Household Size | Owner-occupied | Renter-occupied |
| 1-Person Household | 65 (62.5%) | 39 (37.5%) |
| 2-Person Household | 111 (80.4%) | 27 (19.6%) |
| 3-Person Household | 40 (66.7%) | 20 (33.3%) |
| 4+ Person Household | 42 (89.4%) | 5 (10.6%) |
| Total Housing Units | 258 (73.9%) | 91 (26.1%) |
Occupancy by Educational Attainment in Mathiston
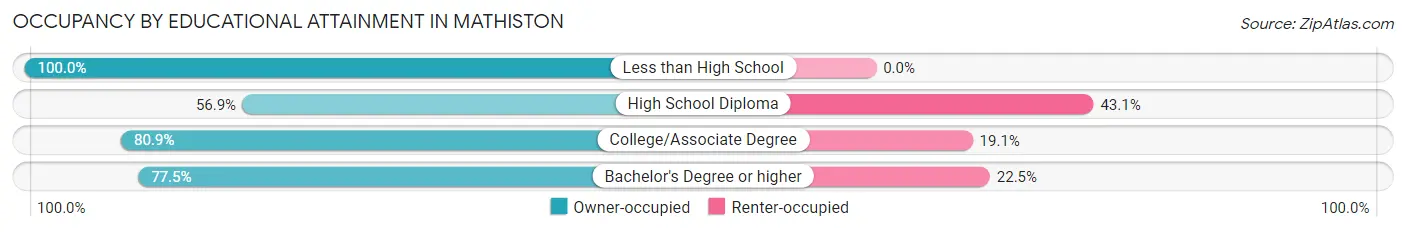
| Household Size | Owner-occupied | Renter-occupied |
| Less than High School | 40 (100.0%) | 0 (0.0%) |
| High School Diploma | 70 (56.9%) | 53 (43.1%) |
| College/Associate Degree | 93 (80.9%) | 22 (19.1%) |
| Bachelor's Degree or higher | 55 (77.5%) | 16 (22.5%) |
Occupancy by Age of Householder in Mathiston
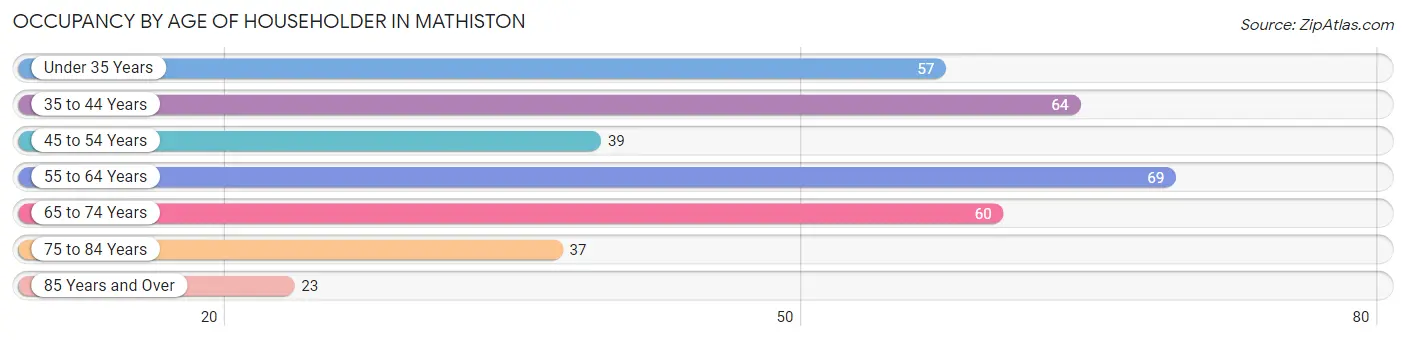
| Age Bracket | # Households | % Households |
| Under 35 Years | 57 | 16.3% |
| 35 to 44 Years | 64 | 18.3% |
| 45 to 54 Years | 39 | 11.2% |
| 55 to 64 Years | 69 | 19.8% |
| 65 to 74 Years | 60 | 17.2% |
| 75 to 84 Years | 37 | 10.6% |
| 85 Years and Over | 23 | 6.6% |
| Total | 349 | 100.0% |
Housing Finances in Mathiston
Median Income by Occupancy in Mathiston
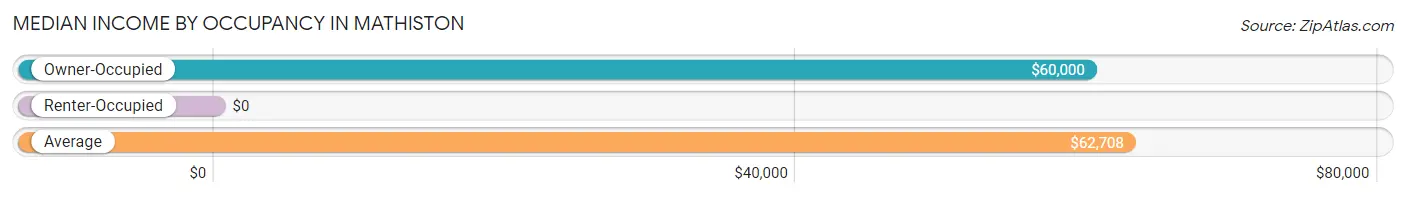
| Occupancy Type | # Households | Median Income |
| Owner-Occupied | 258 (73.9%) | $60,000 |
| Renter-Occupied | 91 (26.1%) | $0 |
| Average | 349 (100.0%) | $62,708 |
Occupancy by Householder Income Bracket in Mathiston
| Income Bracket | Owner-occupied | Renter-occupied |
| Less than $5,000 | 3 (1.2%) | 11 (12.1%) |
| $5,000 to $9,999 | 0 (0.0%) | 0 (0.0%) |
| $10,000 to $14,999 | 20 (7.7%) | 4 (4.4%) |
| $15,000 to $19,999 | 6 (2.3%) | 16 (17.6%) |
| $20,000 to $24,999 | 12 (4.6%) | 7 (7.7%) |
| $25,000 to $34,999 | 13 (5.0%) | 4 (4.4%) |
| $35,000 to $49,999 | 48 (18.6%) | 0 (0.0%) |
| $50,000 to $74,999 | 43 (16.7%) | 31 (34.1%) |
| $75,000 to $99,999 | 32 (12.4%) | 2 (2.2%) |
| $100,000 to $149,999 | 39 (15.1%) | 11 (12.1%) |
| $150,000 or more | 42 (16.3%) | 5 (5.5%) |
| Total | 258 (100.0%) | 91 (100.0%) |
Monthly Housing Cost Tiers in Mathiston
| Monthly Cost | Owner-occupied | Renter-occupied |
| Less than $300 | 60 (23.3%) | 4 (4.4%) |
| $300 to $499 | 64 (24.8%) | 27 (29.7%) |
| $500 to $799 | 44 (17.1%) | 23 (25.3%) |
| $800 to $999 | 22 (8.5%) | 30 (33.0%) |
| $1,000 to $1,499 | 45 (17.4%) | 5 (5.5%) |
| $1,500 to $1,999 | 21 (8.1%) | 0 (0.0%) |
| $2,000 to $2,499 | 2 (0.8%) | 0 (0.0%) |
| $2,500 to $2,999 | 0 (0.0%) | 0 (0.0%) |
| $3,000 or more | 0 (0.0%) | 0 (0.0%) |
| Total | 258 (100.0%) | 91 (100.0%) |
Physical Housing Characteristics in Mathiston
Housing Structures in Mathiston
| Structure Type | # Housing Units | % Housing Units |
| Single Unit, Detached | 288 | 82.5% |
| Single Unit, Attached | 0 | 0.0% |
| 2 Unit Apartments | 4 | 1.1% |
| 3 or 4 Unit Apartments | 10 | 2.9% |
| 5 to 9 Unit Apartments | 9 | 2.6% |
| 10 or more Apartments | 17 | 4.9% |
| Mobile Home / Other | 21 | 6.0% |
| Total | 349 | 100.0% |
Housing Structures by Occupancy in Mathiston
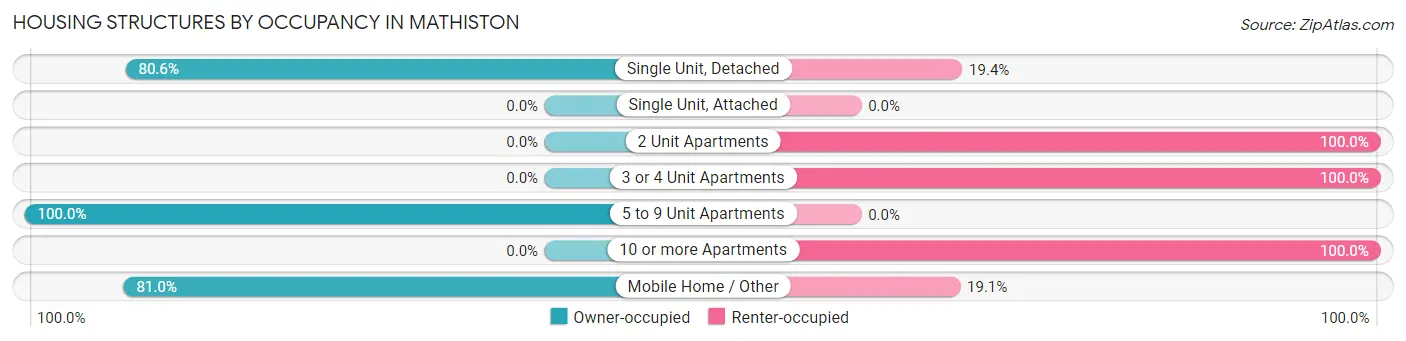
| Structure Type | Owner-occupied | Renter-occupied |
| Single Unit, Detached | 232 (80.6%) | 56 (19.4%) |
| Single Unit, Attached | 0 (0.0%) | 0 (0.0%) |
| 2 Unit Apartments | 0 (0.0%) | 4 (100.0%) |
| 3 or 4 Unit Apartments | 0 (0.0%) | 10 (100.0%) |
| 5 to 9 Unit Apartments | 9 (100.0%) | 0 (0.0%) |
| 10 or more Apartments | 0 (0.0%) | 17 (100.0%) |
| Mobile Home / Other | 17 (80.9%) | 4 (19.1%) |
| Total | 258 (73.9%) | 91 (26.1%) |
Housing Structures by Number of Rooms in Mathiston
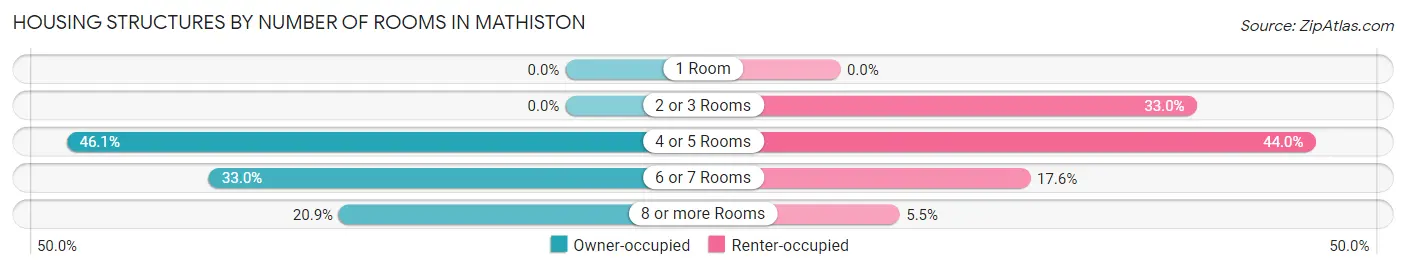
| Number of Rooms | Owner-occupied | Renter-occupied |
| 1 Room | 0 (0.0%) | 0 (0.0%) |
| 2 or 3 Rooms | 0 (0.0%) | 30 (33.0%) |
| 4 or 5 Rooms | 119 (46.1%) | 40 (44.0%) |
| 6 or 7 Rooms | 85 (33.0%) | 16 (17.6%) |
| 8 or more Rooms | 54 (20.9%) | 5 (5.5%) |
| Total | 258 (100.0%) | 91 (100.0%) |
Housing Structure by Heating Type in Mathiston
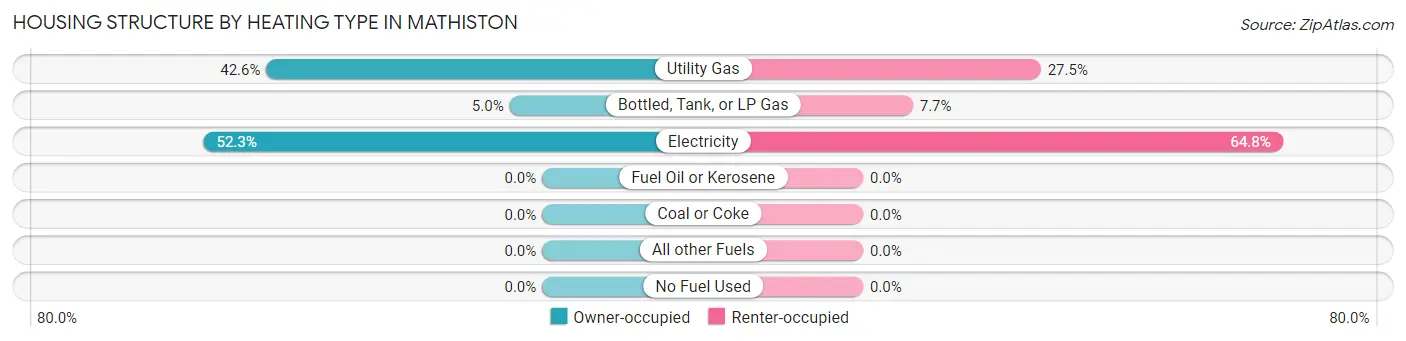
| Heating Type | Owner-occupied | Renter-occupied |
| Utility Gas | 110 (42.6%) | 25 (27.5%) |
| Bottled, Tank, or LP Gas | 13 (5.0%) | 7 (7.7%) |
| Electricity | 135 (52.3%) | 59 (64.8%) |
| Fuel Oil or Kerosene | 0 (0.0%) | 0 (0.0%) |
| Coal or Coke | 0 (0.0%) | 0 (0.0%) |
| All other Fuels | 0 (0.0%) | 0 (0.0%) |
| No Fuel Used | 0 (0.0%) | 0 (0.0%) |
| Total | 258 (100.0%) | 91 (100.0%) |
Household Vehicle Usage in Mathiston
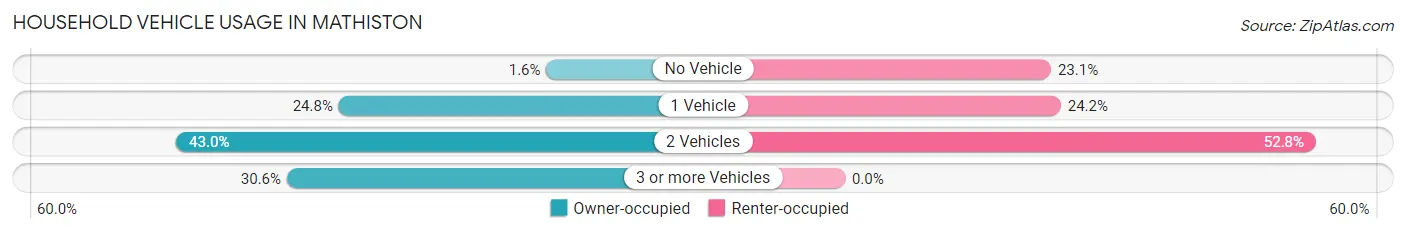
| Vehicles per Household | Owner-occupied | Renter-occupied |
| No Vehicle | 4 (1.5%) | 21 (23.1%) |
| 1 Vehicle | 64 (24.8%) | 22 (24.2%) |
| 2 Vehicles | 111 (43.0%) | 48 (52.7%) |
| 3 or more Vehicles | 79 (30.6%) | 0 (0.0%) |
| Total | 258 (100.0%) | 91 (100.0%) |
Real Estate & Mortgages in Mathiston
Real Estate and Mortgage Overview in Mathiston
| Characteristic | Without Mortgage | With Mortgage |
| Housing Units | 161 | 97 |
| Median Property Value | $94,000 | $208,300 |
| Median Household Income | $47,083 | $12 |
| Monthly Housing Costs | $359 | $0 |
| Real Estate Taxes | $800 | $3 |
Property Value by Mortgage Status in Mathiston
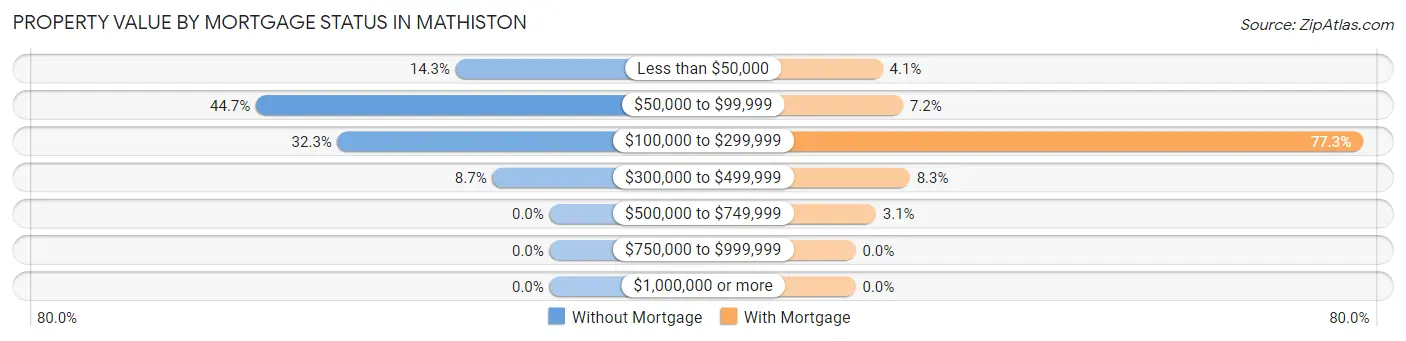
| Property Value | Without Mortgage | With Mortgage |
| Less than $50,000 | 23 (14.3%) | 4 (4.1%) |
| $50,000 to $99,999 | 72 (44.7%) | 7 (7.2%) |
| $100,000 to $299,999 | 52 (32.3%) | 75 (77.3%) |
| $300,000 to $499,999 | 14 (8.7%) | 8 (8.3%) |
| $500,000 to $749,999 | 0 (0.0%) | 3 (3.1%) |
| $750,000 to $999,999 | 0 (0.0%) | 0 (0.0%) |
| $1,000,000 or more | 0 (0.0%) | 0 (0.0%) |
| Total | 161 (100.0%) | 97 (100.0%) |
Household Income by Mortgage Status in Mathiston
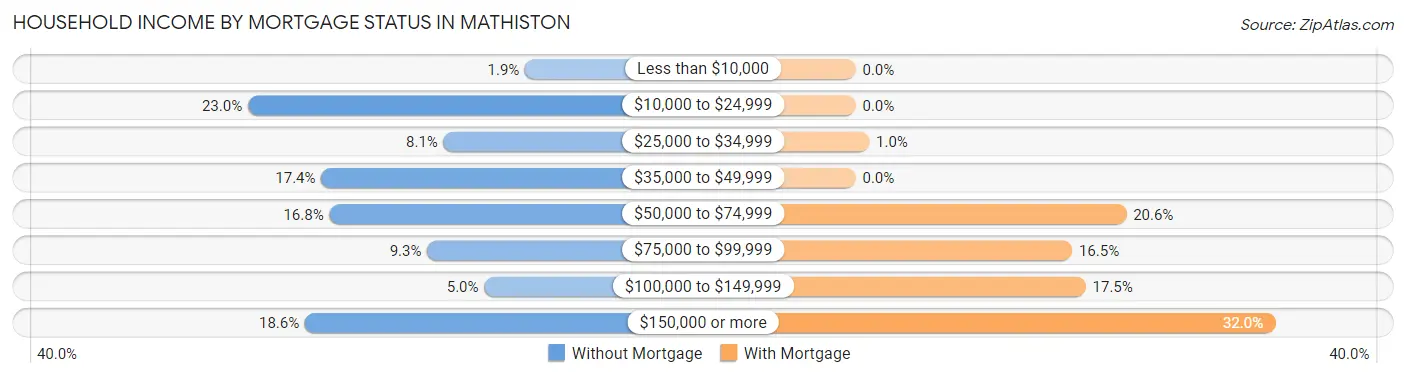
| Household Income | Without Mortgage | With Mortgage |
| Less than $10,000 | 3 (1.9%) | 0 (0.0%) |
| $10,000 to $24,999 | 37 (23.0%) | 0 (0.0%) |
| $25,000 to $34,999 | 13 (8.1%) | 1 (1.0%) |
| $35,000 to $49,999 | 28 (17.4%) | 0 (0.0%) |
| $50,000 to $74,999 | 27 (16.8%) | 20 (20.6%) |
| $75,000 to $99,999 | 15 (9.3%) | 16 (16.5%) |
| $100,000 to $149,999 | 8 (5.0%) | 17 (17.5%) |
| $150,000 or more | 30 (18.6%) | 31 (32.0%) |
| Total | 161 (100.0%) | 97 (100.0%) |
Property Value to Household Income Ratio in Mathiston
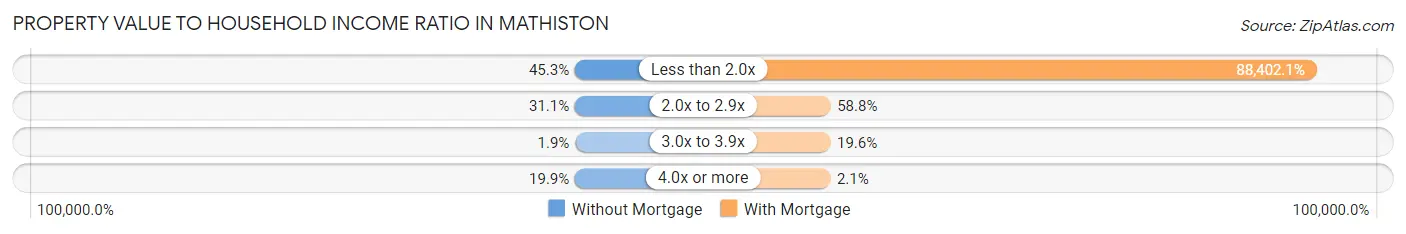
| Value-to-Income Ratio | Without Mortgage | With Mortgage |
| Less than 2.0x | 73 (45.3%) | 85,750 (88,402.1%) |
| 2.0x to 2.9x | 50 (31.1%) | 57 (58.8%) |
| 3.0x to 3.9x | 3 (1.9%) | 19 (19.6%) |
| 4.0x or more | 32 (19.9%) | 2 (2.1%) |
| Total | 161 (100.0%) | 97 (100.0%) |
Real Estate Taxes by Mortgage Status in Mathiston
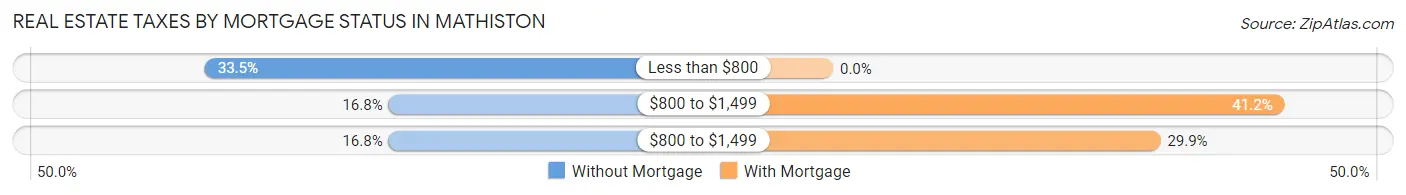
| Property Taxes | Without Mortgage | With Mortgage |
| Less than $800 | 54 (33.5%) | 0 (0.0%) |
| $800 to $1,499 | 27 (16.8%) | 40 (41.2%) |
| $800 to $1,499 | 27 (16.8%) | 29 (29.9%) |
| Total | 161 (100.0%) | 97 (100.0%) |
Health & Disability in Mathiston
Health Insurance Coverage by Age in Mathiston
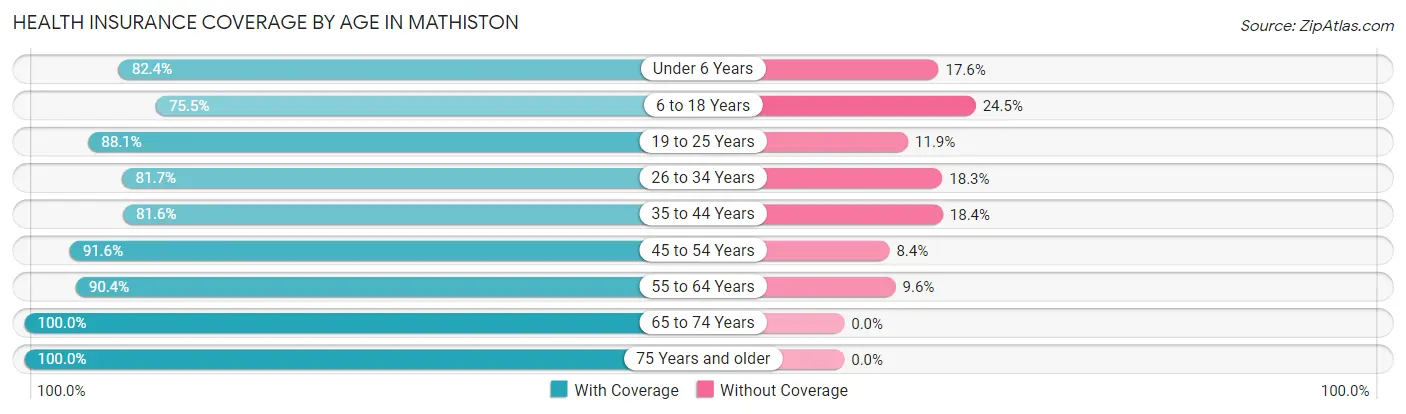
| Age Bracket | With Coverage | Without Coverage |
| Under 6 Years | 61 (82.4%) | 13 (17.6%) |
| 6 to 18 Years | 77 (75.5%) | 25 (24.5%) |
| 19 to 25 Years | 37 (88.1%) | 5 (11.9%) |
| 26 to 34 Years | 67 (81.7%) | 15 (18.3%) |
| 35 to 44 Years | 111 (81.6%) | 25 (18.4%) |
| 45 to 54 Years | 76 (91.6%) | 7 (8.4%) |
| 55 to 64 Years | 85 (90.4%) | 9 (9.6%) |
| 65 to 74 Years | 107 (100.0%) | 0 (0.0%) |
| 75 Years and older | 71 (100.0%) | 0 (0.0%) |
| Total | 692 (87.5%) | 99 (12.5%) |
Health Insurance Coverage by Citizenship Status in Mathiston
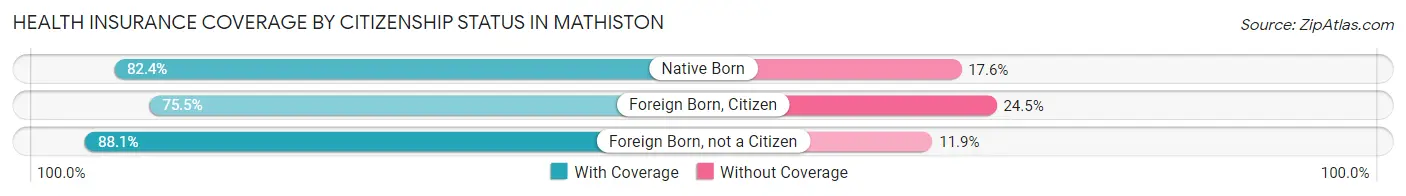
| Citizenship Status | With Coverage | Without Coverage |
| Native Born | 61 (82.4%) | 13 (17.6%) |
| Foreign Born, Citizen | 77 (75.5%) | 25 (24.5%) |
| Foreign Born, not a Citizen | 37 (88.1%) | 5 (11.9%) |
Health Insurance Coverage by Household Income in Mathiston
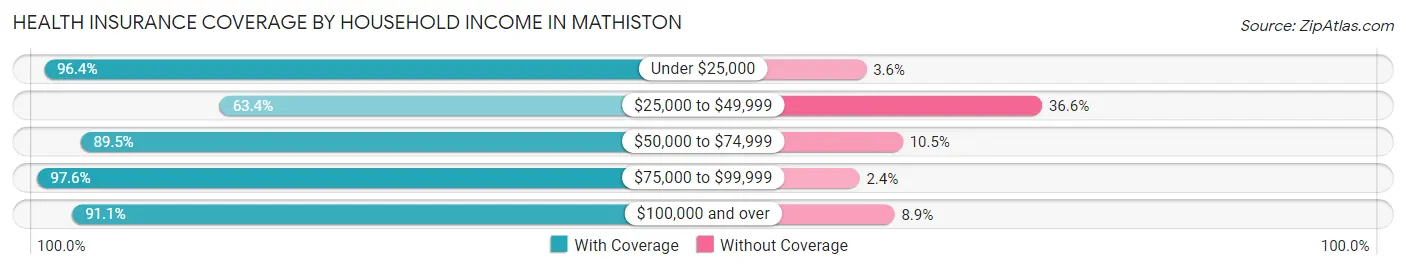
| Household Income | With Coverage | Without Coverage |
| Under $25,000 | 106 (96.4%) | 4 (3.6%) |
| $25,000 to $49,999 | 85 (63.4%) | 49 (36.6%) |
| $50,000 to $74,999 | 154 (89.5%) | 18 (10.5%) |
| $75,000 to $99,999 | 82 (97.6%) | 2 (2.4%) |
| $100,000 and over | 265 (91.1%) | 26 (8.9%) |
Public vs Private Health Insurance Coverage by Age in Mathiston
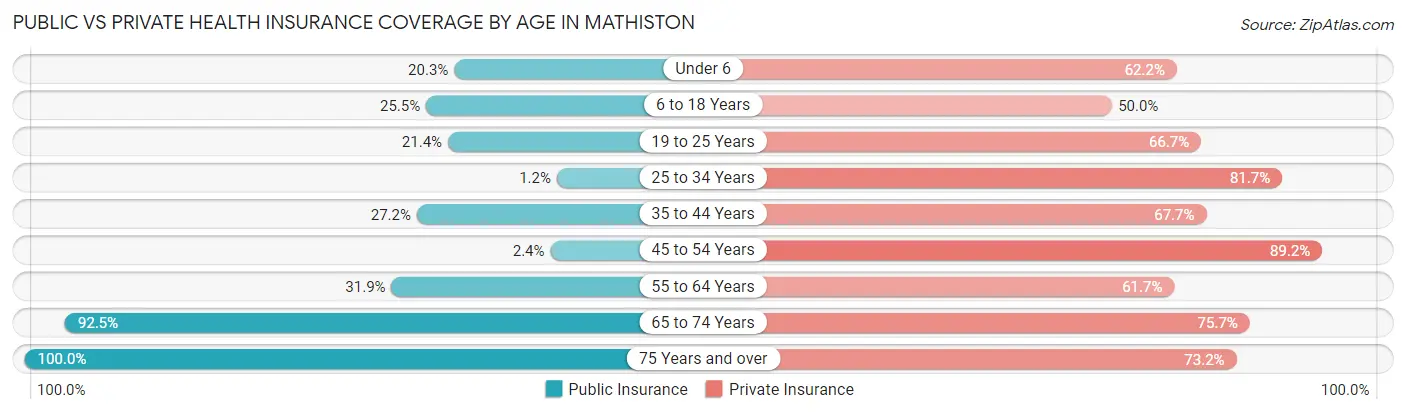
| Age Bracket | Public Insurance | Private Insurance |
| Under 6 | 15 (20.3%) | 46 (62.2%) |
| 6 to 18 Years | 26 (25.5%) | 51 (50.0%) |
| 19 to 25 Years | 9 (21.4%) | 28 (66.7%) |
| 25 to 34 Years | 1 (1.2%) | 67 (81.7%) |
| 35 to 44 Years | 37 (27.2%) | 92 (67.6%) |
| 45 to 54 Years | 2 (2.4%) | 74 (89.2%) |
| 55 to 64 Years | 30 (31.9%) | 58 (61.7%) |
| 65 to 74 Years | 99 (92.5%) | 81 (75.7%) |
| 75 Years and over | 71 (100.0%) | 52 (73.2%) |
| Total | 290 (36.7%) | 549 (69.4%) |
Disability Status by Sex by Age in Mathiston
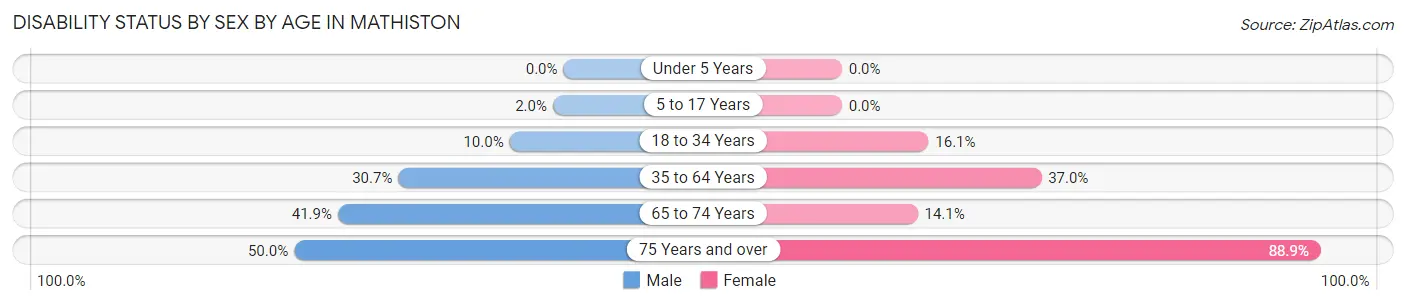
| Age Bracket | Male | Female |
| Under 5 Years | 0 (0.0%) | 0 (0.0%) |
| 5 to 17 Years | 1 (2.0%) | 0 (0.0%) |
| 18 to 34 Years | 7 (10.0%) | 9 (16.1%) |
| 35 to 64 Years | 57 (30.6%) | 47 (37.0%) |
| 65 to 74 Years | 18 (41.9%) | 9 (14.1%) |
| 75 Years and over | 4 (50.0%) | 56 (88.9%) |
Disability Class by Sex by Age in Mathiston
Disability Class: Hearing Difficulty
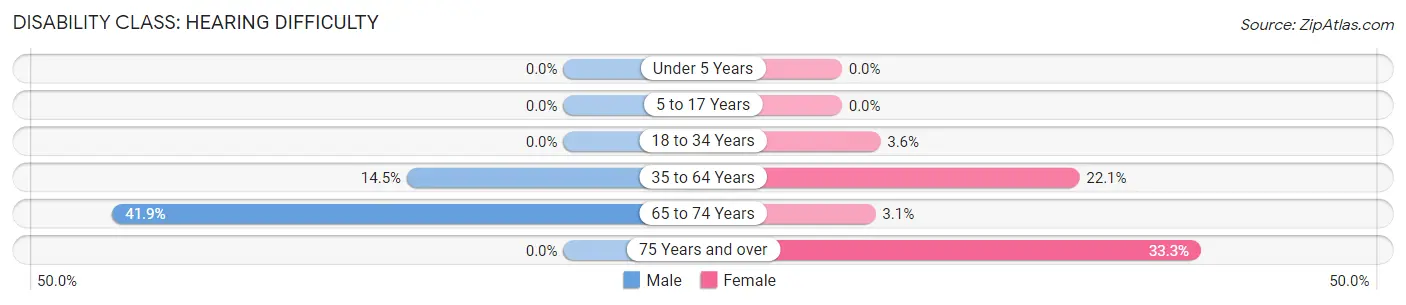
| Age Bracket | Male | Female |
| Under 5 Years | 0 (0.0%) | 0 (0.0%) |
| 5 to 17 Years | 0 (0.0%) | 0 (0.0%) |
| 18 to 34 Years | 0 (0.0%) | 2 (3.6%) |
| 35 to 64 Years | 27 (14.5%) | 28 (22.1%) |
| 65 to 74 Years | 18 (41.9%) | 2 (3.1%) |
| 75 Years and over | 0 (0.0%) | 21 (33.3%) |
Disability Class: Vision Difficulty
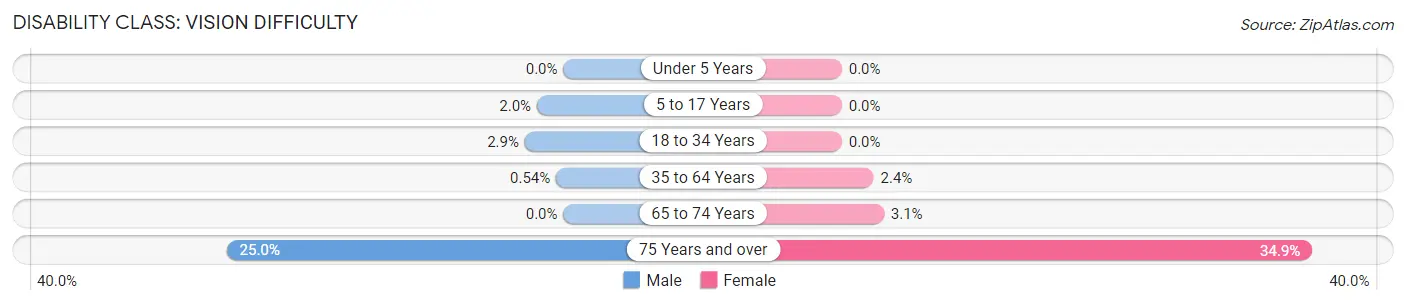
| Age Bracket | Male | Female |
| Under 5 Years | 0 (0.0%) | 0 (0.0%) |
| 5 to 17 Years | 1 (2.0%) | 0 (0.0%) |
| 18 to 34 Years | 2 (2.9%) | 0 (0.0%) |
| 35 to 64 Years | 1 (0.5%) | 3 (2.4%) |
| 65 to 74 Years | 0 (0.0%) | 2 (3.1%) |
| 75 Years and over | 2 (25.0%) | 22 (34.9%) |
Disability Class: Cognitive Difficulty
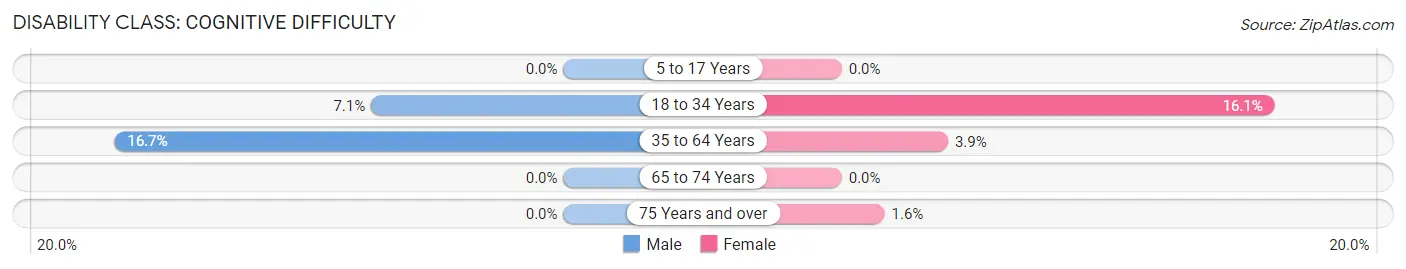
| Age Bracket | Male | Female |
| 5 to 17 Years | 0 (0.0%) | 0 (0.0%) |
| 18 to 34 Years | 5 (7.1%) | 9 (16.1%) |
| 35 to 64 Years | 31 (16.7%) | 5 (3.9%) |
| 65 to 74 Years | 0 (0.0%) | 0 (0.0%) |
| 75 Years and over | 0 (0.0%) | 1 (1.6%) |
Disability Class: Ambulatory Difficulty
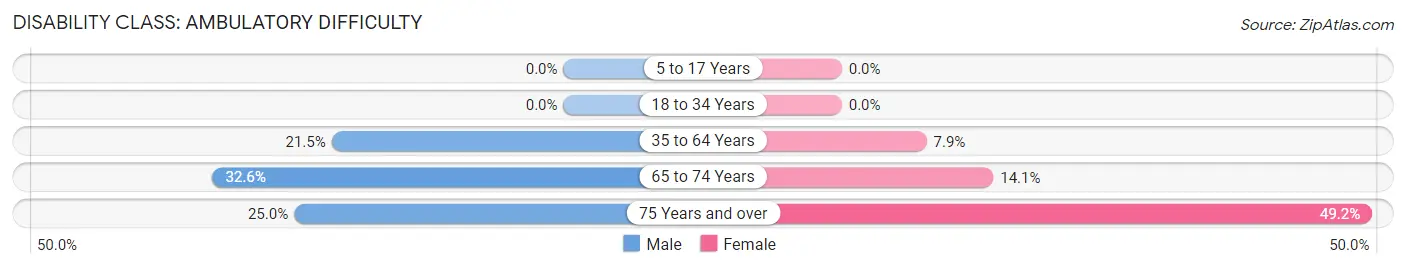
| Age Bracket | Male | Female |
| 5 to 17 Years | 0 (0.0%) | 0 (0.0%) |
| 18 to 34 Years | 0 (0.0%) | 0 (0.0%) |
| 35 to 64 Years | 40 (21.5%) | 10 (7.9%) |
| 65 to 74 Years | 14 (32.6%) | 9 (14.1%) |
| 75 Years and over | 2 (25.0%) | 31 (49.2%) |
Disability Class: Self-Care Difficulty
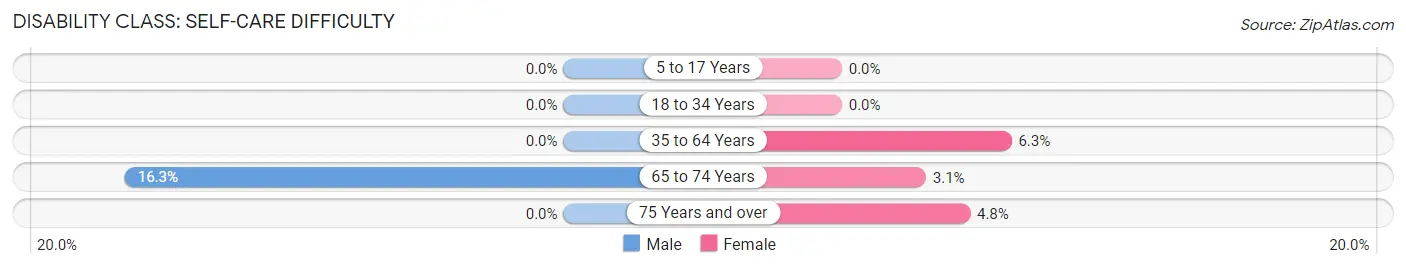
| Age Bracket | Male | Female |
| 5 to 17 Years | 0 (0.0%) | 0 (0.0%) |
| 18 to 34 Years | 0 (0.0%) | 0 (0.0%) |
| 35 to 64 Years | 0 (0.0%) | 8 (6.3%) |
| 65 to 74 Years | 7 (16.3%) | 2 (3.1%) |
| 75 Years and over | 0 (0.0%) | 3 (4.8%) |
Technology Access in Mathiston
Computing Device Access in Mathiston
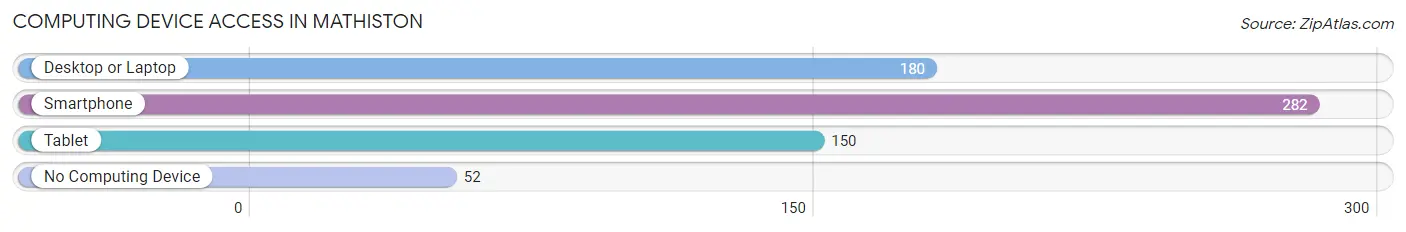
| Device Type | # Households | % Households |
| Desktop or Laptop | 180 | 51.6% |
| Smartphone | 282 | 80.8% |
| Tablet | 150 | 43.0% |
| No Computing Device | 52 | 14.9% |
| Total | 349 | 100.0% |
Internet Access in Mathiston
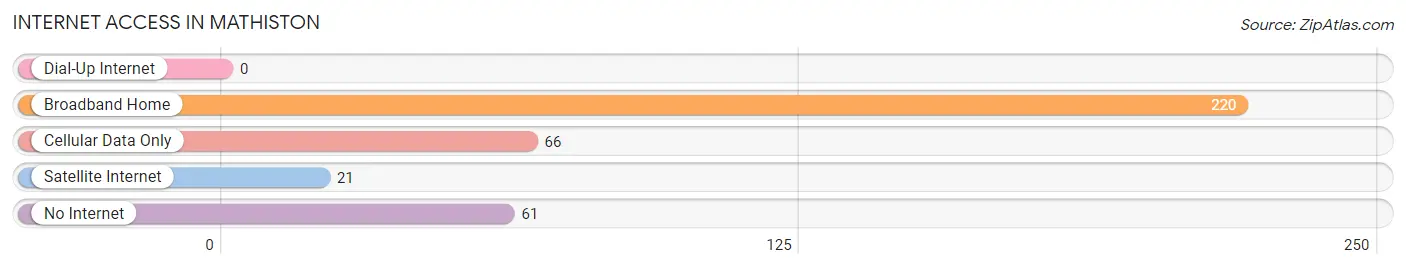
| Internet Type | # Households | % Households |
| Dial-Up Internet | 0 | 0.0% |
| Broadband Home | 220 | 63.0% |
| Cellular Data Only | 66 | 18.9% |
| Satellite Internet | 21 | 6.0% |
| No Internet | 61 | 17.5% |
| Total | 349 | 100.0% |
Mathiston Summary
History
Mathiston, Mississippi is a small town located in Choctaw County, Mississippi. It is situated in the northeastern part of the state, about 20 miles from the Alabama border. The town was founded in 1837 and was originally known as “Mathiston Station”. The name was changed to Mathiston in 1845.
The town was originally a trading post for the Choctaw Indians, who had been living in the area for centuries. The town was also a stop on the Mobile and Ohio Railroad, which ran through the area in the late 1800s. The railroad brought new settlers to the area, and the town began to grow.
In the early 1900s, Mathiston was a thriving agricultural community. Cotton was the main crop, and the town had several cotton gins and warehouses. The town also had a sawmill, a gristmill, and a brickyard.
In the 1920s, Mathiston began to experience a decline in population. The Great Depression hit the town hard, and many of the businesses closed. The town’s population dropped to just over 500 by 1940.
In the 1950s, Mathiston began to experience a resurgence. The town was connected to the state highway system, and new businesses began to open. The town’s population grew to over 1,000 by 1960.
In the 1970s, Mathiston experienced another decline in population. The town’s economy was hurt by the decline of the cotton industry, and many of the businesses closed. The town’s population dropped to just over 500 by 1980.
In the 1990s, Mathiston began to experience a resurgence. The town was connected to the interstate highway system, and new businesses began to open. The town’s population grew to over 1,000 by 2000.
Geography
Mathiston is located in the northeastern part of Mississippi, about 20 miles from the Alabama border. The town is situated in the rolling hills of the Tombigbee River Valley. The town is surrounded by forests and farmland.
The town is located at the intersection of two major highways, US Highway 45 and Mississippi Highway 15. The town is also served by the Mathiston-Eupora Airport, which is located just outside of town.
The climate in Mathiston is humid subtropical, with hot, humid summers and mild winters. The average annual temperature is around 70 degrees Fahrenheit. The average annual precipitation is around 50 inches.
Economy
Mathiston’s economy is largely based on agriculture. The town is home to several farms, which produce cotton, soybeans, corn, and other crops. The town also has several lumber mills, which produce lumber for the local market.
The town is also home to several small businesses, including restaurants, retail stores, and service businesses. The town is also home to several manufacturing companies, which produce furniture, clothing, and other products.
Demographics
As of the 2010 census, Mathiston had a population of 1,092. The town is predominantly white, with African Americans making up about 20% of the population. The median household income is around $30,000.
The town is served by the Choctaw County School District, which includes two elementary schools, one middle school, and one high school. The town is also home to East Mississippi Community College, which offers a variety of degree and certificate programs.
Conclusion
Mathiston, Mississippi is a small town located in Choctaw County, Mississippi. The town was founded in 1837 and was originally known as “Mathiston Station”. The town’s economy is largely based on agriculture, and the town is also home to several small businesses and manufacturing companies. The town’s population is predominantly white, with African Americans making up about 20% of the population. The town is served by the Choctaw County School District, and is also home to East Mississippi Community College.
Common Questions
What is Per Capita Income in Mathiston?
Per Capita income in Mathiston is $33,109.
What is the Median Family Income in Mathiston?
Median Family Income in Mathiston is $74,330.
What is the Median Household income in Mathiston?
Median Household Income in Mathiston is $62,708.
What is Income or Wage Gap in Mathiston?
Income or Wage Gap in Mathiston is 24.0%.
Women in Mathiston earn 76.0 cents for every dollar earned by a man.
What is Family Income Deficit in Mathiston?
Family Income Deficit in Mathiston is $6,289.
Families that are below poverty line in Mathiston earn $6,289 less on average than the poverty threshold level.
What is Inequality or Gini Index in Mathiston?
Inequality or Gini Index in Mathiston is 0.42.
What is the Total Population of Mathiston?
Total Population of Mathiston is 807.
What is the Total Male Population of Mathiston?
Total Male Population of Mathiston is 402.
What is the Total Female Population of Mathiston?
Total Female Population of Mathiston is 405.
What is the Ratio of Males per 100 Females in Mathiston?
There are 99.26 Males per 100 Females in Mathiston.
What is the Ratio of Females per 100 Males in Mathiston?
There are 100.75 Females per 100 Males in Mathiston.
What is the Median Population Age in Mathiston?
Median Population Age in Mathiston is 43.4 Years.
What is the Average Family Size in Mathiston
Average Family Size in Mathiston is 2.7 People.
What is the Average Household Size in Mathiston
Average Household Size in Mathiston is 2.3 People.
How Large is the Labor Force in Mathiston?
There are 365 People in the Labor Forcein in Mathiston.
What is the Percentage of People in the Labor Force in Mathiston?
55.1% of People are in the Labor Force in Mathiston.
What is the Unemployment Rate in Mathiston?
Unemployment Rate in Mathiston is 5.2%.