Zip Codes with the Highest Percentage of Population Employed in Security & Protection in Mississippi
RELATED REPORTS & OPTIONS
Security & Protection
Mississippi
Compare Zip Codes
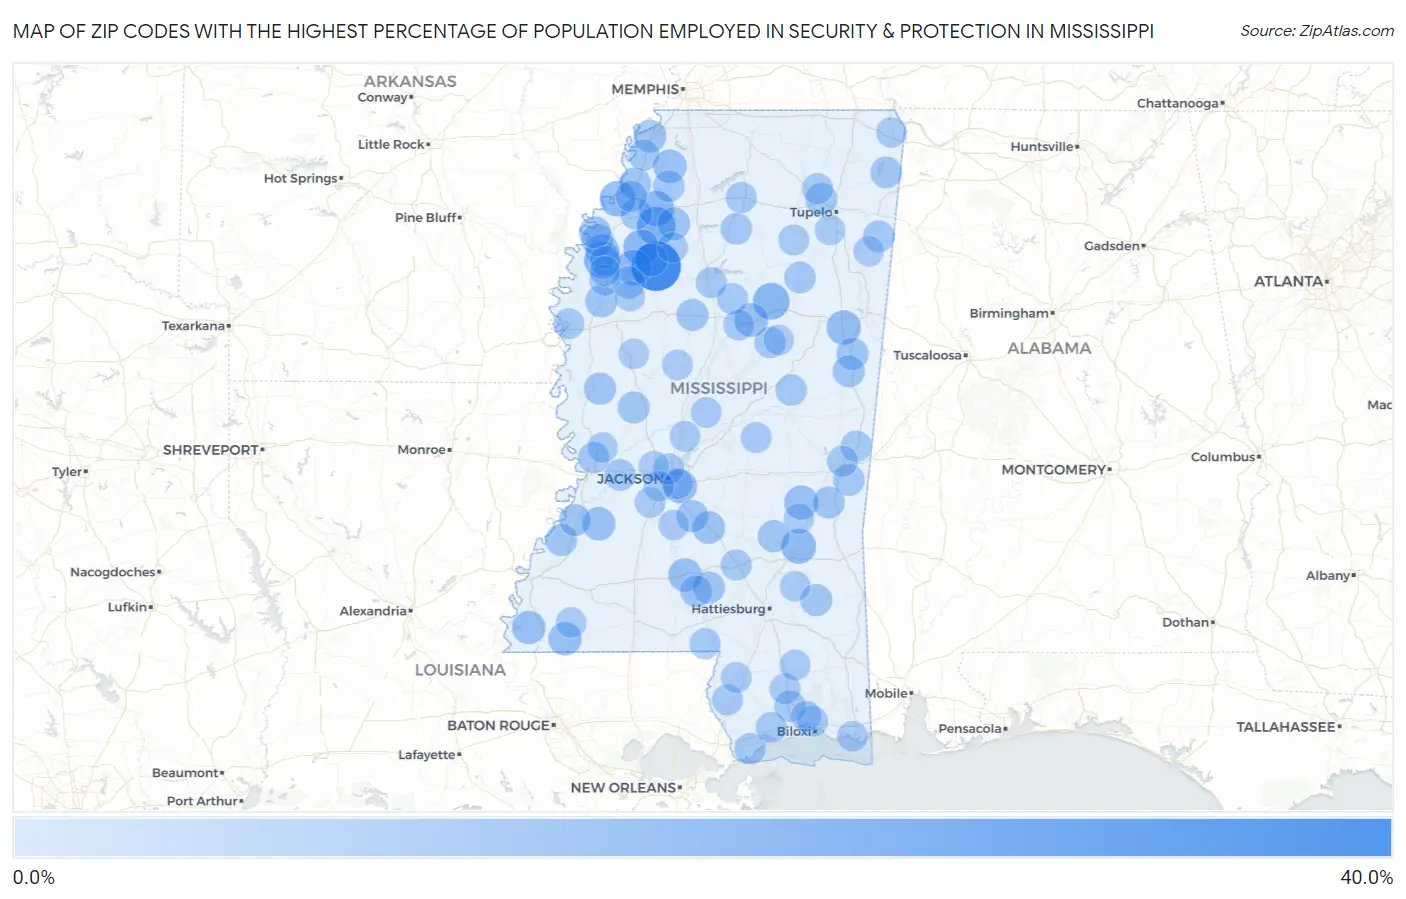
Map of Zip Codes with the Highest Percentage of Population Employed in Security & Protection in Mississippi
0.0%
40.0%
Zip Codes with the Highest Percentage of Population Employed in Security & Protection in Mississippi
| Zip Code | % Employed | vs State | vs National | |
| 1. | 38928 | 36.2% | 2.4%(+33.9)#1 | 2.1%(+34.1)#66 |
| 2. | 38643 | 17.3% | 2.4%(+14.9)#2 | 2.1%(+15.1)#278 |
| 3. | 38781 | 14.3% | 2.4%(+11.9)#3 | 2.1%(+12.1)#402 |
| 4. | 39771 | 13.9% | 2.4%(+11.5)#4 | 2.1%(+11.7)#425 |
| 5. | 38963 | 12.9% | 2.4%(+10.5)#5 | 2.1%(+10.7)#484 |
| 6. | 38646 | 12.5% | 2.4%(+10.2)#6 | 2.1%(+10.4)#502 |
| 7. | 38737 | 12.3% | 2.4%(+9.97)#7 | 2.1%(+10.2)#521 |
| 8. | 38631 | 12.1% | 2.4%(+9.77)#8 | 2.1%(+9.99)#540 |
| 9. | 39477 | 11.1% | 2.4%(+8.73)#9 | 2.1%(+8.96)#635 |
| 10. | 39736 | 10.2% | 2.4%(+7.79)#10 | 2.1%(+8.02)#748 |
| 11. | 39356 | 9.5% | 2.4%(+7.12)#11 | 2.1%(+7.35)#840 |
| 12. | 38774 | 9.5% | 2.4%(+7.11)#12 | 2.1%(+7.33)#841 |
| 13. | 39193 | 9.3% | 2.4%(+6.92)#13 | 2.1%(+7.15)#860 |
| 14. | 39767 | 9.1% | 2.4%(+6.71)#14 | 2.1%(+6.94)#890 |
| 15. | 39663 | 8.6% | 2.4%(+6.26)#15 | 2.1%(+6.49)#979 |
| 16. | 38665 | 8.6% | 2.4%(+6.23)#16 | 2.1%(+6.46)#981 |
| 17. | 39086 | 8.5% | 2.4%(+6.07)#17 | 2.1%(+6.30)#1,025 |
| 18. | 39669 | 8.4% | 2.4%(+6.05)#18 | 2.1%(+6.28)#1,030 |
| 19. | 39631 | 8.4% | 2.4%(+6.00)#19 | 2.1%(+6.23)#1,045 |
| 20. | 38966 | 7.9% | 2.4%(+5.48)#20 | 2.1%(+5.71)#1,221 |
| 21. | 38622 | 7.5% | 2.4%(+5.08)#21 | 2.1%(+5.30)#1,350 |
| 22. | 38664 | 7.4% | 2.4%(+4.99)#22 | 2.1%(+5.22)#1,373 |
| 23. | 39114 | 7.2% | 2.4%(+4.83)#23 | 2.1%(+5.06)#1,436 |
| 24. | 38771 | 6.8% | 2.4%(+4.38)#24 | 2.1%(+4.61)#1,656 |
| 25. | 39427 | 6.7% | 2.4%(+4.33)#25 | 2.1%(+4.56)#1,683 |
| 26. | 38644 | 6.7% | 2.4%(+4.29)#26 | 2.1%(+4.52)#1,712 |
| 27. | 38721 | 6.6% | 2.4%(+4.24)#27 | 2.1%(+4.47)#1,729 |
| 28. | 38740 | 6.6% | 2.4%(+4.19)#28 | 2.1%(+4.42)#1,760 |
| 29. | 38773 | 6.6% | 2.4%(+4.18)#29 | 2.1%(+4.41)#1,768 |
| 30. | 39044 | 6.5% | 2.4%(+4.09)#30 | 2.1%(+4.32)#1,797 |
| 31. | 39739 | 6.3% | 2.4%(+3.95)#31 | 2.1%(+4.18)#1,888 |
| 32. | 39476 | 6.3% | 2.4%(+3.92)#32 | 2.1%(+4.15)#1,902 |
| 33. | 38917 | 6.2% | 2.4%(+3.84)#33 | 2.1%(+4.07)#1,937 |
| 34. | 39481 | 6.2% | 2.4%(+3.84)#34 | 2.1%(+4.07)#1,938 |
| 35. | 39096 | 6.2% | 2.4%(+3.81)#35 | 2.1%(+4.04)#1,961 |
| 36. | 39341 | 6.1% | 2.4%(+3.77)#36 | 2.1%(+4.00)#1,987 |
| 37. | 39656 | 6.1% | 2.4%(+3.76)#37 | 2.1%(+3.98)#1,995 |
| 38. | 38720 | 6.1% | 2.4%(+3.70)#38 | 2.1%(+3.93)#2,028 |
| 39. | 39194 | 6.0% | 2.4%(+3.64)#39 | 2.1%(+3.87)#2,063 |
| 40. | 39150 | 5.8% | 2.4%(+3.43)#40 | 2.1%(+3.66)#2,200 |
| 41. | 39363 | 5.8% | 2.4%(+3.39)#41 | 2.1%(+3.62)#2,234 |
| 42. | 38645 | 5.7% | 2.4%(+3.31)#42 | 2.1%(+3.54)#2,292 |
| 43. | 38838 | 5.6% | 2.4%(+3.23)#43 | 2.1%(+3.46)#2,367 |
| 44. | 39066 | 5.6% | 2.4%(+3.17)#44 | 2.1%(+3.40)#2,415 |
| 45. | 39301 | 5.5% | 2.4%(+3.12)#45 | 2.1%(+3.35)#2,455 |
| 46. | 38965 | 5.5% | 2.4%(+3.09)#46 | 2.1%(+3.32)#2,481 |
| 47. | 38621 | 5.5% | 2.4%(+3.09)#47 | 2.1%(+3.31)#2,483 |
| 48. | 38870 | 5.4% | 2.4%(+3.06)#48 | 2.1%(+3.29)#2,505 |
| 49. | 39776 | 5.4% | 2.4%(+3.05)#49 | 2.1%(+3.27)#2,518 |
| 50. | 38869 | 5.4% | 2.4%(+3.03)#50 | 2.1%(+3.26)#2,534 |
| 51. | 38617 | 5.2% | 2.4%(+2.81)#51 | 2.1%(+3.04)#2,719 |
| 52. | 39346 | 5.1% | 2.4%(+2.72)#52 | 2.1%(+2.95)#2,809 |
| 53. | 38676 | 5.1% | 2.4%(+2.71)#53 | 2.1%(+2.93)#2,830 |
| 54. | 39772 | 5.0% | 2.4%(+2.65)#54 | 2.1%(+2.88)#2,888 |
| 55. | 39520 | 5.0% | 2.4%(+2.62)#55 | 2.1%(+2.85)#2,925 |
| 56. | 39183 | 5.0% | 2.4%(+2.59)#56 | 2.1%(+2.82)#2,957 |
| 57. | 39574 | 5.0% | 2.4%(+2.59)#57 | 2.1%(+2.82)#2,961 |
| 58. | 38732 | 4.8% | 2.4%(+2.42)#58 | 2.1%(+2.65)#3,182 |
| 59. | 38828 | 4.7% | 2.4%(+2.32)#59 | 2.1%(+2.55)#3,305 |
| 60. | 39335 | 4.7% | 2.4%(+2.29)#60 | 2.1%(+2.52)#3,346 |
| 61. | 38925 | 4.6% | 2.4%(+2.23)#61 | 2.1%(+2.46)#3,422 |
| 62. | 39426 | 4.6% | 2.4%(+2.18)#62 | 2.1%(+2.41)#3,511 |
| 63. | 39342 | 4.6% | 2.4%(+2.18)#63 | 2.1%(+2.41)#3,513 |
| 64. | 38677 | 4.6% | 2.4%(+2.18)#64 | 2.1%(+2.41)#3,516 |
| 65. | 39478 | 4.5% | 2.4%(+2.15)#65 | 2.1%(+2.38)#3,565 |
| 66. | 39571 | 4.4% | 2.4%(+2.06)#66 | 2.1%(+2.29)#3,711 |
| 67. | 39428 | 4.4% | 2.4%(+2.06)#67 | 2.1%(+2.29)#3,720 |
| 68. | 38703 | 4.4% | 2.4%(+2.04)#68 | 2.1%(+2.27)#3,744 |
| 69. | 38901 | 4.4% | 2.4%(+2.02)#69 | 2.1%(+2.25)#3,774 |
| 70. | 39540 | 4.4% | 2.4%(+2.00)#70 | 2.1%(+2.23)#3,816 |
| 71. | 39561 | 4.3% | 2.4%(+1.96)#71 | 2.1%(+2.19)#3,886 |
| 72. | 39208 | 4.3% | 2.4%(+1.93)#72 | 2.1%(+2.16)#3,926 |
| 73. | 39206 | 4.3% | 2.4%(+1.93)#73 | 2.1%(+2.16)#3,940 |
| 74. | 39747 | 4.3% | 2.4%(+1.88)#74 | 2.1%(+2.11)#4,002 |
| 75. | 38850 | 4.3% | 2.4%(+1.88)#75 | 2.1%(+2.11)#4,010 |
| 76. | 39532 | 4.2% | 2.4%(+1.80)#76 | 2.1%(+2.03)#4,164 |
| 77. | 39189 | 4.1% | 2.4%(+1.75)#77 | 2.1%(+1.98)#4,252 |
| 78. | 39470 | 4.1% | 2.4%(+1.69)#78 | 2.1%(+1.92)#4,354 |
| 79. | 39577 | 4.0% | 2.4%(+1.64)#79 | 2.1%(+1.87)#4,463 |
| 80. | 38921 | 3.9% | 2.4%(+1.54)#80 | 2.1%(+1.77)#4,641 |
| 81. | 39046 | 3.9% | 2.4%(+1.53)#81 | 2.1%(+1.76)#4,665 |
| 82. | 39170 | 3.9% | 2.4%(+1.50)#82 | 2.1%(+1.73)#4,734 |
| 83. | 38762 | 3.9% | 2.4%(+1.50)#83 | 2.1%(+1.73)#4,747 |
| 84. | 39567 | 3.9% | 2.4%(+1.48)#84 | 2.1%(+1.71)#4,778 |
| 85. | 39095 | 3.9% | 2.4%(+1.48)#85 | 2.1%(+1.71)#4,787 |
| 86. | 39045 | 3.8% | 2.4%(+1.39)#86 | 2.1%(+1.62)#4,986 |
| 87. | 39735 | 3.8% | 2.4%(+1.37)#87 | 2.1%(+1.60)#5,028 |
| 88. | 39156 | 3.7% | 2.4%(+1.35)#88 | 2.1%(+1.58)#5,070 |
| 89. | 39212 | 3.7% | 2.4%(+1.29)#89 | 2.1%(+1.52)#5,225 |
| 90. | 38868 | 3.7% | 2.4%(+1.28)#90 | 2.1%(+1.51)#5,261 |
| 91. | 38759 | 3.6% | 2.4%(+1.26)#91 | 2.1%(+1.49)#5,312 |
| 92. | 38821 | 3.6% | 2.4%(+1.23)#92 | 2.1%(+1.46)#5,385 |
| 93. | 39638 | 3.6% | 2.4%(+1.22)#93 | 2.1%(+1.45)#5,401 |
| 94. | 39464 | 3.6% | 2.4%(+1.21)#94 | 2.1%(+1.44)#5,417 |
| 95. | 39209 | 3.5% | 2.4%(+1.16)#95 | 2.1%(+1.39)#5,589 |
| 96. | 39348 | 3.5% | 2.4%(+1.13)#96 | 2.1%(+1.36)#5,647 |
| 97. | 39038 | 3.5% | 2.4%(+1.12)#97 | 2.1%(+1.35)#5,680 |
| 98. | 39082 | 3.4% | 2.4%(+1.07)#98 | 2.1%(+1.30)#5,807 |
| 99. | 38736 | 3.4% | 2.4%(+1.07)#99 | 2.1%(+1.30)#5,811 |
| 100. | 38852 | 3.4% | 2.4%(+1.03)#100 | 2.1%(+1.26)#5,899 |
Common Questions
What are the Top 10 Zip Codes with the Highest Percentage of Population Employed in Security & Protection in Mississippi?
Top 10 Zip Codes with the Highest Percentage of Population Employed in Security & Protection in Mississippi are:
What zip code has the Highest Percentage of Population Employed in Security & Protection in Mississippi?
38928 has the Highest Percentage of Population Employed in Security & Protection in Mississippi with 36.2%.
What is the Percentage of Population Employed in Security & Protection in the State of Mississippi?
Percentage of Population Employed in Security & Protection in Mississippi is 2.4%.
What is the Percentage of Population Employed in Security & Protection in the United States?
Percentage of Population Employed in Security & Protection in the United States is 2.1%.