Pearl River, MS Map & Demographics
Pearl River Map
Pearl River Overview
$14,912
PER CAPITA INCOME
$31,417
AVG FAMILY INCOME
$40,614
AVG HOUSEHOLD INCOME
41.5%
WAGE / INCOME GAP [ % ]
58.5¢/ $1
WAGE / INCOME GAP [ $ ]
$10,286
FAMILY INCOME DEFICIT
0.40
INEQUALITY / GINI INDEX
4,298
TOTAL POPULATION
2,161
MALE POPULATION
2,137
FEMALE POPULATION
101.12
MALES / 100 FEMALES
98.89
FEMALES / 100 MALES
33.1
MEDIAN AGE
4.0
AVG FAMILY SIZE
3.3
AVG HOUSEHOLD SIZE
1,838
LABOR FORCE [ PEOPLE ]
59.2%
PERCENT IN LABOR FORCE
6.6%
UNEMPLOYMENT RATE
Income in Pearl River
Income Overview in Pearl River
Per Capita Income in Pearl River is $14,912, while median incomes of families and households are $31,417 and $40,614 respectively.
| Characteristic | Number | Measure |
| Per Capita Income | 4,298 | $14,912 |
| Median Family Income | 880 | $31,417 |
| Mean Family Income | 880 | $50,154 |
| Median Household Income | 1,263 | $40,614 |
| Mean Household Income | 1,263 | $51,948 |
| Income Deficit | 880 | $10,286 |
| Wage / Income Gap (%) | 4,298 | 41.53% |
| Wage / Income Gap ($) | 4,298 | 58.47¢ per $1 |
| Gini / Inequality Index | 4,298 | 0.40 |
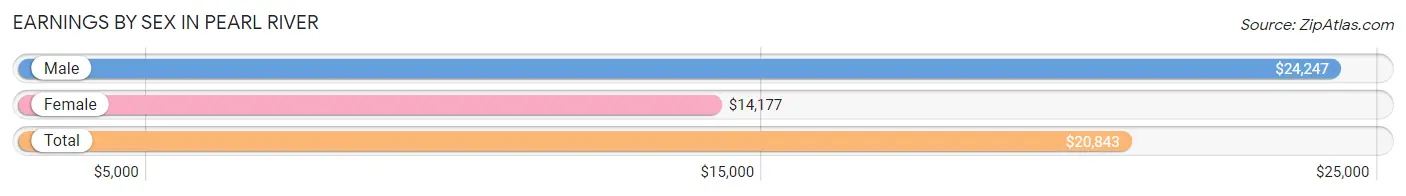
Earnings by Sex in Pearl River
Average Earnings in Pearl River are $20,843, $24,247 for men and $14,177 for women, a difference of 41.5%.
| Sex | Number | Average Earnings |
| Male | 897 (49.4%) | $24,247 |
| Female | 918 (50.6%) | $14,177 |
| Total | 1,815 (100.0%) | $20,843 |
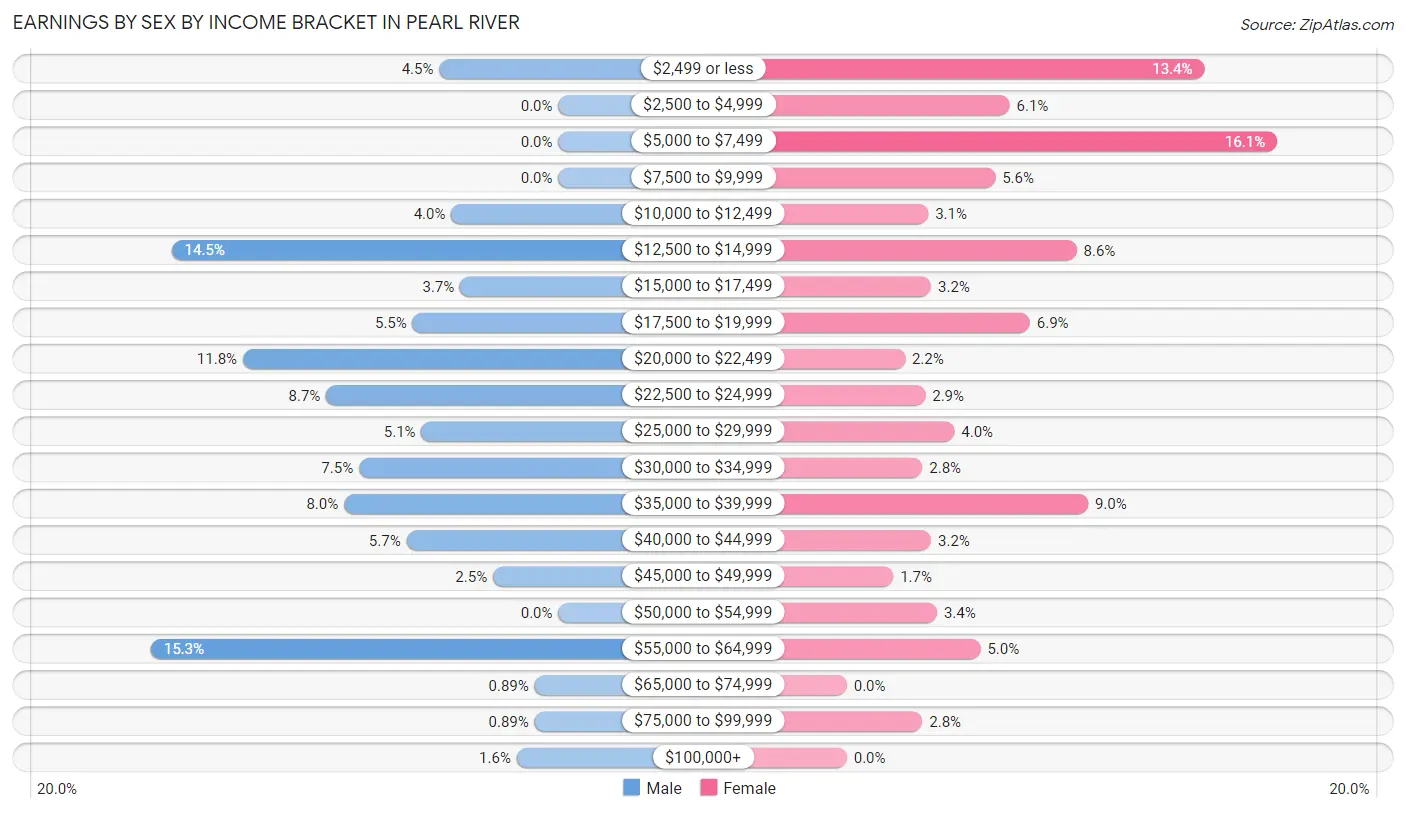
Earnings by Sex by Income Bracket in Pearl River
The most common earnings brackets in Pearl River are $55,000 to $64,999 for men (137 | 15.3%) and $5,000 to $7,499 for women (148 | 16.1%).
| Income | Male | Female |
| $2,499 or less | 40 (4.5%) | 123 (13.4%) |
| $2,500 to $4,999 | 0 (0.0%) | 56 (6.1%) |
| $5,000 to $7,499 | 0 (0.0%) | 148 (16.1%) |
| $7,500 to $9,999 | 0 (0.0%) | 51 (5.6%) |
| $10,000 to $12,499 | 36 (4.0%) | 28 (3.0%) |
| $12,500 to $14,999 | 130 (14.5%) | 79 (8.6%) |
| $15,000 to $17,499 | 33 (3.7%) | 29 (3.2%) |
| $17,500 to $19,999 | 49 (5.5%) | 63 (6.9%) |
| $20,000 to $22,499 | 106 (11.8%) | 20 (2.2%) |
| $22,500 to $24,999 | 78 (8.7%) | 27 (2.9%) |
| $25,000 to $29,999 | 46 (5.1%) | 37 (4.0%) |
| $30,000 to $34,999 | 67 (7.5%) | 26 (2.8%) |
| $35,000 to $39,999 | 72 (8.0%) | 83 (9.0%) |
| $40,000 to $44,999 | 51 (5.7%) | 29 (3.2%) |
| $45,000 to $49,999 | 22 (2.5%) | 16 (1.7%) |
| $50,000 to $54,999 | 0 (0.0%) | 31 (3.4%) |
| $55,000 to $64,999 | 137 (15.3%) | 46 (5.0%) |
| $65,000 to $74,999 | 8 (0.9%) | 0 (0.0%) |
| $75,000 to $99,999 | 8 (0.9%) | 26 (2.8%) |
| $100,000+ | 14 (1.6%) | 0 (0.0%) |
| Total | 897 (100.0%) | 918 (100.0%) |
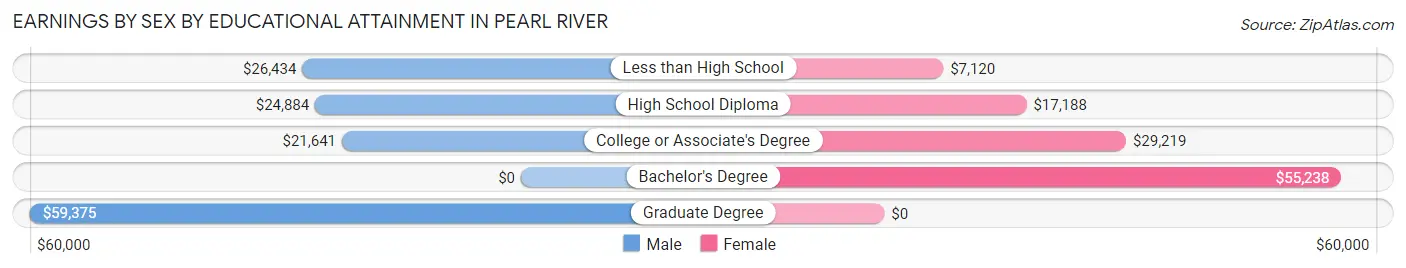
Earnings by Sex by Educational Attainment in Pearl River
Average earnings in Pearl River are $26,765 for men and $14,525 for women, a difference of 45.7%. Men with an educational attainment of graduate degree enjoy the highest average annual earnings of $59,375, while those with college or associate's degree education earn the least with $21,641. Women with an educational attainment of bachelor's degree earn the most with the average annual earnings of $55,238, while those with less than high school education have the smallest earnings of $7,120.
| Educational Attainment | Male Income | Female Income |
| Less than High School | $26,434 | $7,120 |
| High School Diploma | $24,884 | $17,188 |
| College or Associate's Degree | $21,641 | $29,219 |
| Bachelor's Degree | - | - |
| Graduate Degree | $59,375 | $0 |
| Total | $26,765 | $14,525 |
Family Income in Pearl River
Family Income Brackets in Pearl River
According to the Pearl River family income data, there are 269 families falling into the $25,000 to $34,999 income range, which is the most common income bracket and makes up 30.6% of all families.
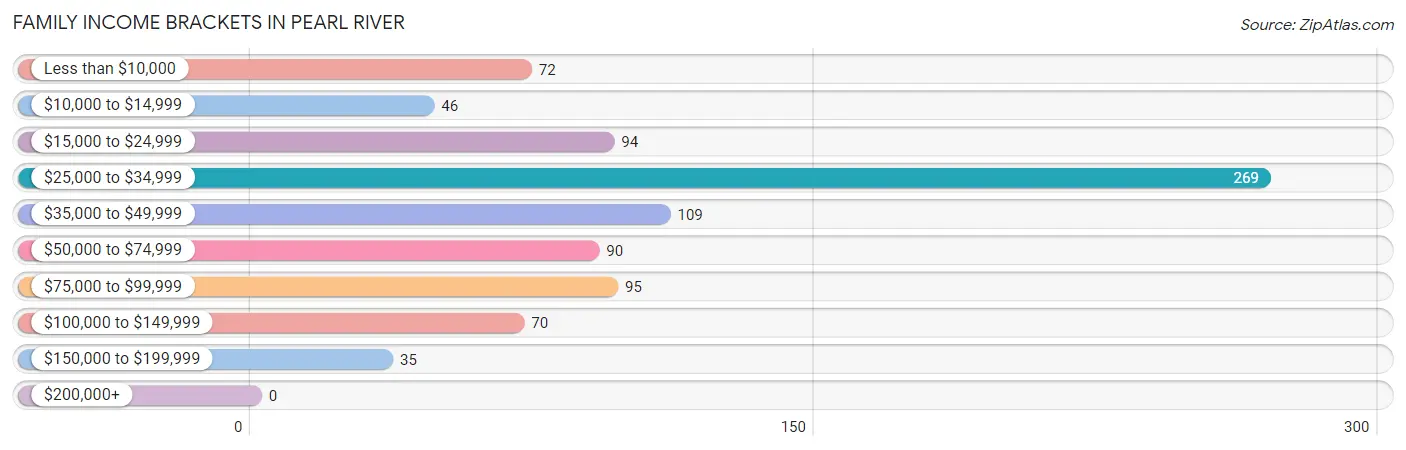
| Income Bracket | # Families | % Families |
| Less than $10,000 | 72 | 8.2% |
| $10,000 to $14,999 | 46 | 5.2% |
| $15,000 to $24,999 | 94 | 10.7% |
| $25,000 to $34,999 | 269 | 30.6% |
| $35,000 to $49,999 | 109 | 12.4% |
| $50,000 to $74,999 | 90 | 10.2% |
| $75,000 to $99,999 | 95 | 10.8% |
| $100,000 to $149,999 | 70 | 8.0% |
| $150,000 to $199,999 | 35 | 4.0% |
| $200,000+ | 0 | 0.0% |
Family Income by Famaliy Size in Pearl River
7+ person families (82 | 9.3%) account for the highest median family income in Pearl River with $106,207 per family, while 7+ person families (82 | 9.3%) have the highest median income of $15,172 per family member.
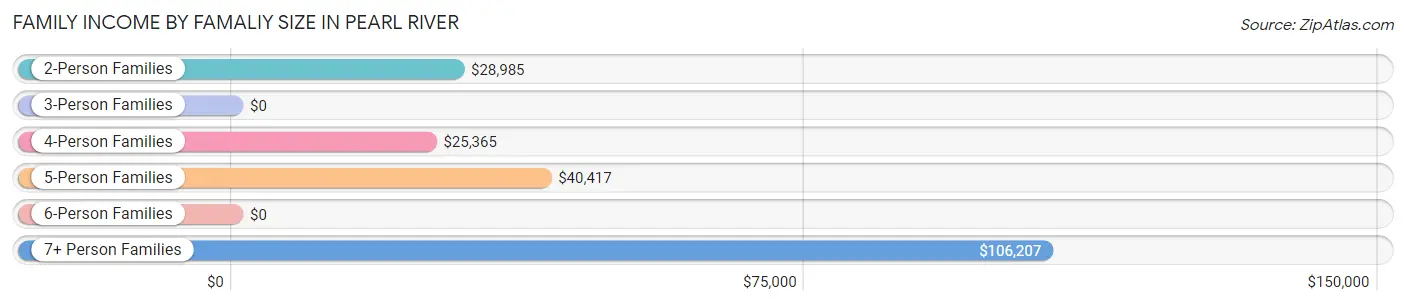
| Income Bracket | # Families | Median Income |
| 2-Person Families | 394 (44.8%) | $28,985 |
| 3-Person Families | 114 (13.0%) | $0 |
| 4-Person Families | 149 (16.9%) | $25,365 |
| 5-Person Families | 95 (10.8%) | $40,417 |
| 6-Person Families | 46 (5.2%) | $0 |
| 7+ Person Families | 82 (9.3%) | $106,207 |
| Total | 880 (100.0%) | $31,417 |
Family Income by Number of Earners in Pearl River
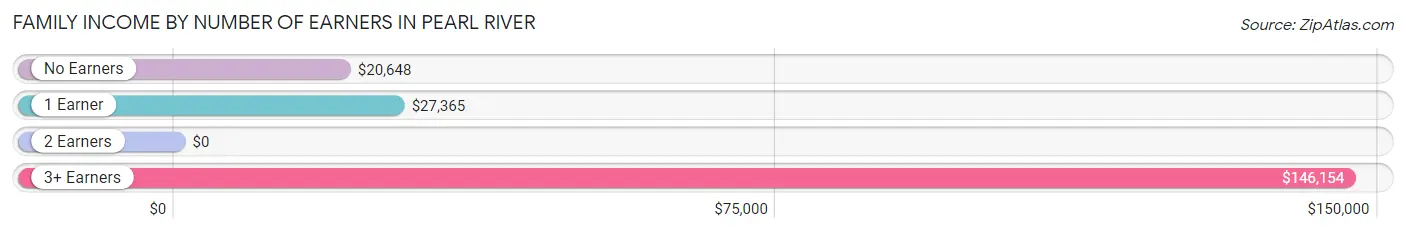
| Number of Earners | # Families | Median Income |
| No Earners | 120 (13.6%) | $20,648 |
| 1 Earner | 278 (31.6%) | $27,365 |
| 2 Earners | 432 (49.1%) | $0 |
| 3+ Earners | 50 (5.7%) | $146,154 |
| Total | 880 (100.0%) | $31,417 |
Household Income in Pearl River
Household Income Brackets in Pearl River
With 309 households falling in the category, the $25,000 to $34,999 income range is the most frequent in Pearl River, accounting for 24.5% of all households.
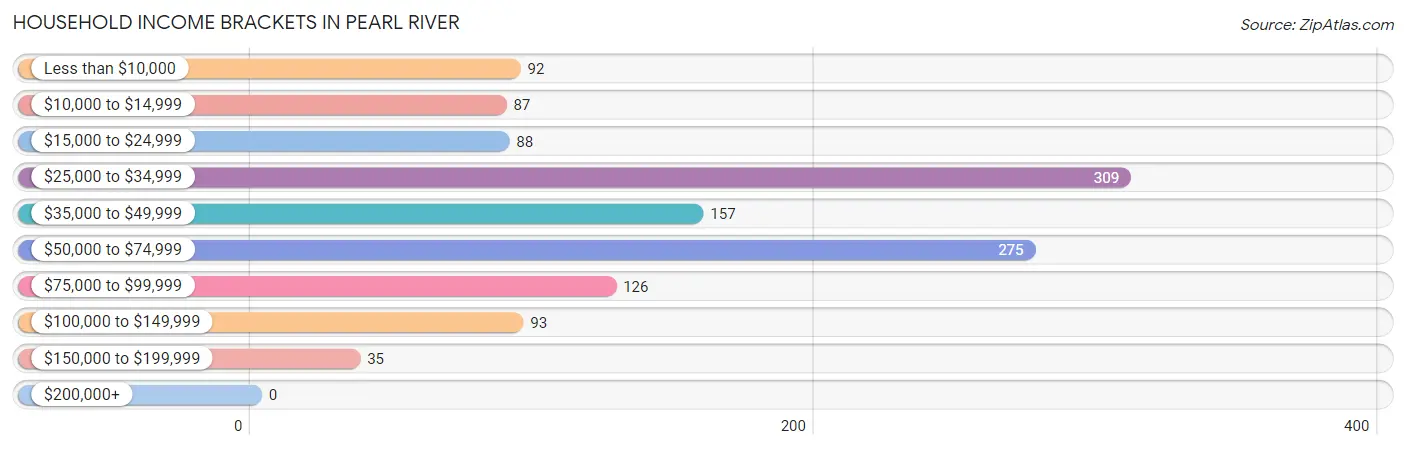
| Income Bracket | # Households | % Households |
| Less than $10,000 | 92 | 7.3% |
| $10,000 to $14,999 | 87 | 6.9% |
| $15,000 to $24,999 | 88 | 7.0% |
| $25,000 to $34,999 | 309 | 24.5% |
| $35,000 to $49,999 | 157 | 12.4% |
| $50,000 to $74,999 | 275 | 21.8% |
| $75,000 to $99,999 | 126 | 10.0% |
| $100,000 to $149,999 | 93 | 7.4% |
| $150,000 to $199,999 | 35 | 2.8% |
| $200,000+ | 0 | 0.0% |
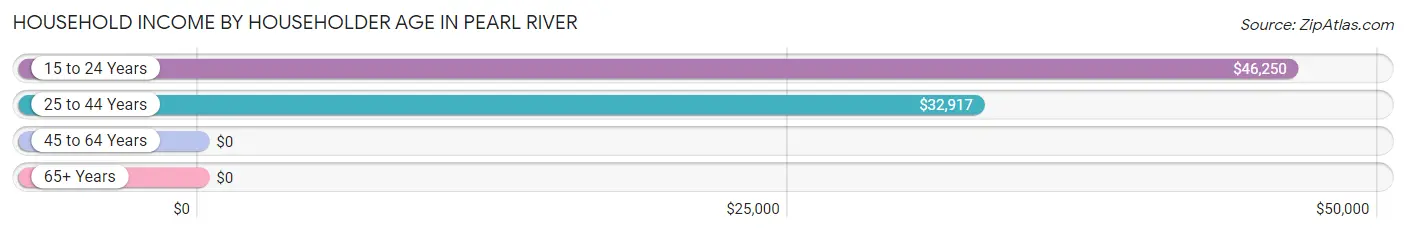
Household Income by Householder Age in Pearl River
The median household income in Pearl River is $40,614, with the highest median household income of $46,250 found in the 15 to 24 years age bracket for the primary householder. A total of 52 households (4.1%) fall into this category. Meanwhile, the 45 to 64 years age bracket for the primary householder has the lowest median household income of $0, with 386 households (30.6%) in this group.
| Income Bracket | # Households | Median Income |
| 15 to 24 Years | 52 (4.1%) | $46,250 |
| 25 to 44 Years | 381 (30.2%) | $32,917 |
| 45 to 64 Years | 386 (30.6%) | $0 |
| 65+ Years | 444 (35.1%) | $0 |
| Total | 1,263 (100.0%) | $40,614 |
Poverty in Pearl River
Income Below Poverty by Sex and Age in Pearl River
With 43.2% poverty level for males and 32.4% for females among the residents of Pearl River, 15 year old males and 16 and 17 year old females are the most vulnerable to poverty, with 66 males (100.0%) and 59 females (85.5%) in their respective age groups living below the poverty level.
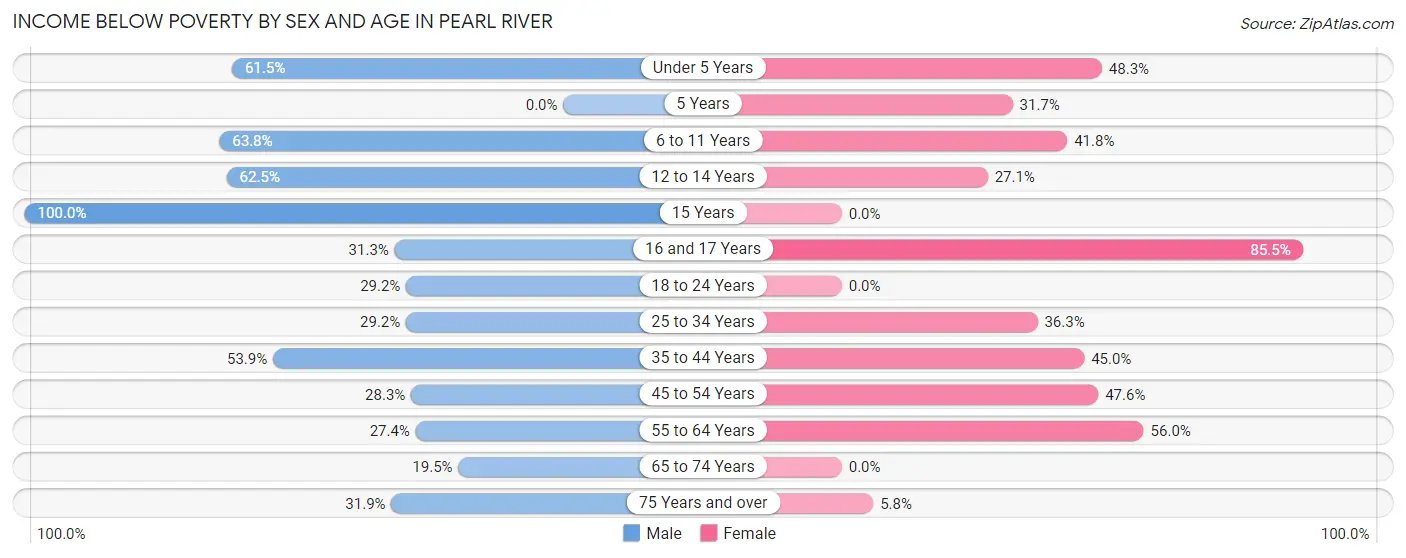
| Age Bracket | Male | Female |
| Under 5 Years | 123 (61.5%) | 56 (48.3%) |
| 5 Years | 0 (0.0%) | 13 (31.7%) |
| 6 to 11 Years | 113 (63.8%) | 82 (41.8%) |
| 12 to 14 Years | 145 (62.5%) | 39 (27.1%) |
| 15 Years | 66 (100.0%) | 0 (0.0%) |
| 16 and 17 Years | 31 (31.3%) | 59 (85.5%) |
| 18 to 24 Years | 49 (29.2%) | 0 (0.0%) |
| 25 to 34 Years | 129 (29.2%) | 77 (36.3%) |
| 35 to 44 Years | 118 (53.9%) | 157 (45.0%) |
| 45 to 54 Years | 50 (28.2%) | 109 (47.6%) |
| 55 to 64 Years | 54 (27.4%) | 65 (56.0%) |
| 65 to 74 Years | 15 (19.5%) | 0 (0.0%) |
| 75 Years and over | 15 (31.9%) | 8 (5.8%) |
| Total | 908 (43.2%) | 665 (32.4%) |
Income Above Poverty by Sex and Age in Pearl River
According to the poverty statistics in Pearl River, males aged 65 to 74 years and females aged 15 years are the age groups that are most secure financially, with 80.5% of males and 100.0% of females in these age groups living above the poverty line.
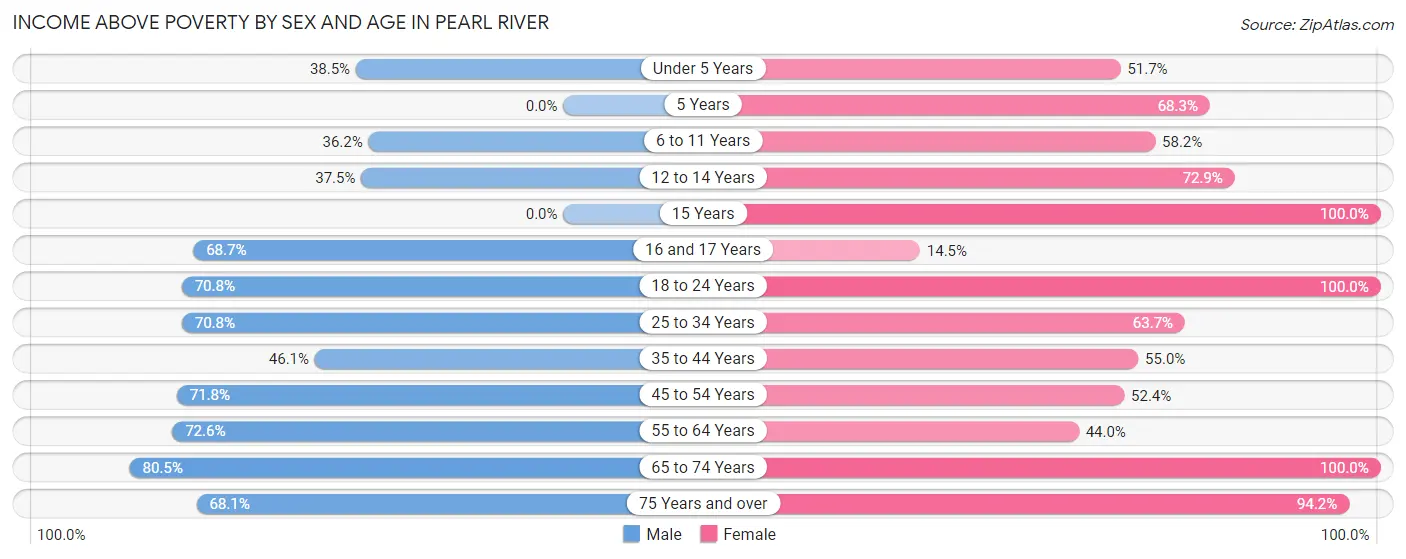
| Age Bracket | Male | Female |
| Under 5 Years | 77 (38.5%) | 60 (51.7%) |
| 5 Years | 0 (0.0%) | 28 (68.3%) |
| 6 to 11 Years | 64 (36.2%) | 114 (58.2%) |
| 12 to 14 Years | 87 (37.5%) | 105 (72.9%) |
| 15 Years | 0 (0.0%) | 21 (100.0%) |
| 16 and 17 Years | 68 (68.7%) | 10 (14.5%) |
| 18 to 24 Years | 119 (70.8%) | 170 (100.0%) |
| 25 to 34 Years | 313 (70.8%) | 135 (63.7%) |
| 35 to 44 Years | 101 (46.1%) | 192 (55.0%) |
| 45 to 54 Years | 127 (71.8%) | 120 (52.4%) |
| 55 to 64 Years | 143 (72.6%) | 51 (44.0%) |
| 65 to 74 Years | 62 (80.5%) | 254 (100.0%) |
| 75 Years and over | 32 (68.1%) | 129 (94.2%) |
| Total | 1,193 (56.8%) | 1,389 (67.6%) |
Income Below Poverty Among Married-Couple Families in Pearl River
The poverty statistics for married-couple families in Pearl River show that 18.2% or 46 of the total 252 families live below the poverty line. Families with 1 or 2 children have the highest poverty rate of 43.6%, comprising of 24 families. On the other hand, families with 5 or more children have the lowest poverty rate of 0.0%, which includes 0 families.
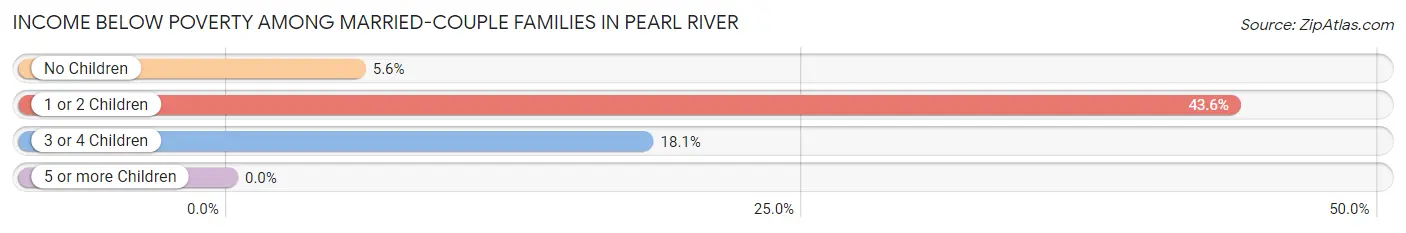
| Children | Above Poverty | Below Poverty |
| No Children | 85 (94.4%) | 5 (5.6%) |
| 1 or 2 Children | 31 (56.4%) | 24 (43.6%) |
| 3 or 4 Children | 77 (81.9%) | 17 (18.1%) |
| 5 or more Children | 13 (100.0%) | 0 (0.0%) |
| Total | 206 (81.8%) | 46 (18.2%) |
Income Below Poverty Among Single-Parent Households in Pearl River
According to the poverty data in Pearl River, 50.0% or 67 single-father households and 31.4% or 155 single-mother households are living below the poverty line. Among single-father households, those with 3 or 4 children have the highest poverty rate, with 52 households (74.3%) experiencing poverty. Likewise, among single-mother households, those with 5 or more children have the highest poverty rate, with 9 households (100.0%) falling below the poverty line.
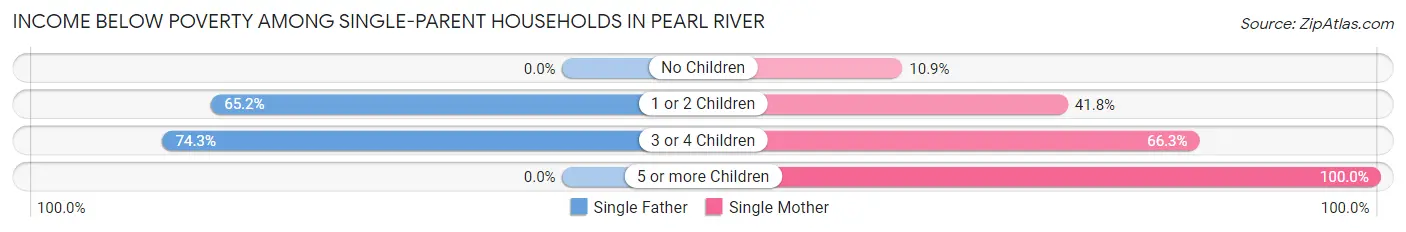
| Children | Single Father | Single Mother |
| No Children | 0 (0.0%) | 27 (10.9%) |
| 1 or 2 Children | 15 (65.2%) | 66 (41.8%) |
| 3 or 4 Children | 52 (74.3%) | 53 (66.2%) |
| 5 or more Children | 0 (0.0%) | 9 (100.0%) |
| Total | 67 (50.0%) | 155 (31.4%) |
Income Below Poverty Among Married-Couple vs Single-Parent Households in Pearl River
The poverty data for Pearl River shows that 46 of the married-couple family households (18.2%) and 222 of the single-parent households (35.3%) are living below the poverty level. Within the married-couple family households, those with 1 or 2 children have the highest poverty rate, with 24 households (43.6%) falling below the poverty line. Among the single-parent households, those with 5 or more children have the highest poverty rate, with 9 household (100.0%) living below poverty.
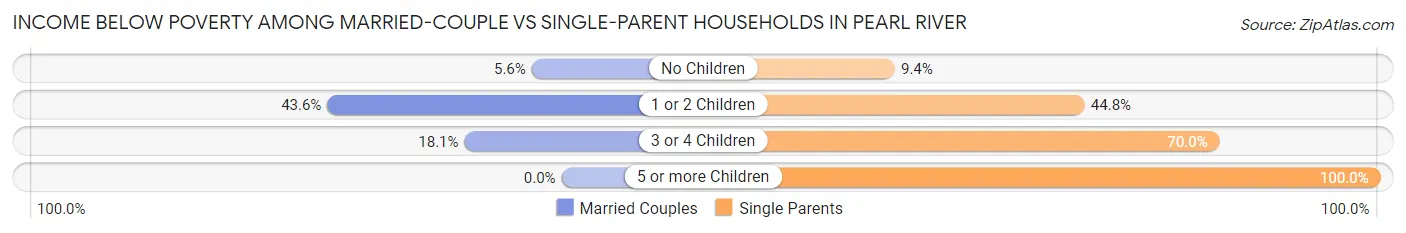
| Children | Married-Couple Families | Single-Parent Households |
| No Children | 5 (5.6%) | 27 (9.4%) |
| 1 or 2 Children | 24 (43.6%) | 81 (44.8%) |
| 3 or 4 Children | 17 (18.1%) | 105 (70.0%) |
| 5 or more Children | 0 (0.0%) | 9 (100.0%) |
| Total | 46 (18.2%) | 222 (35.3%) |
Race in Pearl River
The most populous races in Pearl River are Native / Alaskan (3,290 | 76.5%), White / Caucasian (714 | 16.6%), and Two or more Races (122 | 2.8%).
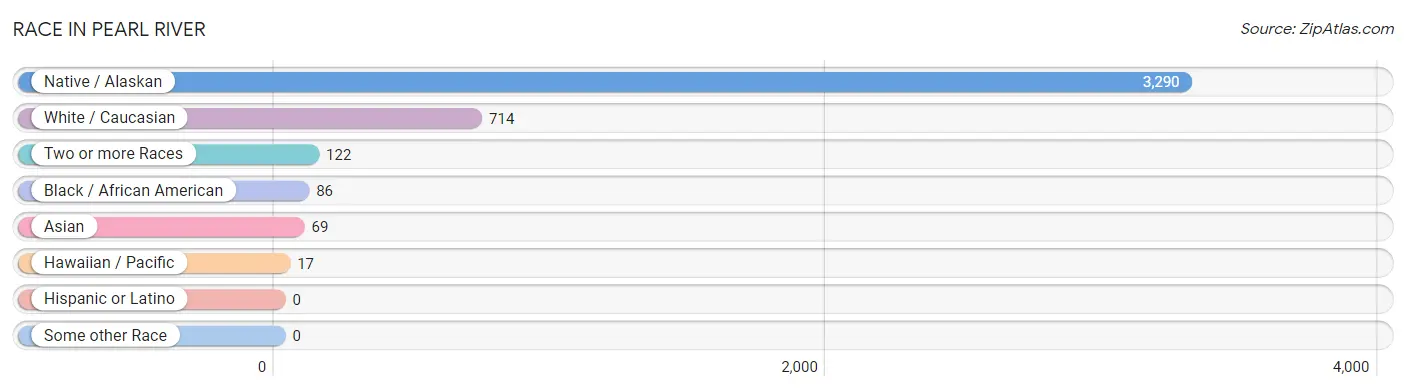
| Race | # Population | % Population |
| Asian | 69 | 1.6% |
| Black / African American | 86 | 2.0% |
| Hawaiian / Pacific | 17 | 0.4% |
| Hispanic or Latino | 0 | 0.0% |
| Native / Alaskan | 3,290 | 76.5% |
| White / Caucasian | 714 | 16.6% |
| Two or more Races | 122 | 2.8% |
| Some other Race | 0 | 0.0% |
| Total | 4,298 | 100.0% |
Ancestry in Pearl River
The most populous ancestries reported in Pearl River are Choctaw (3,225 | 75.0%), Irish (187 | 4.3%), English (163 | 3.8%), Korean (59 | 1.4%), and Sri Lankan (59 | 1.4%), together accounting for 85.9% of all Pearl River residents.
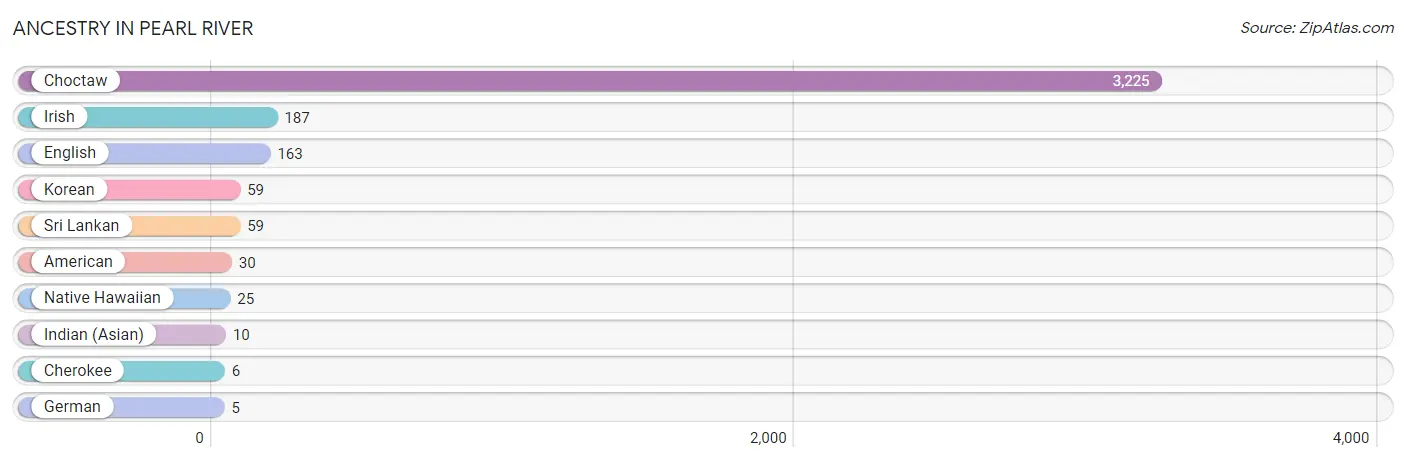
| Ancestry | # Population | % Population |
| American | 30 | 0.7% |
| Cherokee | 6 | 0.1% |
| Choctaw | 3,225 | 75.0% |
| English | 163 | 3.8% |
| German | 5 | 0.1% |
| Indian (Asian) | 10 | 0.2% |
| Irish | 187 | 4.3% |
| Korean | 59 | 1.4% |
| Native Hawaiian | 25 | 0.6% |
| Sri Lankan | 59 | 1.4% | View All 10 Rows |
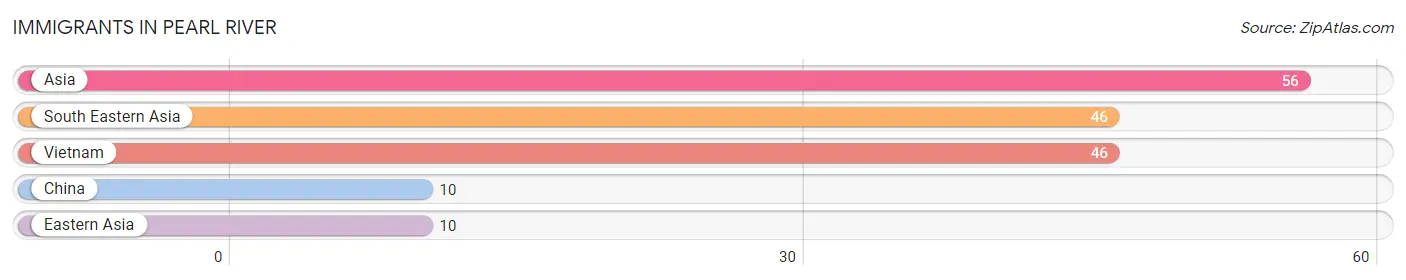
Immigrants in Pearl River
The most numerous immigrant groups reported in Pearl River came from Asia (56 | 1.3%), South Eastern Asia (46 | 1.1%), Vietnam (46 | 1.1%), China (10 | 0.2%), and Eastern Asia (10 | 0.2%), together accounting for 3.9% of all Pearl River residents.
| Immigration Origin | # Population | % Population |
| Asia | 56 | 1.3% |
| China | 10 | 0.2% |
| Eastern Asia | 10 | 0.2% |
| South Eastern Asia | 46 | 1.1% |
| Vietnam | 46 | 1.1% | View All 5 Rows |
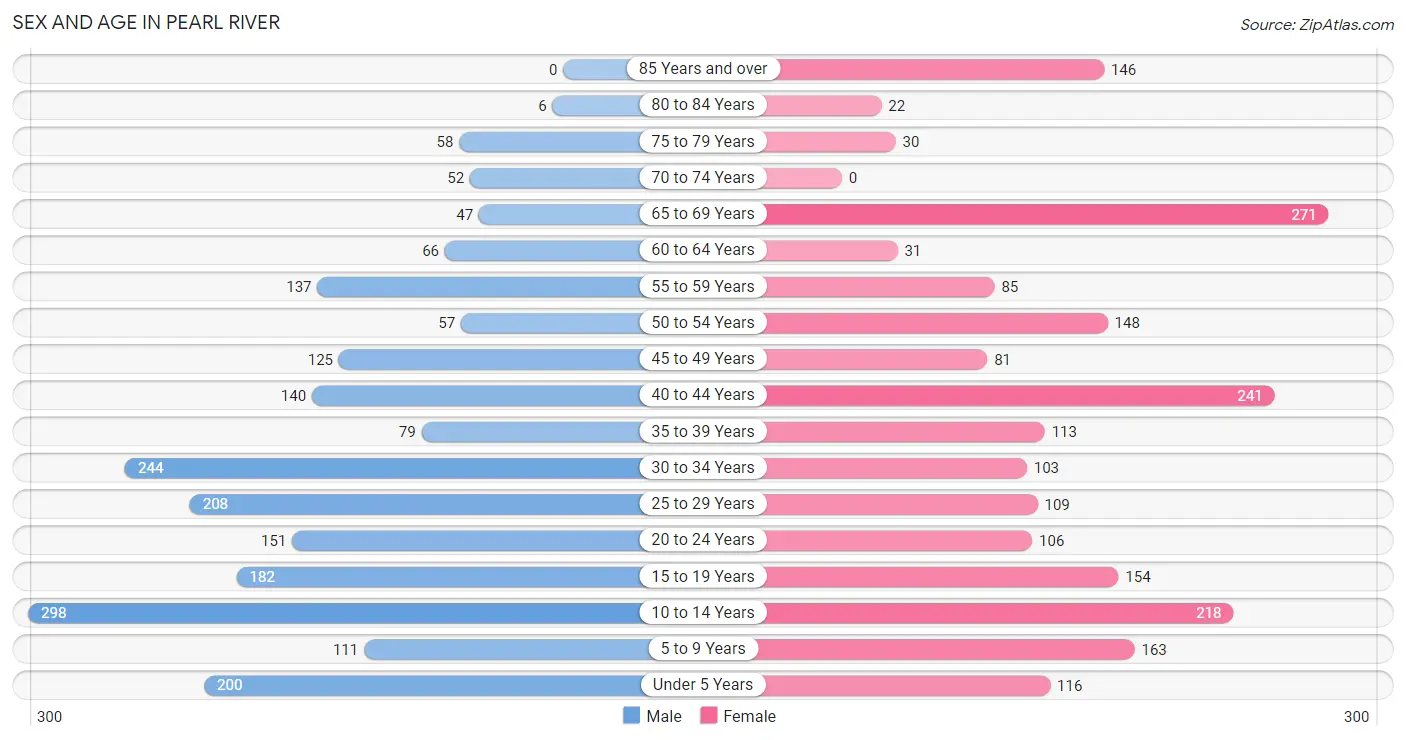
Sex and Age in Pearl River
Sex and Age in Pearl River
The most populous age groups in Pearl River are 10 to 14 Years (298 | 13.8%) for men and 65 to 69 Years (271 | 12.7%) for women.
| Age Bracket | Male | Female |
| Under 5 Years | 200 (9.2%) | 116 (5.4%) |
| 5 to 9 Years | 111 (5.1%) | 163 (7.6%) |
| 10 to 14 Years | 298 (13.8%) | 218 (10.2%) |
| 15 to 19 Years | 182 (8.4%) | 154 (7.2%) |
| 20 to 24 Years | 151 (7.0%) | 106 (5.0%) |
| 25 to 29 Years | 208 (9.6%) | 109 (5.1%) |
| 30 to 34 Years | 244 (11.3%) | 103 (4.8%) |
| 35 to 39 Years | 79 (3.7%) | 113 (5.3%) |
| 40 to 44 Years | 140 (6.5%) | 241 (11.3%) |
| 45 to 49 Years | 125 (5.8%) | 81 (3.8%) |
| 50 to 54 Years | 57 (2.6%) | 148 (6.9%) |
| 55 to 59 Years | 137 (6.3%) | 85 (4.0%) |
| 60 to 64 Years | 66 (3.0%) | 31 (1.5%) |
| 65 to 69 Years | 47 (2.2%) | 271 (12.7%) |
| 70 to 74 Years | 52 (2.4%) | 0 (0.0%) |
| 75 to 79 Years | 58 (2.7%) | 30 (1.4%) |
| 80 to 84 Years | 6 (0.3%) | 22 (1.0%) |
| 85 Years and over | 0 (0.0%) | 146 (6.8%) |
| Total | 2,161 (100.0%) | 2,137 (100.0%) |
Families and Households in Pearl River
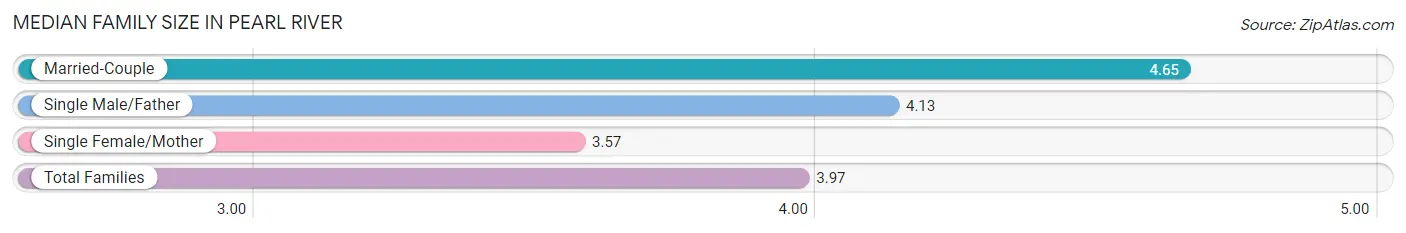
Median Family Size in Pearl River
The median family size in Pearl River is 3.97 persons per family, with married-couple families (252 | 28.6%) accounting for the largest median family size of 4.65 persons per family. On the other hand, single female/mother families (494 | 56.1%) represent the smallest median family size with 3.57 persons per family.
| Family Type | # Families | Family Size |
| Married-Couple | 252 (28.6%) | 4.65 |
| Single Male/Father | 134 (15.2%) | 4.13 |
| Single Female/Mother | 494 (56.1%) | 3.57 |
| Total Families | 880 (100.0%) | 3.97 |
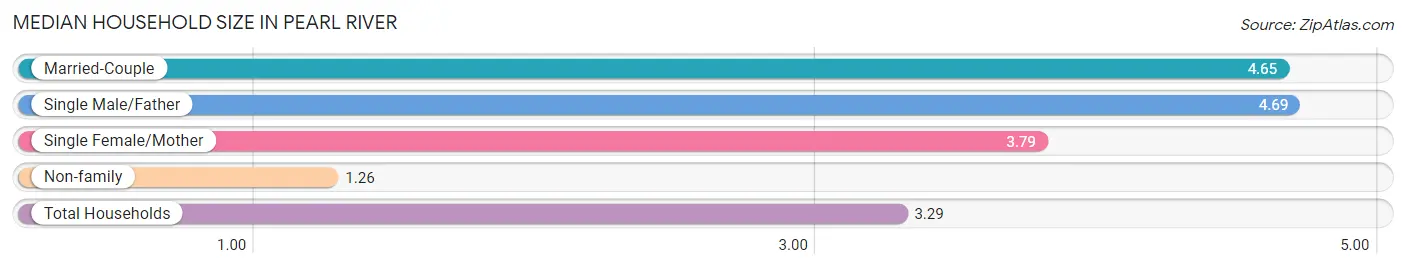
Median Household Size in Pearl River
The median household size in Pearl River is 3.29 persons per household, with single male/father households (134 | 10.6%) accounting for the largest median household size of 4.69 persons per household. non-family households (383 | 30.3%) represent the smallest median household size with 1.26 persons per household.
| Household Type | # Households | Household Size |
| Married-Couple | 252 (20.0%) | 4.65 |
| Single Male/Father | 134 (10.6%) | 4.69 |
| Single Female/Mother | 494 (39.1%) | 3.79 |
| Non-family | 383 (30.3%) | 1.26 |
| Total Households | 1,263 (100.0%) | 3.29 |
Household Size by Marriage Status in Pearl River
Out of a total of 1,263 households in Pearl River, 880 (69.7%) are family households, while 383 (30.3%) are nonfamily households. The most numerous type of family households are 3-person households, comprising 253, and the most common type of nonfamily households are 1-person households, comprising 324.
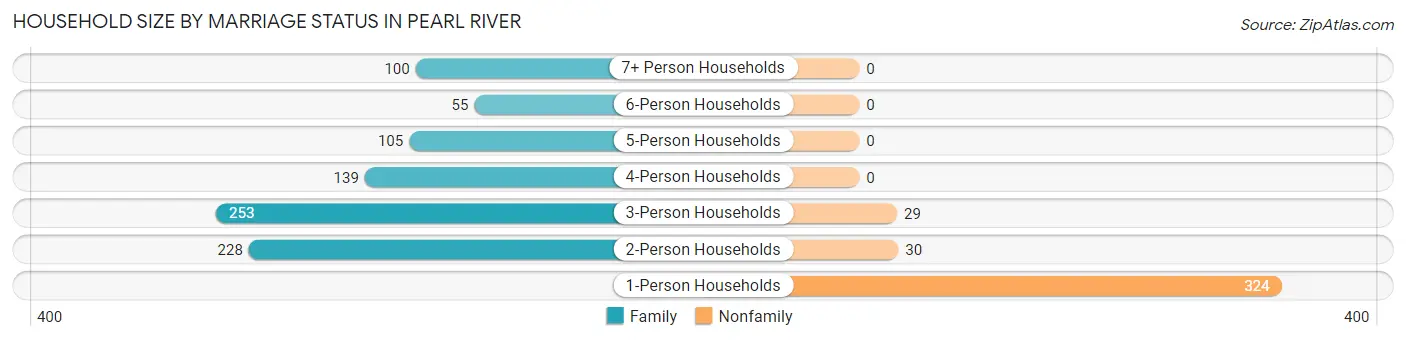
| Household Size | Family Households | Nonfamily Households |
| 1-Person Households | - | 324 (25.7%) |
| 2-Person Households | 228 (18.0%) | 30 (2.4%) |
| 3-Person Households | 253 (20.0%) | 29 (2.3%) |
| 4-Person Households | 139 (11.0%) | 0 (0.0%) |
| 5-Person Households | 105 (8.3%) | 0 (0.0%) |
| 6-Person Households | 55 (4.3%) | 0 (0.0%) |
| 7+ Person Households | 100 (7.9%) | 0 (0.0%) |
| Total | 880 (69.7%) | 383 (30.3%) |
Female Fertility in Pearl River
Fertility by Age in Pearl River
Average fertility rate in Pearl River is 118.0 births per 1,000 women. Women in the age bracket of 20 to 34 years have the highest fertility rate with 164.0 births per 1,000 women. Women in the age bracket of 20 to 34 years acount for 48.6% of all women with births.
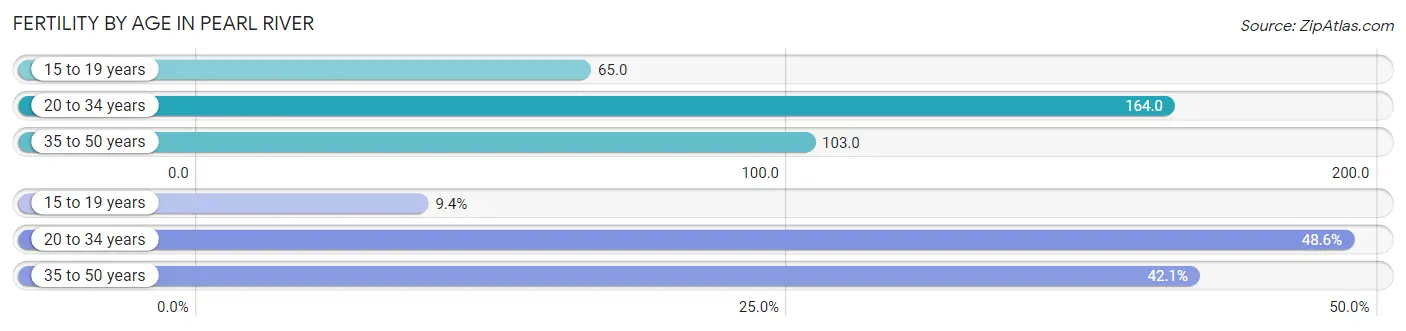
| Age Bracket | Women with Births | Births / 1,000 Women |
| 15 to 19 years | 10 (9.3%) | 65.0 |
| 20 to 34 years | 52 (48.6%) | 164.0 |
| 35 to 50 years | 45 (42.1%) | 103.0 |
| Total | 107 (100.0%) | 118.0 |
Fertility by Age by Marriage Status in Pearl River
22.4% of women with births (107) in Pearl River are married. The highest percentage of unmarried women with births falls into 15 to 19 years age bracket with 100.0% of them unmarried at the time of birth, while the lowest percentage of unmarried women with births belong to 20 to 34 years age bracket with 53.8% of them unmarried.
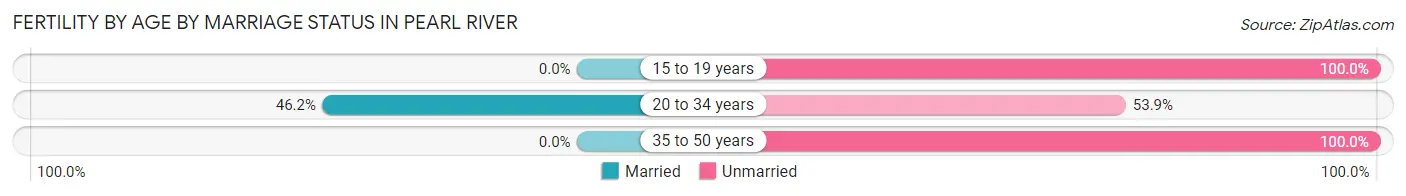
| Age Bracket | Married | Unmarried |
| 15 to 19 years | 0 (0.0%) | 10 (100.0%) |
| 20 to 34 years | 24 (46.2%) | 28 (53.8%) |
| 35 to 50 years | 0 (0.0%) | 45 (100.0%) |
| Total | 24 (22.4%) | 83 (77.6%) |
Fertility by Education in Pearl River
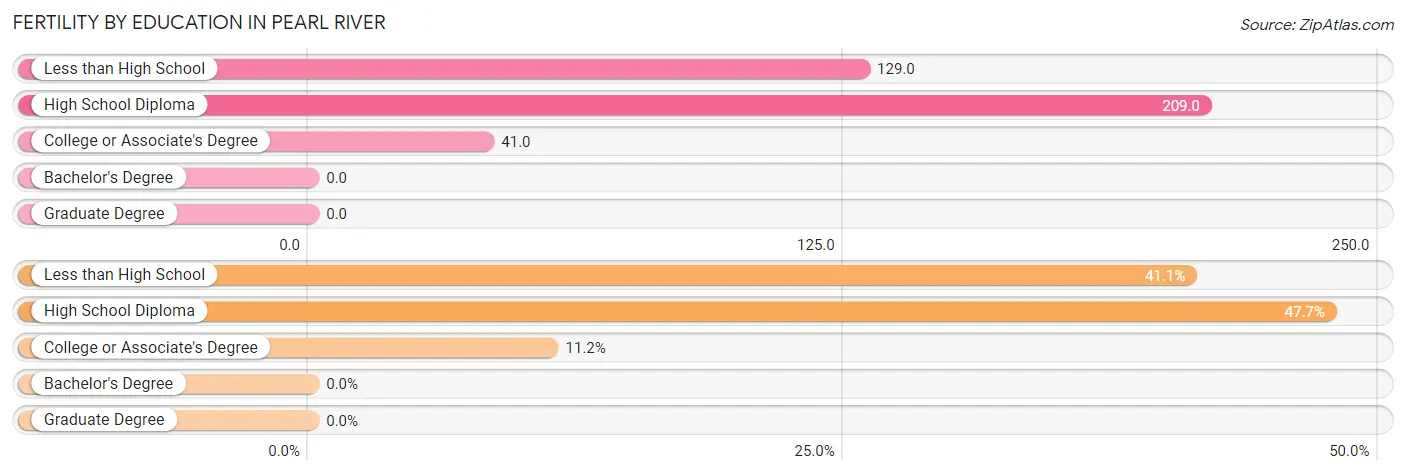
| Educational Attainment | Women with Births | Births / 1,000 Women |
| Less than High School | 44 (41.1%) | 129.0 |
| High School Diploma | 51 (47.7%) | 209.0 |
| College or Associate's Degree | 12 (11.2%) | 41.0 |
| Bachelor's Degree | 0 (0.0%) | 0.0 |
| Graduate Degree | 0 (0.0%) | 0.0 |
| Total | 107 (100.0%) | 118.0 |
Fertility by Education by Marriage Status in Pearl River
77.6% of women with births in Pearl River are unmarried. Women with the educational attainment of less than high school are most likely to be married with 54.5% of them married at childbirth, while women with the educational attainment of high school diploma are least likely to be married with 100.0% of them unmarried at childbirth.
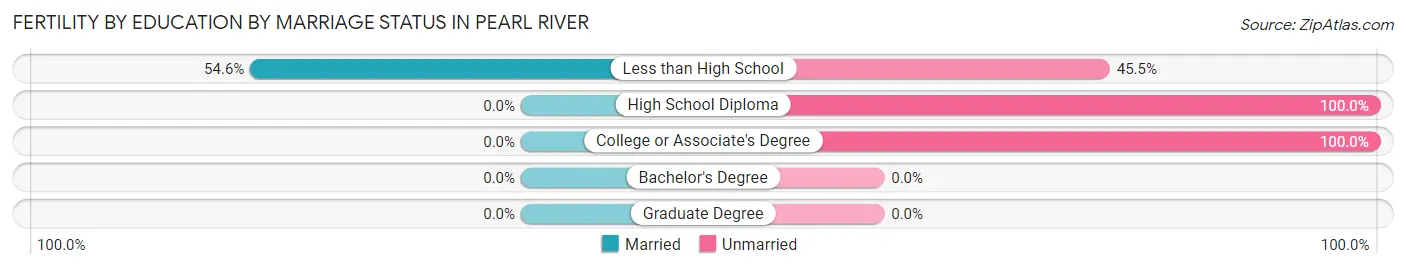
| Educational Attainment | Married | Unmarried |
| Less than High School | 24 (54.5%) | 20 (45.5%) |
| High School Diploma | 0 (0.0%) | 51 (100.0%) |
| College or Associate's Degree | 0 (0.0%) | 12 (100.0%) |
| Bachelor's Degree | 0 (0.0%) | 0 (0.0%) |
| Graduate Degree | 0 (0.0%) | 0 (0.0%) |
| Total | 24 (22.4%) | 83 (77.6%) |
Employment Characteristics in Pearl River
Employment by Class of Employer in Pearl River
Among the 1,607 employed individuals in Pearl River, federal government employees (736 | 45.8%), private company employees (655 | 40.8%), and local government employees (126 | 7.8%) make up the most common classes of employment.
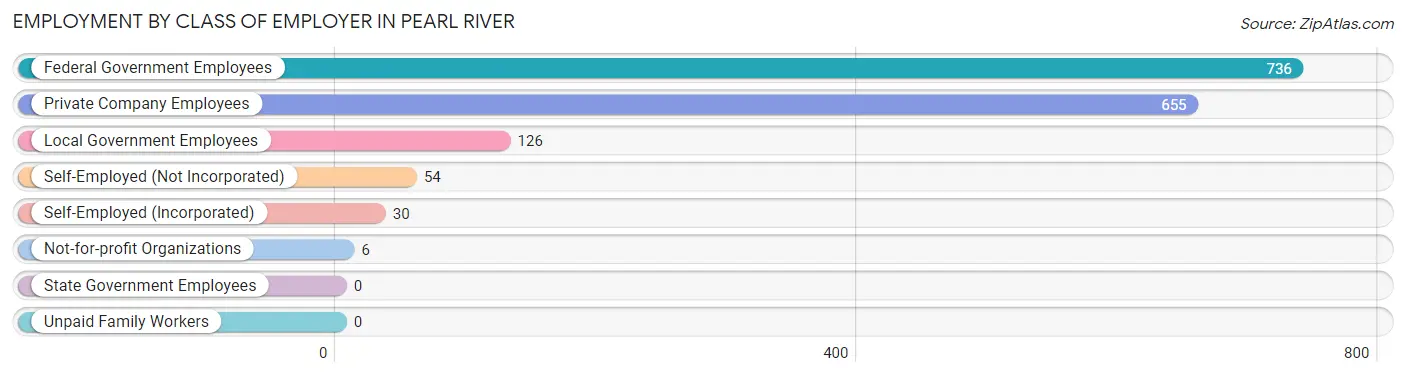
| Employer Class | # Employees | % Employees |
| Private Company Employees | 655 | 40.8% |
| Self-Employed (Incorporated) | 30 | 1.9% |
| Self-Employed (Not Incorporated) | 54 | 3.4% |
| Not-for-profit Organizations | 6 | 0.4% |
| Local Government Employees | 126 | 7.8% |
| State Government Employees | 0 | 0.0% |
| Federal Government Employees | 736 | 45.8% |
| Unpaid Family Workers | 0 | 0.0% |
| Total | 1,607 | 100.0% |
Employment Status by Age in Pearl River
According to the labor force statistics for Pearl River, out of the total population over 16 years of age (3,105), 59.2% or 1,838 individuals are in the labor force, with 6.6% or 121 of them unemployed. The age group with the highest labor force participation rate is 45 to 54 years, with 86.1% or 354 individuals in the labor force. Within the labor force, the 16 to 19 years age range has the highest percentage of unemployed individuals, with 100.0% or 21 of them being unemployed.
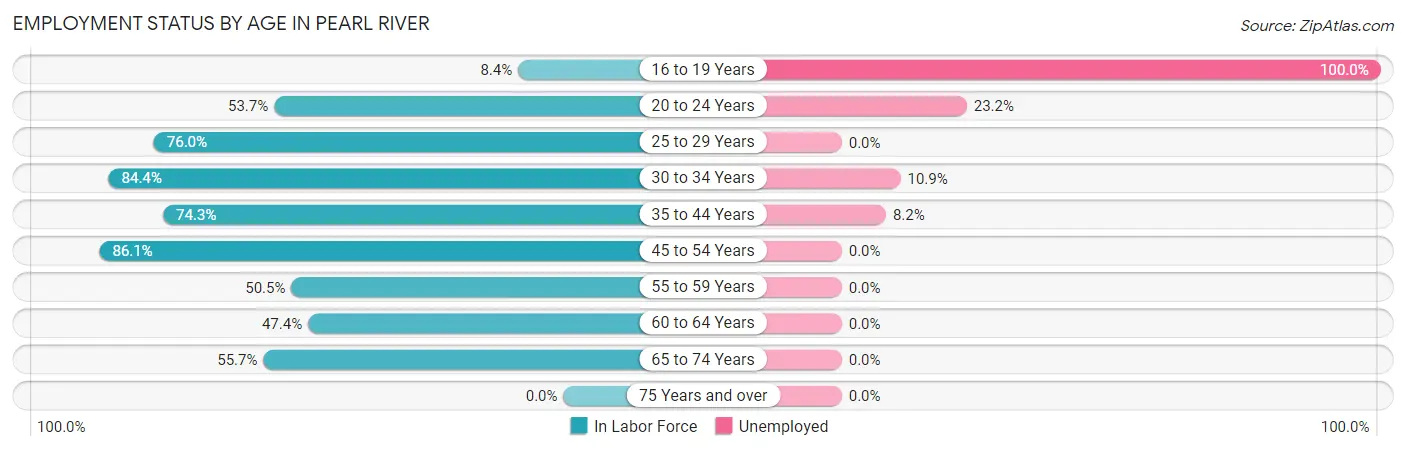
| Age Bracket | In Labor Force | Unemployed |
| 16 to 19 Years | 21 (8.4%) | 21 (100.0%) |
| 20 to 24 Years | 138 (53.7%) | 32 (23.2%) |
| 25 to 29 Years | 241 (76.0%) | 0 (0.0%) |
| 30 to 34 Years | 293 (84.4%) | 32 (10.9%) |
| 35 to 44 Years | 426 (74.3%) | 35 (8.2%) |
| 45 to 54 Years | 354 (86.1%) | 0 (0.0%) |
| 55 to 59 Years | 112 (50.5%) | 0 (0.0%) |
| 60 to 64 Years | 46 (47.4%) | 0 (0.0%) |
| 65 to 74 Years | 206 (55.7%) | 0 (0.0%) |
| 75 Years and over | 0 (0.0%) | 0 (0.0%) |
| Total | 1,838 (59.2%) | 121 (6.6%) |
Employment Status by Educational Attainment in Pearl River
According to labor force statistics for Pearl River, 74.8% of individuals (1,471) out of the total population between 25 and 64 years of age (1,967) are in the labor force, with 4.6% or 68 of them being unemployed. The group with the highest labor force participation rate are those with the educational attainment of bachelor's degree or higher, with 100.0% or 129 individuals in the labor force. Within the labor force, individuals with high school diploma education have the highest percentage of unemployment, with 8.1% or 26 of them being unemployed.
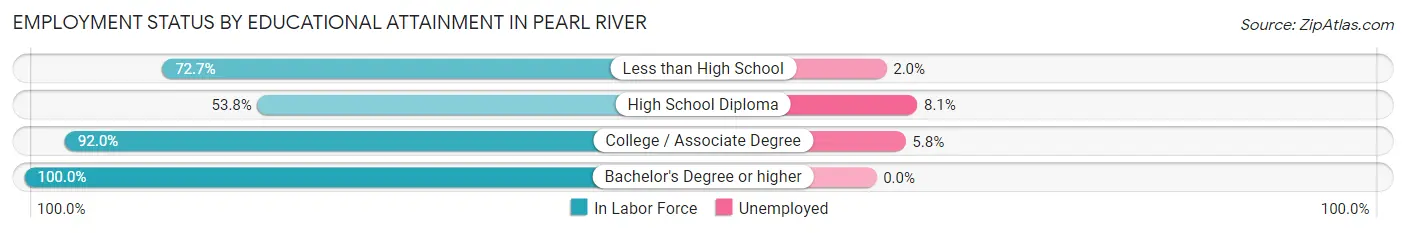
| Educational Attainment | In Labor Force | Unemployed |
| Less than High School | 447 (72.7%) | 12 (2.0%) |
| High School Diploma | 322 (53.8%) | 49 (8.1%) |
| College / Associate Degree | 574 (92.0%) | 36 (5.8%) |
| Bachelor's Degree or higher | 129 (100.0%) | 0 (0.0%) |
| Total | 1,471 (74.8%) | 90 (4.6%) |
Employment Occupations by Sex in Pearl River
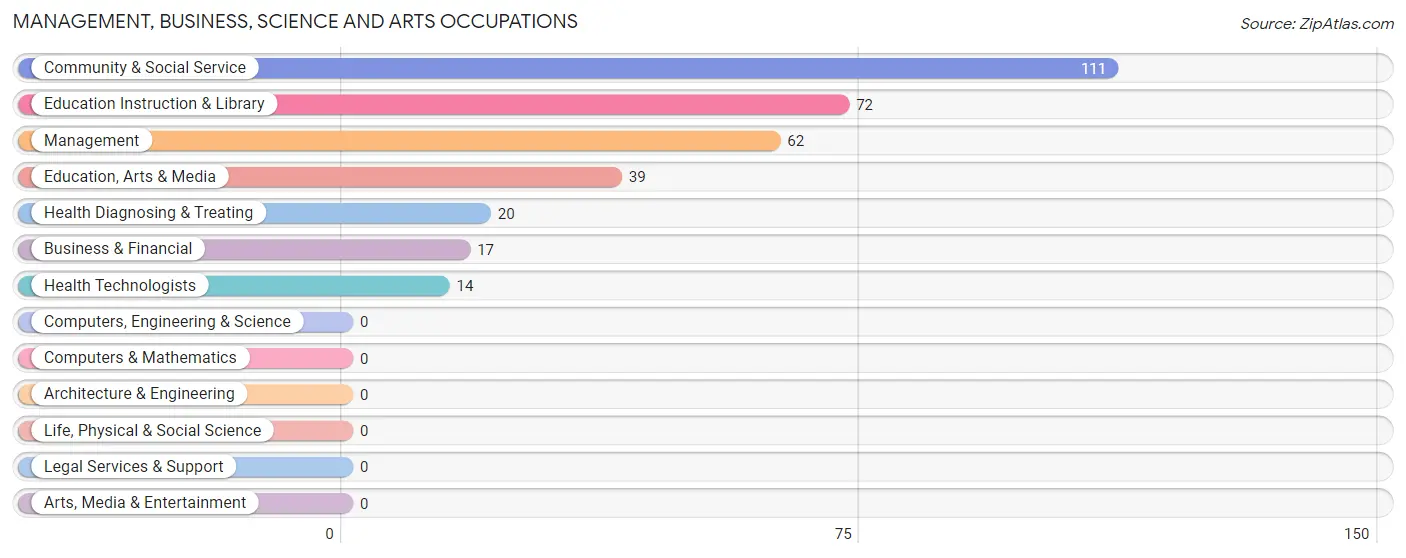
Management, Business, Science and Arts Occupations
The most common Management, Business, Science and Arts occupations in Pearl River are Community & Social Service (111 | 6.6%), Education Instruction & Library (72 | 4.3%), Management (62 | 3.7%), Education, Arts & Media (39 | 2.3%), and Health Diagnosing & Treating (20 | 1.2%).
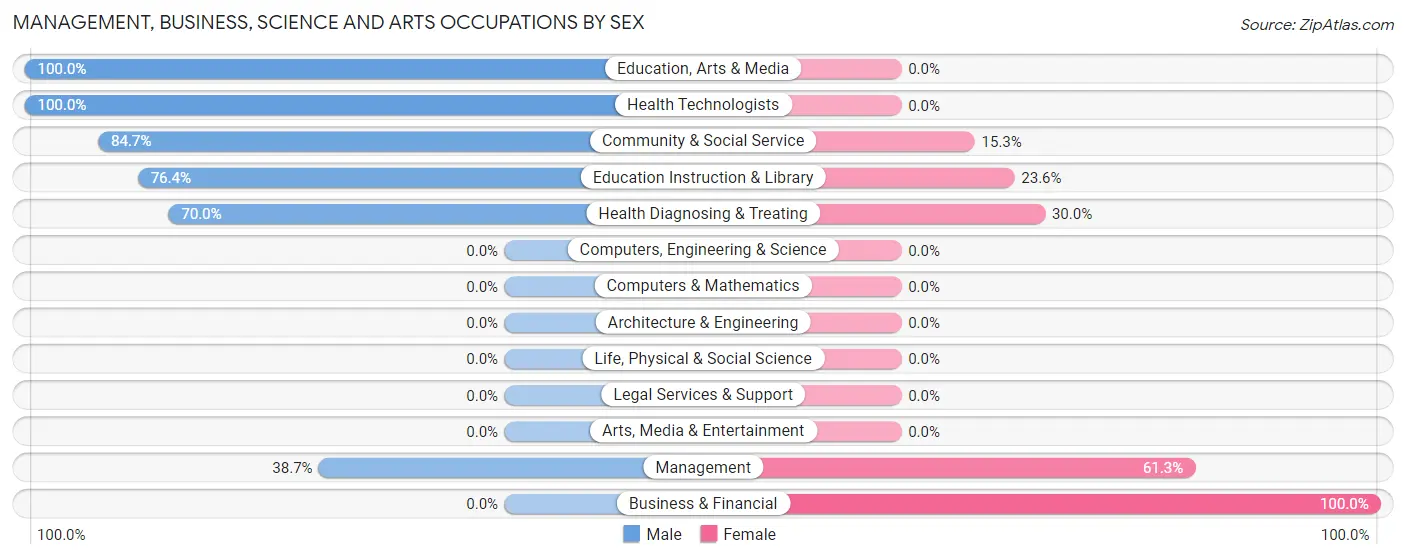
Management, Business, Science and Arts Occupations by Sex
Within the Management, Business, Science and Arts occupations in Pearl River, the most male-oriented occupations are Education, Arts & Media (100.0%), Health Technologists (100.0%), and Community & Social Service (84.7%), while the most female-oriented occupations are Business & Financial (100.0%), Management (61.3%), and Health Diagnosing & Treating (30.0%).
| Occupation | Male | Female |
| Management | 24 (38.7%) | 38 (61.3%) |
| Business & Financial | 0 (0.0%) | 17 (100.0%) |
| Computers, Engineering & Science | 0 (0.0%) | 0 (0.0%) |
| Computers & Mathematics | 0 (0.0%) | 0 (0.0%) |
| Architecture & Engineering | 0 (0.0%) | 0 (0.0%) |
| Life, Physical & Social Science | 0 (0.0%) | 0 (0.0%) |
| Community & Social Service | 94 (84.7%) | 17 (15.3%) |
| Education, Arts & Media | 39 (100.0%) | 0 (0.0%) |
| Legal Services & Support | 0 (0.0%) | 0 (0.0%) |
| Education Instruction & Library | 55 (76.4%) | 17 (23.6%) |
| Arts, Media & Entertainment | 0 (0.0%) | 0 (0.0%) |
| Health Diagnosing & Treating | 14 (70.0%) | 6 (30.0%) |
| Health Technologists | 14 (100.0%) | 0 (0.0%) |
| Total (Category) | 132 (62.9%) | 78 (37.1%) |
| Total (Overall) | 820 (48.4%) | 875 (51.6%) |
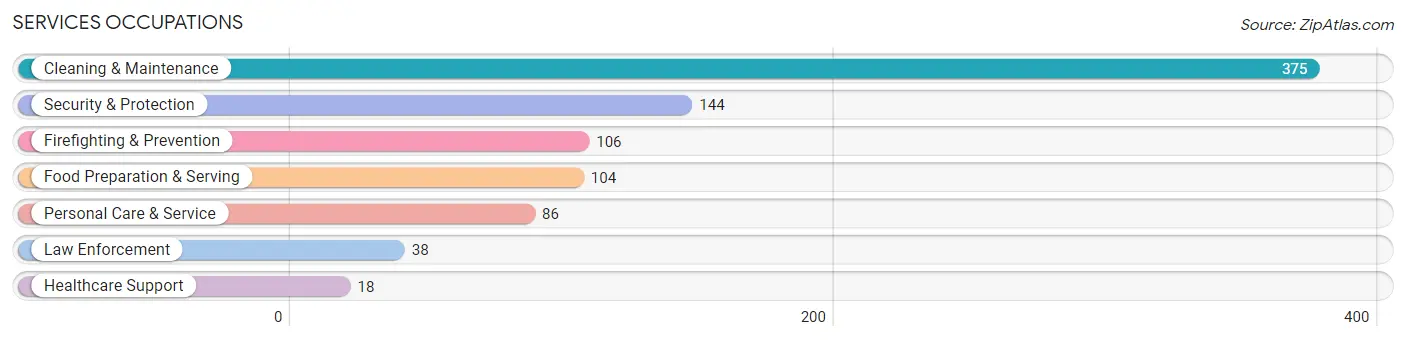
Services Occupations
The most common Services occupations in Pearl River are Cleaning & Maintenance (375 | 22.1%), Security & Protection (144 | 8.5%), Firefighting & Prevention (106 | 6.2%), Food Preparation & Serving (104 | 6.1%), and Personal Care & Service (86 | 5.1%).
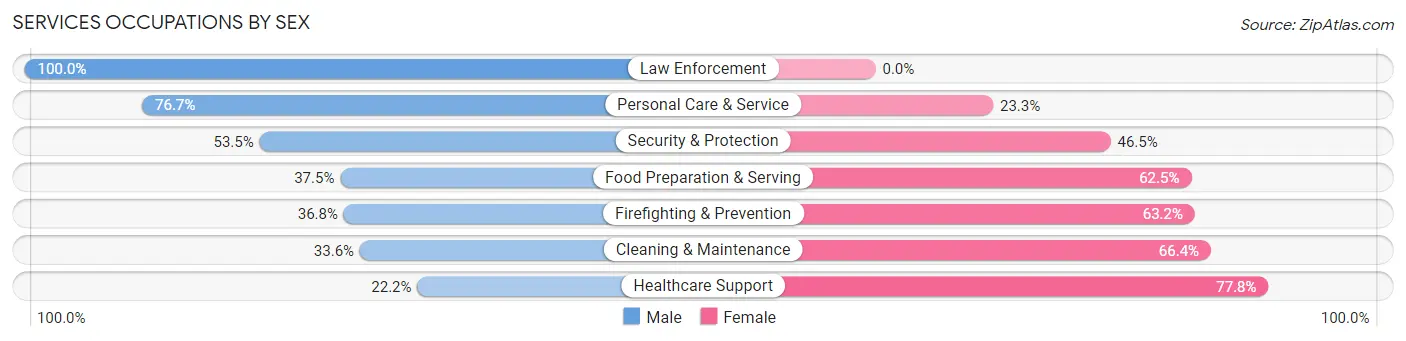
Services Occupations by Sex
Within the Services occupations in Pearl River, the most male-oriented occupations are Law Enforcement (100.0%), Personal Care & Service (76.7%), and Security & Protection (53.5%), while the most female-oriented occupations are Healthcare Support (77.8%), Cleaning & Maintenance (66.4%), and Firefighting & Prevention (63.2%).
| Occupation | Male | Female |
| Healthcare Support | 4 (22.2%) | 14 (77.8%) |
| Security & Protection | 77 (53.5%) | 67 (46.5%) |
| Firefighting & Prevention | 39 (36.8%) | 67 (63.2%) |
| Law Enforcement | 38 (100.0%) | 0 (0.0%) |
| Food Preparation & Serving | 39 (37.5%) | 65 (62.5%) |
| Cleaning & Maintenance | 126 (33.6%) | 249 (66.4%) |
| Personal Care & Service | 66 (76.7%) | 20 (23.3%) |
| Total (Category) | 312 (42.9%) | 415 (57.1%) |
| Total (Overall) | 820 (48.4%) | 875 (51.6%) |
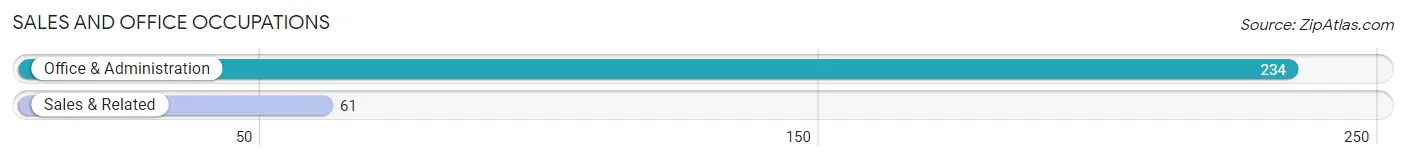
Sales and Office Occupations
The most common Sales and Office occupations in Pearl River are Office & Administration (234 | 13.8%), and Sales & Related (61 | 3.6%).
Sales and Office Occupations by Sex
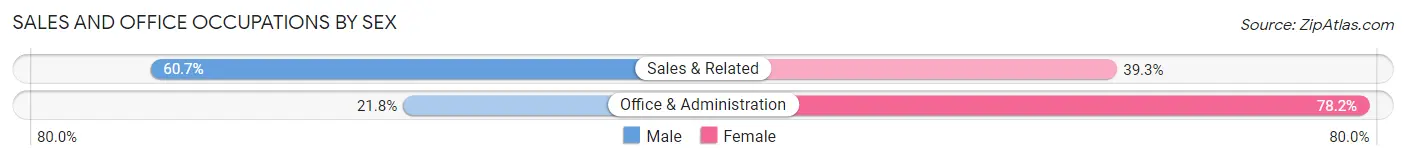
| Occupation | Male | Female |
| Sales & Related | 37 (60.7%) | 24 (39.3%) |
| Office & Administration | 51 (21.8%) | 183 (78.2%) |
| Total (Category) | 88 (29.8%) | 207 (70.2%) |
| Total (Overall) | 820 (48.4%) | 875 (51.6%) |
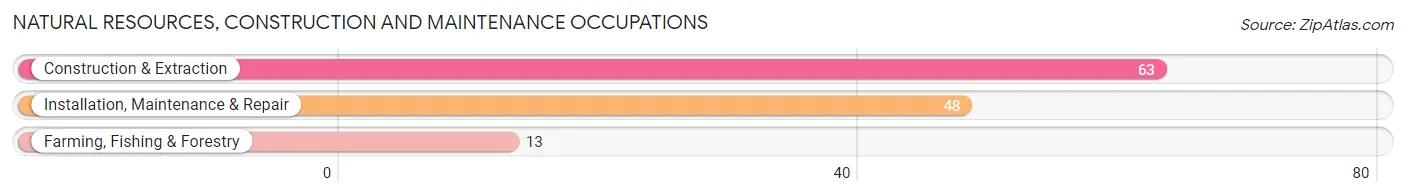
Natural Resources, Construction and Maintenance Occupations
The most common Natural Resources, Construction and Maintenance occupations in Pearl River are Construction & Extraction (63 | 3.7%), Installation, Maintenance & Repair (48 | 2.8%), and Farming, Fishing & Forestry (13 | 0.8%).
Natural Resources, Construction and Maintenance Occupations by Sex
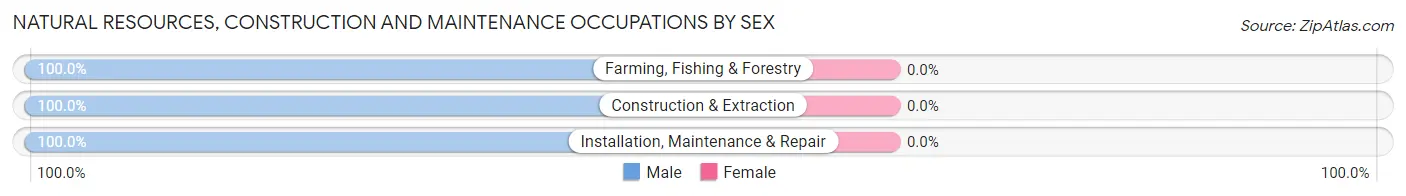
| Occupation | Male | Female |
| Farming, Fishing & Forestry | 13 (100.0%) | 0 (0.0%) |
| Construction & Extraction | 63 (100.0%) | 0 (0.0%) |
| Installation, Maintenance & Repair | 48 (100.0%) | 0 (0.0%) |
| Total (Category) | 124 (100.0%) | 0 (0.0%) |
| Total (Overall) | 820 (48.4%) | 875 (51.6%) |
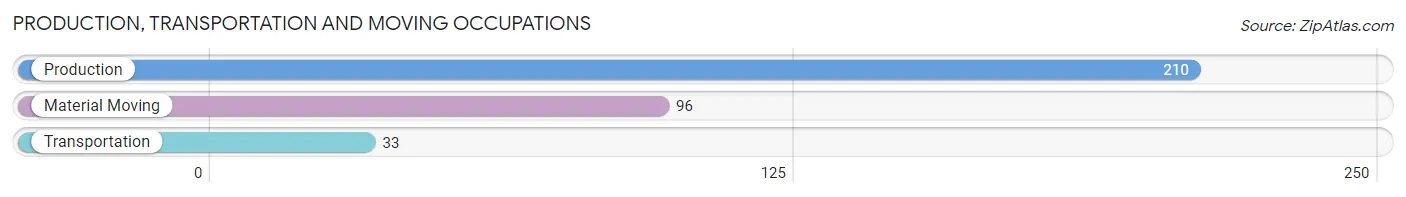
Production, Transportation and Moving Occupations
The most common Production, Transportation and Moving occupations in Pearl River are Production (210 | 12.4%), Material Moving (96 | 5.7%), and Transportation (33 | 1.9%).
Production, Transportation and Moving Occupations by Sex
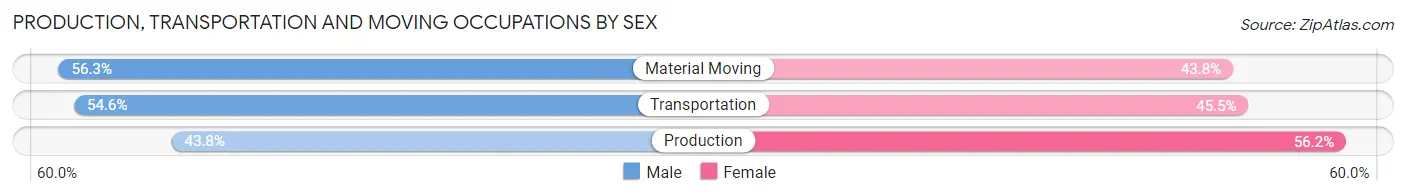
| Occupation | Male | Female |
| Production | 92 (43.8%) | 118 (56.2%) |
| Transportation | 18 (54.5%) | 15 (45.5%) |
| Material Moving | 54 (56.2%) | 42 (43.8%) |
| Total (Category) | 164 (48.4%) | 175 (51.6%) |
| Total (Overall) | 820 (48.4%) | 875 (51.6%) |
Employment Industries by Sex in Pearl River
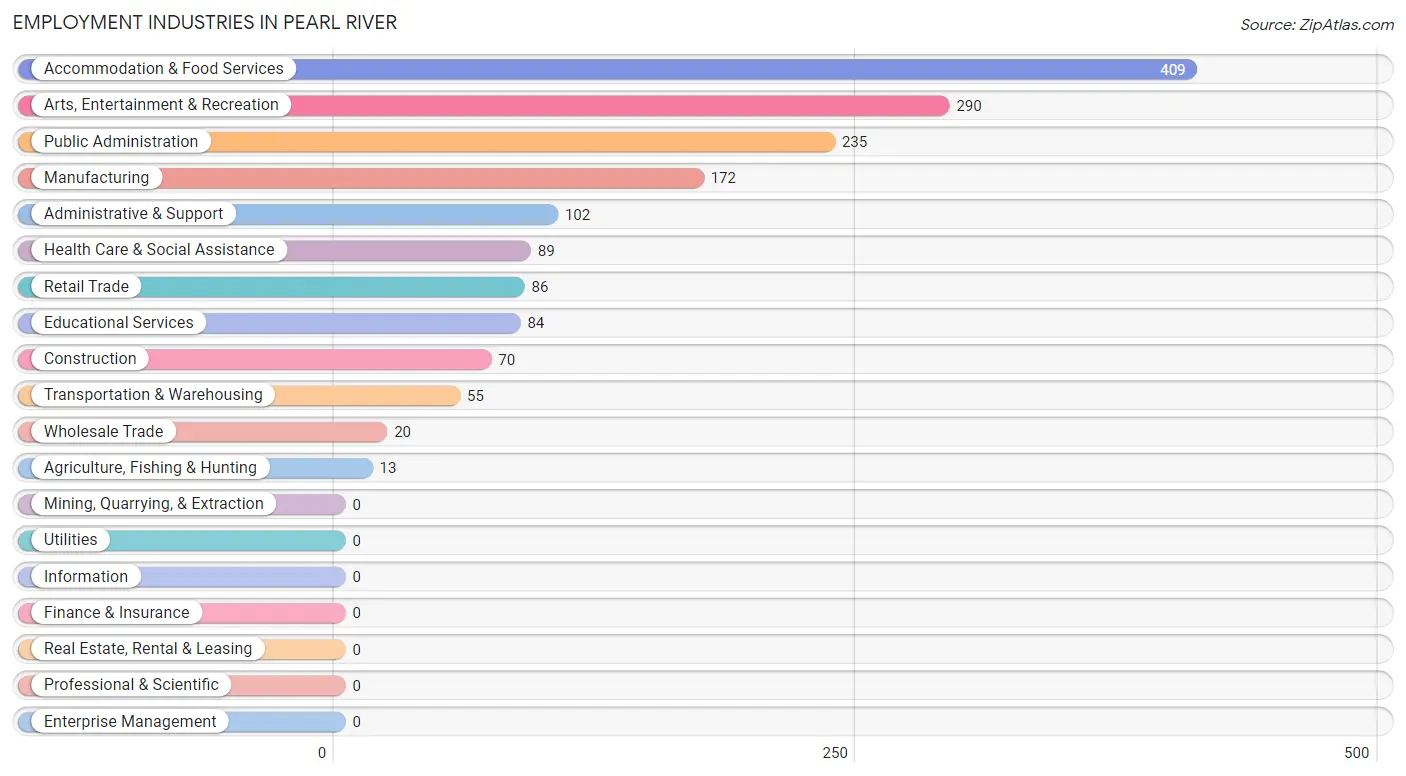
Employment Industries in Pearl River
The major employment industries in Pearl River include Accommodation & Food Services (409 | 24.1%), Arts, Entertainment & Recreation (290 | 17.1%), Public Administration (235 | 13.9%), Manufacturing (172 | 10.2%), and Administrative & Support (102 | 6.0%).
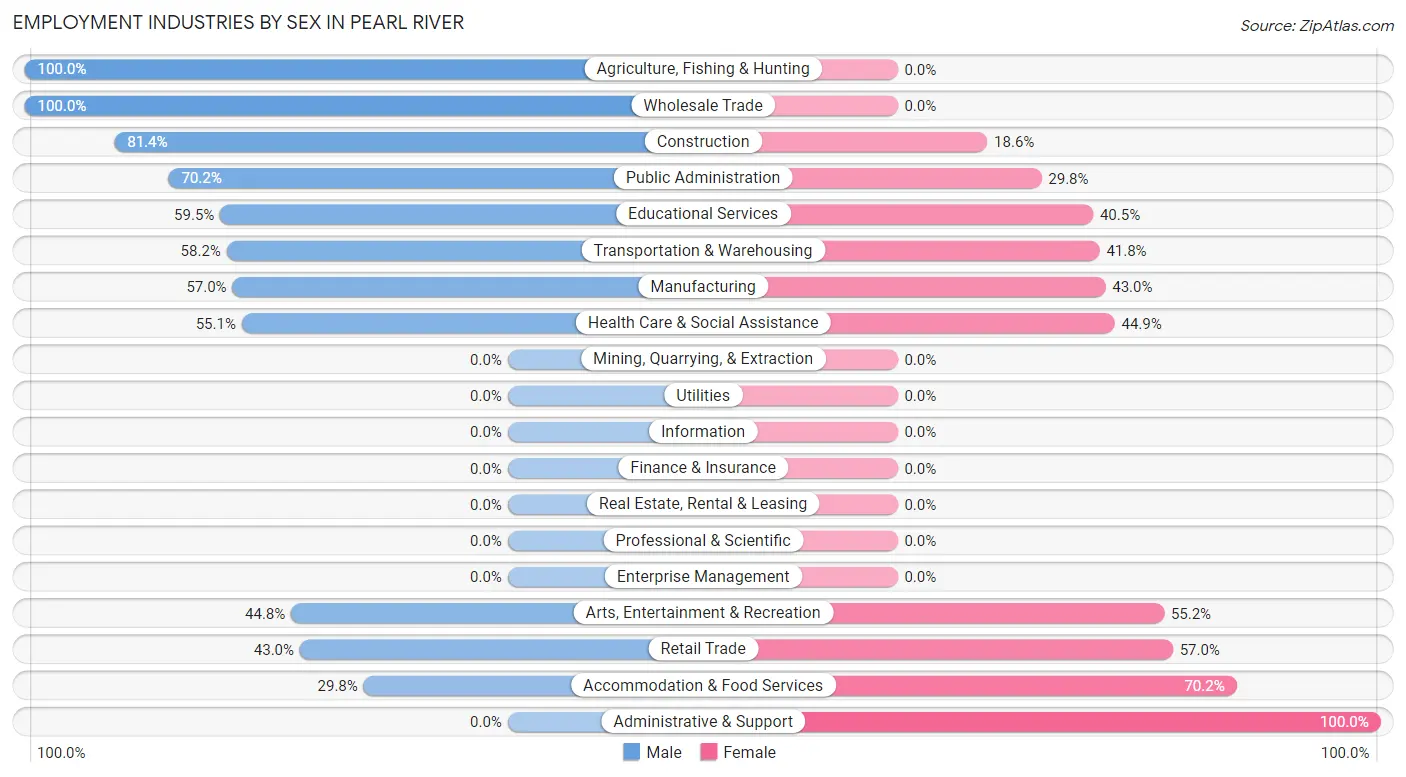
Employment Industries by Sex in Pearl River
The Pearl River industries that see more men than women are Agriculture, Fishing & Hunting (100.0%), Wholesale Trade (100.0%), and Construction (81.4%), whereas the industries that tend to have a higher number of women are Administrative & Support (100.0%), Accommodation & Food Services (70.2%), and Retail Trade (57.0%).
| Industry | Male | Female |
| Agriculture, Fishing & Hunting | 13 (100.0%) | 0 (0.0%) |
| Mining, Quarrying, & Extraction | 0 (0.0%) | 0 (0.0%) |
| Construction | 57 (81.4%) | 13 (18.6%) |
| Manufacturing | 98 (57.0%) | 74 (43.0%) |
| Wholesale Trade | 20 (100.0%) | 0 (0.0%) |
| Retail Trade | 37 (43.0%) | 49 (57.0%) |
| Transportation & Warehousing | 32 (58.2%) | 23 (41.8%) |
| Utilities | 0 (0.0%) | 0 (0.0%) |
| Information | 0 (0.0%) | 0 (0.0%) |
| Finance & Insurance | 0 (0.0%) | 0 (0.0%) |
| Real Estate, Rental & Leasing | 0 (0.0%) | 0 (0.0%) |
| Professional & Scientific | 0 (0.0%) | 0 (0.0%) |
| Enterprise Management | 0 (0.0%) | 0 (0.0%) |
| Administrative & Support | 0 (0.0%) | 102 (100.0%) |
| Educational Services | 50 (59.5%) | 34 (40.5%) |
| Health Care & Social Assistance | 49 (55.1%) | 40 (44.9%) |
| Arts, Entertainment & Recreation | 130 (44.8%) | 160 (55.2%) |
| Accommodation & Food Services | 122 (29.8%) | 287 (70.2%) |
| Public Administration | 165 (70.2%) | 70 (29.8%) |
| Total | 820 (48.4%) | 875 (51.6%) |
Education in Pearl River
School Enrollment in Pearl River
The most common levels of schooling among the 1,394 students in Pearl River are middle school (455 | 32.6%), high school (346 | 24.8%), and college / undergraduate (239 | 17.1%).
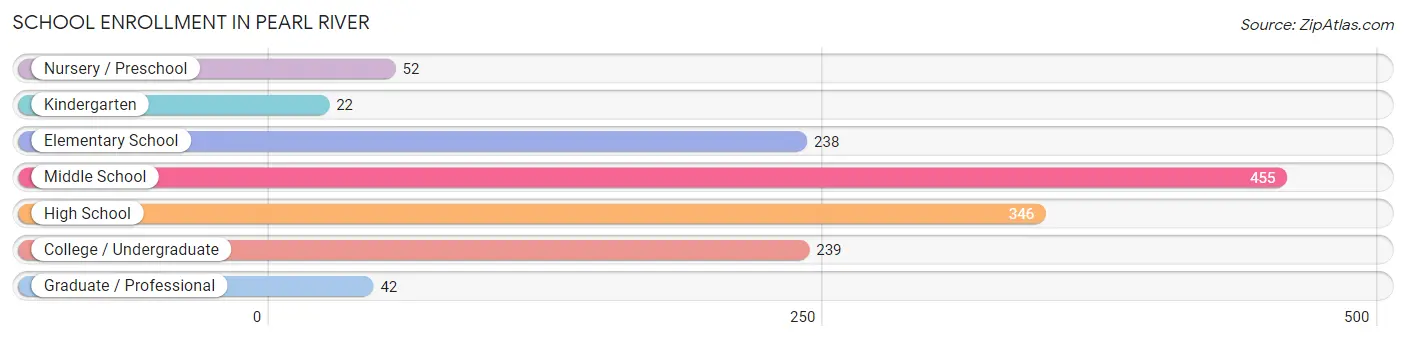
| School Level | # Students | % Students |
| Nursery / Preschool | 52 | 3.7% |
| Kindergarten | 22 | 1.6% |
| Elementary School | 238 | 17.1% |
| Middle School | 455 | 32.6% |
| High School | 346 | 24.8% |
| College / Undergraduate | 239 | 17.1% |
| Graduate / Professional | 42 | 3.0% |
| Total | 1,394 | 100.0% |
School Enrollment by Age by Funding Source in Pearl River
Out of a total of 1,394 students who are enrolled in schools in Pearl River, 291 (20.9%) attend a private institution, while the remaining 1,103 (79.1%) are enrolled in public schools. The age group of 10 to 14 year olds has the highest likelihood of being enrolled in private schools, with 192 (37.2% in the age bracket) enrolled. Conversely, the age group of 3 to 4 year olds has the lowest likelihood of being enrolled in a private school, with 24 (100.0% in the age bracket) attending a public institution.
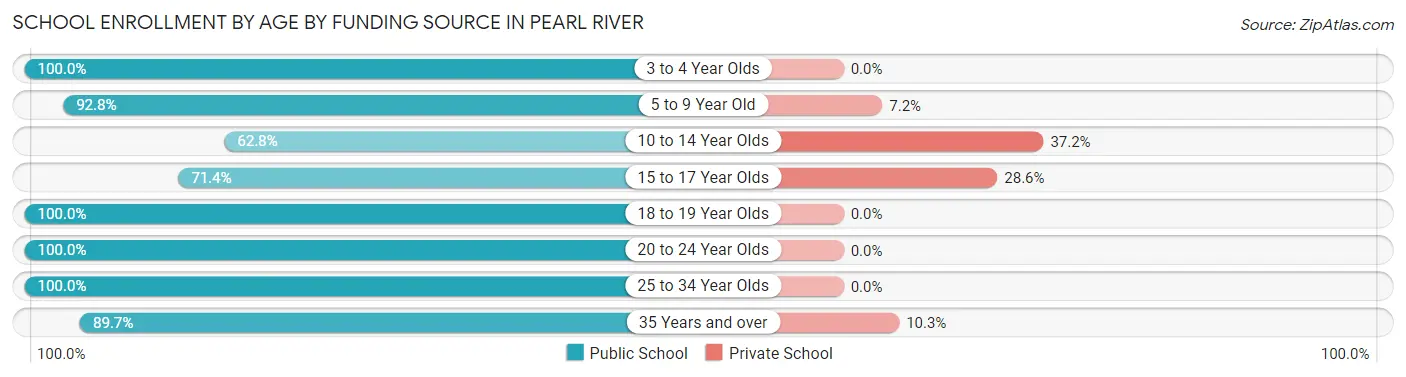
| Age Bracket | Public School | Private School |
| 3 to 4 Year Olds | 24 (100.0%) | 0 (0.0%) |
| 5 to 9 Year Old | 232 (92.8%) | 18 (7.2%) |
| 10 to 14 Year Olds | 324 (62.8%) | 192 (37.2%) |
| 15 to 17 Year Olds | 182 (71.4%) | 73 (28.6%) |
| 18 to 19 Year Olds | 60 (100.0%) | 0 (0.0%) |
| 20 to 24 Year Olds | 135 (100.0%) | 0 (0.0%) |
| 25 to 34 Year Olds | 67 (100.0%) | 0 (0.0%) |
| 35 Years and over | 78 (89.7%) | 9 (10.3%) |
| Total | 1,103 (79.1%) | 291 (20.9%) |
Educational Attainment by Field of Study in Pearl River
Business (66 | 33.5%), multidisciplinary studies (26 | 13.2%), physical & health sciences (23 | 11.7%), bio, nature & agricultural (20 | 10.2%), and education (16 | 8.1%) are the most common fields of study among 197 individuals in Pearl River who have obtained a bachelor's degree or higher.
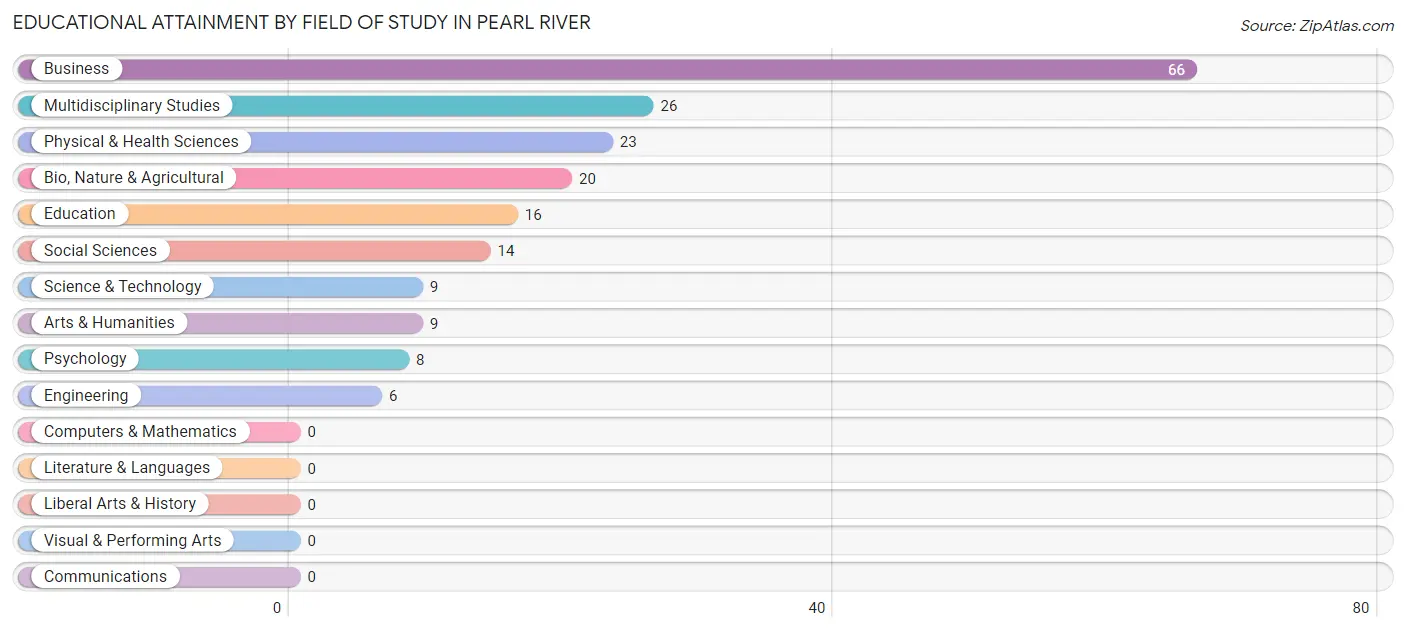
| Field of Study | # Graduates | % Graduates |
| Computers & Mathematics | 0 | 0.0% |
| Bio, Nature & Agricultural | 20 | 10.2% |
| Physical & Health Sciences | 23 | 11.7% |
| Psychology | 8 | 4.1% |
| Social Sciences | 14 | 7.1% |
| Engineering | 6 | 3.0% |
| Multidisciplinary Studies | 26 | 13.2% |
| Science & Technology | 9 | 4.6% |
| Business | 66 | 33.5% |
| Education | 16 | 8.1% |
| Literature & Languages | 0 | 0.0% |
| Liberal Arts & History | 0 | 0.0% |
| Visual & Performing Arts | 0 | 0.0% |
| Communications | 0 | 0.0% |
| Arts & Humanities | 9 | 4.6% |
| Total | 197 | 100.0% |
Transportation & Commute in Pearl River
Vehicle Availability by Sex in Pearl River
The most prevalent vehicle ownership categories in Pearl River are males with 2 vehicles (184, accounting for 23.8%) and females with 2 vehicles (179, making up 22.0%).
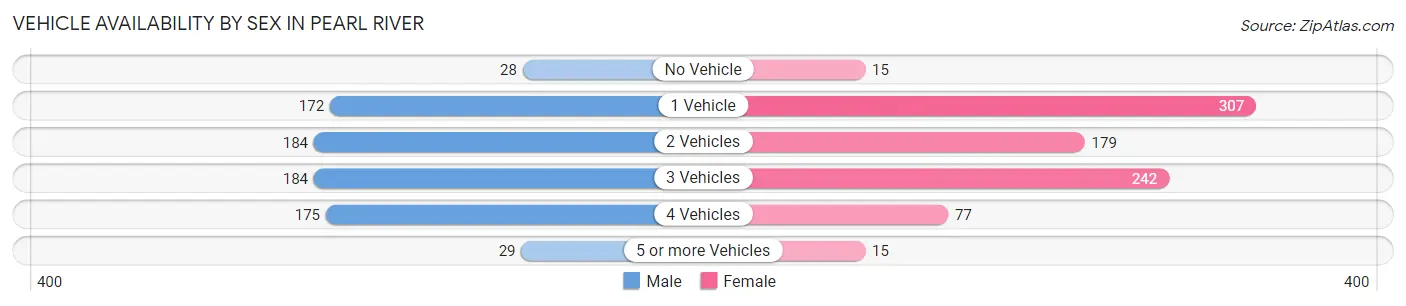
| Vehicles Available | Male | Female |
| No Vehicle | 28 (3.6%) | 15 (1.8%) |
| 1 Vehicle | 172 (22.3%) | 307 (36.8%) |
| 2 Vehicles | 184 (23.8%) | 179 (21.4%) |
| 3 Vehicles | 184 (23.8%) | 242 (29.0%) |
| 4 Vehicles | 175 (22.7%) | 77 (9.2%) |
| 5 or more Vehicles | 29 (3.8%) | 15 (1.8%) |
| Total | 772 (100.0%) | 835 (100.0%) |
Commute Time in Pearl River
The most frequently occuring commute durations in Pearl River are 5 to 9 minutes (590 commuters, 36.7%), less than 5 minutes (249 commuters, 15.5%), and 10 to 14 minutes (237 commuters, 14.7%).
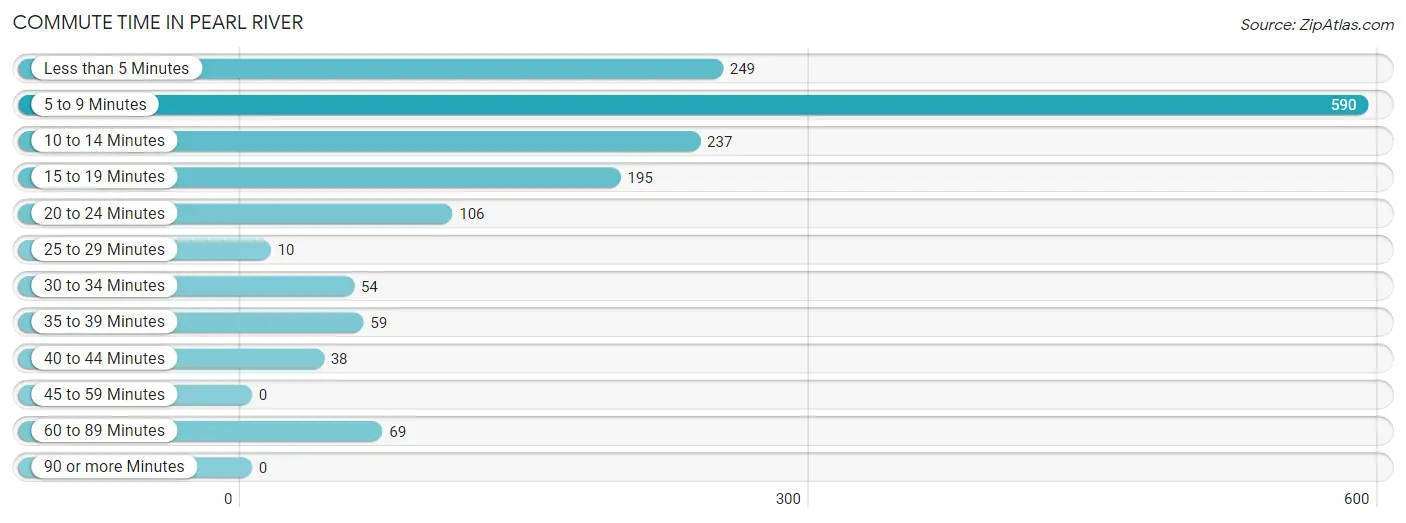
| Commute Time | # Commuters | % Commuters |
| Less than 5 Minutes | 249 | 15.5% |
| 5 to 9 Minutes | 590 | 36.7% |
| 10 to 14 Minutes | 237 | 14.7% |
| 15 to 19 Minutes | 195 | 12.1% |
| 20 to 24 Minutes | 106 | 6.6% |
| 25 to 29 Minutes | 10 | 0.6% |
| 30 to 34 Minutes | 54 | 3.4% |
| 35 to 39 Minutes | 59 | 3.7% |
| 40 to 44 Minutes | 38 | 2.4% |
| 45 to 59 Minutes | 0 | 0.0% |
| 60 to 89 Minutes | 69 | 4.3% |
| 90 or more Minutes | 0 | 0.0% |
Commute Time by Sex in Pearl River
The most common commute times in Pearl River are 5 to 9 minutes (291 commuters, 37.7%) for males and 5 to 9 minutes (299 commuters, 35.8%) for females.
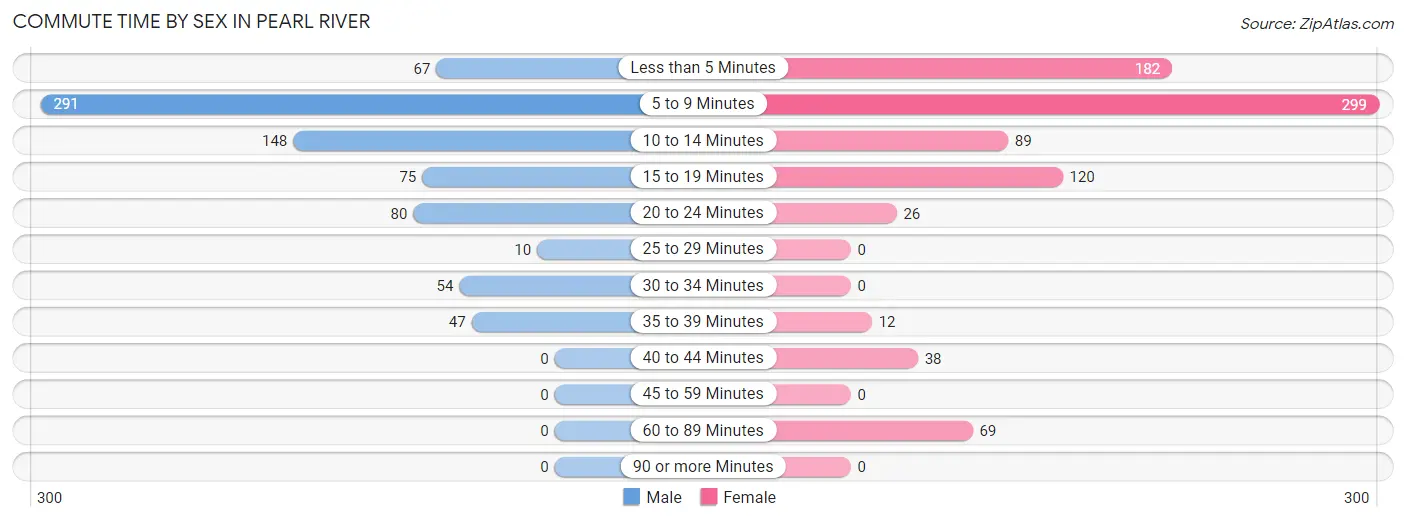
| Commute Time | Male | Female |
| Less than 5 Minutes | 67 (8.7%) | 182 (21.8%) |
| 5 to 9 Minutes | 291 (37.7%) | 299 (35.8%) |
| 10 to 14 Minutes | 148 (19.2%) | 89 (10.7%) |
| 15 to 19 Minutes | 75 (9.7%) | 120 (14.4%) |
| 20 to 24 Minutes | 80 (10.4%) | 26 (3.1%) |
| 25 to 29 Minutes | 10 (1.3%) | 0 (0.0%) |
| 30 to 34 Minutes | 54 (7.0%) | 0 (0.0%) |
| 35 to 39 Minutes | 47 (6.1%) | 12 (1.4%) |
| 40 to 44 Minutes | 0 (0.0%) | 38 (4.5%) |
| 45 to 59 Minutes | 0 (0.0%) | 0 (0.0%) |
| 60 to 89 Minutes | 0 (0.0%) | 69 (8.3%) |
| 90 or more Minutes | 0 (0.0%) | 0 (0.0%) |
Time of Departure to Work by Sex in Pearl River
The most frequent times of departure to work in Pearl River are 7:30 AM to 7:59 AM (129, 16.7%) for males and 4:00 PM to 11:59 PM (291, 34.8%) for females.
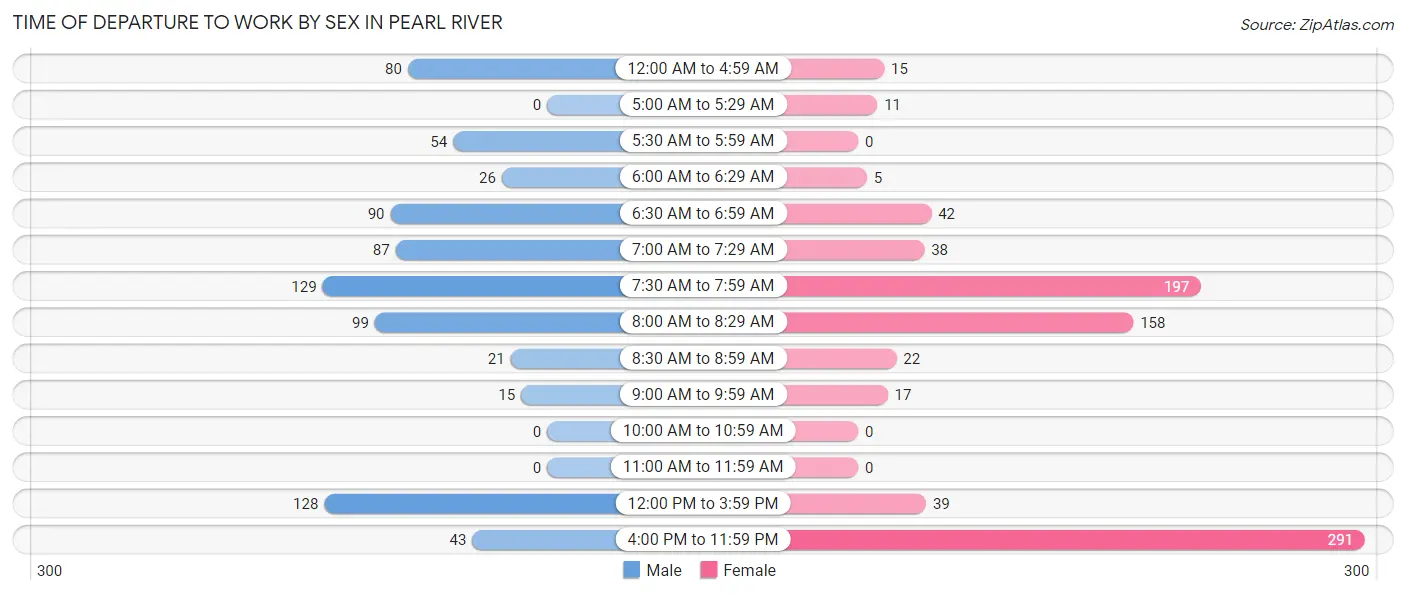
| Time of Departure | Male | Female |
| 12:00 AM to 4:59 AM | 80 (10.4%) | 15 (1.8%) |
| 5:00 AM to 5:29 AM | 0 (0.0%) | 11 (1.3%) |
| 5:30 AM to 5:59 AM | 54 (7.0%) | 0 (0.0%) |
| 6:00 AM to 6:29 AM | 26 (3.4%) | 5 (0.6%) |
| 6:30 AM to 6:59 AM | 90 (11.7%) | 42 (5.0%) |
| 7:00 AM to 7:29 AM | 87 (11.3%) | 38 (4.5%) |
| 7:30 AM to 7:59 AM | 129 (16.7%) | 197 (23.6%) |
| 8:00 AM to 8:29 AM | 99 (12.8%) | 158 (18.9%) |
| 8:30 AM to 8:59 AM | 21 (2.7%) | 22 (2.6%) |
| 9:00 AM to 9:59 AM | 15 (1.9%) | 17 (2.0%) |
| 10:00 AM to 10:59 AM | 0 (0.0%) | 0 (0.0%) |
| 11:00 AM to 11:59 AM | 0 (0.0%) | 0 (0.0%) |
| 12:00 PM to 3:59 PM | 128 (16.6%) | 39 (4.7%) |
| 4:00 PM to 11:59 PM | 43 (5.6%) | 291 (34.8%) |
| Total | 772 (100.0%) | 835 (100.0%) |
Housing Occupancy in Pearl River
Occupancy by Ownership in Pearl River
Of the total 1,263 dwellings in Pearl River, owner-occupied units account for 998 (79.0%), while renter-occupied units make up 265 (21.0%).
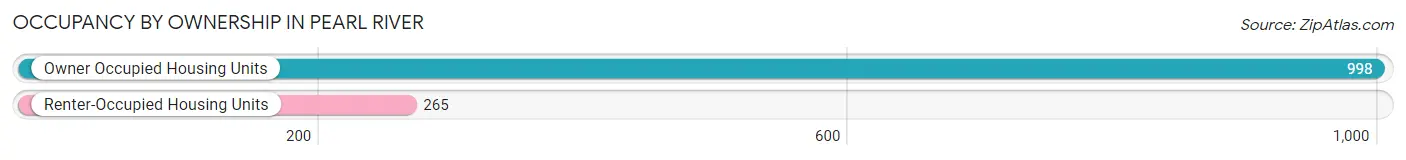
| Occupancy | # Housing Units | % Housing Units |
| Owner Occupied Housing Units | 998 | 79.0% |
| Renter-Occupied Housing Units | 265 | 21.0% |
| Total Occupied Housing Units | 1,263 | 100.0% |
Occupancy by Household Size in Pearl River
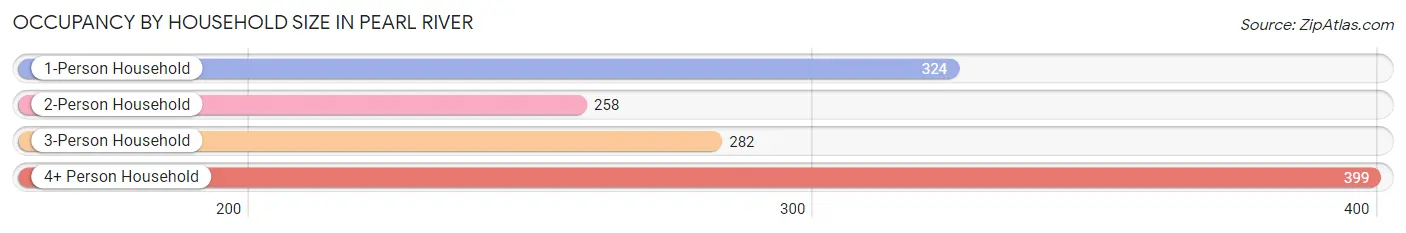
| Household Size | # Housing Units | % Housing Units |
| 1-Person Household | 324 | 25.7% |
| 2-Person Household | 258 | 20.4% |
| 3-Person Household | 282 | 22.3% |
| 4+ Person Household | 399 | 31.6% |
| Total Housing Units | 1,263 | 100.0% |
Occupancy by Ownership by Household Size in Pearl River
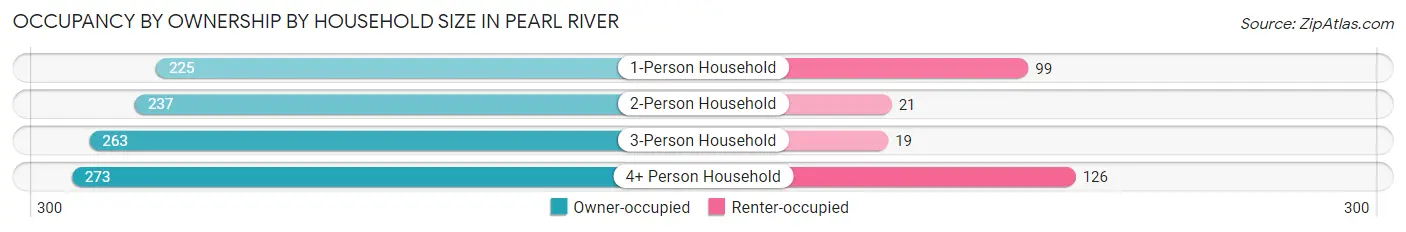
| Household Size | Owner-occupied | Renter-occupied |
| 1-Person Household | 225 (69.4%) | 99 (30.6%) |
| 2-Person Household | 237 (91.9%) | 21 (8.1%) |
| 3-Person Household | 263 (93.3%) | 19 (6.7%) |
| 4+ Person Household | 273 (68.4%) | 126 (31.6%) |
| Total Housing Units | 998 (79.0%) | 265 (21.0%) |
Occupancy by Educational Attainment in Pearl River
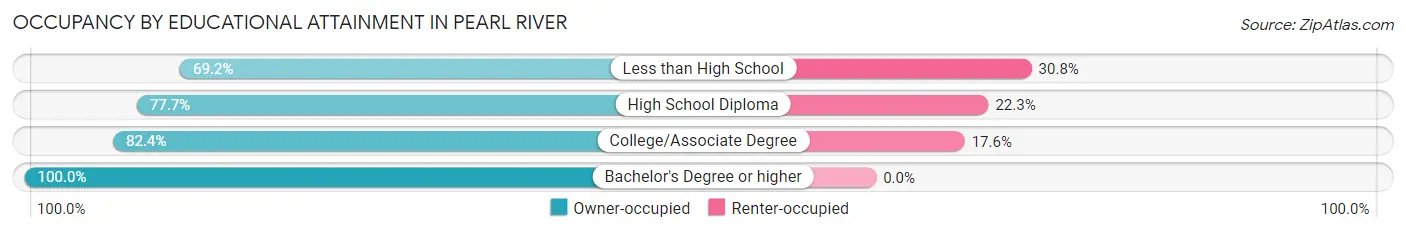
| Household Size | Owner-occupied | Renter-occupied |
| Less than High School | 267 (69.2%) | 119 (30.8%) |
| High School Diploma | 178 (77.7%) | 51 (22.3%) |
| College/Associate Degree | 446 (82.4%) | 95 (17.6%) |
| Bachelor's Degree or higher | 107 (100.0%) | 0 (0.0%) |
Occupancy by Age of Householder in Pearl River
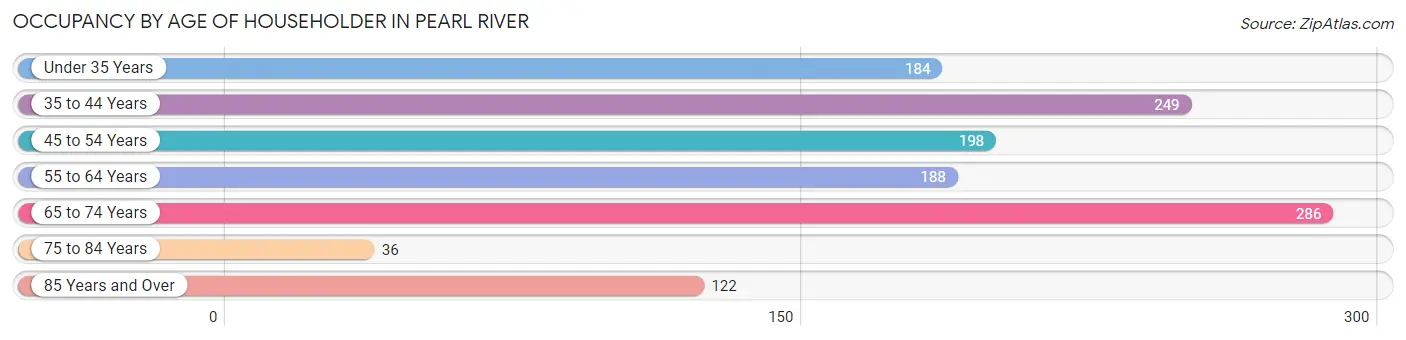
| Age Bracket | # Households | % Households |
| Under 35 Years | 184 | 14.6% |
| 35 to 44 Years | 249 | 19.7% |
| 45 to 54 Years | 198 | 15.7% |
| 55 to 64 Years | 188 | 14.9% |
| 65 to 74 Years | 286 | 22.6% |
| 75 to 84 Years | 36 | 2.9% |
| 85 Years and Over | 122 | 9.7% |
| Total | 1,263 | 100.0% |
Housing Finances in Pearl River
Median Income by Occupancy in Pearl River
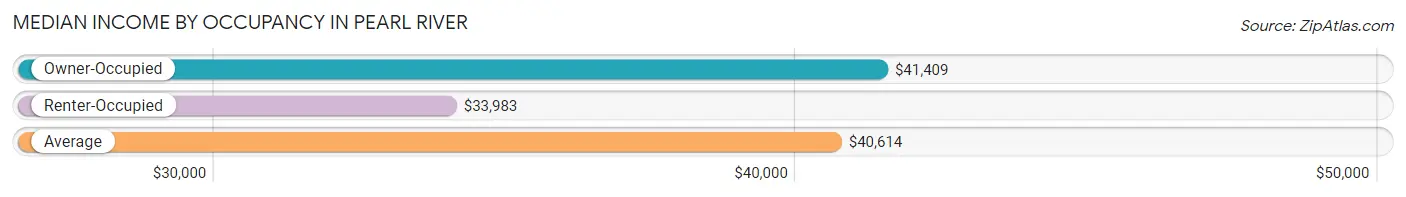
| Occupancy Type | # Households | Median Income |
| Owner-Occupied | 998 (79.0%) | $41,409 |
| Renter-Occupied | 265 (21.0%) | $33,983 |
| Average | 1,263 (100.0%) | $40,614 |
Occupancy by Householder Income Bracket in Pearl River
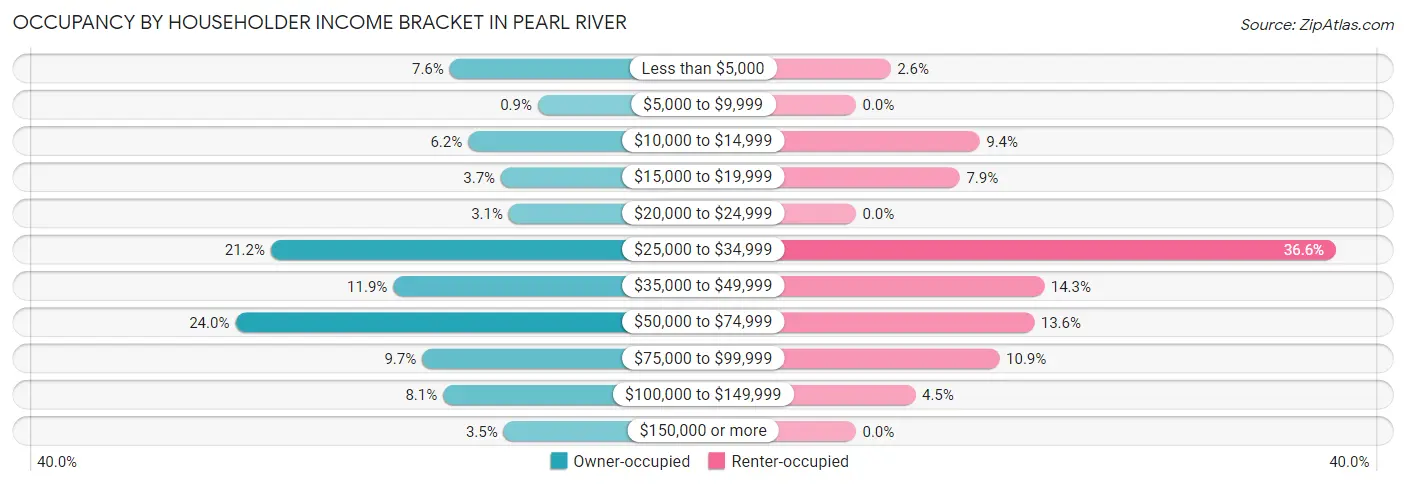
| Income Bracket | Owner-occupied | Renter-occupied |
| Less than $5,000 | 76 (7.6%) | 7 (2.6%) |
| $5,000 to $9,999 | 9 (0.9%) | 0 (0.0%) |
| $10,000 to $14,999 | 62 (6.2%) | 25 (9.4%) |
| $15,000 to $19,999 | 37 (3.7%) | 21 (7.9%) |
| $20,000 to $24,999 | 31 (3.1%) | 0 (0.0%) |
| $25,000 to $34,999 | 212 (21.2%) | 97 (36.6%) |
| $35,000 to $49,999 | 119 (11.9%) | 38 (14.3%) |
| $50,000 to $74,999 | 239 (23.9%) | 36 (13.6%) |
| $75,000 to $99,999 | 97 (9.7%) | 29 (10.9%) |
| $100,000 to $149,999 | 81 (8.1%) | 12 (4.5%) |
| $150,000 or more | 35 (3.5%) | 0 (0.0%) |
| Total | 998 (100.0%) | 265 (100.0%) |
Monthly Housing Cost Tiers in Pearl River
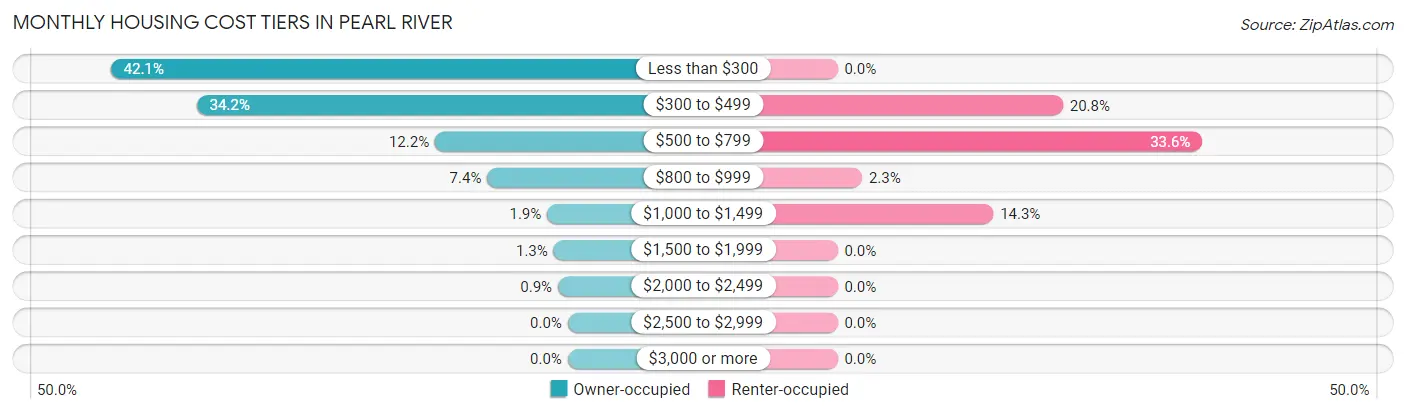
| Monthly Cost | Owner-occupied | Renter-occupied |
| Less than $300 | 420 (42.1%) | 0 (0.0%) |
| $300 to $499 | 341 (34.2%) | 55 (20.7%) |
| $500 to $799 | 122 (12.2%) | 89 (33.6%) |
| $800 to $999 | 74 (7.4%) | 6 (2.3%) |
| $1,000 to $1,499 | 19 (1.9%) | 38 (14.3%) |
| $1,500 to $1,999 | 13 (1.3%) | 0 (0.0%) |
| $2,000 to $2,499 | 9 (0.9%) | 0 (0.0%) |
| $2,500 to $2,999 | 0 (0.0%) | 0 (0.0%) |
| $3,000 or more | 0 (0.0%) | 0 (0.0%) |
| Total | 998 (100.0%) | 265 (100.0%) |
Physical Housing Characteristics in Pearl River
Housing Structures in Pearl River
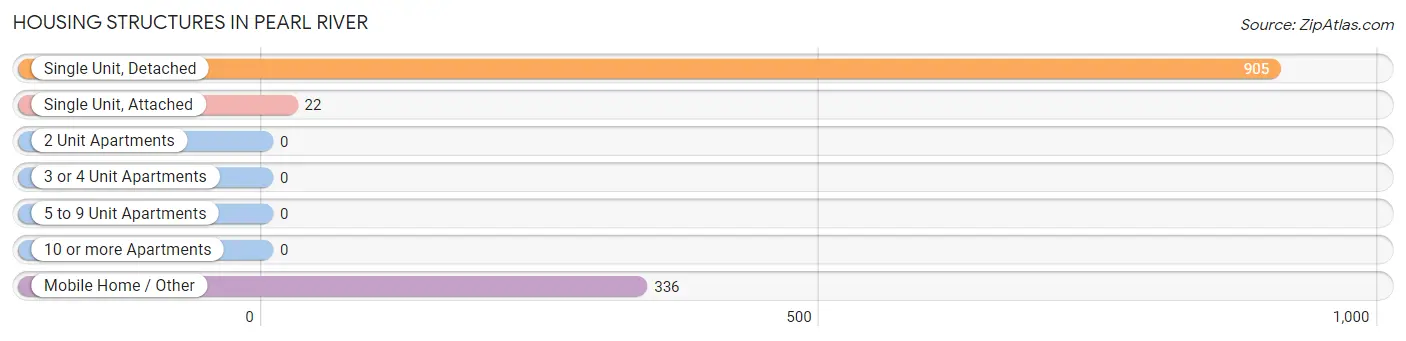
| Structure Type | # Housing Units | % Housing Units |
| Single Unit, Detached | 905 | 71.7% |
| Single Unit, Attached | 22 | 1.7% |
| 2 Unit Apartments | 0 | 0.0% |
| 3 or 4 Unit Apartments | 0 | 0.0% |
| 5 to 9 Unit Apartments | 0 | 0.0% |
| 10 or more Apartments | 0 | 0.0% |
| Mobile Home / Other | 336 | 26.6% |
| Total | 1,263 | 100.0% |
Housing Structures by Occupancy in Pearl River
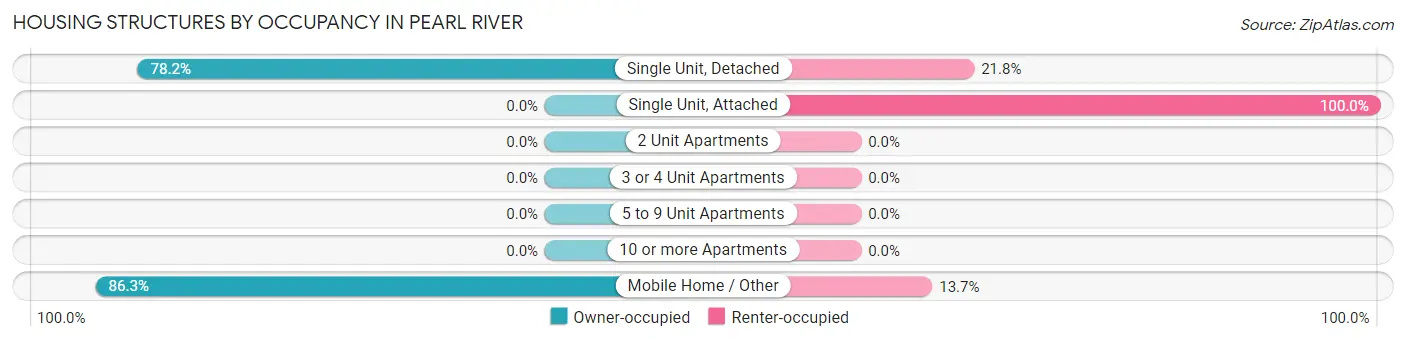
| Structure Type | Owner-occupied | Renter-occupied |
| Single Unit, Detached | 708 (78.2%) | 197 (21.8%) |
| Single Unit, Attached | 0 (0.0%) | 22 (100.0%) |
| 2 Unit Apartments | 0 (0.0%) | 0 (0.0%) |
| 3 or 4 Unit Apartments | 0 (0.0%) | 0 (0.0%) |
| 5 to 9 Unit Apartments | 0 (0.0%) | 0 (0.0%) |
| 10 or more Apartments | 0 (0.0%) | 0 (0.0%) |
| Mobile Home / Other | 290 (86.3%) | 46 (13.7%) |
| Total | 998 (79.0%) | 265 (21.0%) |
Housing Structures by Number of Rooms in Pearl River
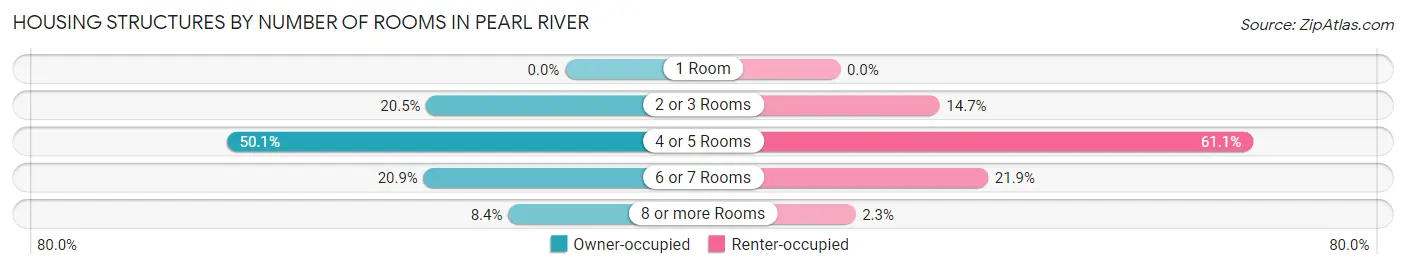
| Number of Rooms | Owner-occupied | Renter-occupied |
| 1 Room | 0 (0.0%) | 0 (0.0%) |
| 2 or 3 Rooms | 205 (20.5%) | 39 (14.7%) |
| 4 or 5 Rooms | 500 (50.1%) | 162 (61.1%) |
| 6 or 7 Rooms | 209 (20.9%) | 58 (21.9%) |
| 8 or more Rooms | 84 (8.4%) | 6 (2.3%) |
| Total | 998 (100.0%) | 265 (100.0%) |
Housing Structure by Heating Type in Pearl River
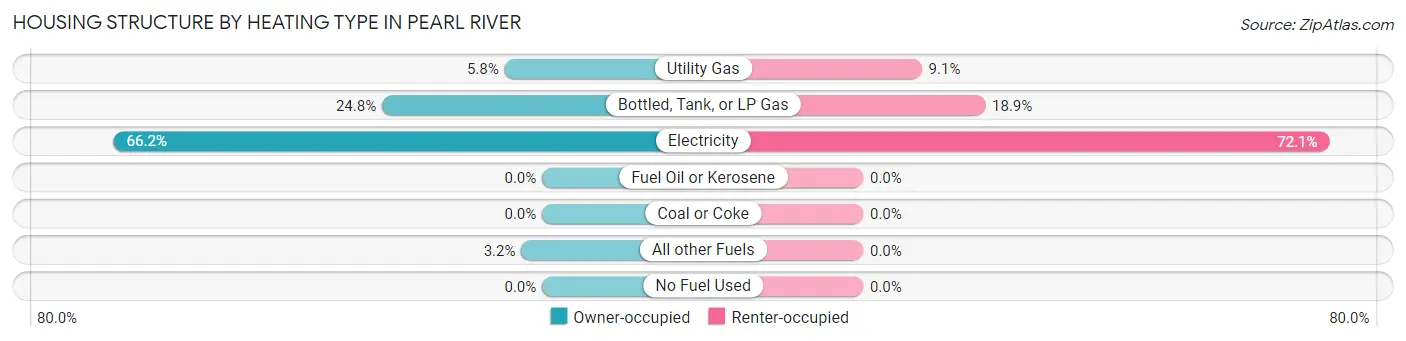
| Heating Type | Owner-occupied | Renter-occupied |
| Utility Gas | 58 (5.8%) | 24 (9.1%) |
| Bottled, Tank, or LP Gas | 247 (24.7%) | 50 (18.9%) |
| Electricity | 661 (66.2%) | 191 (72.1%) |
| Fuel Oil or Kerosene | 0 (0.0%) | 0 (0.0%) |
| Coal or Coke | 0 (0.0%) | 0 (0.0%) |
| All other Fuels | 32 (3.2%) | 0 (0.0%) |
| No Fuel Used | 0 (0.0%) | 0 (0.0%) |
| Total | 998 (100.0%) | 265 (100.0%) |
Household Vehicle Usage in Pearl River
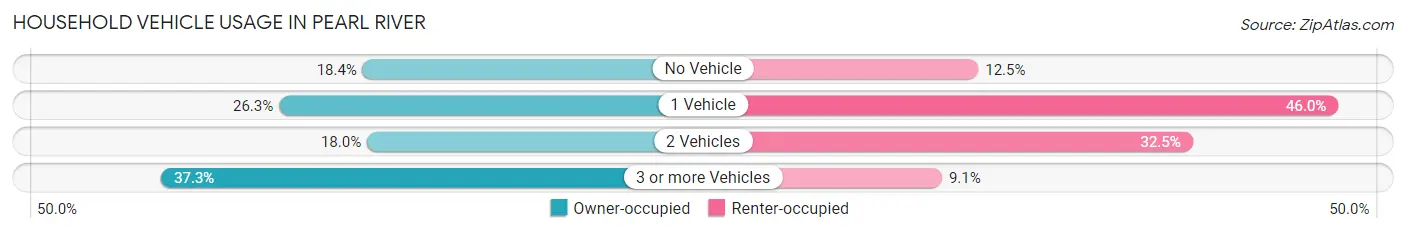
| Vehicles per Household | Owner-occupied | Renter-occupied |
| No Vehicle | 184 (18.4%) | 33 (12.4%) |
| 1 Vehicle | 262 (26.3%) | 122 (46.0%) |
| 2 Vehicles | 180 (18.0%) | 86 (32.5%) |
| 3 or more Vehicles | 372 (37.3%) | 24 (9.1%) |
| Total | 998 (100.0%) | 265 (100.0%) |
Real Estate & Mortgages in Pearl River
Real Estate and Mortgage Overview in Pearl River
| Characteristic | Without Mortgage | With Mortgage |
| Housing Units | 796 | 202 |
| Median Property Value | $53,000 | $88,700 |
| Median Household Income | $41,125 | $0 |
| Monthly Housing Costs | $294 | $0 |
| Real Estate Taxes | - | - |
Property Value by Mortgage Status in Pearl River
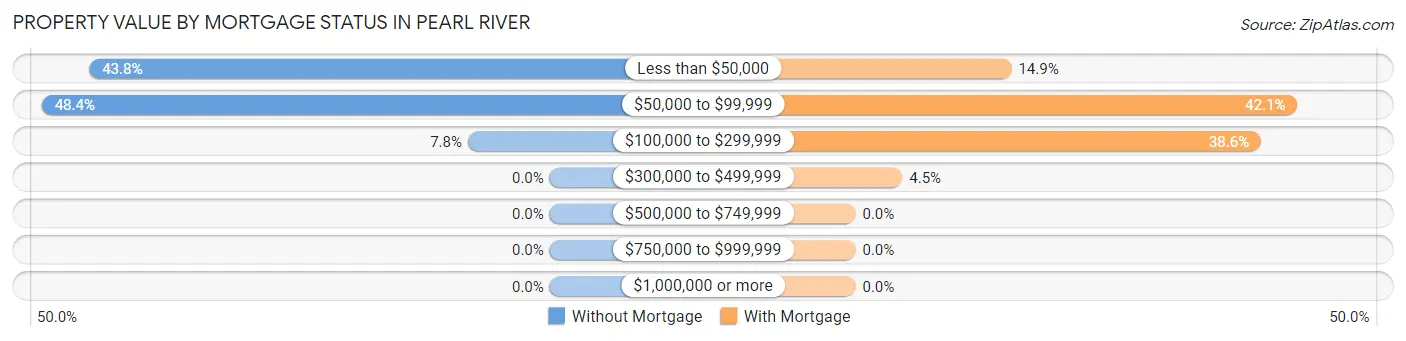
| Property Value | Without Mortgage | With Mortgage |
| Less than $50,000 | 349 (43.8%) | 30 (14.8%) |
| $50,000 to $99,999 | 385 (48.4%) | 85 (42.1%) |
| $100,000 to $299,999 | 62 (7.8%) | 78 (38.6%) |
| $300,000 to $499,999 | 0 (0.0%) | 9 (4.5%) |
| $500,000 to $749,999 | 0 (0.0%) | 0 (0.0%) |
| $750,000 to $999,999 | 0 (0.0%) | 0 (0.0%) |
| $1,000,000 or more | 0 (0.0%) | 0 (0.0%) |
| Total | 796 (100.0%) | 202 (100.0%) |
Household Income by Mortgage Status in Pearl River
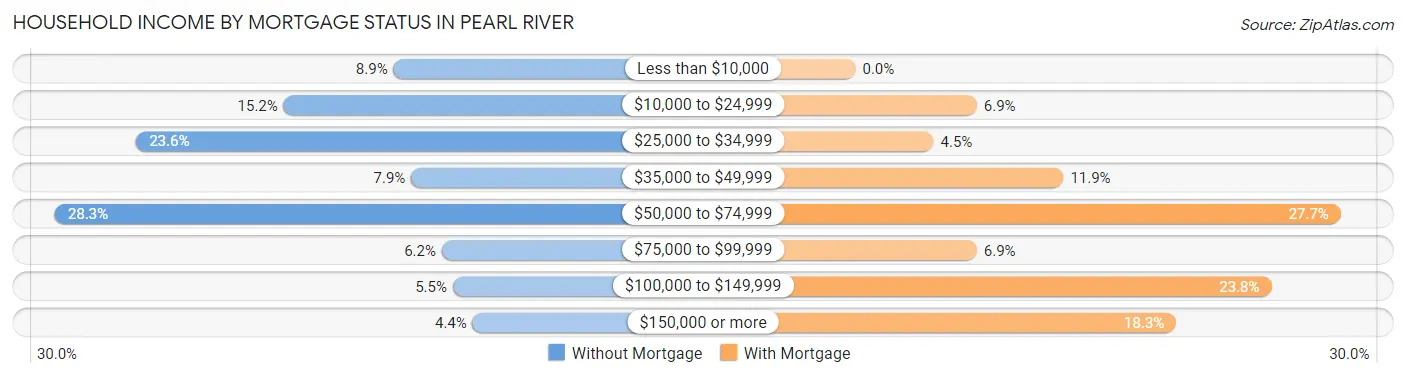
| Household Income | Without Mortgage | With Mortgage |
| Less than $10,000 | 71 (8.9%) | 0 (0.0%) |
| $10,000 to $24,999 | 121 (15.2%) | 14 (6.9%) |
| $25,000 to $34,999 | 188 (23.6%) | 9 (4.5%) |
| $35,000 to $49,999 | 63 (7.9%) | 24 (11.9%) |
| $50,000 to $74,999 | 225 (28.3%) | 56 (27.7%) |
| $75,000 to $99,999 | 49 (6.2%) | 14 (6.9%) |
| $100,000 to $149,999 | 44 (5.5%) | 48 (23.8%) |
| $150,000 or more | 35 (4.4%) | 37 (18.3%) |
| Total | 796 (100.0%) | 202 (100.0%) |
Property Value to Household Income Ratio in Pearl River
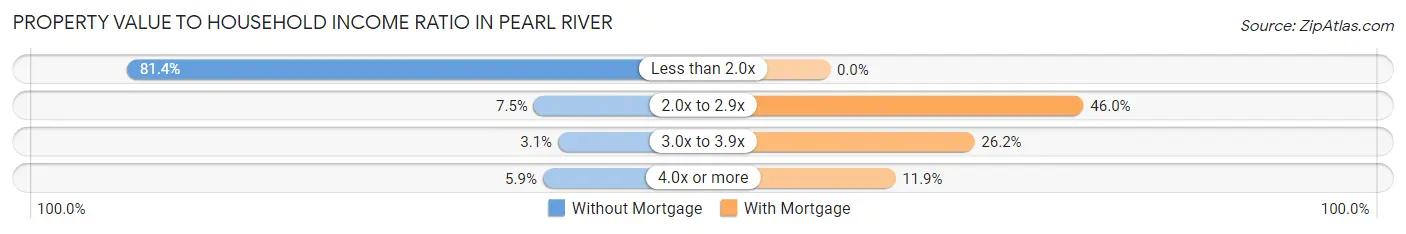
| Value-to-Income Ratio | Without Mortgage | With Mortgage |
| Less than 2.0x | 648 (81.4%) | 0 (0.0%) |
| 2.0x to 2.9x | 60 (7.5%) | 93 (46.0%) |
| 3.0x to 3.9x | 25 (3.1%) | 53 (26.2%) |
| 4.0x or more | 47 (5.9%) | 24 (11.9%) |
| Total | 796 (100.0%) | 202 (100.0%) |
Real Estate Taxes by Mortgage Status in Pearl River
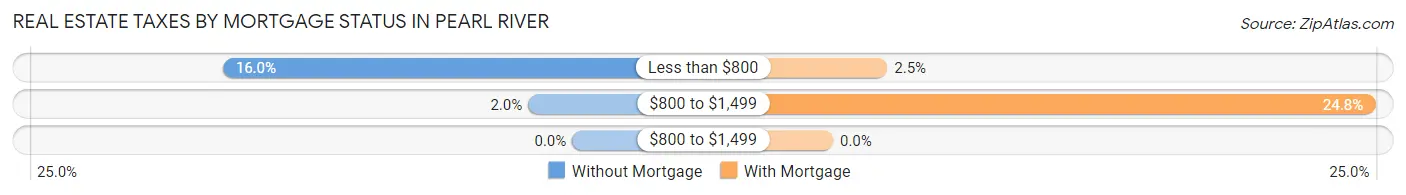
| Property Taxes | Without Mortgage | With Mortgage |
| Less than $800 | 127 (16.0%) | 5 (2.5%) |
| $800 to $1,499 | 16 (2.0%) | 50 (24.7%) |
| $800 to $1,499 | 0 (0.0%) | 0 (0.0%) |
| Total | 796 (100.0%) | 202 (100.0%) |
Health & Disability in Pearl River
Health Insurance Coverage by Age in Pearl River
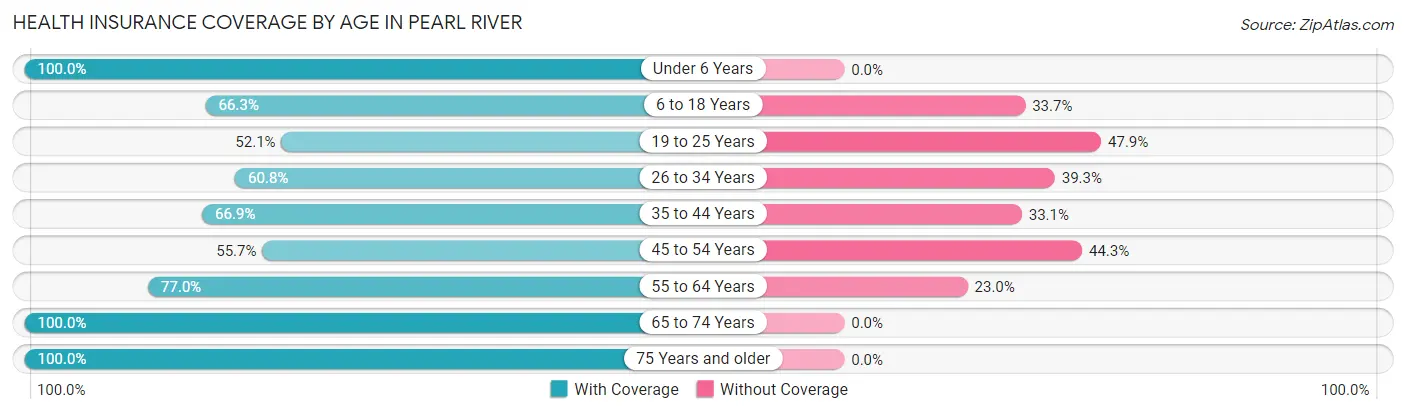
| Age Bracket | With Coverage | Without Coverage |
| Under 6 Years | 357 (100.0%) | 0 (0.0%) |
| 6 to 18 Years | 705 (66.3%) | 359 (33.7%) |
| 19 to 25 Years | 198 (52.1%) | 182 (47.9%) |
| 26 to 34 Years | 322 (60.8%) | 208 (39.3%) |
| 35 to 44 Years | 380 (66.9%) | 188 (33.1%) |
| 45 to 54 Years | 226 (55.7%) | 180 (44.3%) |
| 55 to 64 Years | 241 (77.0%) | 72 (23.0%) |
| 65 to 74 Years | 331 (100.0%) | 0 (0.0%) |
| 75 Years and older | 184 (100.0%) | 0 (0.0%) |
| Total | 2,944 (71.2%) | 1,189 (28.8%) |
Health Insurance Coverage by Citizenship Status in Pearl River
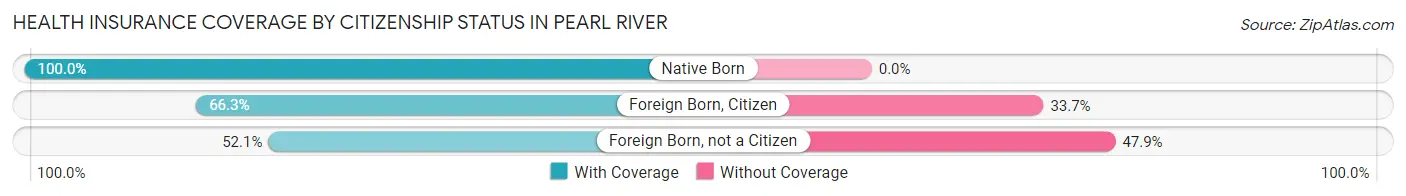
| Citizenship Status | With Coverage | Without Coverage |
| Native Born | 357 (100.0%) | 0 (0.0%) |
| Foreign Born, Citizen | 705 (66.3%) | 359 (33.7%) |
| Foreign Born, not a Citizen | 198 (52.1%) | 182 (47.9%) |
Health Insurance Coverage by Household Income in Pearl River
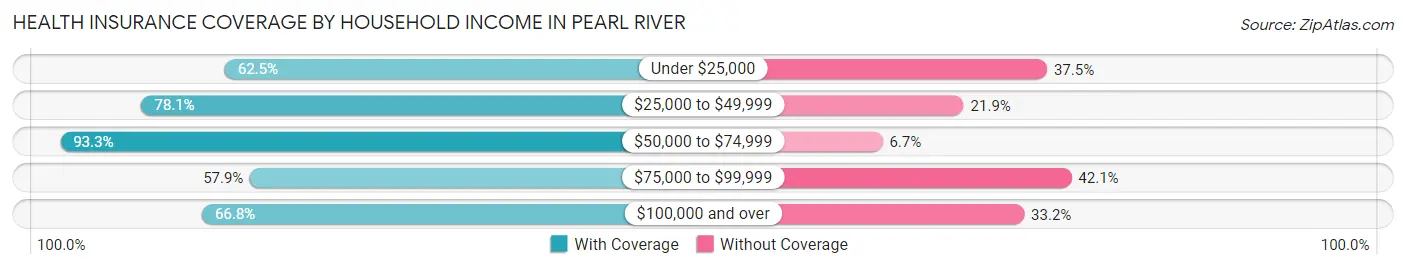
| Household Income | With Coverage | Without Coverage |
| Under $25,000 | 618 (62.5%) | 371 (37.5%) |
| $25,000 to $49,999 | 960 (78.1%) | 269 (21.9%) |
| $50,000 to $74,999 | 531 (93.3%) | 38 (6.7%) |
| $75,000 to $99,999 | 417 (57.9%) | 303 (42.1%) |
| $100,000 and over | 418 (66.8%) | 208 (33.2%) |
Public vs Private Health Insurance Coverage by Age in Pearl River
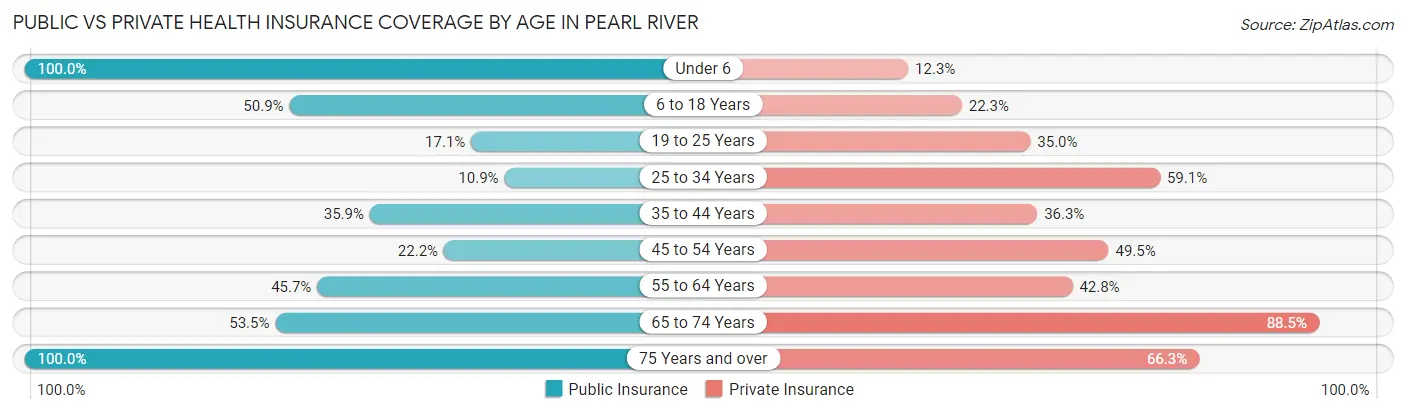
| Age Bracket | Public Insurance | Private Insurance |
| Under 6 | 357 (100.0%) | 44 (12.3%) |
| 6 to 18 Years | 541 (50.8%) | 237 (22.3%) |
| 19 to 25 Years | 65 (17.1%) | 133 (35.0%) |
| 25 to 34 Years | 58 (10.9%) | 313 (59.1%) |
| 35 to 44 Years | 204 (35.9%) | 206 (36.3%) |
| 45 to 54 Years | 90 (22.2%) | 201 (49.5%) |
| 55 to 64 Years | 143 (45.7%) | 134 (42.8%) |
| 65 to 74 Years | 177 (53.5%) | 293 (88.5%) |
| 75 Years and over | 184 (100.0%) | 122 (66.3%) |
| Total | 1,819 (44.0%) | 1,683 (40.7%) |
Disability Status by Sex by Age in Pearl River
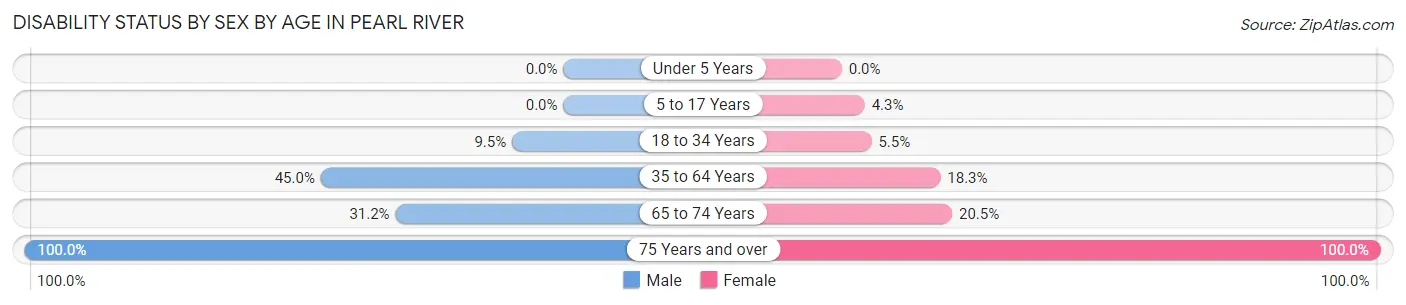
| Age Bracket | Male | Female |
| Under 5 Years | 0 (0.0%) | 0 (0.0%) |
| 5 to 17 Years | 0 (0.0%) | 20 (4.3%) |
| 18 to 34 Years | 56 (9.5%) | 21 (5.5%) |
| 35 to 64 Years | 267 (45.0%) | 127 (18.3%) |
| 65 to 74 Years | 24 (31.2%) | 52 (20.5%) |
| 75 Years and over | 47 (100.0%) | 137 (100.0%) |
Disability Class by Sex by Age in Pearl River
Disability Class: Hearing Difficulty
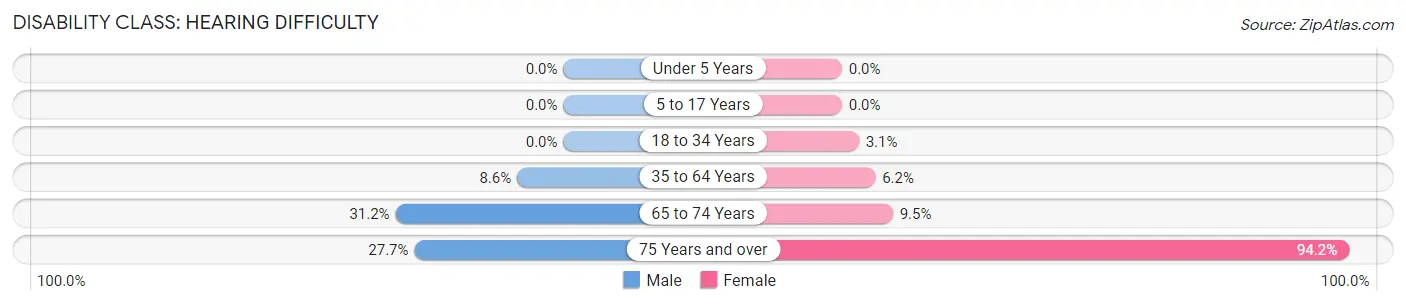
| Age Bracket | Male | Female |
| Under 5 Years | 0 (0.0%) | 0 (0.0%) |
| 5 to 17 Years | 0 (0.0%) | 0 (0.0%) |
| 18 to 34 Years | 0 (0.0%) | 12 (3.1%) |
| 35 to 64 Years | 51 (8.6%) | 43 (6.2%) |
| 65 to 74 Years | 24 (31.2%) | 24 (9.5%) |
| 75 Years and over | 13 (27.7%) | 129 (94.2%) |
Disability Class: Vision Difficulty
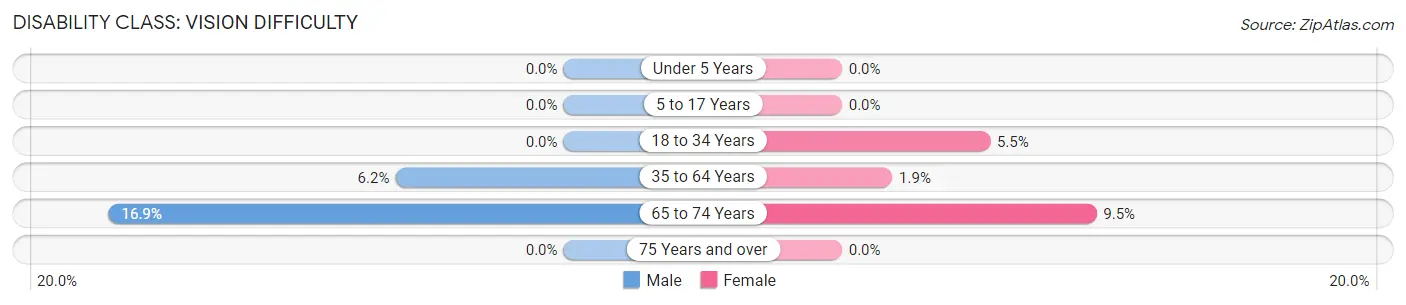
| Age Bracket | Male | Female |
| Under 5 Years | 0 (0.0%) | 0 (0.0%) |
| 5 to 17 Years | 0 (0.0%) | 0 (0.0%) |
| 18 to 34 Years | 0 (0.0%) | 21 (5.5%) |
| 35 to 64 Years | 37 (6.2%) | 13 (1.9%) |
| 65 to 74 Years | 13 (16.9%) | 24 (9.5%) |
| 75 Years and over | 0 (0.0%) | 0 (0.0%) |
Disability Class: Cognitive Difficulty
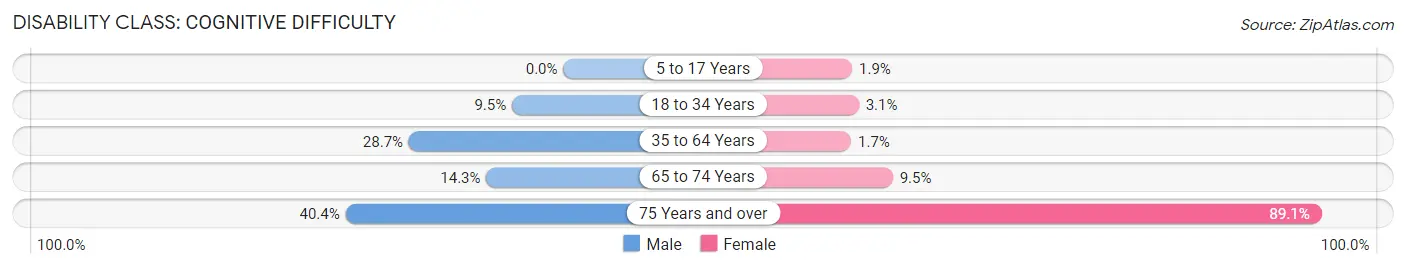
| Age Bracket | Male | Female |
| 5 to 17 Years | 0 (0.0%) | 9 (1.9%) |
| 18 to 34 Years | 56 (9.5%) | 12 (3.1%) |
| 35 to 64 Years | 170 (28.7%) | 12 (1.7%) |
| 65 to 74 Years | 11 (14.3%) | 24 (9.5%) |
| 75 Years and over | 19 (40.4%) | 122 (89.0%) |
Disability Class: Ambulatory Difficulty
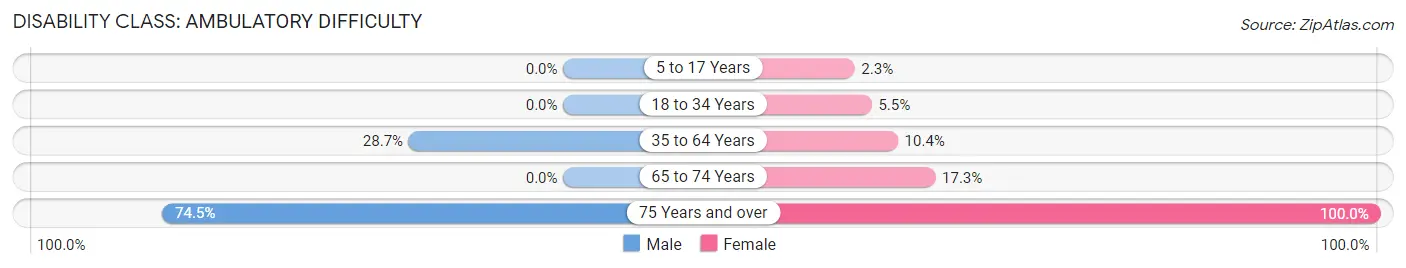
| Age Bracket | Male | Female |
| 5 to 17 Years | 0 (0.0%) | 11 (2.3%) |
| 18 to 34 Years | 0 (0.0%) | 21 (5.5%) |
| 35 to 64 Years | 170 (28.7%) | 72 (10.4%) |
| 65 to 74 Years | 0 (0.0%) | 44 (17.3%) |
| 75 Years and over | 35 (74.5%) | 137 (100.0%) |
Disability Class: Self-Care Difficulty
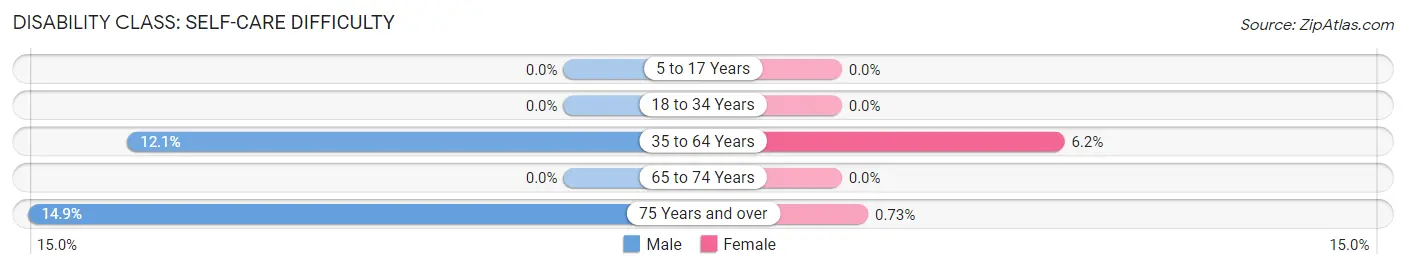
| Age Bracket | Male | Female |
| 5 to 17 Years | 0 (0.0%) | 0 (0.0%) |
| 18 to 34 Years | 0 (0.0%) | 0 (0.0%) |
| 35 to 64 Years | 72 (12.1%) | 43 (6.2%) |
| 65 to 74 Years | 0 (0.0%) | 0 (0.0%) |
| 75 Years and over | 7 (14.9%) | 1 (0.7%) |
Technology Access in Pearl River
Computing Device Access in Pearl River
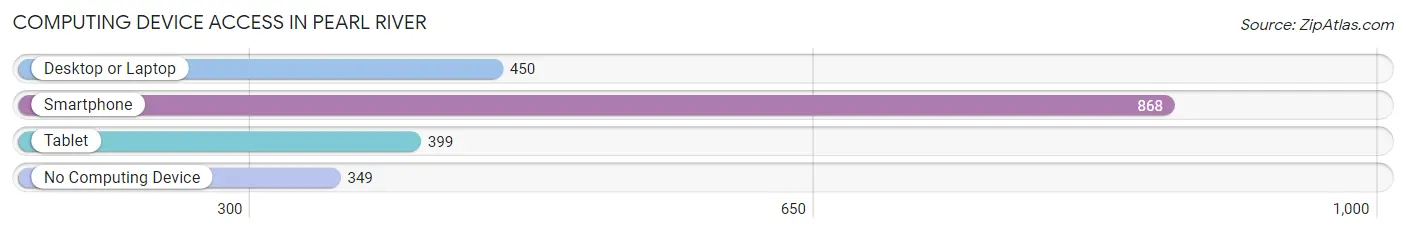
| Device Type | # Households | % Households |
| Desktop or Laptop | 450 | 35.6% |
| Smartphone | 868 | 68.7% |
| Tablet | 399 | 31.6% |
| No Computing Device | 349 | 27.6% |
| Total | 1,263 | 100.0% |
Internet Access in Pearl River
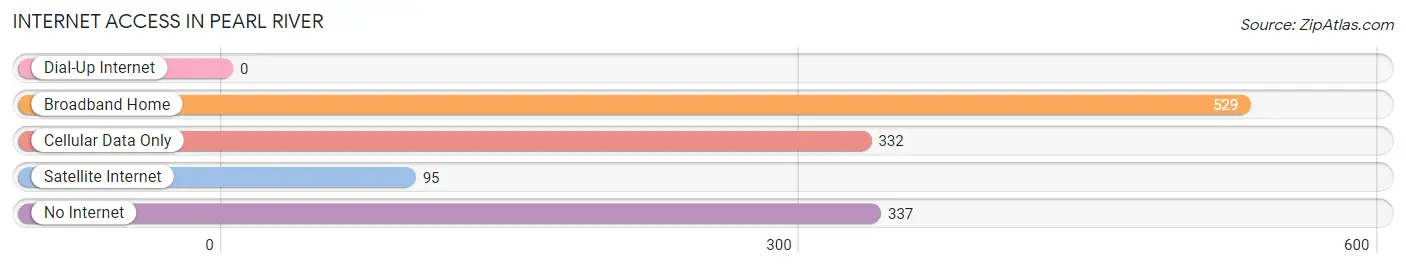
| Internet Type | # Households | % Households |
| Dial-Up Internet | 0 | 0.0% |
| Broadband Home | 529 | 41.9% |
| Cellular Data Only | 332 | 26.3% |
| Satellite Internet | 95 | 7.5% |
| No Internet | 337 | 26.7% |
| Total | 1,263 | 100.0% |
Pearl River Summary
Pearl River, Mississippi is a small town located in the southeastern corner of the state, just north of the Louisiana border. It is part of the larger Pearl River County, which is home to a population of approximately 55,000 people. The town of Pearl River is home to just over 1,000 people, and is known for its rural charm and small-town atmosphere.
History
The area that is now Pearl River was first settled in the early 1800s by French and Spanish settlers. The town was officially founded in 1820 and was named after the nearby Pearl River. The town was originally a trading post and was used as a stopover for travelers heading to New Orleans.
In the late 1800s, the town began to grow and develop. The railroad was built through the town in 1883, and the town was incorporated in 1885. The town was also home to a number of sawmills and lumber companies, which helped to fuel the local economy.
In the early 1900s, the town began to decline as the lumber industry moved away. The town was also hit hard by the Great Depression, and many of the businesses in the town closed. However, the town was able to survive and eventually began to grow again in the 1950s and 1960s.
Geography
Pearl River is located in the southeastern corner of Mississippi, just north of the Louisiana border. The town is situated on the banks of the Pearl River, which is a tributary of the Mississippi River. The town is surrounded by a number of small towns and rural communities, including Poplarville, Picayune, and Carriere.
The town is located in a humid subtropical climate, with hot, humid summers and mild winters. The average temperature in the summer is around 90 degrees Fahrenheit, and the average temperature in the winter is around 50 degrees Fahrenheit.
Economy
The economy of Pearl River is largely based on agriculture and tourism. The town is home to a number of farms, which produce a variety of crops, including corn, soybeans, cotton, and hay. The town is also home to a number of small businesses, including restaurants, shops, and other services.
The town is also home to a number of tourist attractions, including the Pearl River Wildlife Management Area, which is a popular destination for bird watching and other outdoor activities. The town is also home to a number of historic sites, including the Old Pearl River County Courthouse and the Old Pearl River County Jail.
Demographics
As of the 2010 census, the population of Pearl River was 1,072. The racial makeup of the town was 79.3% White, 17.2% African American, 0.3% Native American, 0.2% Asian, 0.1% Pacific Islander, and 2.9% from other races. The median household income in the town was $37,917, and the median family income was $45,625.
Conclusion
Pearl River, Mississippi is a small town located in the southeastern corner of the state, just north of the Louisiana border. The town is home to just over 1,000 people, and is known for its rural charm and small-town atmosphere. The economy of Pearl River is largely based on agriculture and tourism, and the town is home to a number of farms, businesses, and tourist attractions. The population of Pearl River is largely white, with a small percentage of African Americans and other races.
Common Questions
What is Per Capita Income in Pearl River?
Per Capita income in Pearl River is $14,912.
What is the Median Family Income in Pearl River?
Median Family Income in Pearl River is $31,417.
What is the Median Household income in Pearl River?
Median Household Income in Pearl River is $40,614.
What is Income or Wage Gap in Pearl River?
Income or Wage Gap in Pearl River is 41.5%.
Women in Pearl River earn 58.5 cents for every dollar earned by a man.
What is Family Income Deficit in Pearl River?
Family Income Deficit in Pearl River is $10,286.
Families that are below poverty line in Pearl River earn $10,286 less on average than the poverty threshold level.
What is Inequality or Gini Index in Pearl River?
Inequality or Gini Index in Pearl River is 0.40.
What is the Total Population of Pearl River?
Total Population of Pearl River is 4,298.
What is the Total Male Population of Pearl River?
Total Male Population of Pearl River is 2,161.
What is the Total Female Population of Pearl River?
Total Female Population of Pearl River is 2,137.
What is the Ratio of Males per 100 Females in Pearl River?
There are 101.12 Males per 100 Females in Pearl River.
What is the Ratio of Females per 100 Males in Pearl River?
There are 98.89 Females per 100 Males in Pearl River.
What is the Median Population Age in Pearl River?
Median Population Age in Pearl River is 33.1 Years.
What is the Average Family Size in Pearl River
Average Family Size in Pearl River is 4.0 People.
What is the Average Household Size in Pearl River
Average Household Size in Pearl River is 3.3 People.
How Large is the Labor Force in Pearl River?
There are 1,838 People in the Labor Forcein in Pearl River.
What is the Percentage of People in the Labor Force in Pearl River?
59.2% of People are in the Labor Force in Pearl River.
What is the Unemployment Rate in Pearl River?
Unemployment Rate in Pearl River is 6.6%.