Cleary, MS Map & Demographics
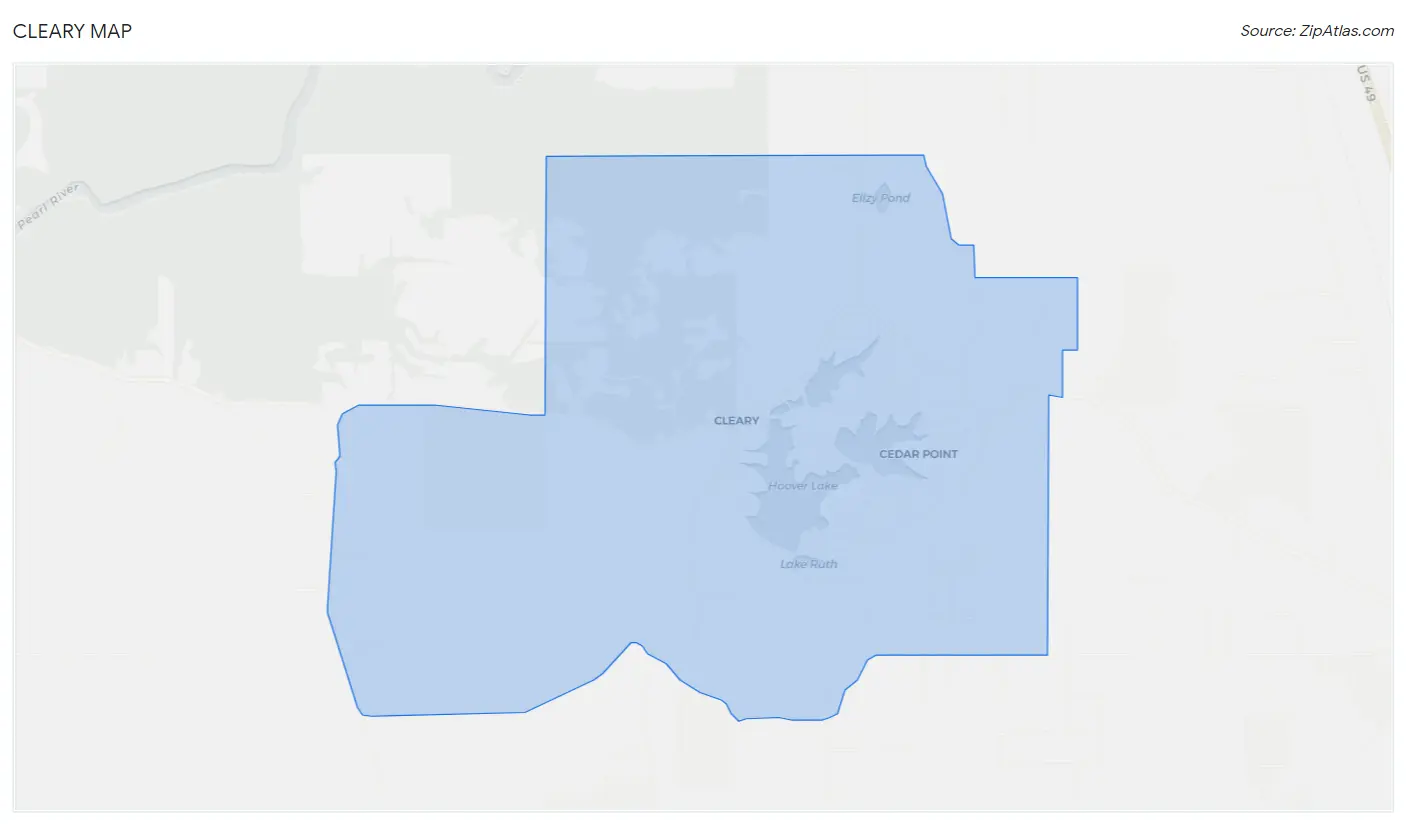
Cleary Map
Cleary Overview
$33,528
PER CAPITA INCOME
$96,607
AVG FAMILY INCOME
43.5%
WAGE / INCOME GAP [ % ]
56.5¢/ $1
WAGE / INCOME GAP [ $ ]
0.46
INEQUALITY / GINI INDEX
2,010
TOTAL POPULATION
947
MALE POPULATION
1,063
FEMALE POPULATION
89.09
MALES / 100 FEMALES
112.25
FEMALES / 100 MALES
42.4
MEDIAN AGE
3.4
AVG FAMILY SIZE
2.2
AVG HOUSEHOLD SIZE
889
LABOR FORCE [ PEOPLE ]
51.5%
PERCENT IN LABOR FORCE
15.5%
UNEMPLOYMENT RATE
Income in Cleary
Income Overview in Cleary
| Characteristic | Number | Measure |
| Per Capita Income | 2,010 | $33,528 |
| Median Family Income | 450 | $96,607 |
| Mean Family Income | 450 | $105,008 |
| Median Household Income | 895 | $0 |
| Mean Household Income | 895 | $72,013 |
| Income Deficit | 450 | $0 |
| Wage / Income Gap (%) | 2,010 | 43.46% |
| Wage / Income Gap ($) | 2,010 | 56.54¢ per $1 |
| Gini / Inequality Index | 2,010 | 0.46 |
Earnings by Sex in Cleary
Average Earnings in Cleary are $61,451, $70,241 for men and $39,712 for women, a difference of 43.5%.
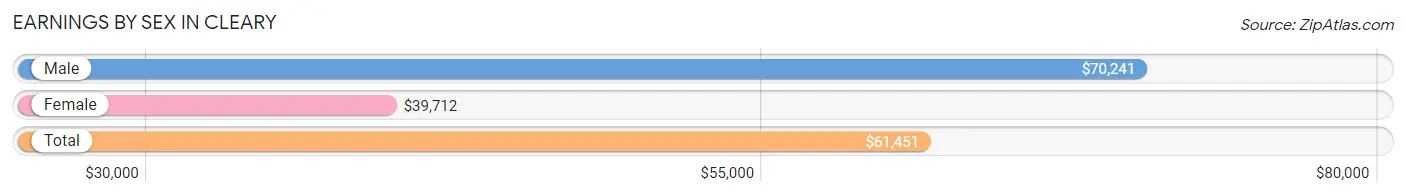
| Sex | Number | Average Earnings |
| Male | 575 (65.7%) | $70,241 |
| Female | 300 (34.3%) | $39,712 |
| Total | 875 (100.0%) | $61,451 |
Earnings by Sex by Income Bracket in Cleary
The most common earnings brackets in Cleary are $100,000+ for men (140 | 24.3%) and $75,000 to $99,999 for women (78 | 26.0%).
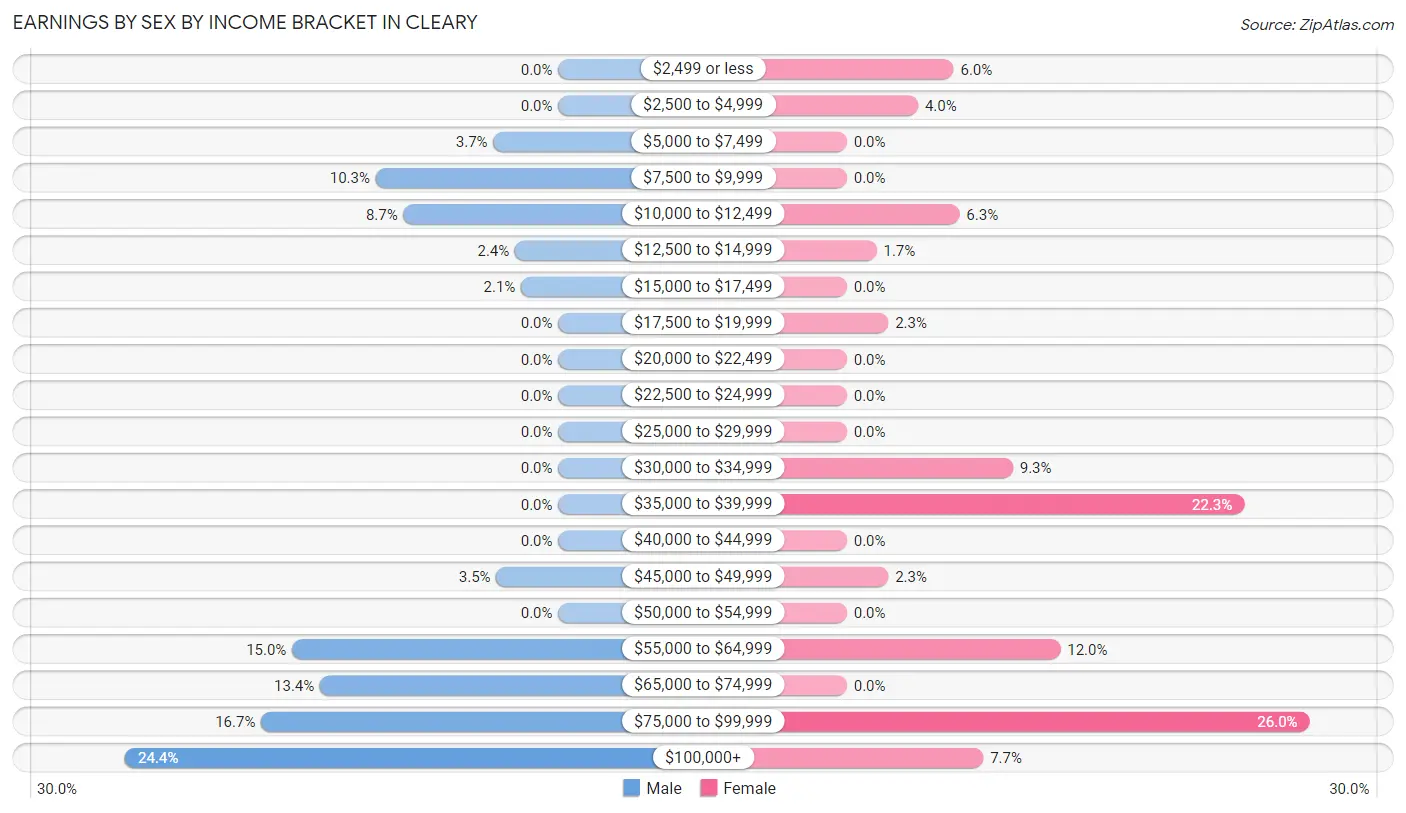
| Income | Male | Female |
| $2,499 or less | 0 (0.0%) | 18 (6.0%) |
| $2,500 to $4,999 | 0 (0.0%) | 12 (4.0%) |
| $5,000 to $7,499 | 21 (3.6%) | 0 (0.0%) |
| $7,500 to $9,999 | 59 (10.3%) | 0 (0.0%) |
| $10,000 to $12,499 | 50 (8.7%) | 19 (6.3%) |
| $12,500 to $14,999 | 14 (2.4%) | 5 (1.7%) |
| $15,000 to $17,499 | 12 (2.1%) | 0 (0.0%) |
| $17,500 to $19,999 | 0 (0.0%) | 7 (2.3%) |
| $20,000 to $22,499 | 0 (0.0%) | 0 (0.0%) |
| $22,500 to $24,999 | 0 (0.0%) | 0 (0.0%) |
| $25,000 to $29,999 | 0 (0.0%) | 0 (0.0%) |
| $30,000 to $34,999 | 0 (0.0%) | 28 (9.3%) |
| $35,000 to $39,999 | 0 (0.0%) | 67 (22.3%) |
| $40,000 to $44,999 | 0 (0.0%) | 0 (0.0%) |
| $45,000 to $49,999 | 20 (3.5%) | 7 (2.3%) |
| $50,000 to $54,999 | 0 (0.0%) | 0 (0.0%) |
| $55,000 to $64,999 | 86 (15.0%) | 36 (12.0%) |
| $65,000 to $74,999 | 77 (13.4%) | 0 (0.0%) |
| $75,000 to $99,999 | 96 (16.7%) | 78 (26.0%) |
| $100,000+ | 140 (24.3%) | 23 (7.7%) |
| Total | 575 (100.0%) | 300 (100.0%) |
Earnings by Sex by Educational Attainment in Cleary
Average earnings in Cleary are $71,535 for men and $39,712 for women, a difference of 44.5%. Men with an educational attainment of college or associate's degree enjoy the highest average annual earnings of $71,136, while those with college or associate's degree education earn the least with $71,136. Women with an educational attainment of bachelor's degree earn the most with the average annual earnings of $46,964, while those with bachelor's degree education have the smallest earnings of $46,964.
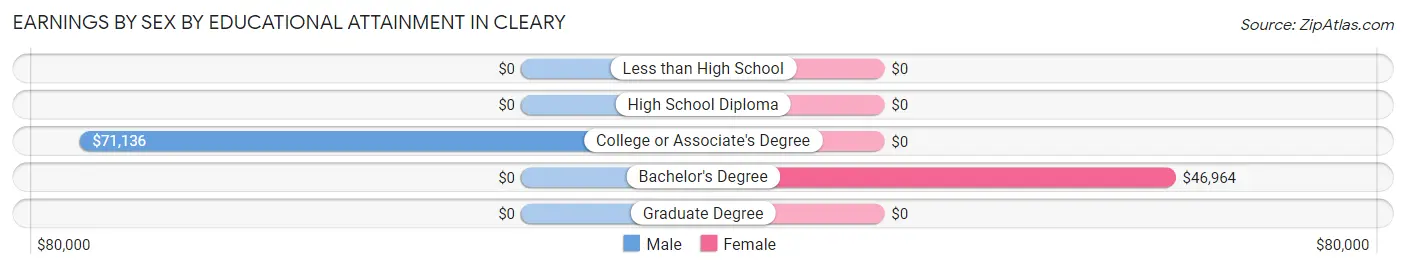
| Educational Attainment | Male Income | Female Income |
| Less than High School | - | - |
| High School Diploma | - | - |
| College or Associate's Degree | $71,136 | $0 |
| Bachelor's Degree | - | - |
| Graduate Degree | - | - |
| Total | $71,535 | $39,712 |
Family Income in Cleary
Family Income Brackets in Cleary
According to the Cleary family income data, there are 133 families falling into the $75,000 to $99,999 income range, which is the most common income bracket and makes up 29.6% of all families.
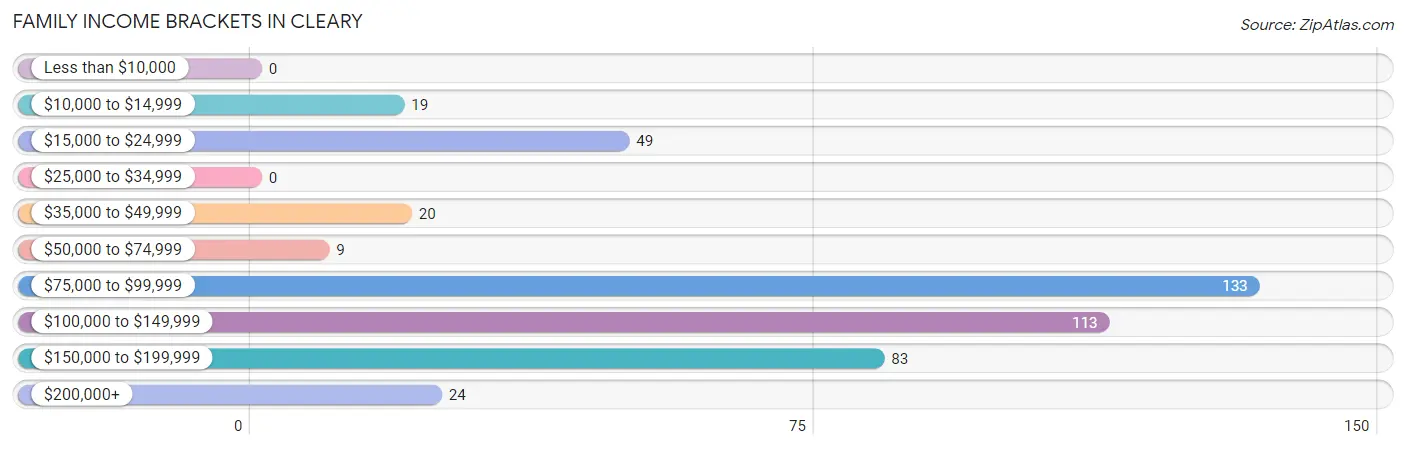
| Income Bracket | # Families | % Families |
| Less than $10,000 | 0 | 0.0% |
| $10,000 to $14,999 | 19 | 4.2% |
| $15,000 to $24,999 | 49 | 10.9% |
| $25,000 to $34,999 | 0 | 0.0% |
| $35,000 to $49,999 | 20 | 4.4% |
| $50,000 to $74,999 | 9 | 2.0% |
| $75,000 to $99,999 | 133 | 29.6% |
| $100,000 to $149,999 | 113 | 25.1% |
| $150,000 to $199,999 | 83 | 18.4% |
| $200,000+ | 24 | 5.3% |
Family Income by Famaliy Size in Cleary
2-person families (236 | 52.4%) account for the highest median family income in Cleary with $88,929 per family, while 2-person families (236 | 52.4%) have the highest median income of $44,464 per family member.
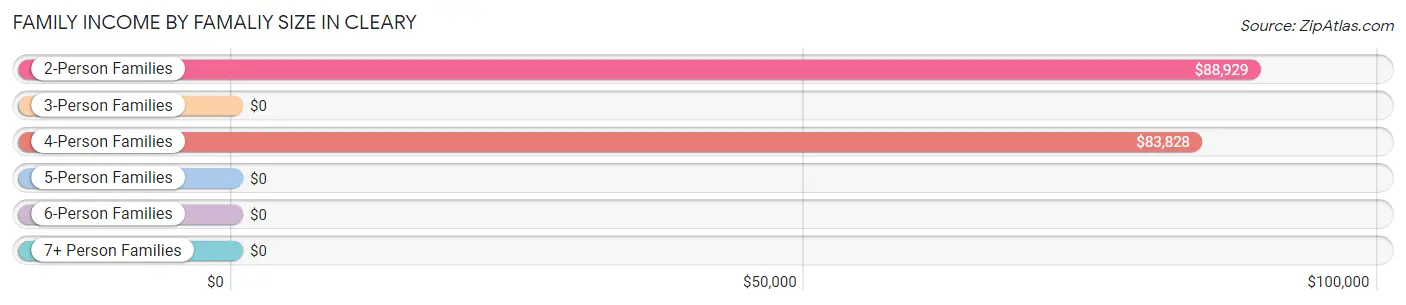
| Income Bracket | # Families | Median Income |
| 2-Person Families | 236 (52.4%) | $88,929 |
| 3-Person Families | 77 (17.1%) | $0 |
| 4-Person Families | 72 (16.0%) | $83,828 |
| 5-Person Families | 60 (13.3%) | $0 |
| 6-Person Families | 5 (1.1%) | $0 |
| 7+ Person Families | 0 (0.0%) | $0 |
| Total | 450 (100.0%) | $96,607 |
Family Income by Number of Earners in Cleary
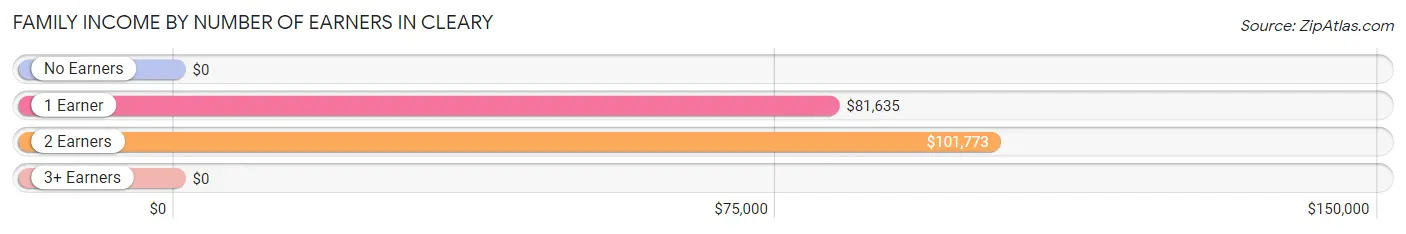
| Number of Earners | # Families | Median Income |
| No Earners | 49 (10.9%) | $0 |
| 1 Earner | 129 (28.7%) | $81,635 |
| 2 Earners | 267 (59.3%) | $101,773 |
| 3+ Earners | 5 (1.1%) | $0 |
| Total | 450 (100.0%) | $96,607 |
Household Income in Cleary
Household Income Brackets in Cleary
With 261 households falling in the category, the $15,000 to $24,999 income range is the most frequent in Cleary, accounting for 29.2% of all households.
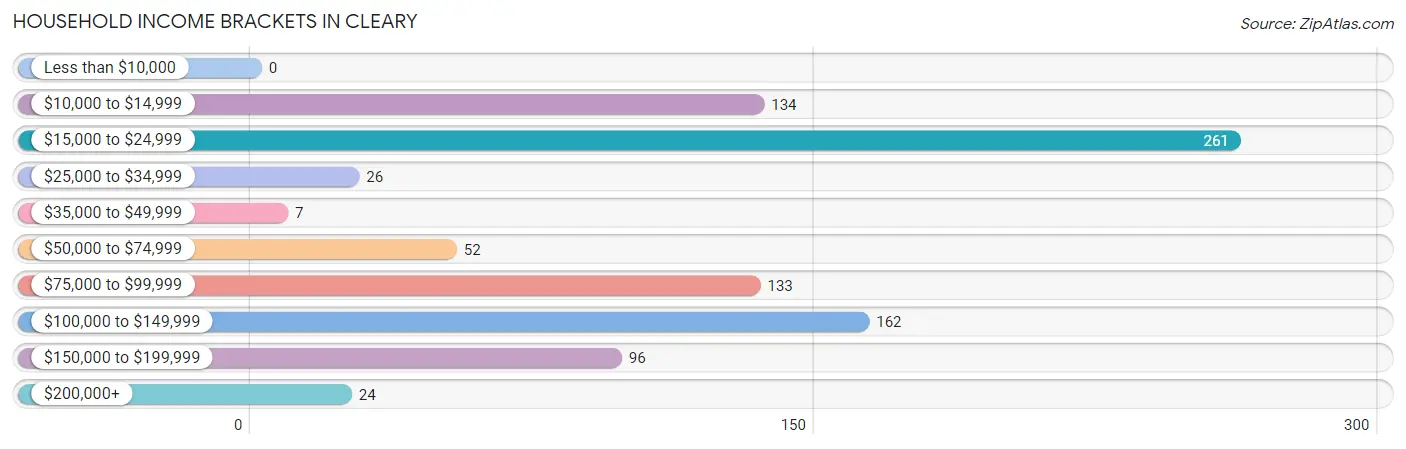
| Income Bracket | # Households | % Households |
| Less than $10,000 | 0 | 0.0% |
| $10,000 to $14,999 | 134 | 15.0% |
| $15,000 to $24,999 | 261 | 29.2% |
| $25,000 to $34,999 | 26 | 2.9% |
| $35,000 to $49,999 | 7 | 0.8% |
| $50,000 to $74,999 | 52 | 5.8% |
| $75,000 to $99,999 | 133 | 14.9% |
| $100,000 to $149,999 | 162 | 18.1% |
| $150,000 to $199,999 | 96 | 10.7% |
| $200,000+ | 24 | 2.7% |
Household Income by Householder Age in Cleary
The median household income in Cleary is $0, with the highest median household income of $130,057 found in the 45 to 64 years age bracket for the primary householder. A total of 129 households (14.4%) fall into this category. Meanwhile, the 15 to 24 years age bracket for the primary householder has the lowest median household income of $0, with 32 households (3.6%) in this group.
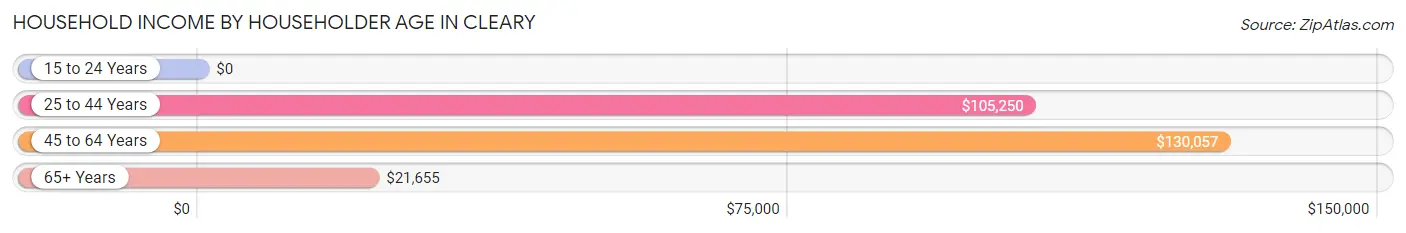
| Income Bracket | # Households | Median Income |
| 15 to 24 Years | 32 (3.6%) | $0 |
| 25 to 44 Years | 214 (23.9%) | $105,250 |
| 45 to 64 Years | 129 (14.4%) | $130,057 |
| 65+ Years | 520 (58.1%) | $21,655 |
| Total | 895 (100.0%) | $0 |
Poverty in Cleary
Income Below Poverty by Sex and Age in Cleary
With 8.5% poverty level for males and 17.1% for females among the residents of Cleary, 16 and 17 year old males and 12 to 14 year old females are the most vulnerable to poverty, with 28 males (29.5%) and 23 females (71.9%) in their respective age groups living below the poverty level.
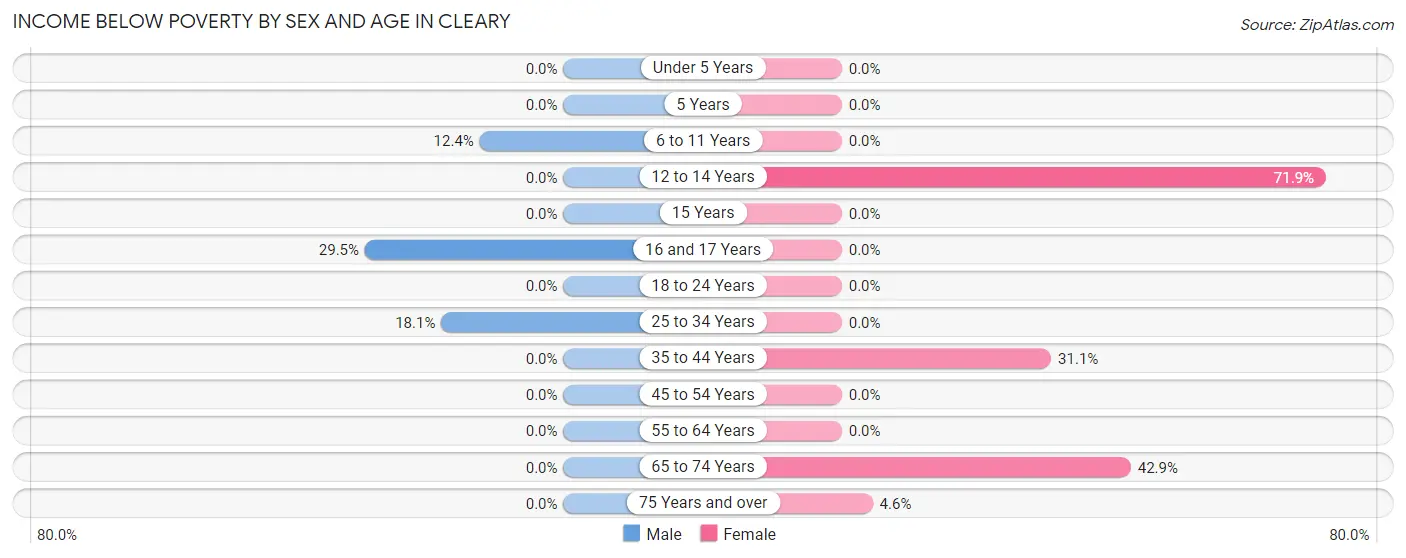
| Age Bracket | Male | Female |
| Under 5 Years | 0 (0.0%) | 0 (0.0%) |
| 5 Years | 0 (0.0%) | 0 (0.0%) |
| 6 to 11 Years | 21 (12.4%) | 0 (0.0%) |
| 12 to 14 Years | 0 (0.0%) | 23 (71.9%) |
| 15 Years | 0 (0.0%) | 0 (0.0%) |
| 16 and 17 Years | 28 (29.5%) | 0 (0.0%) |
| 18 to 24 Years | 0 (0.0%) | 0 (0.0%) |
| 25 to 34 Years | 31 (18.1%) | 0 (0.0%) |
| 35 to 44 Years | 0 (0.0%) | 37 (31.1%) |
| 45 to 54 Years | 0 (0.0%) | 0 (0.0%) |
| 55 to 64 Years | 0 (0.0%) | 0 (0.0%) |
| 65 to 74 Years | 0 (0.0%) | 106 (42.9%) |
| 75 Years and over | 0 (0.0%) | 16 (4.6%) |
| Total | 80 (8.5%) | 182 (17.1%) |
Income Above Poverty by Sex and Age in Cleary
According to the poverty statistics in Cleary, males aged 12 to 14 years and females aged under 5 years are the age groups that are most secure financially, with 100.0% of males and 100.0% of females in these age groups living above the poverty line.
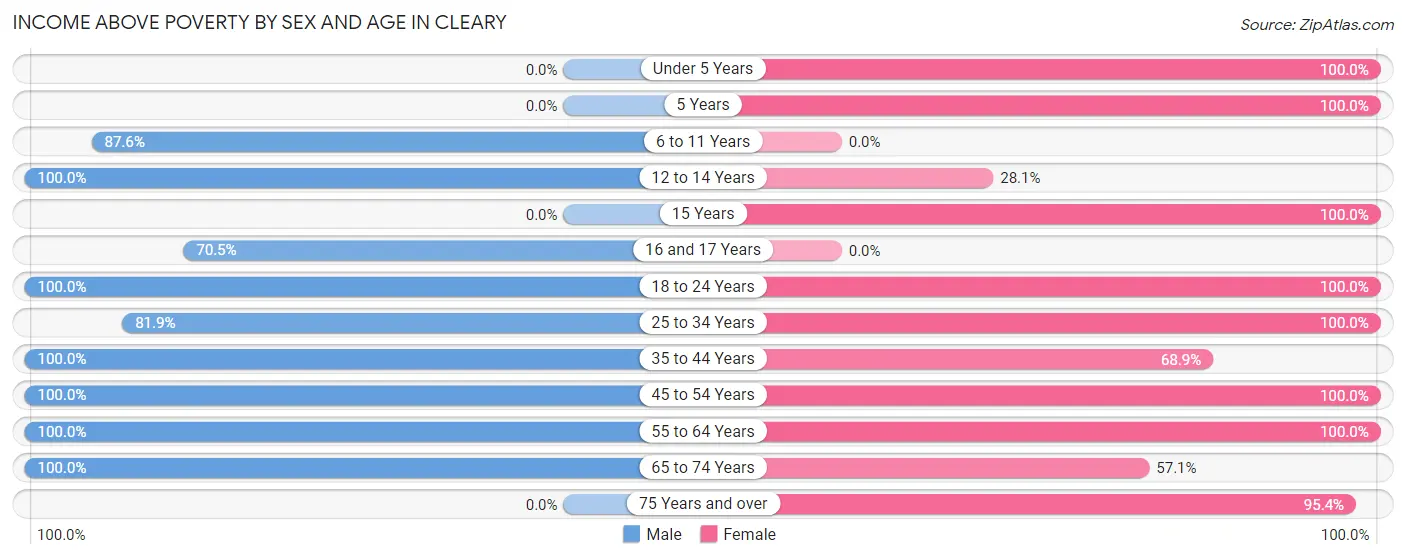
| Age Bracket | Male | Female |
| Under 5 Years | 0 (0.0%) | 22 (100.0%) |
| 5 Years | 0 (0.0%) | 8 (100.0%) |
| 6 to 11 Years | 148 (87.6%) | 0 (0.0%) |
| 12 to 14 Years | 45 (100.0%) | 9 (28.1%) |
| 15 Years | 0 (0.0%) | 8 (100.0%) |
| 16 and 17 Years | 67 (70.5%) | 0 (0.0%) |
| 18 to 24 Years | 91 (100.0%) | 84 (100.0%) |
| 25 to 34 Years | 140 (81.9%) | 99 (100.0%) |
| 35 to 44 Years | 149 (100.0%) | 82 (68.9%) |
| 45 to 54 Years | 20 (100.0%) | 20 (100.0%) |
| 55 to 64 Years | 184 (100.0%) | 75 (100.0%) |
| 65 to 74 Years | 23 (100.0%) | 141 (57.1%) |
| 75 Years and over | 0 (0.0%) | 333 (95.4%) |
| Total | 867 (91.5%) | 881 (82.9%) |
Income Below Poverty Among Married-Couple Families in Cleary
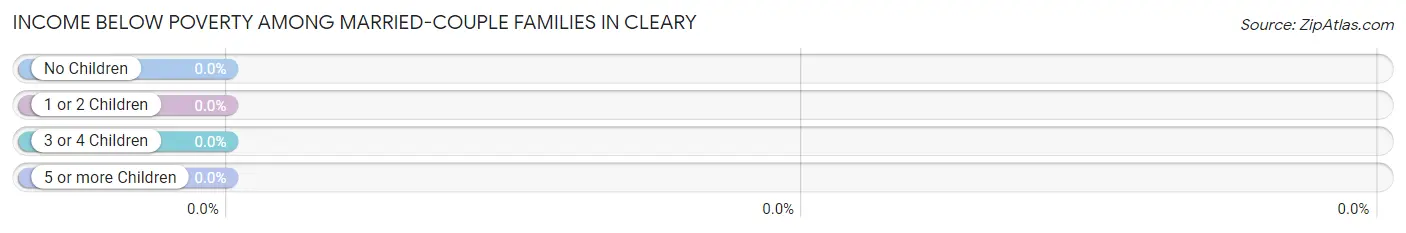
| Children | Above Poverty | Below Poverty |
| No Children | 187 (100.0%) | 0 (0.0%) |
| 1 or 2 Children | 36 (100.0%) | 0 (0.0%) |
| 3 or 4 Children | 65 (100.0%) | 0 (0.0%) |
| 5 or more Children | 0 (0.0%) | 0 (0.0%) |
| Total | 288 (100.0%) | 0 (0.0%) |
Income Below Poverty Among Single-Parent Households in Cleary
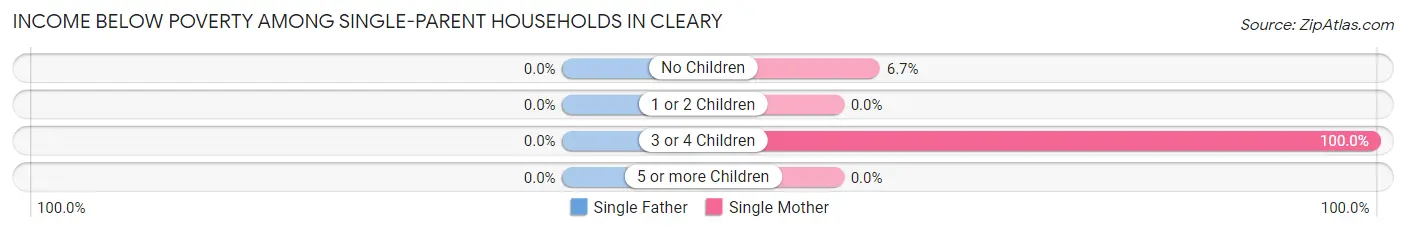
| Children | Single Father | Single Mother |
| No Children | 0 (0.0%) | 7 (6.7%) |
| 1 or 2 Children | 0 (0.0%) | 0 (0.0%) |
| 3 or 4 Children | 0 (0.0%) | 19 (100.0%) |
| 5 or more Children | 0 (0.0%) | 0 (0.0%) |
| Total | 0 (0.0%) | 26 (20.0%) |
Income Below Poverty Among Married-Couple vs Single-Parent Households in Cleary
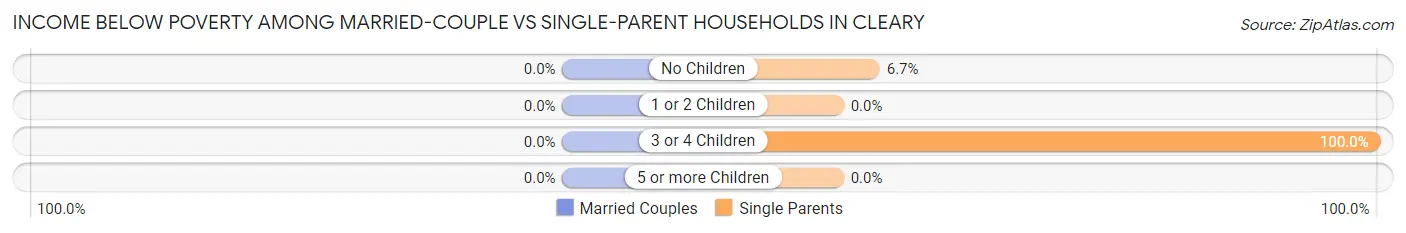
| Children | Married-Couple Families | Single-Parent Households |
| No Children | 0 (0.0%) | 7 (6.7%) |
| 1 or 2 Children | 0 (0.0%) | 0 (0.0%) |
| 3 or 4 Children | 0 (0.0%) | 19 (100.0%) |
| 5 or more Children | 0 (0.0%) | 0 (0.0%) |
| Total | 0 (0.0%) | 26 (16.1%) |
Race in Cleary
The most populous races in Cleary are White / Caucasian (1,830 | 91.0%), Black / African American (167 | 8.3%), and Two or more Races (13 | 0.6%).
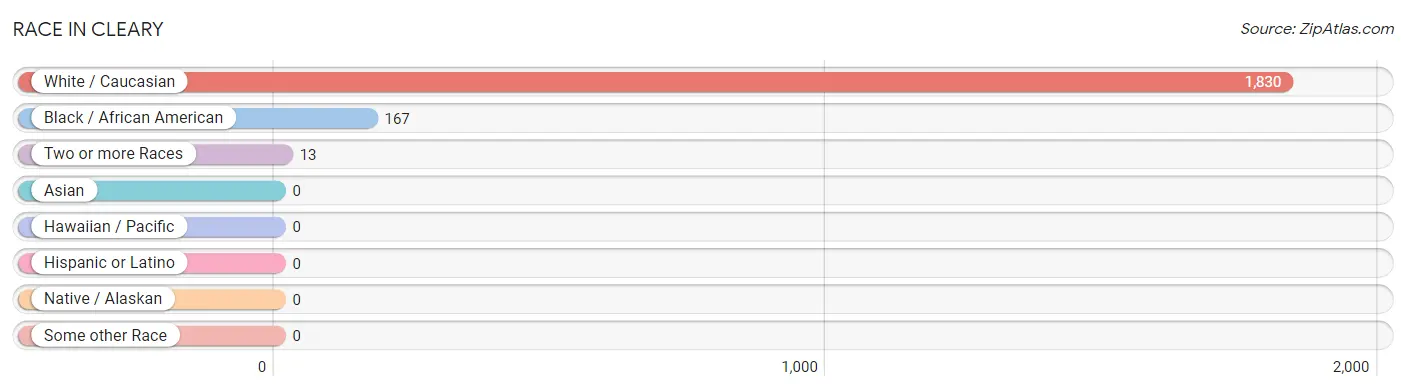
| Race | # Population | % Population |
| Asian | 0 | 0.0% |
| Black / African American | 167 | 8.3% |
| Hawaiian / Pacific | 0 | 0.0% |
| Hispanic or Latino | 0 | 0.0% |
| Native / Alaskan | 0 | 0.0% |
| White / Caucasian | 1,830 | 91.0% |
| Two or more Races | 13 | 0.6% |
| Some other Race | 0 | 0.0% |
| Total | 2,010 | 100.0% |
Ancestry in Cleary
The most populous ancestries reported in Cleary are American (262 | 13.0%), Irish (200 | 10.0%), Italian (163 | 8.1%), English (154 | 7.7%), and European (128 | 6.4%), together accounting for 45.1% of all Cleary residents.
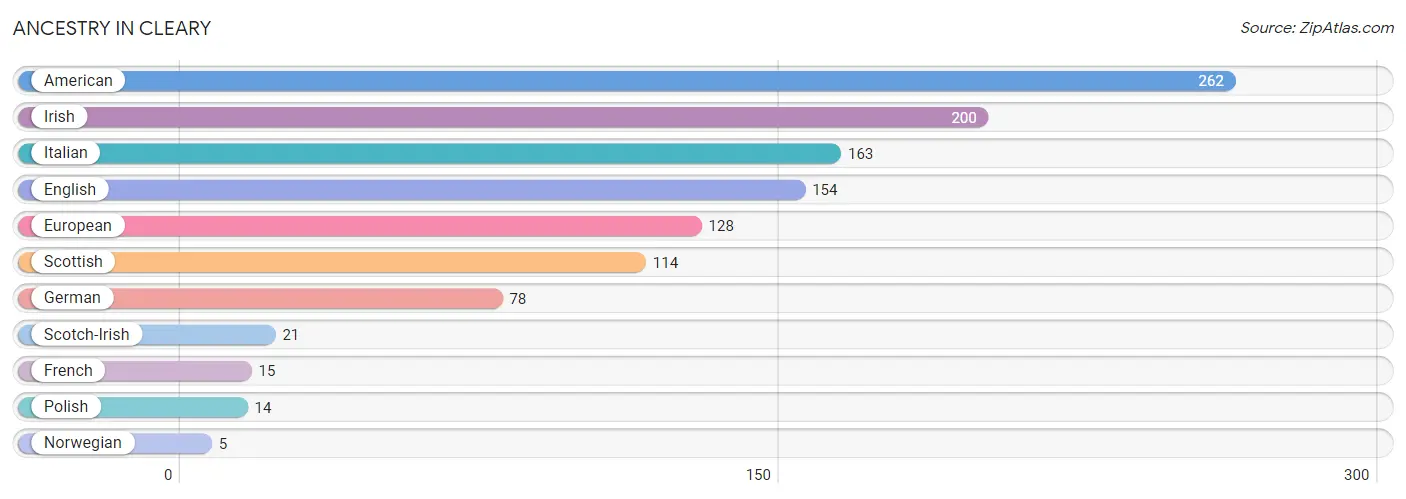
| Ancestry | # Population | % Population |
| American | 262 | 13.0% |
| English | 154 | 7.7% |
| European | 128 | 6.4% |
| French | 15 | 0.7% |
| German | 78 | 3.9% |
| Irish | 200 | 10.0% |
| Italian | 163 | 8.1% |
| Norwegian | 5 | 0.3% |
| Polish | 14 | 0.7% |
| Scotch-Irish | 21 | 1.0% |
| Scottish | 114 | 5.7% | View All 11 Rows |
Immigrants in Cleary

| Immigration Origin | # Population | % Population | View All 0 Rows |
Sex and Age in Cleary
Sex and Age in Cleary
The most populous age groups in Cleary are 15 to 19 Years (186 | 19.6%) for men and 75 to 79 Years (298 | 28.0%) for women.
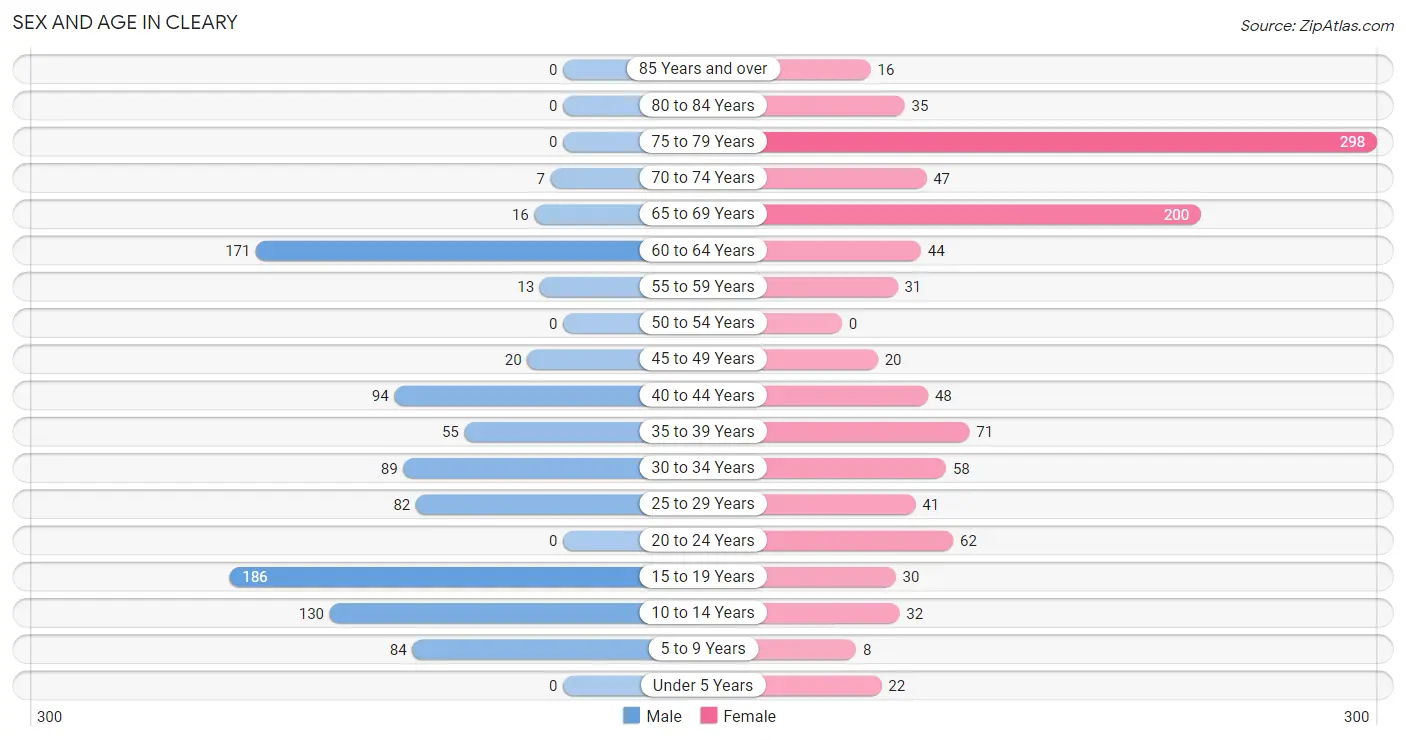
| Age Bracket | Male | Female |
| Under 5 Years | 0 (0.0%) | 22 (2.1%) |
| 5 to 9 Years | 84 (8.9%) | 8 (0.7%) |
| 10 to 14 Years | 130 (13.7%) | 32 (3.0%) |
| 15 to 19 Years | 186 (19.6%) | 30 (2.8%) |
| 20 to 24 Years | 0 (0.0%) | 62 (5.8%) |
| 25 to 29 Years | 82 (8.7%) | 41 (3.9%) |
| 30 to 34 Years | 89 (9.4%) | 58 (5.5%) |
| 35 to 39 Years | 55 (5.8%) | 71 (6.7%) |
| 40 to 44 Years | 94 (9.9%) | 48 (4.5%) |
| 45 to 49 Years | 20 (2.1%) | 20 (1.9%) |
| 50 to 54 Years | 0 (0.0%) | 0 (0.0%) |
| 55 to 59 Years | 13 (1.4%) | 31 (2.9%) |
| 60 to 64 Years | 171 (18.1%) | 44 (4.1%) |
| 65 to 69 Years | 16 (1.7%) | 200 (18.8%) |
| 70 to 74 Years | 7 (0.7%) | 47 (4.4%) |
| 75 to 79 Years | 0 (0.0%) | 298 (28.0%) |
| 80 to 84 Years | 0 (0.0%) | 35 (3.3%) |
| 85 Years and over | 0 (0.0%) | 16 (1.5%) |
| Total | 947 (100.0%) | 1,063 (100.0%) |
Families and Households in Cleary
Median Family Size in Cleary
The median family size in Cleary is 3.40 persons per family, with single male/father families (32 | 7.1%) accounting for the largest median family size of 5.66 persons per family. On the other hand, married-couple families (288 | 64.0%) represent the smallest median family size with 3.09 persons per family.
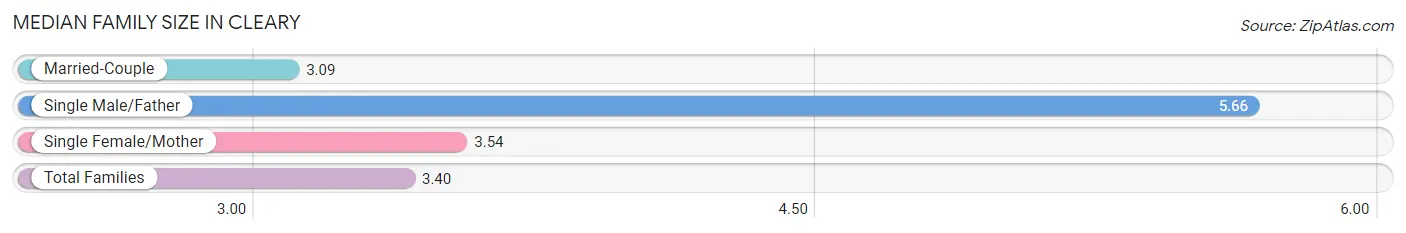
| Family Type | # Families | Family Size |
| Married-Couple | 288 (64.0%) | 3.09 |
| Single Male/Father | 32 (7.1%) | 5.66 |
| Single Female/Mother | 130 (28.9%) | 3.54 |
| Total Families | 450 (100.0%) | 3.40 |
Median Household Size in Cleary
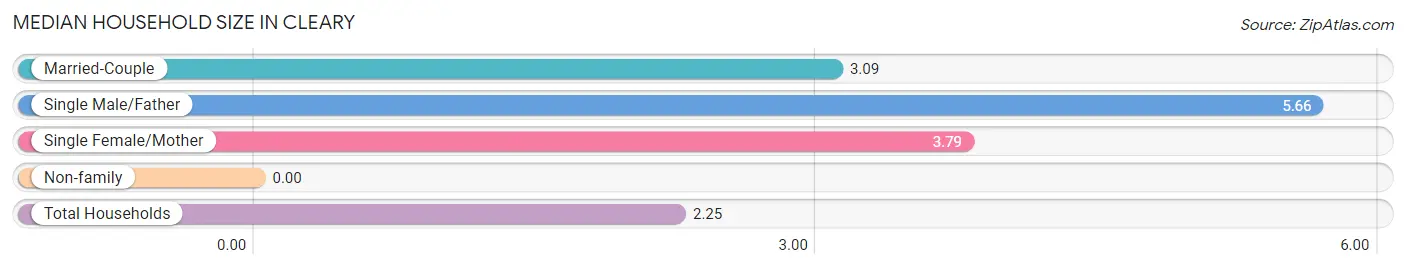
| Household Type | # Households | Household Size |
| Married-Couple | 288 (32.2%) | 3.09 |
| Single Male/Father | 32 (3.6%) | 5.66 |
| Single Female/Mother | 130 (14.5%) | 3.79 |
| Non-family | 445 (49.7%) | - |
| Total Households | 895 (100.0%) | 2.25 |
Household Size by Marriage Status in Cleary
Out of a total of 895 households in Cleary, 450 (50.3%) are family households, while 445 (49.7%) are nonfamily households. The most numerous type of family households are 2-person households, comprising 223, and the most common type of nonfamily households are 1-person households, comprising 445.
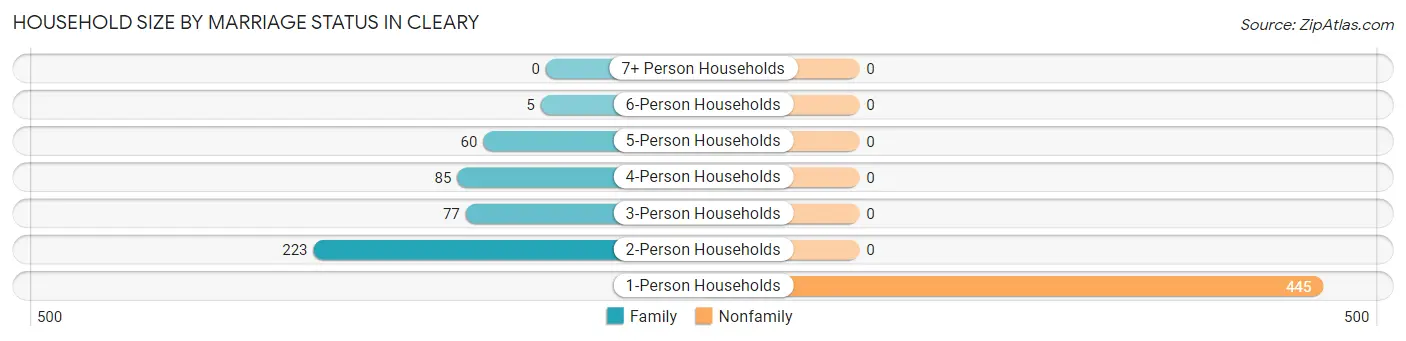
| Household Size | Family Households | Nonfamily Households |
| 1-Person Households | - | 445 (49.7%) |
| 2-Person Households | 223 (24.9%) | 0 (0.0%) |
| 3-Person Households | 77 (8.6%) | 0 (0.0%) |
| 4-Person Households | 85 (9.5%) | 0 (0.0%) |
| 5-Person Households | 60 (6.7%) | 0 (0.0%) |
| 6-Person Households | 5 (0.6%) | 0 (0.0%) |
| 7+ Person Households | 0 (0.0%) | 0 (0.0%) |
| Total | 450 (50.3%) | 445 (49.7%) |
Female Fertility in Cleary
Fertility by Age in Cleary
Average fertility rate in Cleary is 67.0 births per 1,000 women. Women in the age bracket of 20 to 34 years have the highest fertility rate with 137.0 births per 1,000 women. Women in the age bracket of 20 to 34 years acount for 100.0% of all women with births.
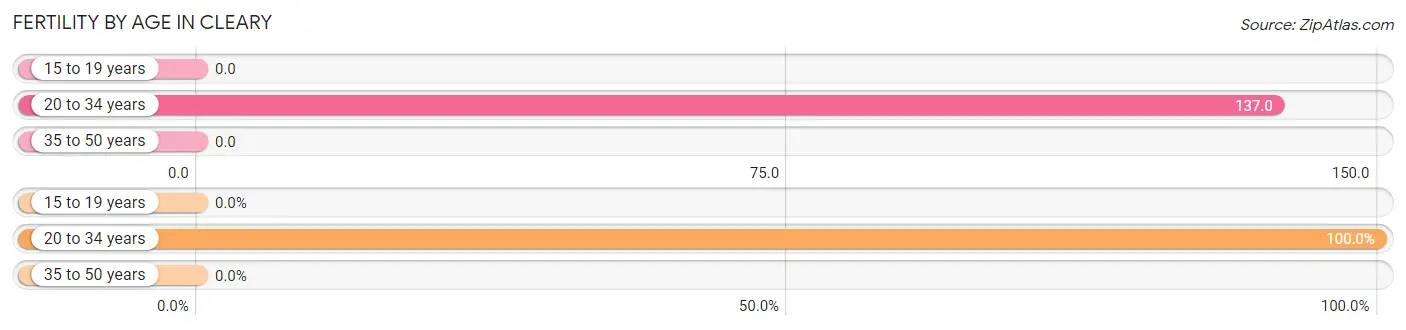
| Age Bracket | Women with Births | Births / 1,000 Women |
| 15 to 19 years | 0 (0.0%) | 0.0 |
| 20 to 34 years | 22 (100.0%) | 137.0 |
| 35 to 50 years | 0 (0.0%) | 0.0 |
| Total | 22 (100.0%) | 67.0 |
Fertility by Age by Marriage Status in Cleary
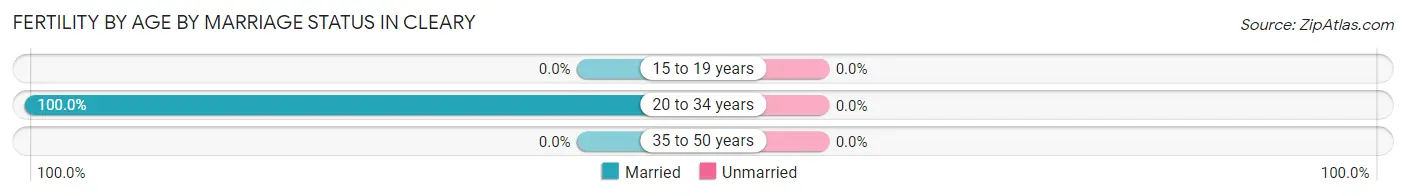
| Age Bracket | Married | Unmarried |
| 15 to 19 years | 0 (0.0%) | 0 (0.0%) |
| 20 to 34 years | 22 (100.0%) | 0 (0.0%) |
| 35 to 50 years | 0 (0.0%) | 0 (0.0%) |
| Total | 22 (100.0%) | 0 (0.0%) |
Fertility by Education in Cleary
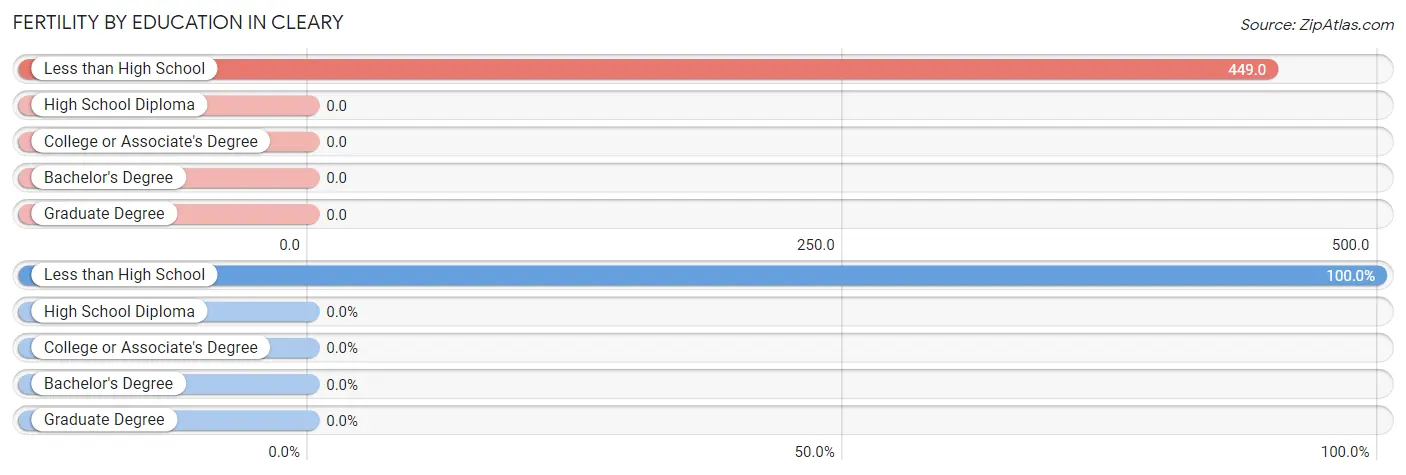
| Educational Attainment | Women with Births | Births / 1,000 Women |
| Less than High School | 22 (100.0%) | 449.0 |
| High School Diploma | 0 (0.0%) | 0.0 |
| College or Associate's Degree | 0 (0.0%) | 0.0 |
| Bachelor's Degree | 0 (0.0%) | 0.0 |
| Graduate Degree | 0 (0.0%) | 0.0 |
| Total | 22 (100.0%) | 67.0 |
Fertility by Education by Marriage Status in Cleary
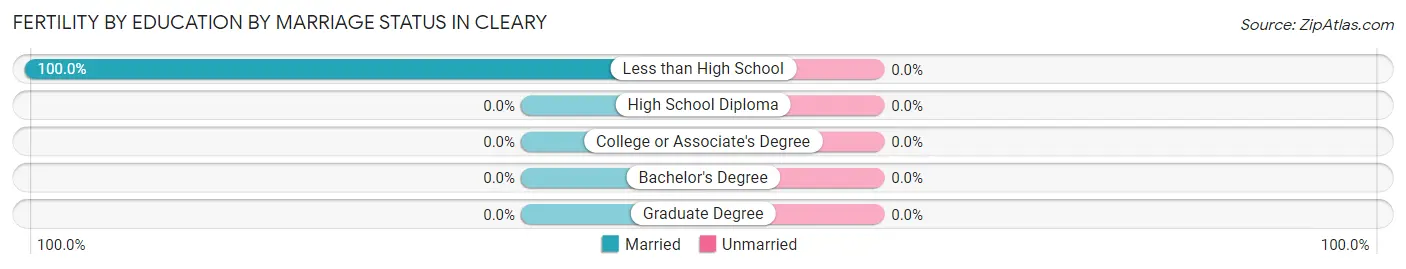
| Educational Attainment | Married | Unmarried |
| Less than High School | 22 (100.0%) | 0 (0.0%) |
| High School Diploma | 0 (0.0%) | 0 (0.0%) |
| College or Associate's Degree | 0 (0.0%) | 0 (0.0%) |
| Bachelor's Degree | 0 (0.0%) | 0 (0.0%) |
| Graduate Degree | 0 (0.0%) | 0 (0.0%) |
| Total | 22 (100.0%) | 0 (0.0%) |
Employment Characteristics in Cleary
Employment by Class of Employer in Cleary
Among the 751 employed individuals in Cleary, private company employees (516 | 68.7%), state government employees (76 | 10.1%), and local government employees (55 | 7.3%) make up the most common classes of employment.
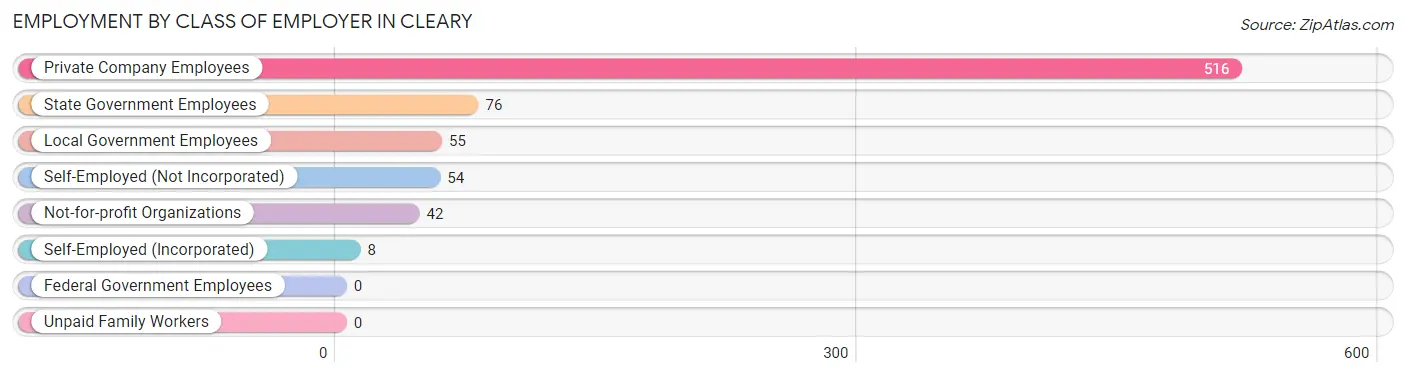
| Employer Class | # Employees | % Employees |
| Private Company Employees | 516 | 68.7% |
| Self-Employed (Incorporated) | 8 | 1.1% |
| Self-Employed (Not Incorporated) | 54 | 7.2% |
| Not-for-profit Organizations | 42 | 5.6% |
| Local Government Employees | 55 | 7.3% |
| State Government Employees | 76 | 10.1% |
| Federal Government Employees | 0 | 0.0% |
| Unpaid Family Workers | 0 | 0.0% |
| Total | 751 | 100.0% |
Employment Status by Age in Cleary
According to the labor force statistics for Cleary, out of the total population over 16 years of age (1,726), 51.5% or 889 individuals are in the labor force, with 15.5% or 138 of them unemployed. The age group with the highest labor force participation rate is 45 to 54 years, with 100.0% or 40 individuals in the labor force. Within the labor force, the 16 to 19 years age range has the highest percentage of unemployed individuals, with 83.5% or 76 of them being unemployed.
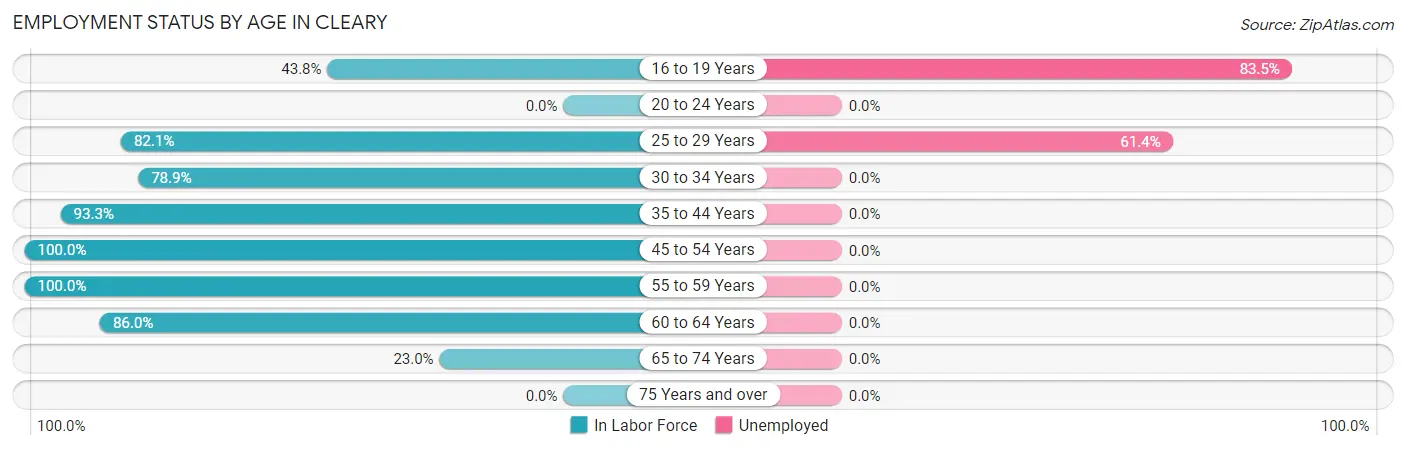
| Age Bracket | In Labor Force | Unemployed |
| 16 to 19 Years | 91 (43.8%) | 76 (83.5%) |
| 20 to 24 Years | 0 (0.0%) | 0 (0.0%) |
| 25 to 29 Years | 101 (82.1%) | 62 (61.4%) |
| 30 to 34 Years | 116 (78.9%) | 0 (0.0%) |
| 35 to 44 Years | 250 (93.3%) | 0 (0.0%) |
| 45 to 54 Years | 40 (100.0%) | 0 (0.0%) |
| 55 to 59 Years | 44 (100.0%) | 0 (0.0%) |
| 60 to 64 Years | 185 (86.0%) | 0 (0.0%) |
| 65 to 74 Years | 62 (23.0%) | 0 (0.0%) |
| 75 Years and over | 0 (0.0%) | 0 (0.0%) |
| Total | 889 (51.5%) | 138 (15.5%) |
Employment Status by Educational Attainment in Cleary
According to labor force statistics for Cleary, 87.9% of individuals (736) out of the total population between 25 and 64 years of age (837) are in the labor force, with 8.4% or 62 of them being unemployed. The group with the highest labor force participation rate are those with the educational attainment of college / associate degree, with 93.2% or 425 individuals in the labor force. Within the labor force, individuals with bachelor's degree or higher education have the highest percentage of unemployment, with 34.5% or 50 of them being unemployed.
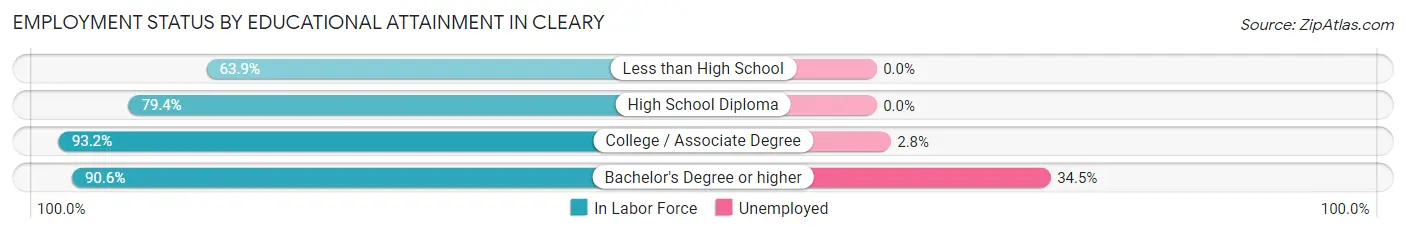
| Educational Attainment | In Labor Force | Unemployed |
| Less than High School | 39 (63.9%) | 0 (0.0%) |
| High School Diploma | 127 (79.4%) | 0 (0.0%) |
| College / Associate Degree | 425 (93.2%) | 13 (2.8%) |
| Bachelor's Degree or higher | 145 (90.6%) | 55 (34.5%) |
| Total | 736 (87.9%) | 70 (8.4%) |
Employment Occupations by Sex in Cleary
Management, Business, Science and Arts Occupations
The most common Management, Business, Science and Arts occupations in Cleary are Management (142 | 18.9%), Business & Financial (88 | 11.7%), Health Diagnosing & Treating (72 | 9.6%), Computers, Engineering & Science (21 | 2.8%), and Computers & Mathematics (16 | 2.1%).
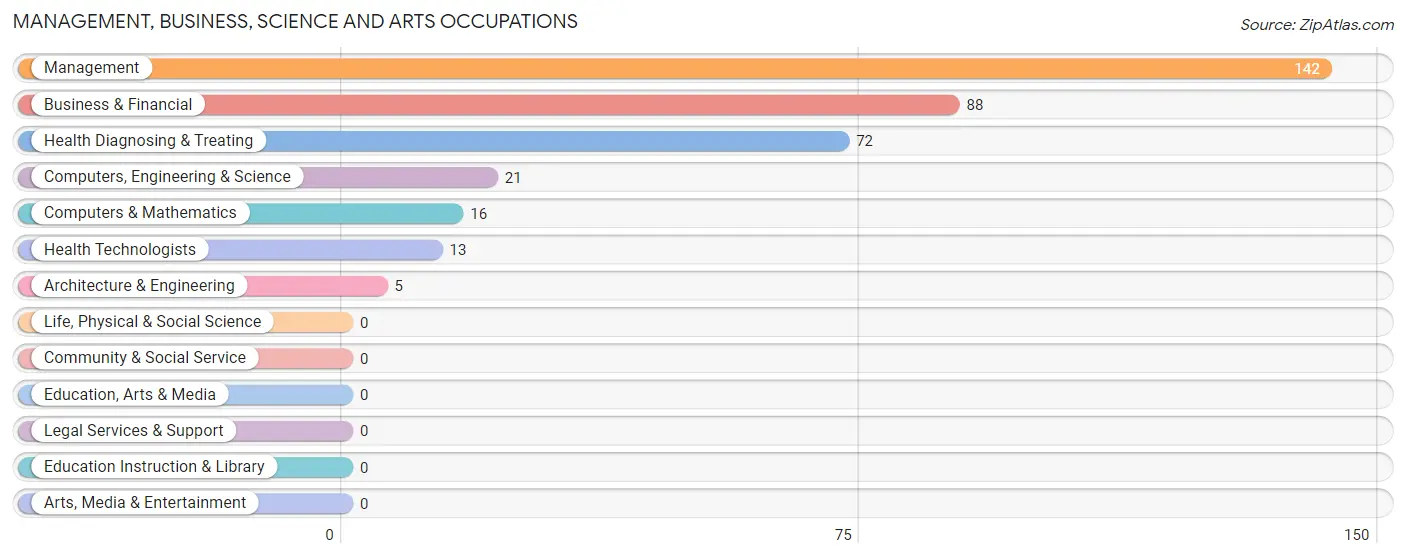
Management, Business, Science and Arts Occupations by Sex
Within the Management, Business, Science and Arts occupations in Cleary, the most male-oriented occupations are Computers, Engineering & Science (100.0%), Computers & Mathematics (100.0%), and Architecture & Engineering (100.0%), while the most female-oriented occupations are Health Diagnosing & Treating (100.0%), Health Technologists (100.0%), and Business & Financial (58.0%).
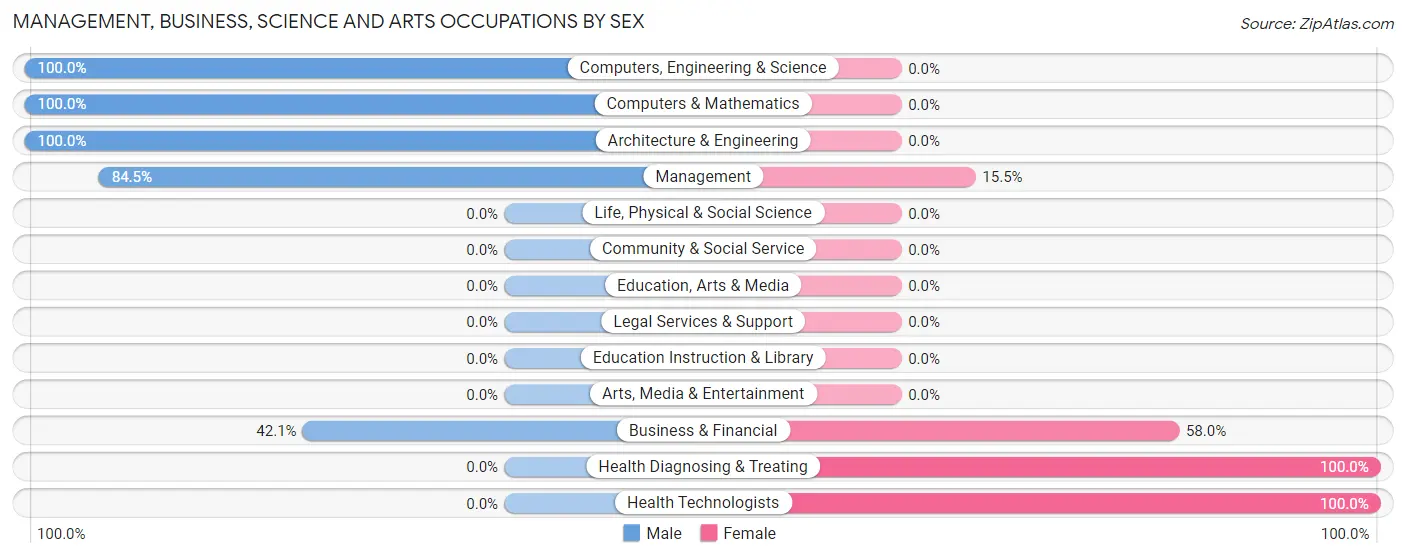
| Occupation | Male | Female |
| Management | 120 (84.5%) | 22 (15.5%) |
| Business & Financial | 37 (42.0%) | 51 (58.0%) |
| Computers, Engineering & Science | 21 (100.0%) | 0 (0.0%) |
| Computers & Mathematics | 16 (100.0%) | 0 (0.0%) |
| Architecture & Engineering | 5 (100.0%) | 0 (0.0%) |
| Life, Physical & Social Science | 0 (0.0%) | 0 (0.0%) |
| Community & Social Service | 0 (0.0%) | 0 (0.0%) |
| Education, Arts & Media | 0 (0.0%) | 0 (0.0%) |
| Legal Services & Support | 0 (0.0%) | 0 (0.0%) |
| Education Instruction & Library | 0 (0.0%) | 0 (0.0%) |
| Arts, Media & Entertainment | 0 (0.0%) | 0 (0.0%) |
| Health Diagnosing & Treating | 0 (0.0%) | 72 (100.0%) |
| Health Technologists | 0 (0.0%) | 13 (100.0%) |
| Total (Category) | 178 (55.1%) | 145 (44.9%) |
| Total (Overall) | 469 (62.5%) | 282 (37.6%) |
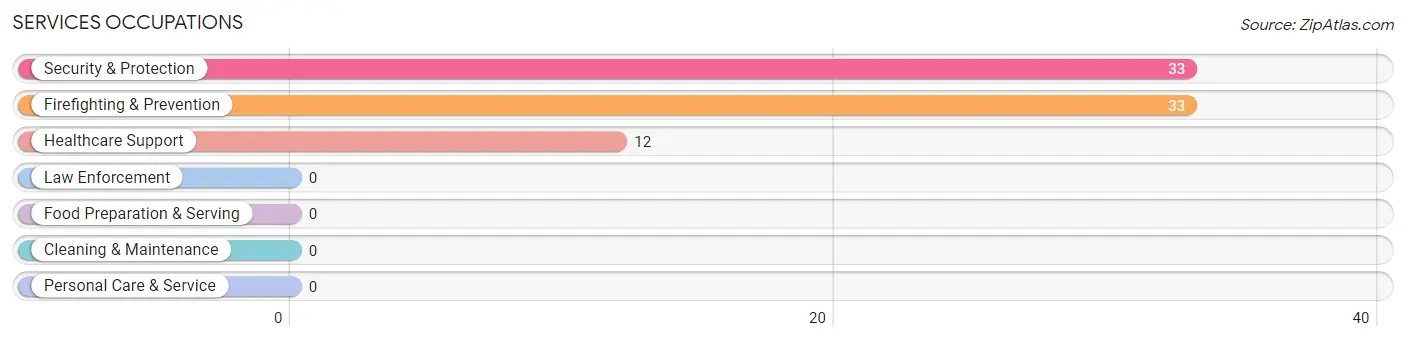
Services Occupations
The most common Services occupations in Cleary are Security & Protection (33 | 4.4%), Firefighting & Prevention (33 | 4.4%), and Healthcare Support (12 | 1.6%).
Services Occupations by Sex
Within the Services occupations in Cleary, the most male-oriented occupations are Security & Protection (78.8%), and Firefighting & Prevention (78.8%), while the most female-oriented occupations are Healthcare Support (100.0%), Security & Protection (21.2%), and Firefighting & Prevention (21.2%).
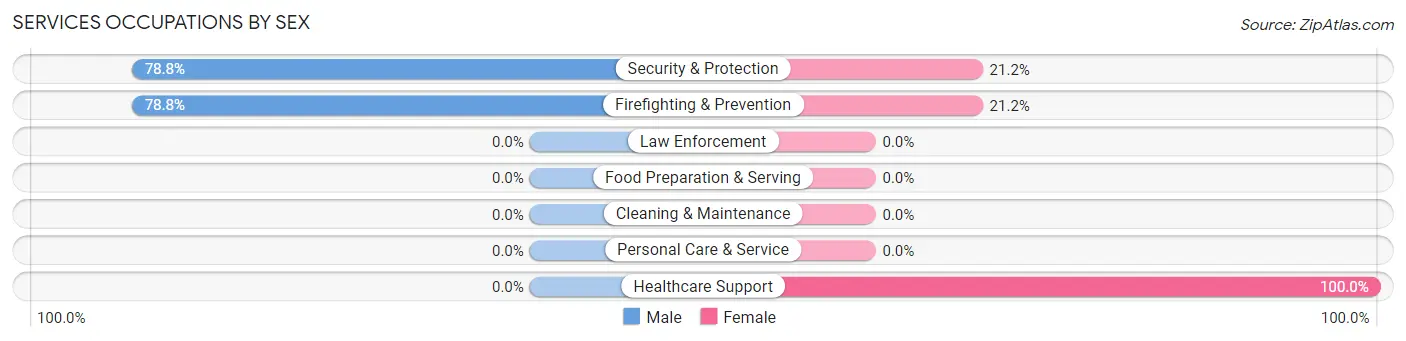
| Occupation | Male | Female |
| Healthcare Support | 0 (0.0%) | 12 (100.0%) |
| Security & Protection | 26 (78.8%) | 7 (21.2%) |
| Firefighting & Prevention | 26 (78.8%) | 7 (21.2%) |
| Law Enforcement | 0 (0.0%) | 0 (0.0%) |
| Food Preparation & Serving | 0 (0.0%) | 0 (0.0%) |
| Cleaning & Maintenance | 0 (0.0%) | 0 (0.0%) |
| Personal Care & Service | 0 (0.0%) | 0 (0.0%) |
| Total (Category) | 26 (57.8%) | 19 (42.2%) |
| Total (Overall) | 469 (62.5%) | 282 (37.6%) |
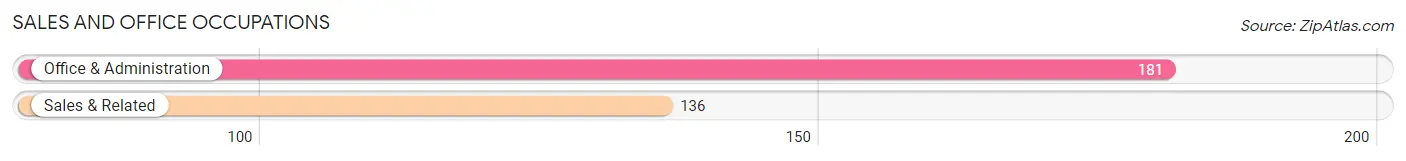
Sales and Office Occupations
The most common Sales and Office occupations in Cleary are Office & Administration (181 | 24.1%), and Sales & Related (136 | 18.1%).
Sales and Office Occupations by Sex
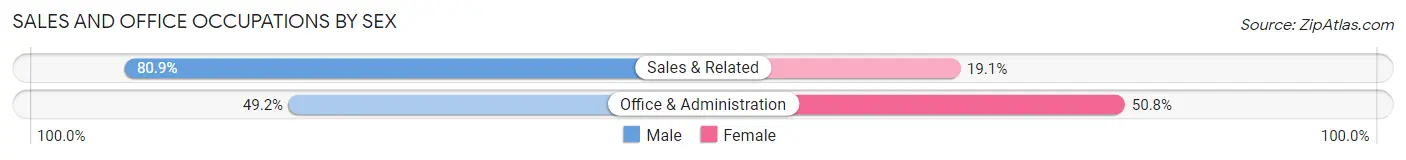
| Occupation | Male | Female |
| Sales & Related | 110 (80.9%) | 26 (19.1%) |
| Office & Administration | 89 (49.2%) | 92 (50.8%) |
| Total (Category) | 199 (62.8%) | 118 (37.2%) |
| Total (Overall) | 469 (62.5%) | 282 (37.6%) |
Natural Resources, Construction and Maintenance Occupations
The most common Natural Resources, Construction and Maintenance occupations in Cleary are , and Installation, Maintenance & Repair (66 | 8.8%).
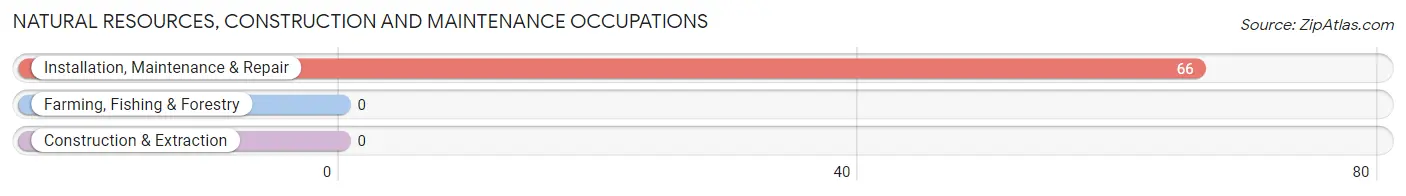
Natural Resources, Construction and Maintenance Occupations by Sex
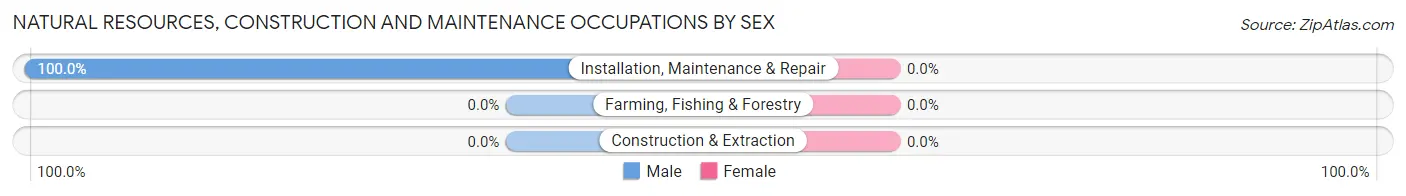
| Occupation | Male | Female |
| Farming, Fishing & Forestry | 0 (0.0%) | 0 (0.0%) |
| Construction & Extraction | 0 (0.0%) | 0 (0.0%) |
| Installation, Maintenance & Repair | 66 (100.0%) | 0 (0.0%) |
| Total (Category) | 66 (100.0%) | 0 (0.0%) |
| Total (Overall) | 469 (62.5%) | 282 (37.6%) |
Production, Transportation and Moving Occupations
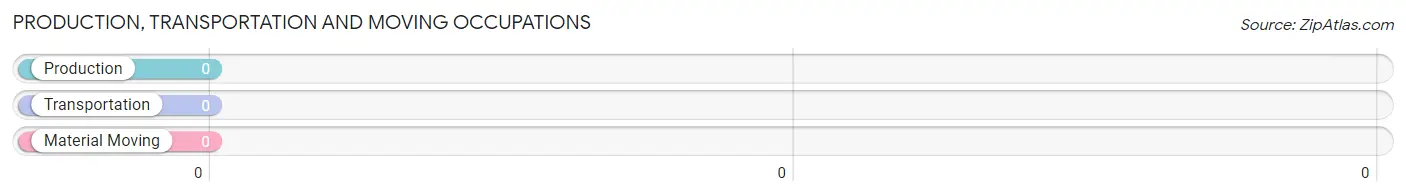
Production, Transportation and Moving Occupations by Sex
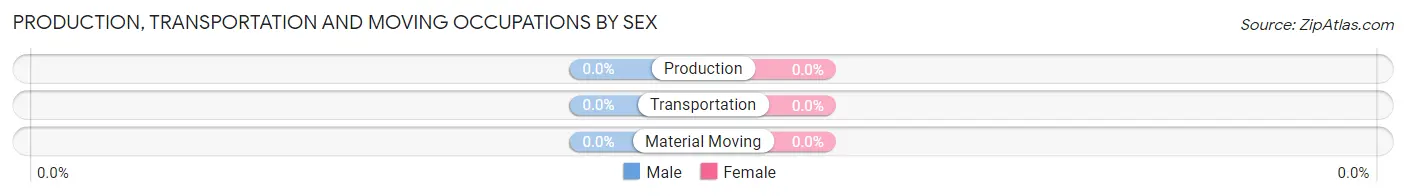
| Occupation | Male | Female |
| Production | 0 (0.0%) | 0 (0.0%) |
| Transportation | 0 (0.0%) | 0 (0.0%) |
| Material Moving | 0 (0.0%) | 0 (0.0%) |
| Total (Category) | 0 (0.0%) | 0 (0.0%) |
| Total (Overall) | 469 (62.5%) | 282 (37.6%) |
Employment Industries by Sex in Cleary
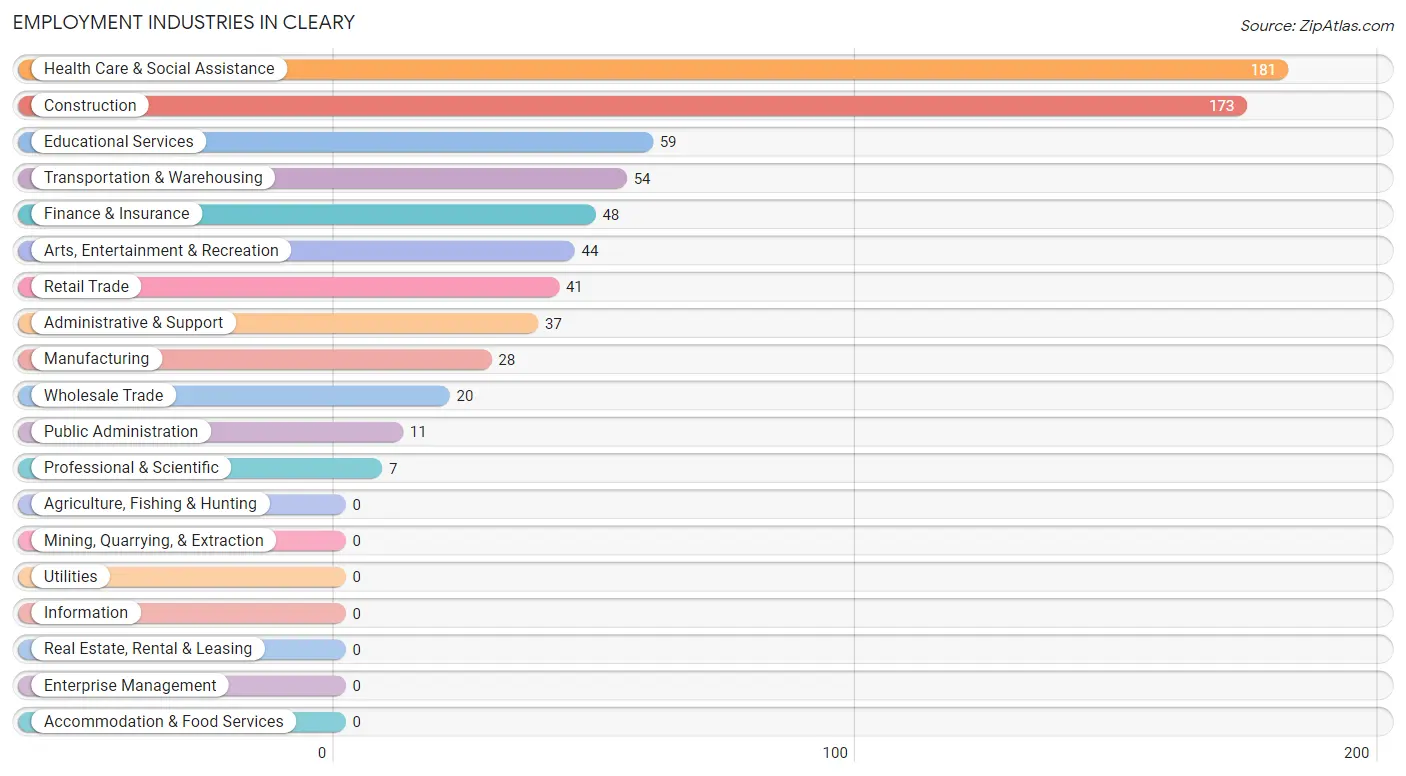
Employment Industries in Cleary
The major employment industries in Cleary include Health Care & Social Assistance (181 | 24.1%), Construction (173 | 23.0%), Educational Services (59 | 7.9%), Transportation & Warehousing (54 | 7.2%), and Finance & Insurance (48 | 6.4%).
Employment Industries by Sex in Cleary
The Cleary industries that see more men than women are Construction (100.0%), Wholesale Trade (100.0%), and Professional & Scientific (100.0%), whereas the industries that tend to have a higher number of women are Finance & Insurance (100.0%), Health Care & Social Assistance (72.9%), and Retail Trade (63.4%).
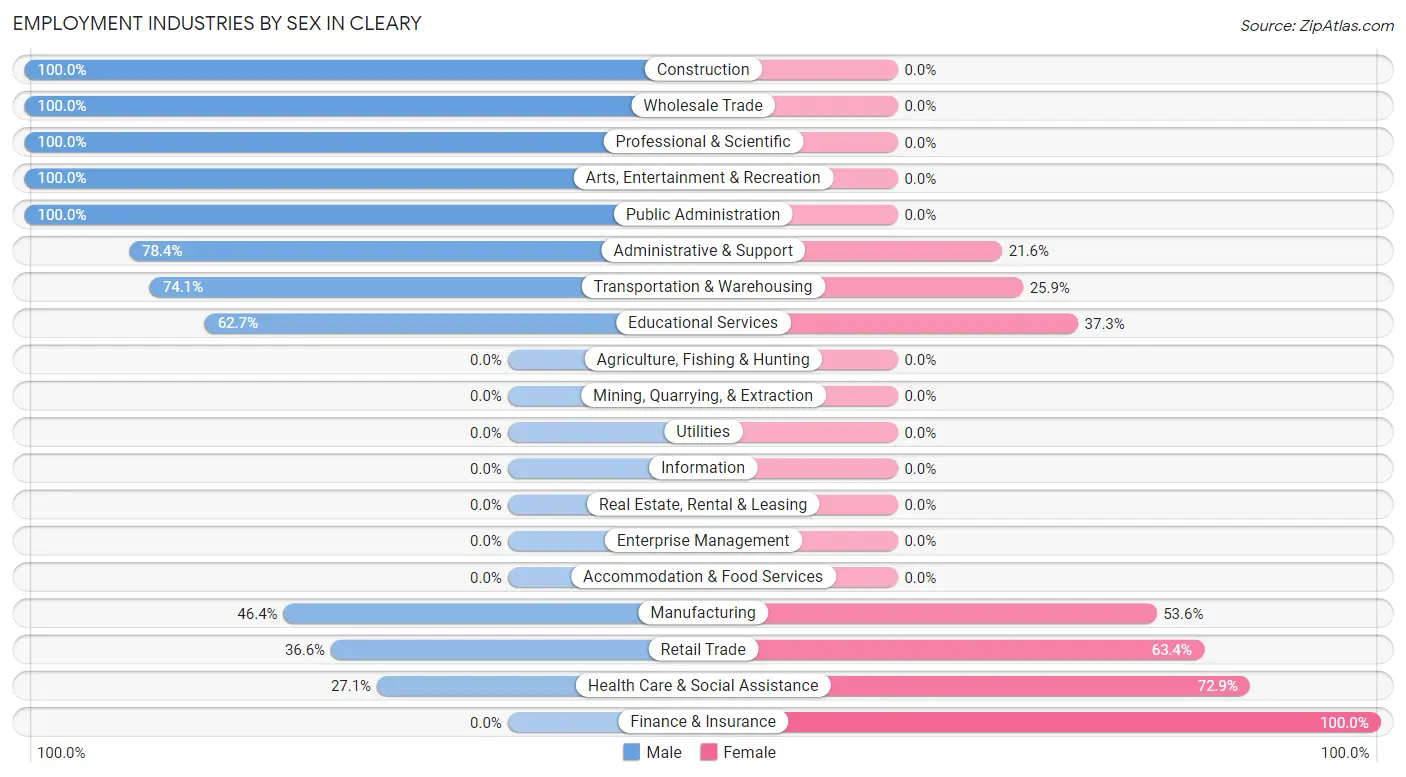
| Industry | Male | Female |
| Agriculture, Fishing & Hunting | 0 (0.0%) | 0 (0.0%) |
| Mining, Quarrying, & Extraction | 0 (0.0%) | 0 (0.0%) |
| Construction | 173 (100.0%) | 0 (0.0%) |
| Manufacturing | 13 (46.4%) | 15 (53.6%) |
| Wholesale Trade | 20 (100.0%) | 0 (0.0%) |
| Retail Trade | 15 (36.6%) | 26 (63.4%) |
| Transportation & Warehousing | 40 (74.1%) | 14 (25.9%) |
| Utilities | 0 (0.0%) | 0 (0.0%) |
| Information | 0 (0.0%) | 0 (0.0%) |
| Finance & Insurance | 0 (0.0%) | 48 (100.0%) |
| Real Estate, Rental & Leasing | 0 (0.0%) | 0 (0.0%) |
| Professional & Scientific | 7 (100.0%) | 0 (0.0%) |
| Enterprise Management | 0 (0.0%) | 0 (0.0%) |
| Administrative & Support | 29 (78.4%) | 8 (21.6%) |
| Educational Services | 37 (62.7%) | 22 (37.3%) |
| Health Care & Social Assistance | 49 (27.1%) | 132 (72.9%) |
| Arts, Entertainment & Recreation | 44 (100.0%) | 0 (0.0%) |
| Accommodation & Food Services | 0 (0.0%) | 0 (0.0%) |
| Public Administration | 11 (100.0%) | 0 (0.0%) |
| Total | 469 (62.5%) | 282 (37.6%) |
Education in Cleary
School Enrollment in Cleary
The most common levels of schooling among the 553 students in Cleary are college / undergraduate (149 | 26.9%), middle school (146 | 26.4%), and high school (135 | 24.4%).
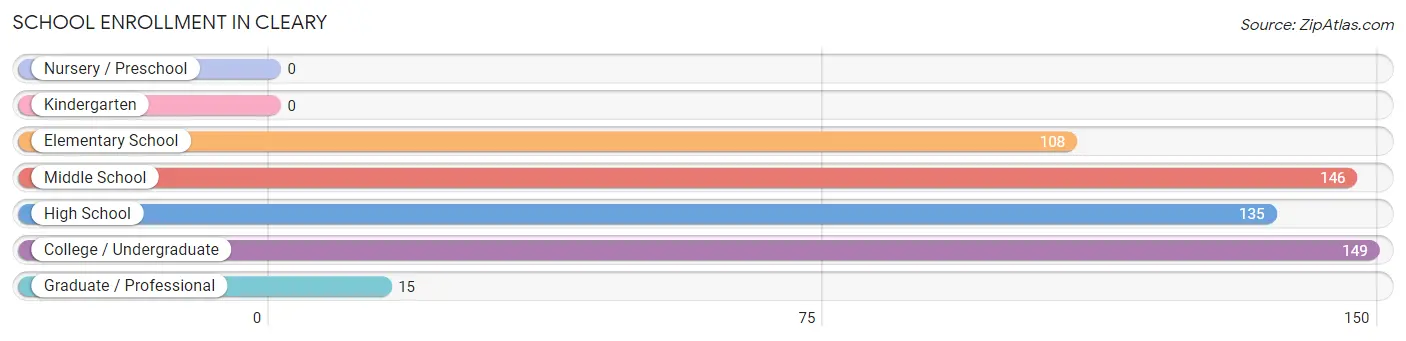
| School Level | # Students | % Students |
| Nursery / Preschool | 0 | 0.0% |
| Kindergarten | 0 | 0.0% |
| Elementary School | 108 | 19.5% |
| Middle School | 146 | 26.4% |
| High School | 135 | 24.4% |
| College / Undergraduate | 149 | 26.9% |
| Graduate / Professional | 15 | 2.7% |
| Total | 553 | 100.0% |
School Enrollment by Age by Funding Source in Cleary
Out of a total of 553 students who are enrolled in schools in Cleary, 41 (7.4%) attend a private institution, while the remaining 512 (92.6%) are enrolled in public schools. The age group of 10 to 14 year olds has the highest likelihood of being enrolled in private schools, with 41 (25.3% in the age bracket) enrolled. Conversely, the age group of 5 to 9 year old has the lowest likelihood of being enrolled in a private school, with 92 (100.0% in the age bracket) attending a public institution.
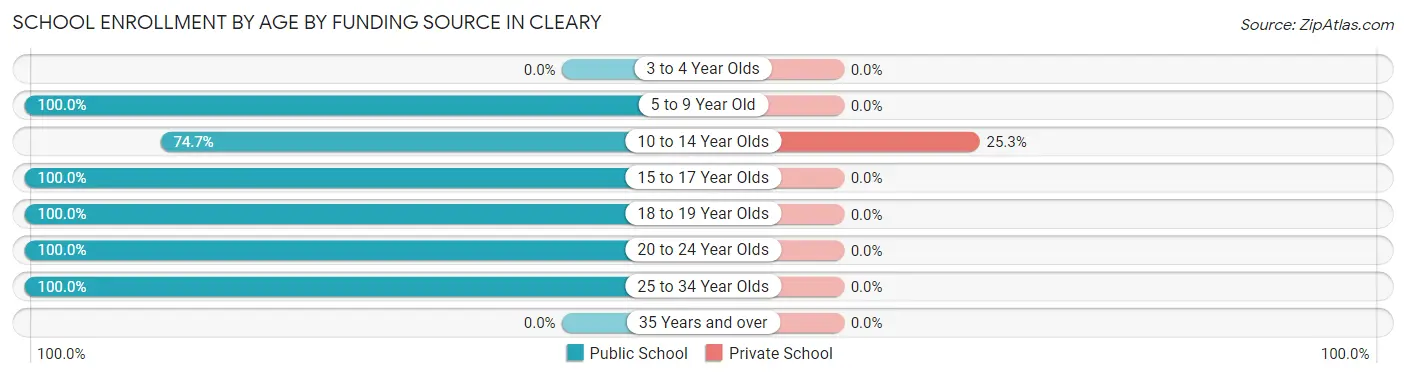
| Age Bracket | Public School | Private School |
| 3 to 4 Year Olds | 0 (0.0%) | 0 (0.0%) |
| 5 to 9 Year Old | 92 (100.0%) | 0 (0.0%) |
| 10 to 14 Year Olds | 121 (74.7%) | 41 (25.3%) |
| 15 to 17 Year Olds | 103 (100.0%) | 0 (0.0%) |
| 18 to 19 Year Olds | 69 (100.0%) | 0 (0.0%) |
| 20 to 24 Year Olds | 62 (100.0%) | 0 (0.0%) |
| 25 to 34 Year Olds | 65 (100.0%) | 0 (0.0%) |
| 35 Years and over | 0 (0.0%) | 0 (0.0%) |
| Total | 512 (92.6%) | 41 (7.4%) |
Educational Attainment by Field of Study in Cleary
Business (146 | 47.1%), science & technology (92 | 29.7%), computers & mathematics (42 | 13.6%), literature & languages (15 | 4.8%), and visual & performing arts (15 | 4.8%) are the most common fields of study among 310 individuals in Cleary who have obtained a bachelor's degree or higher.
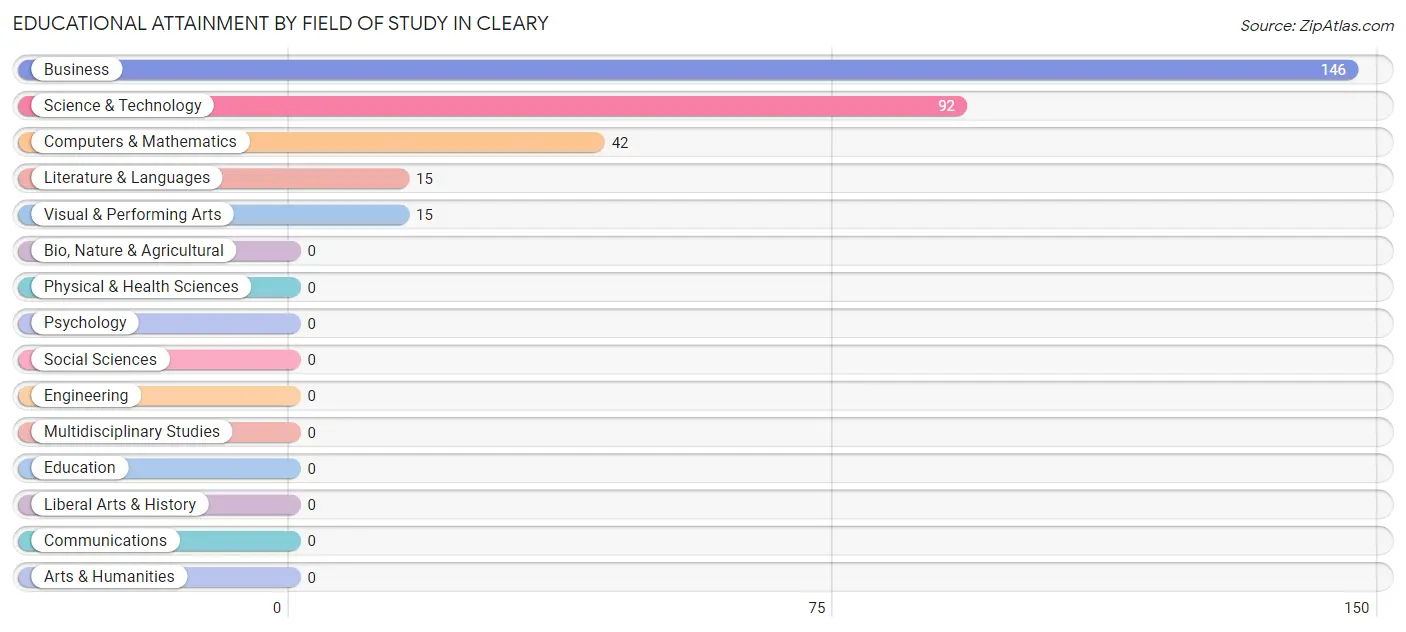
| Field of Study | # Graduates | % Graduates |
| Computers & Mathematics | 42 | 13.6% |
| Bio, Nature & Agricultural | 0 | 0.0% |
| Physical & Health Sciences | 0 | 0.0% |
| Psychology | 0 | 0.0% |
| Social Sciences | 0 | 0.0% |
| Engineering | 0 | 0.0% |
| Multidisciplinary Studies | 0 | 0.0% |
| Science & Technology | 92 | 29.7% |
| Business | 146 | 47.1% |
| Education | 0 | 0.0% |
| Literature & Languages | 15 | 4.8% |
| Liberal Arts & History | 0 | 0.0% |
| Visual & Performing Arts | 15 | 4.8% |
| Communications | 0 | 0.0% |
| Arts & Humanities | 0 | 0.0% |
| Total | 310 | 100.0% |
Transportation & Commute in Cleary
Vehicle Availability by Sex in Cleary
The most prevalent vehicle ownership categories in Cleary are males with 2 vehicles (315, accounting for 67.2%) and females with 2 vehicles (134, making up 111.7%).
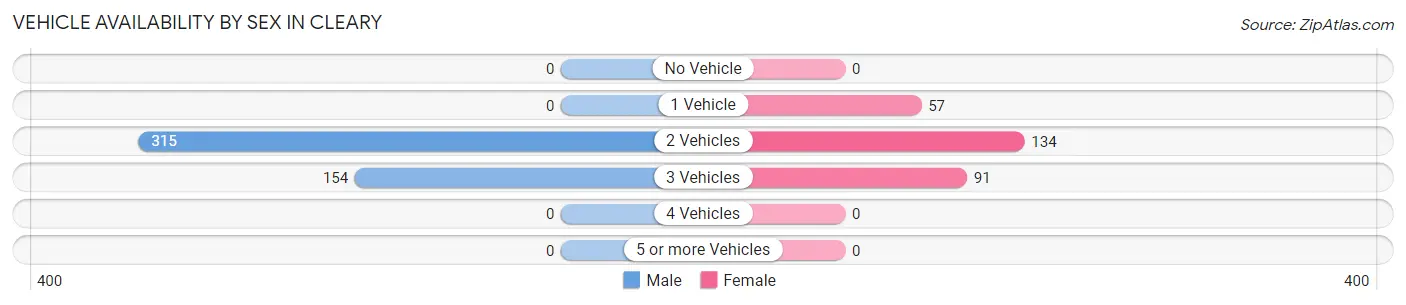
| Vehicles Available | Male | Female |
| No Vehicle | 0 (0.0%) | 0 (0.0%) |
| 1 Vehicle | 0 (0.0%) | 57 (20.2%) |
| 2 Vehicles | 315 (67.2%) | 134 (47.5%) |
| 3 Vehicles | 154 (32.8%) | 91 (32.3%) |
| 4 Vehicles | 0 (0.0%) | 0 (0.0%) |
| 5 or more Vehicles | 0 (0.0%) | 0 (0.0%) |
| Total | 469 (100.0%) | 282 (100.0%) |
Commute Time in Cleary
The most frequently occuring commute durations in Cleary are 30 to 34 minutes (262 commuters, 37.1%), 25 to 29 minutes (141 commuters, 20.0%), and 15 to 19 minutes (85 commuters, 12.0%).
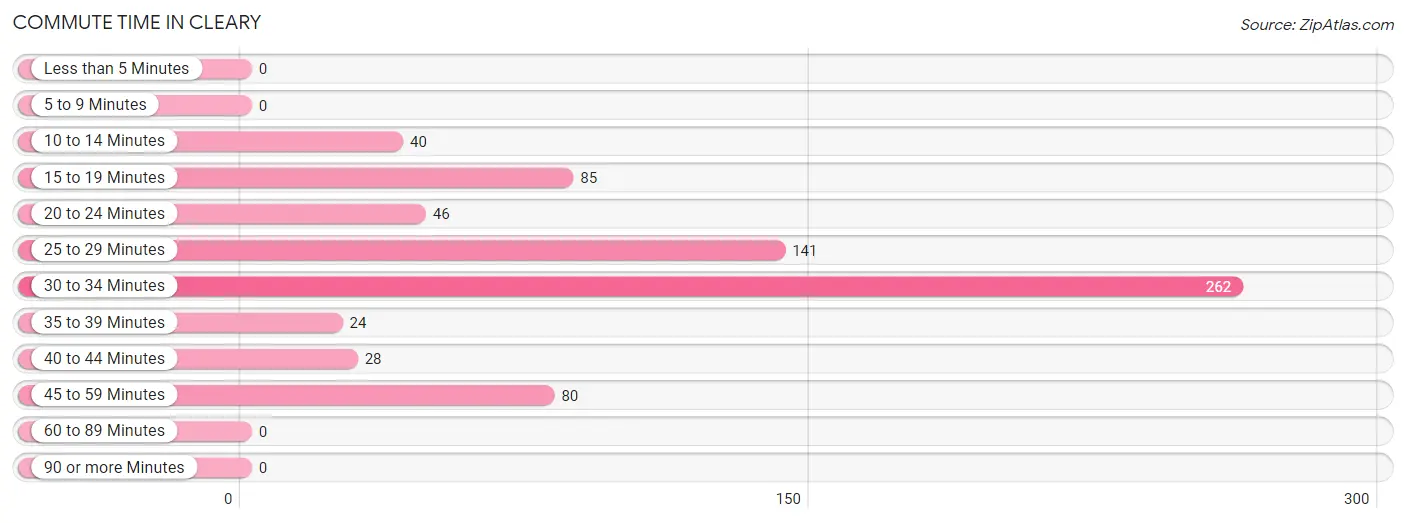
| Commute Time | # Commuters | % Commuters |
| Less than 5 Minutes | 0 | 0.0% |
| 5 to 9 Minutes | 0 | 0.0% |
| 10 to 14 Minutes | 40 | 5.7% |
| 15 to 19 Minutes | 85 | 12.0% |
| 20 to 24 Minutes | 46 | 6.5% |
| 25 to 29 Minutes | 141 | 20.0% |
| 30 to 34 Minutes | 262 | 37.1% |
| 35 to 39 Minutes | 24 | 3.4% |
| 40 to 44 Minutes | 28 | 4.0% |
| 45 to 59 Minutes | 80 | 11.3% |
| 60 to 89 Minutes | 0 | 0.0% |
| 90 or more Minutes | 0 | 0.0% |
Commute Time by Sex in Cleary
The most common commute times in Cleary are 30 to 34 minutes (115 commuters, 25.7%) for males and 30 to 34 minutes (147 commuters, 57.0%) for females.
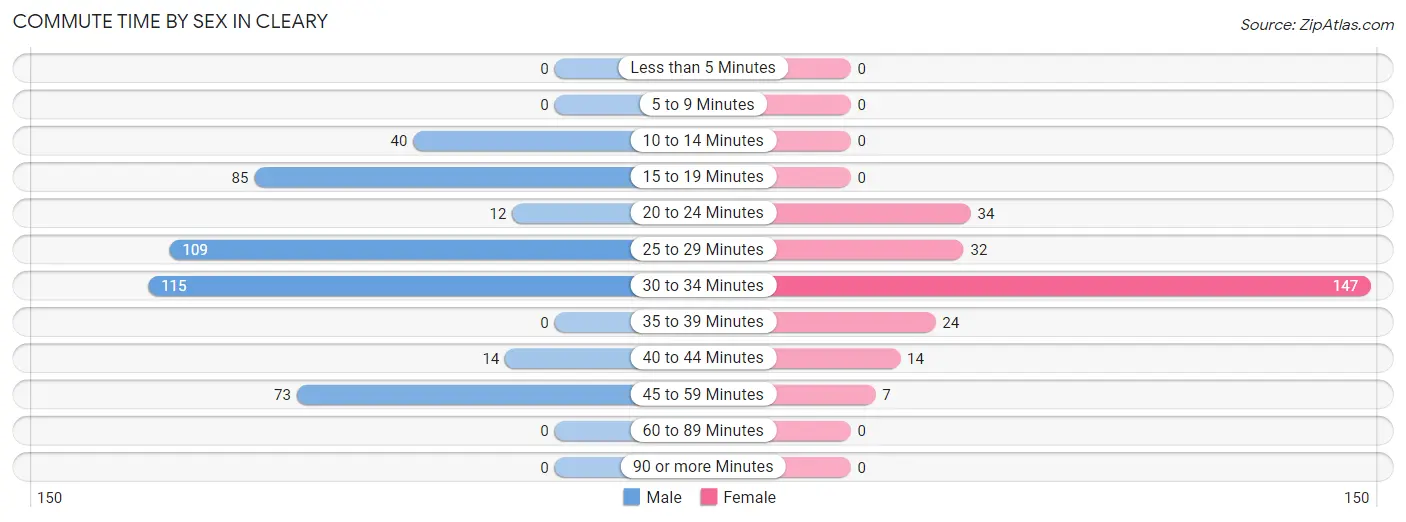
| Commute Time | Male | Female |
| Less than 5 Minutes | 0 (0.0%) | 0 (0.0%) |
| 5 to 9 Minutes | 0 (0.0%) | 0 (0.0%) |
| 10 to 14 Minutes | 40 (8.9%) | 0 (0.0%) |
| 15 to 19 Minutes | 85 (19.0%) | 0 (0.0%) |
| 20 to 24 Minutes | 12 (2.7%) | 34 (13.2%) |
| 25 to 29 Minutes | 109 (24.3%) | 32 (12.4%) |
| 30 to 34 Minutes | 115 (25.7%) | 147 (57.0%) |
| 35 to 39 Minutes | 0 (0.0%) | 24 (9.3%) |
| 40 to 44 Minutes | 14 (3.1%) | 14 (5.4%) |
| 45 to 59 Minutes | 73 (16.3%) | 7 (2.7%) |
| 60 to 89 Minutes | 0 (0.0%) | 0 (0.0%) |
| 90 or more Minutes | 0 (0.0%) | 0 (0.0%) |
Time of Departure to Work by Sex in Cleary
The most frequent times of departure to work in Cleary are 7:00 AM to 7:29 AM (155, 34.6%) for males and 7:30 AM to 7:59 AM (129, 50.0%) for females.
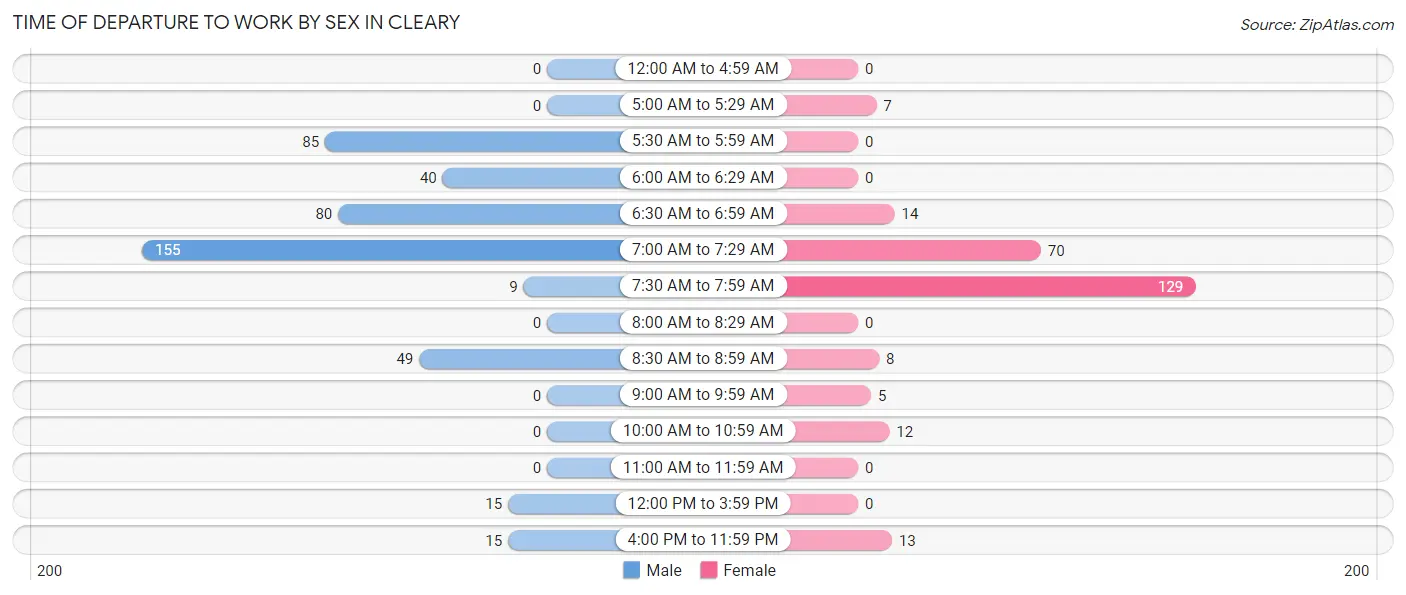
| Time of Departure | Male | Female |
| 12:00 AM to 4:59 AM | 0 (0.0%) | 0 (0.0%) |
| 5:00 AM to 5:29 AM | 0 (0.0%) | 7 (2.7%) |
| 5:30 AM to 5:59 AM | 85 (19.0%) | 0 (0.0%) |
| 6:00 AM to 6:29 AM | 40 (8.9%) | 0 (0.0%) |
| 6:30 AM to 6:59 AM | 80 (17.9%) | 14 (5.4%) |
| 7:00 AM to 7:29 AM | 155 (34.6%) | 70 (27.1%) |
| 7:30 AM to 7:59 AM | 9 (2.0%) | 129 (50.0%) |
| 8:00 AM to 8:29 AM | 0 (0.0%) | 0 (0.0%) |
| 8:30 AM to 8:59 AM | 49 (10.9%) | 8 (3.1%) |
| 9:00 AM to 9:59 AM | 0 (0.0%) | 5 (1.9%) |
| 10:00 AM to 10:59 AM | 0 (0.0%) | 12 (4.6%) |
| 11:00 AM to 11:59 AM | 0 (0.0%) | 0 (0.0%) |
| 12:00 PM to 3:59 PM | 15 (3.4%) | 0 (0.0%) |
| 4:00 PM to 11:59 PM | 15 (3.4%) | 13 (5.0%) |
| Total | 448 (100.0%) | 258 (100.0%) |
Housing Occupancy in Cleary
Occupancy by Ownership in Cleary
Of the total 895 dwellings in Cleary, owner-occupied units account for 819 (91.5%), while renter-occupied units make up 76 (8.5%).
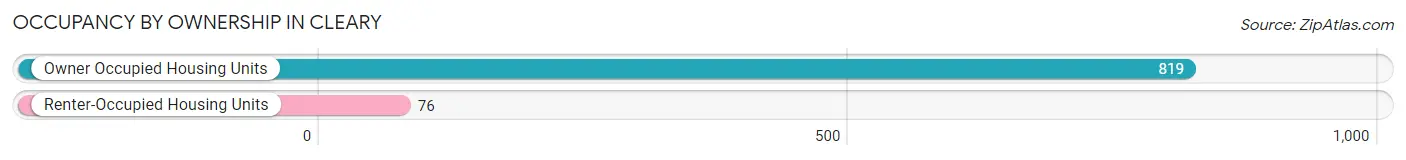
| Occupancy | # Housing Units | % Housing Units |
| Owner Occupied Housing Units | 819 | 91.5% |
| Renter-Occupied Housing Units | 76 | 8.5% |
| Total Occupied Housing Units | 895 | 100.0% |
Occupancy by Household Size in Cleary
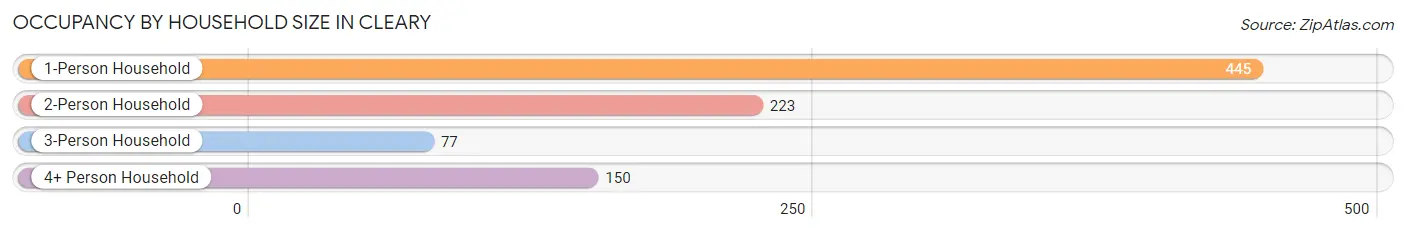
| Household Size | # Housing Units | % Housing Units |
| 1-Person Household | 445 | 49.7% |
| 2-Person Household | 223 | 24.9% |
| 3-Person Household | 77 | 8.6% |
| 4+ Person Household | 150 | 16.8% |
| Total Housing Units | 895 | 100.0% |
Occupancy by Ownership by Household Size in Cleary
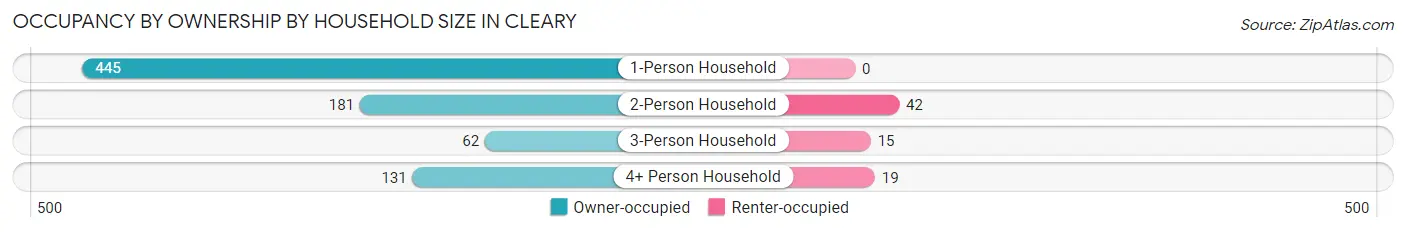
| Household Size | Owner-occupied | Renter-occupied |
| 1-Person Household | 445 (100.0%) | 0 (0.0%) |
| 2-Person Household | 181 (81.2%) | 42 (18.8%) |
| 3-Person Household | 62 (80.5%) | 15 (19.5%) |
| 4+ Person Household | 131 (87.3%) | 19 (12.7%) |
| Total Housing Units | 819 (91.5%) | 76 (8.5%) |
Occupancy by Educational Attainment in Cleary
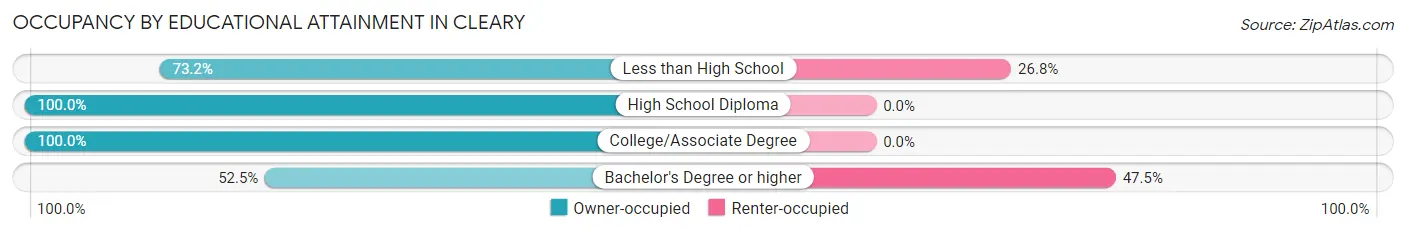
| Household Size | Owner-occupied | Renter-occupied |
| Less than High School | 52 (73.2%) | 19 (26.8%) |
| High School Diploma | 361 (100.0%) | 0 (0.0%) |
| College/Associate Degree | 343 (100.0%) | 0 (0.0%) |
| Bachelor's Degree or higher | 63 (52.5%) | 57 (47.5%) |
Occupancy by Age of Householder in Cleary
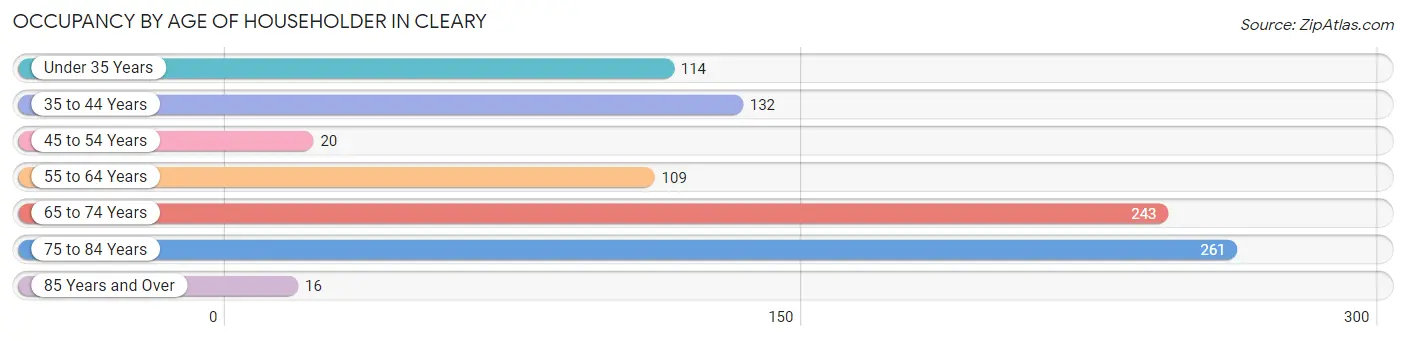
| Age Bracket | # Households | % Households |
| Under 35 Years | 114 | 12.7% |
| 35 to 44 Years | 132 | 14.7% |
| 45 to 54 Years | 20 | 2.2% |
| 55 to 64 Years | 109 | 12.2% |
| 65 to 74 Years | 243 | 27.2% |
| 75 to 84 Years | 261 | 29.2% |
| 85 Years and Over | 16 | 1.8% |
| Total | 895 | 100.0% |
Housing Finances in Cleary
Median Income by Occupancy in Cleary
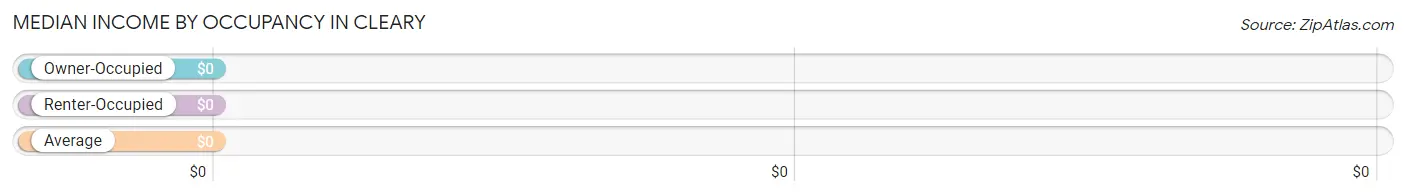
| Occupancy Type | # Households | Median Income |
| Owner-Occupied | 819 (91.5%) | $0 |
| Renter-Occupied | 76 (8.5%) | $0 |
| Average | 895 (100.0%) | $0 |
Occupancy by Householder Income Bracket in Cleary
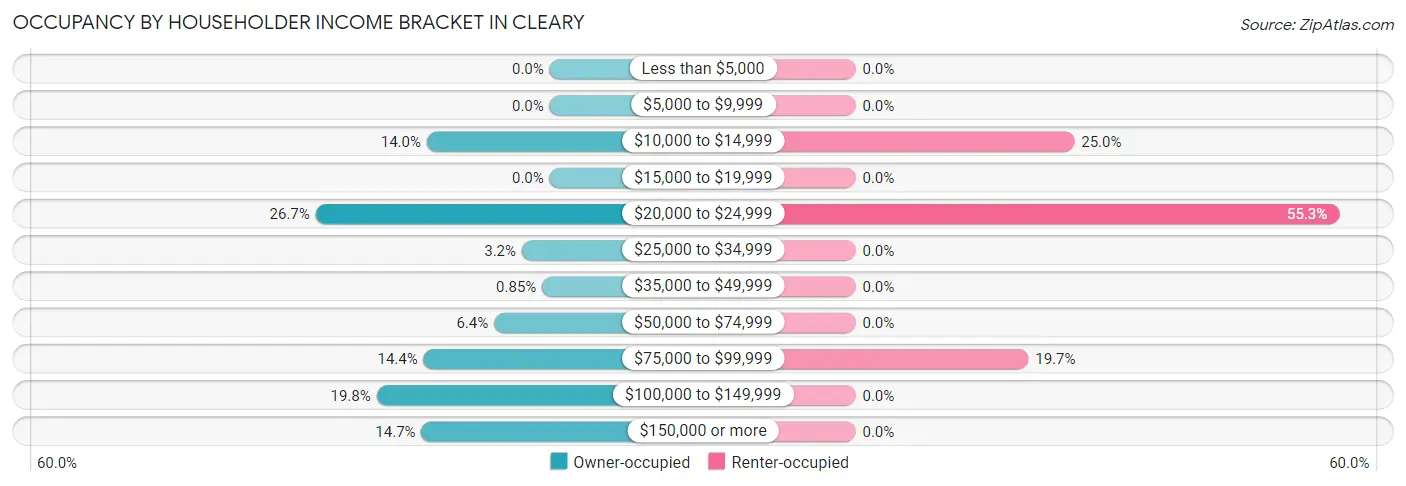
| Income Bracket | Owner-occupied | Renter-occupied |
| Less than $5,000 | 0 (0.0%) | 0 (0.0%) |
| $5,000 to $9,999 | 0 (0.0%) | 0 (0.0%) |
| $10,000 to $14,999 | 115 (14.0%) | 19 (25.0%) |
| $15,000 to $19,999 | 0 (0.0%) | 0 (0.0%) |
| $20,000 to $24,999 | 219 (26.7%) | 42 (55.3%) |
| $25,000 to $34,999 | 26 (3.2%) | 0 (0.0%) |
| $35,000 to $49,999 | 7 (0.9%) | 0 (0.0%) |
| $50,000 to $74,999 | 52 (6.4%) | 0 (0.0%) |
| $75,000 to $99,999 | 118 (14.4%) | 15 (19.7%) |
| $100,000 to $149,999 | 162 (19.8%) | 0 (0.0%) |
| $150,000 or more | 120 (14.6%) | 0 (0.0%) |
| Total | 819 (100.0%) | 76 (100.0%) |
Monthly Housing Cost Tiers in Cleary
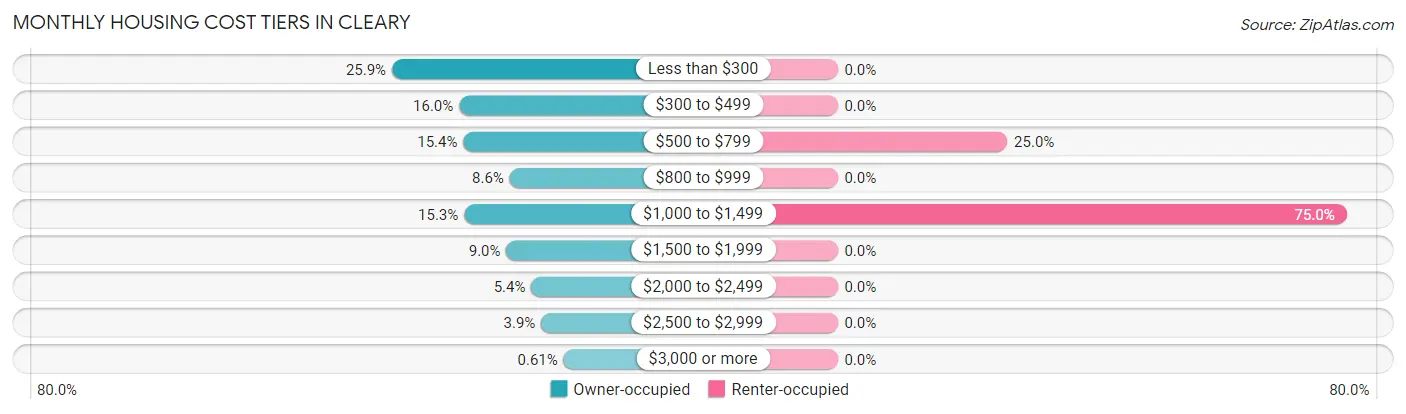
| Monthly Cost | Owner-occupied | Renter-occupied |
| Less than $300 | 212 (25.9%) | 0 (0.0%) |
| $300 to $499 | 131 (16.0%) | 0 (0.0%) |
| $500 to $799 | 126 (15.4%) | 19 (25.0%) |
| $800 to $999 | 70 (8.6%) | 0 (0.0%) |
| $1,000 to $1,499 | 125 (15.3%) | 57 (75.0%) |
| $1,500 to $1,999 | 74 (9.0%) | 0 (0.0%) |
| $2,000 to $2,499 | 44 (5.4%) | 0 (0.0%) |
| $2,500 to $2,999 | 32 (3.9%) | 0 (0.0%) |
| $3,000 or more | 5 (0.6%) | 0 (0.0%) |
| Total | 819 (100.0%) | 76 (100.0%) |
Physical Housing Characteristics in Cleary
Housing Structures in Cleary
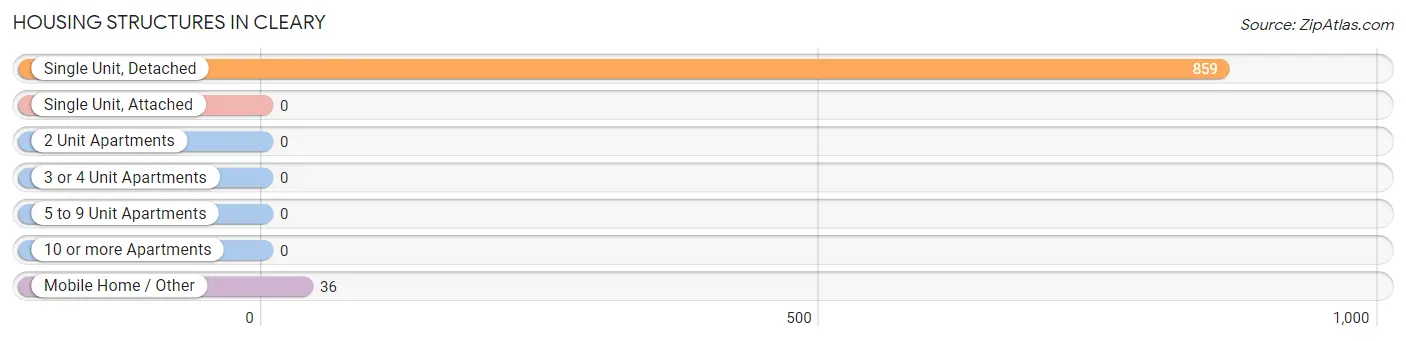
| Structure Type | # Housing Units | % Housing Units |
| Single Unit, Detached | 859 | 96.0% |
| Single Unit, Attached | 0 | 0.0% |
| 2 Unit Apartments | 0 | 0.0% |
| 3 or 4 Unit Apartments | 0 | 0.0% |
| 5 to 9 Unit Apartments | 0 | 0.0% |
| 10 or more Apartments | 0 | 0.0% |
| Mobile Home / Other | 36 | 4.0% |
| Total | 895 | 100.0% |
Housing Structures by Occupancy in Cleary
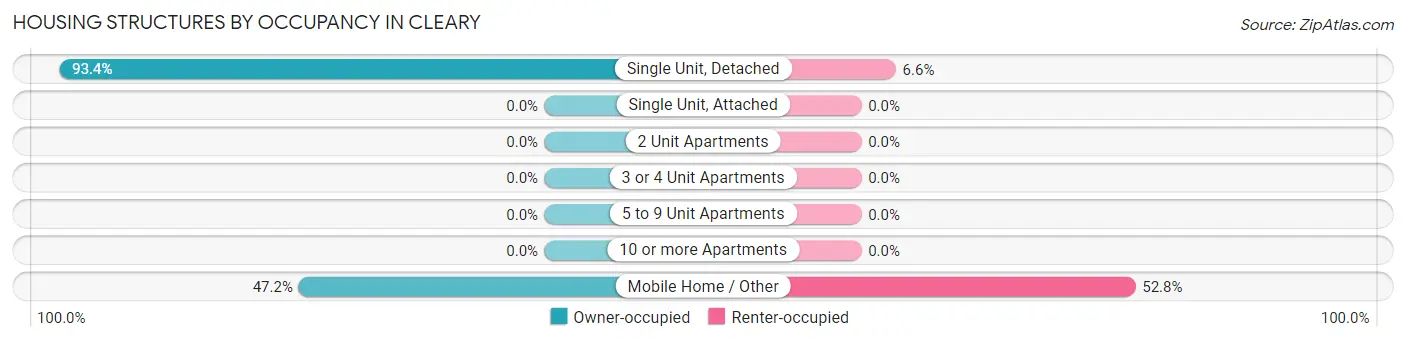
| Structure Type | Owner-occupied | Renter-occupied |
| Single Unit, Detached | 802 (93.4%) | 57 (6.6%) |
| Single Unit, Attached | 0 (0.0%) | 0 (0.0%) |
| 2 Unit Apartments | 0 (0.0%) | 0 (0.0%) |
| 3 or 4 Unit Apartments | 0 (0.0%) | 0 (0.0%) |
| 5 to 9 Unit Apartments | 0 (0.0%) | 0 (0.0%) |
| 10 or more Apartments | 0 (0.0%) | 0 (0.0%) |
| Mobile Home / Other | 17 (47.2%) | 19 (52.8%) |
| Total | 819 (91.5%) | 76 (8.5%) |
Housing Structures by Number of Rooms in Cleary
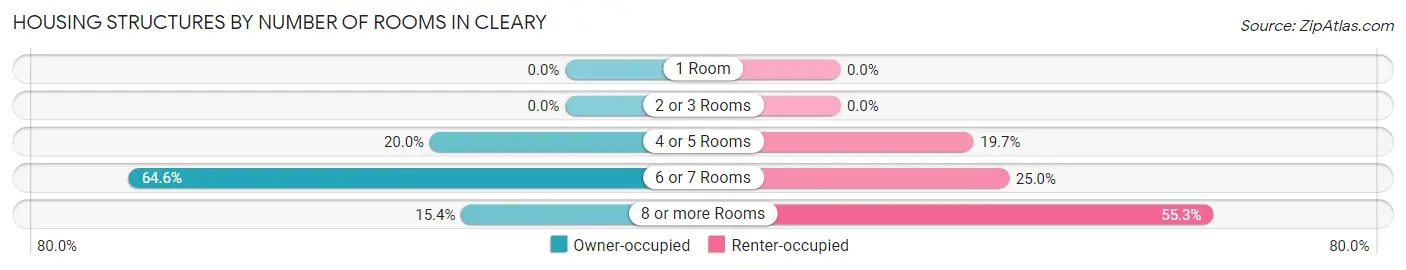
| Number of Rooms | Owner-occupied | Renter-occupied |
| 1 Room | 0 (0.0%) | 0 (0.0%) |
| 2 or 3 Rooms | 0 (0.0%) | 0 (0.0%) |
| 4 or 5 Rooms | 164 (20.0%) | 15 (19.7%) |
| 6 or 7 Rooms | 529 (64.6%) | 19 (25.0%) |
| 8 or more Rooms | 126 (15.4%) | 42 (55.3%) |
| Total | 819 (100.0%) | 76 (100.0%) |
Housing Structure by Heating Type in Cleary
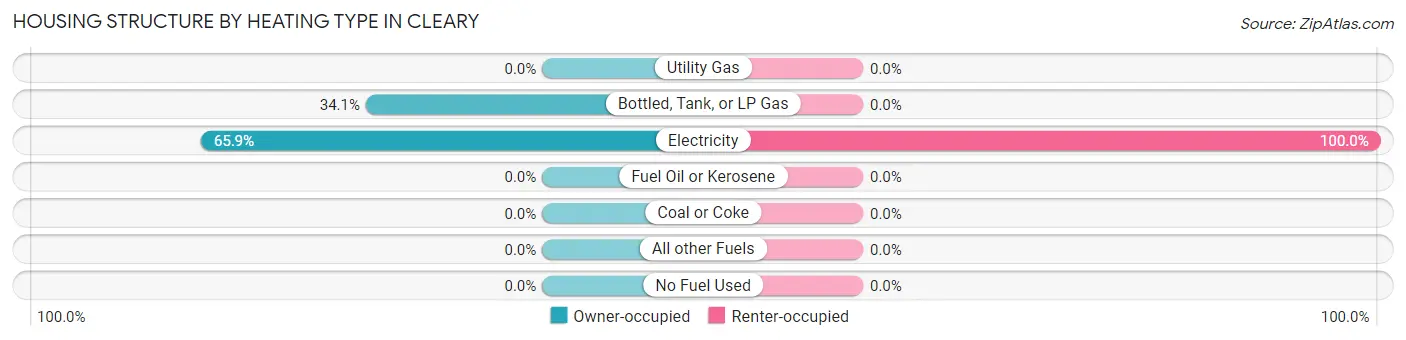
| Heating Type | Owner-occupied | Renter-occupied |
| Utility Gas | 0 (0.0%) | 0 (0.0%) |
| Bottled, Tank, or LP Gas | 279 (34.1%) | 0 (0.0%) |
| Electricity | 540 (65.9%) | 76 (100.0%) |
| Fuel Oil or Kerosene | 0 (0.0%) | 0 (0.0%) |
| Coal or Coke | 0 (0.0%) | 0 (0.0%) |
| All other Fuels | 0 (0.0%) | 0 (0.0%) |
| No Fuel Used | 0 (0.0%) | 0 (0.0%) |
| Total | 819 (100.0%) | 76 (100.0%) |
Household Vehicle Usage in Cleary
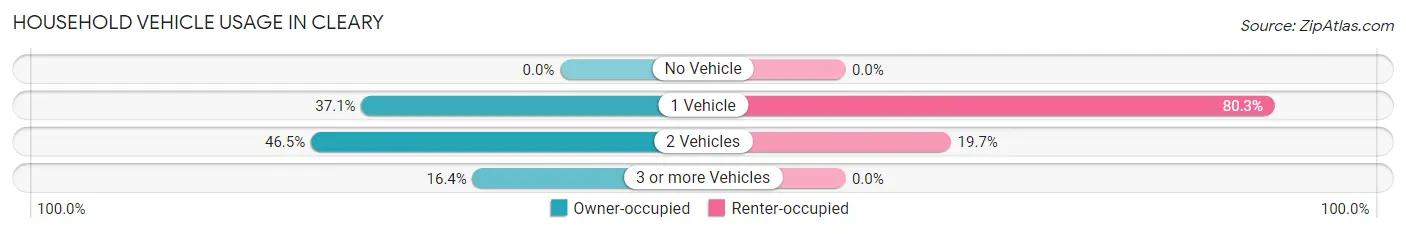
| Vehicles per Household | Owner-occupied | Renter-occupied |
| No Vehicle | 0 (0.0%) | 0 (0.0%) |
| 1 Vehicle | 304 (37.1%) | 61 (80.3%) |
| 2 Vehicles | 381 (46.5%) | 15 (19.7%) |
| 3 or more Vehicles | 134 (16.4%) | 0 (0.0%) |
| Total | 819 (100.0%) | 76 (100.0%) |
Real Estate & Mortgages in Cleary
Real Estate and Mortgage Overview in Cleary
| Characteristic | Without Mortgage | With Mortgage |
| Housing Units | 474 | 345 |
| Median Property Value | $115,900 | $228,800 |
| Median Household Income | $21,393 | $107 |
| Monthly Housing Costs | $311 | $5 |
| Real Estate Taxes | $1,052 | $0 |
Property Value by Mortgage Status in Cleary
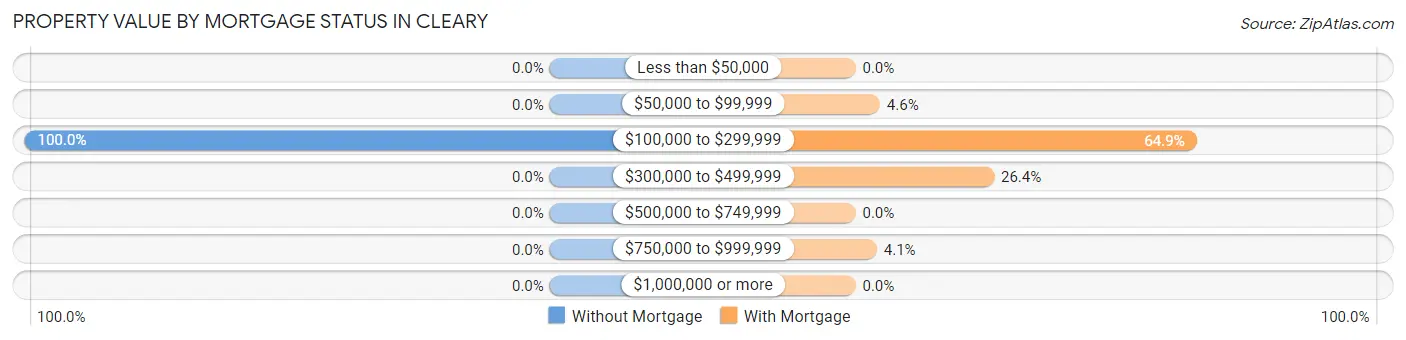
| Property Value | Without Mortgage | With Mortgage |
| Less than $50,000 | 0 (0.0%) | 0 (0.0%) |
| $50,000 to $99,999 | 0 (0.0%) | 16 (4.6%) |
| $100,000 to $299,999 | 474 (100.0%) | 224 (64.9%) |
| $300,000 to $499,999 | 0 (0.0%) | 91 (26.4%) |
| $500,000 to $749,999 | 0 (0.0%) | 0 (0.0%) |
| $750,000 to $999,999 | 0 (0.0%) | 14 (4.1%) |
| $1,000,000 or more | 0 (0.0%) | 0 (0.0%) |
| Total | 474 (100.0%) | 345 (100.0%) |
Household Income by Mortgage Status in Cleary
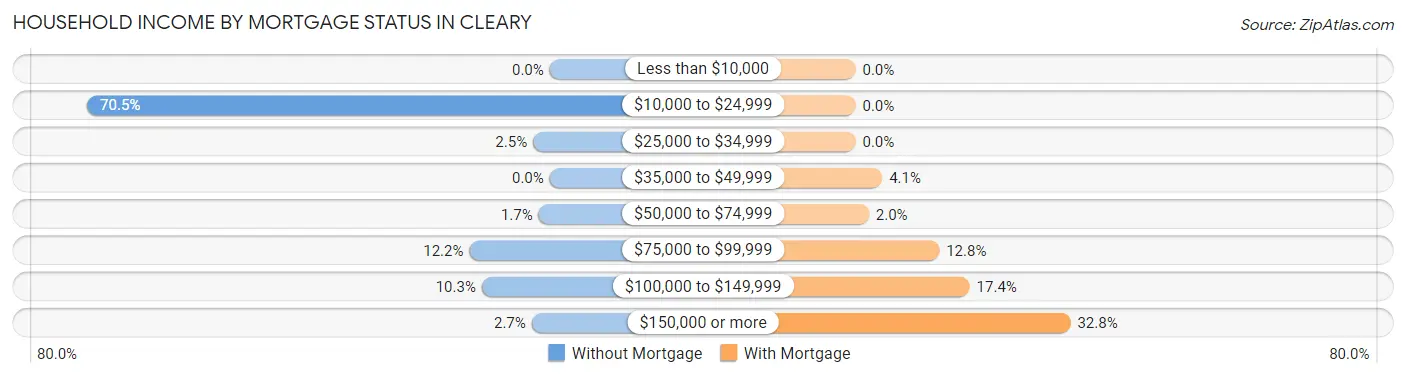
| Household Income | Without Mortgage | With Mortgage |
| Less than $10,000 | 0 (0.0%) | 0 (0.0%) |
| $10,000 to $24,999 | 334 (70.5%) | 0 (0.0%) |
| $25,000 to $34,999 | 12 (2.5%) | 0 (0.0%) |
| $35,000 to $49,999 | 0 (0.0%) | 14 (4.1%) |
| $50,000 to $74,999 | 8 (1.7%) | 7 (2.0%) |
| $75,000 to $99,999 | 58 (12.2%) | 44 (12.8%) |
| $100,000 to $149,999 | 49 (10.3%) | 60 (17.4%) |
| $150,000 or more | 13 (2.7%) | 113 (32.8%) |
| Total | 474 (100.0%) | 345 (100.0%) |
Property Value to Household Income Ratio in Cleary
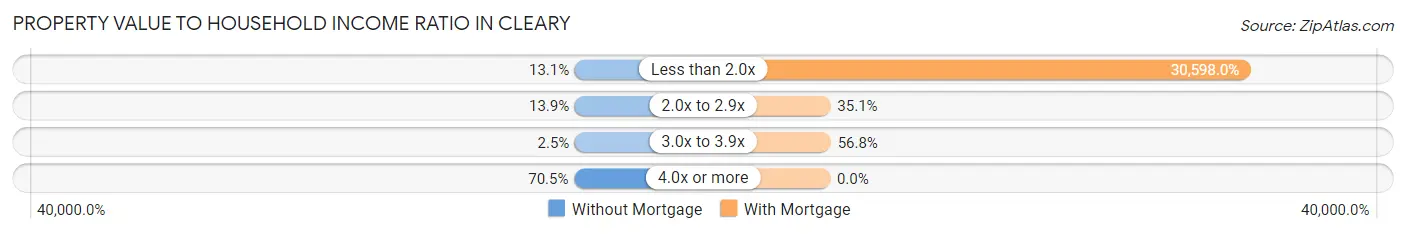
| Value-to-Income Ratio | Without Mortgage | With Mortgage |
| Less than 2.0x | 62 (13.1%) | 105,563 (30,598.0%) |
| 2.0x to 2.9x | 66 (13.9%) | 121 (35.1%) |
| 3.0x to 3.9x | 12 (2.5%) | 196 (56.8%) |
| 4.0x or more | 334 (70.5%) | 0 (0.0%) |
| Total | 474 (100.0%) | 345 (100.0%) |
Real Estate Taxes by Mortgage Status in Cleary
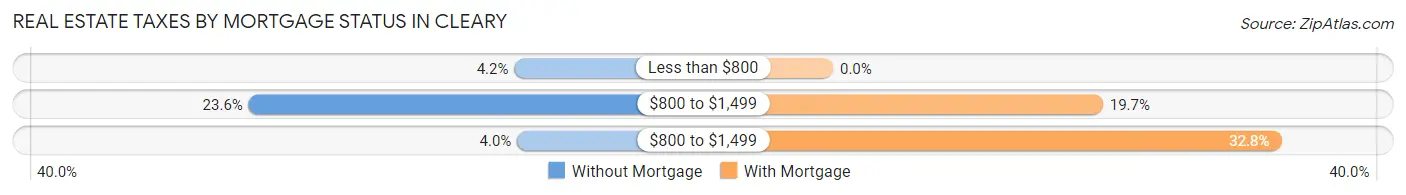
| Property Taxes | Without Mortgage | With Mortgage |
| Less than $800 | 20 (4.2%) | 0 (0.0%) |
| $800 to $1,499 | 112 (23.6%) | 68 (19.7%) |
| $800 to $1,499 | 19 (4.0%) | 113 (32.8%) |
| Total | 474 (100.0%) | 345 (100.0%) |
Health & Disability in Cleary
Health Insurance Coverage by Age in Cleary
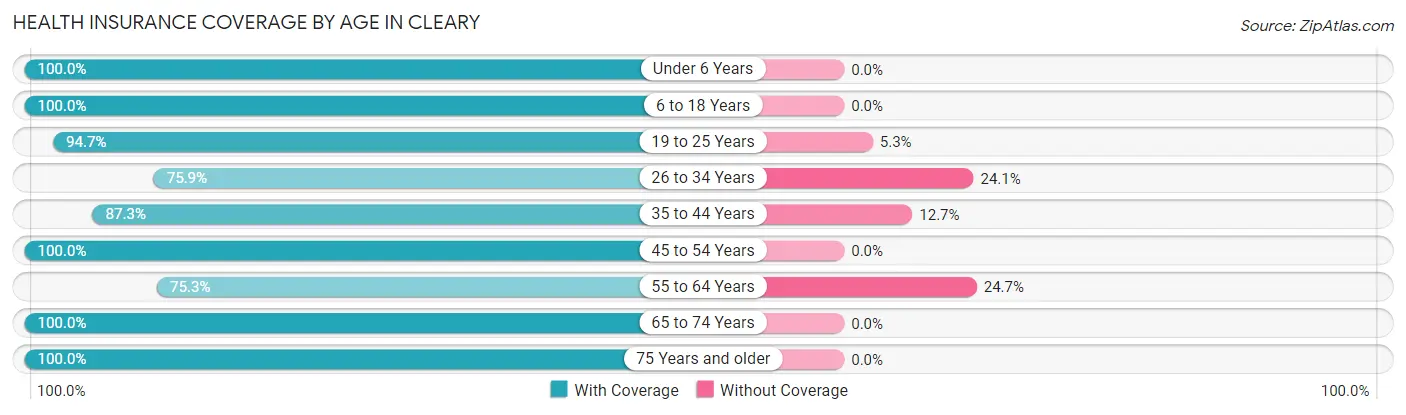
| Age Bracket | With Coverage | Without Coverage |
| Under 6 Years | 30 (100.0%) | 0 (0.0%) |
| 6 to 18 Years | 403 (100.0%) | 0 (0.0%) |
| 19 to 25 Years | 213 (94.7%) | 12 (5.3%) |
| 26 to 34 Years | 126 (75.9%) | 40 (24.1%) |
| 35 to 44 Years | 234 (87.3%) | 34 (12.7%) |
| 45 to 54 Years | 40 (100.0%) | 0 (0.0%) |
| 55 to 64 Years | 195 (75.3%) | 64 (24.7%) |
| 65 to 74 Years | 270 (100.0%) | 0 (0.0%) |
| 75 Years and older | 349 (100.0%) | 0 (0.0%) |
| Total | 1,860 (92.5%) | 150 (7.5%) |
Health Insurance Coverage by Citizenship Status in Cleary
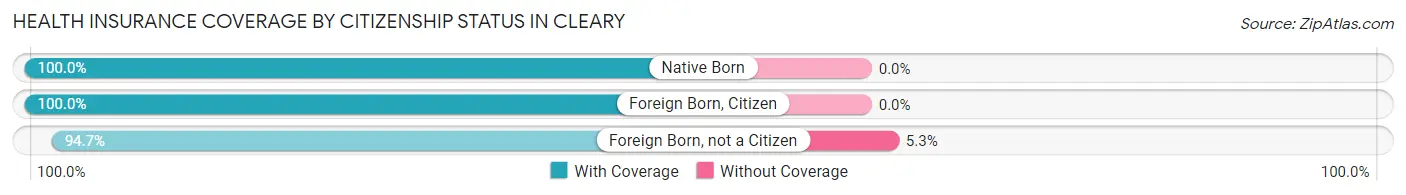
| Citizenship Status | With Coverage | Without Coverage |
| Native Born | 30 (100.0%) | 0 (0.0%) |
| Foreign Born, Citizen | 403 (100.0%) | 0 (0.0%) |
| Foreign Born, not a Citizen | 213 (94.7%) | 12 (5.3%) |
Health Insurance Coverage by Household Income in Cleary
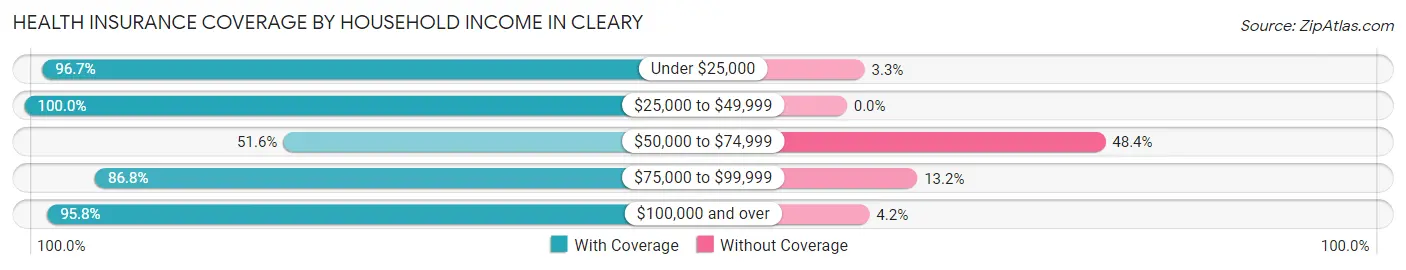
| Household Income | With Coverage | Without Coverage |
| Under $25,000 | 551 (96.7%) | 19 (3.3%) |
| $25,000 to $49,999 | 41 (100.0%) | 0 (0.0%) |
| $50,000 to $74,999 | 33 (51.6%) | 31 (48.4%) |
| $75,000 to $99,999 | 421 (86.8%) | 64 (13.2%) |
| $100,000 and over | 814 (95.8%) | 36 (4.2%) |
Public vs Private Health Insurance Coverage by Age in Cleary
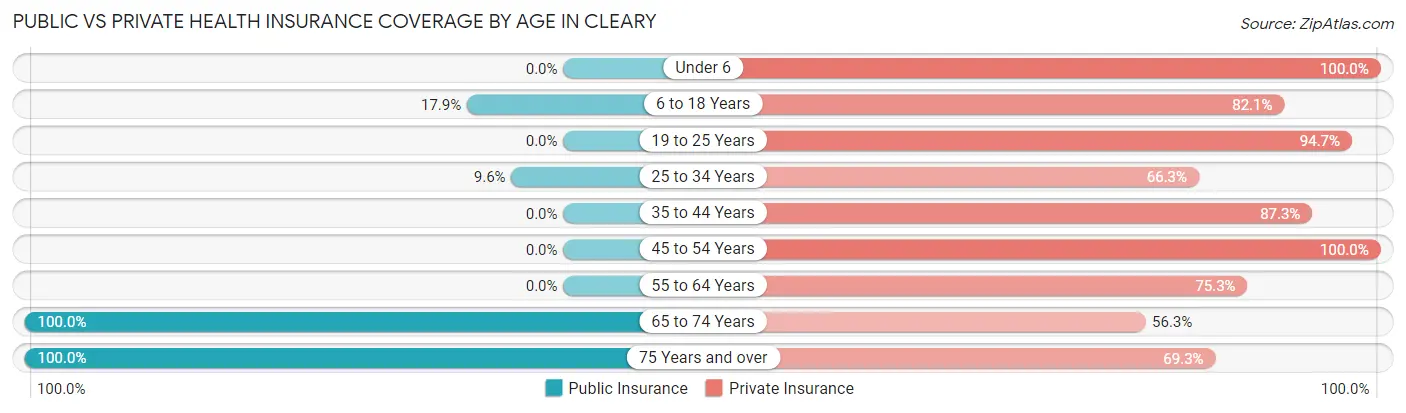
| Age Bracket | Public Insurance | Private Insurance |
| Under 6 | 0 (0.0%) | 30 (100.0%) |
| 6 to 18 Years | 72 (17.9%) | 331 (82.1%) |
| 19 to 25 Years | 0 (0.0%) | 213 (94.7%) |
| 25 to 34 Years | 16 (9.6%) | 110 (66.3%) |
| 35 to 44 Years | 0 (0.0%) | 234 (87.3%) |
| 45 to 54 Years | 0 (0.0%) | 40 (100.0%) |
| 55 to 64 Years | 0 (0.0%) | 195 (75.3%) |
| 65 to 74 Years | 270 (100.0%) | 152 (56.3%) |
| 75 Years and over | 349 (100.0%) | 242 (69.3%) |
| Total | 707 (35.2%) | 1,547 (77.0%) |
Disability Status by Sex by Age in Cleary
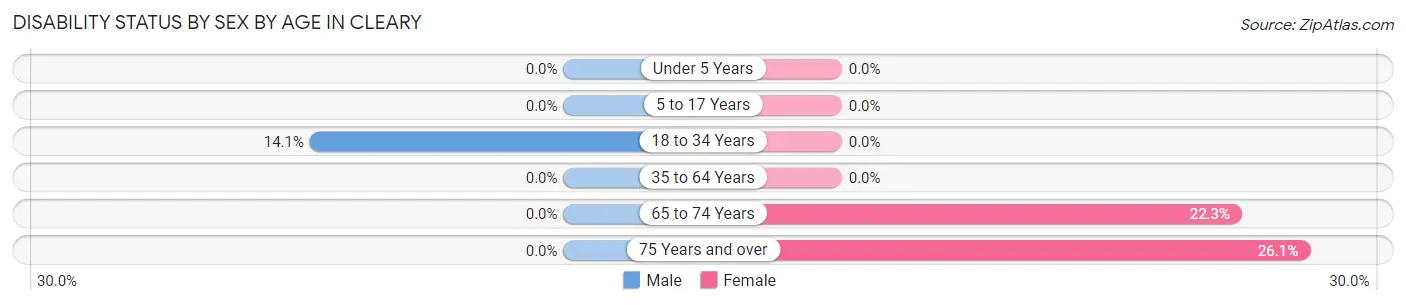
| Age Bracket | Male | Female |
| Under 5 Years | 0 (0.0%) | 0 (0.0%) |
| 5 to 17 Years | 0 (0.0%) | 0 (0.0%) |
| 18 to 34 Years | 37 (14.1%) | 0 (0.0%) |
| 35 to 64 Years | 0 (0.0%) | 0 (0.0%) |
| 65 to 74 Years | 0 (0.0%) | 55 (22.3%) |
| 75 Years and over | 0 (0.0%) | 91 (26.1%) |
Disability Class by Sex by Age in Cleary
Disability Class: Hearing Difficulty
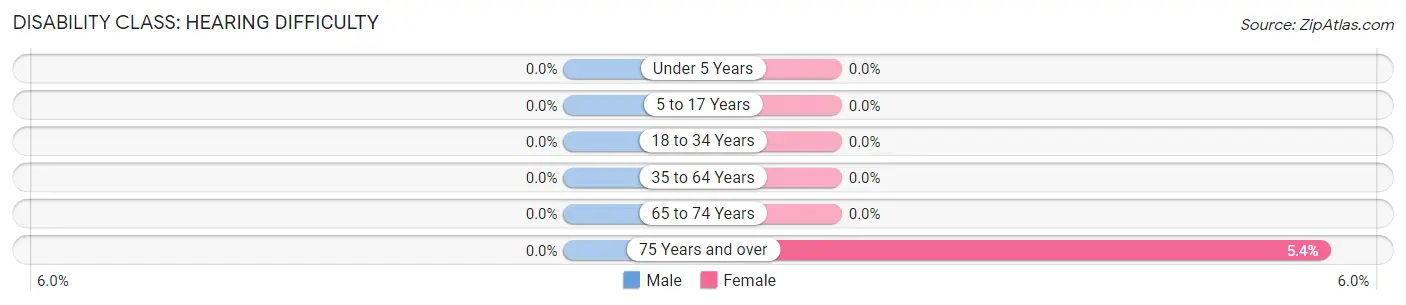
| Age Bracket | Male | Female |
| Under 5 Years | 0 (0.0%) | 0 (0.0%) |
| 5 to 17 Years | 0 (0.0%) | 0 (0.0%) |
| 18 to 34 Years | 0 (0.0%) | 0 (0.0%) |
| 35 to 64 Years | 0 (0.0%) | 0 (0.0%) |
| 65 to 74 Years | 0 (0.0%) | 0 (0.0%) |
| 75 Years and over | 0 (0.0%) | 19 (5.4%) |
Disability Class: Vision Difficulty
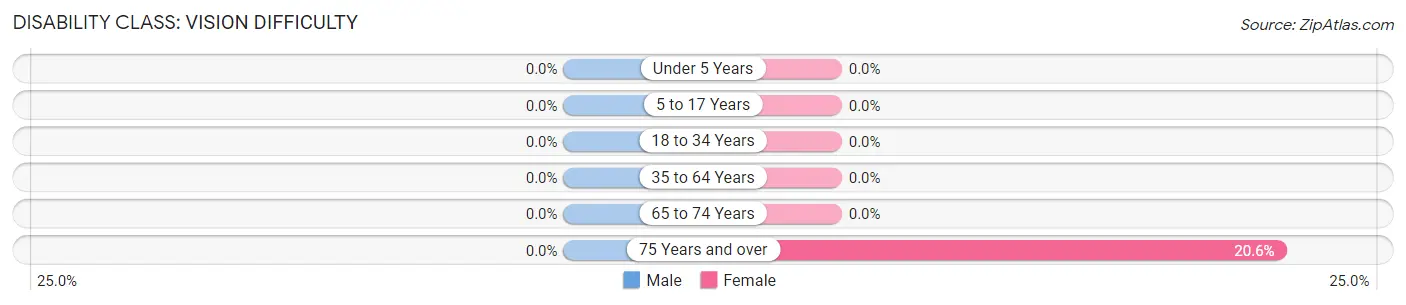
| Age Bracket | Male | Female |
| Under 5 Years | 0 (0.0%) | 0 (0.0%) |
| 5 to 17 Years | 0 (0.0%) | 0 (0.0%) |
| 18 to 34 Years | 0 (0.0%) | 0 (0.0%) |
| 35 to 64 Years | 0 (0.0%) | 0 (0.0%) |
| 65 to 74 Years | 0 (0.0%) | 0 (0.0%) |
| 75 Years and over | 0 (0.0%) | 72 (20.6%) |
Disability Class: Cognitive Difficulty
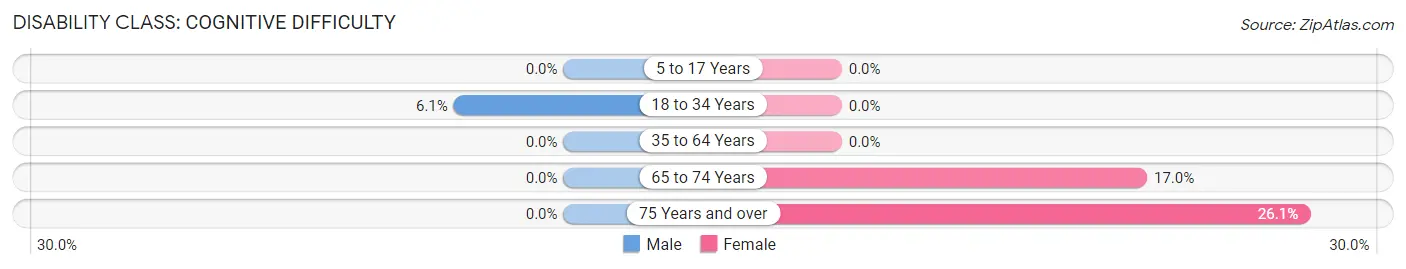
| Age Bracket | Male | Female |
| 5 to 17 Years | 0 (0.0%) | 0 (0.0%) |
| 18 to 34 Years | 16 (6.1%) | 0 (0.0%) |
| 35 to 64 Years | 0 (0.0%) | 0 (0.0%) |
| 65 to 74 Years | 0 (0.0%) | 42 (17.0%) |
| 75 Years and over | 0 (0.0%) | 91 (26.1%) |
Disability Class: Ambulatory Difficulty
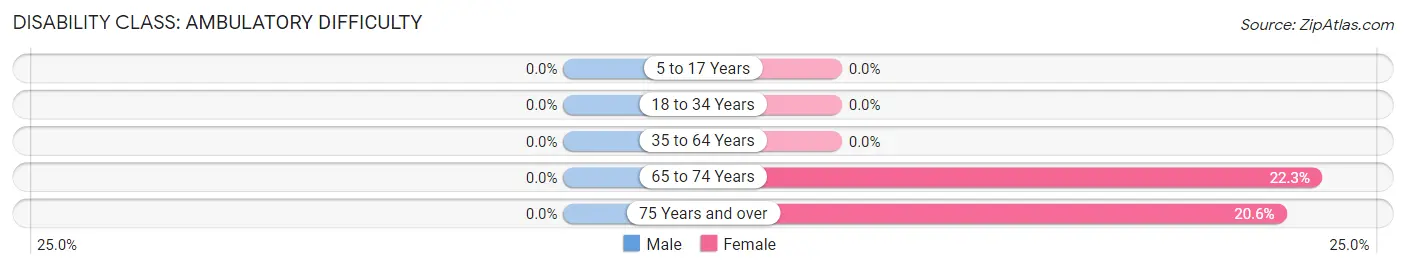
| Age Bracket | Male | Female |
| 5 to 17 Years | 0 (0.0%) | 0 (0.0%) |
| 18 to 34 Years | 0 (0.0%) | 0 (0.0%) |
| 35 to 64 Years | 0 (0.0%) | 0 (0.0%) |
| 65 to 74 Years | 0 (0.0%) | 55 (22.3%) |
| 75 Years and over | 0 (0.0%) | 72 (20.6%) |
Disability Class: Self-Care Difficulty
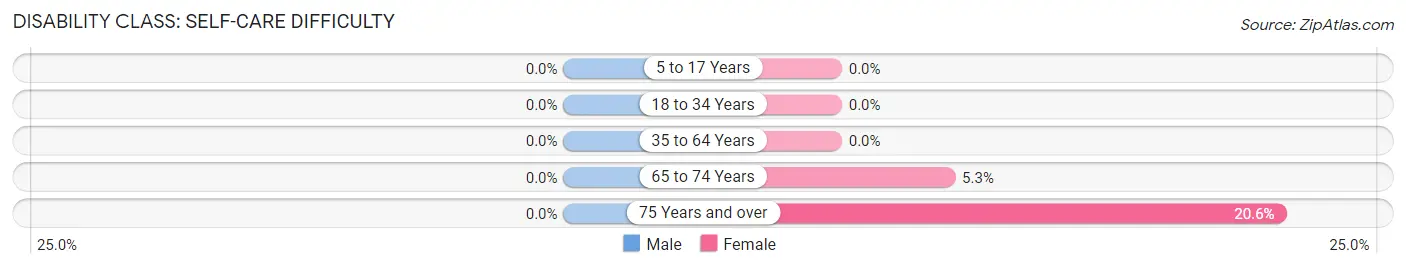
| Age Bracket | Male | Female |
| 5 to 17 Years | 0 (0.0%) | 0 (0.0%) |
| 18 to 34 Years | 0 (0.0%) | 0 (0.0%) |
| 35 to 64 Years | 0 (0.0%) | 0 (0.0%) |
| 65 to 74 Years | 0 (0.0%) | 13 (5.3%) |
| 75 Years and over | 0 (0.0%) | 72 (20.6%) |
Technology Access in Cleary
Computing Device Access in Cleary
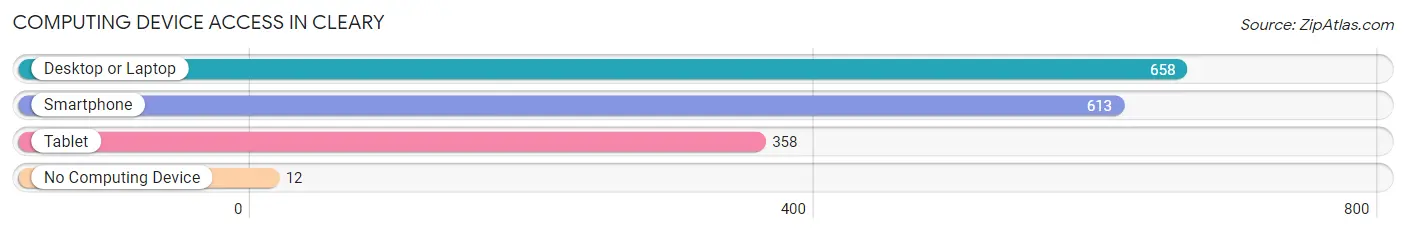
| Device Type | # Households | % Households |
| Desktop or Laptop | 658 | 73.5% |
| Smartphone | 613 | 68.5% |
| Tablet | 358 | 40.0% |
| No Computing Device | 12 | 1.3% |
| Total | 895 | 100.0% |
Internet Access in Cleary
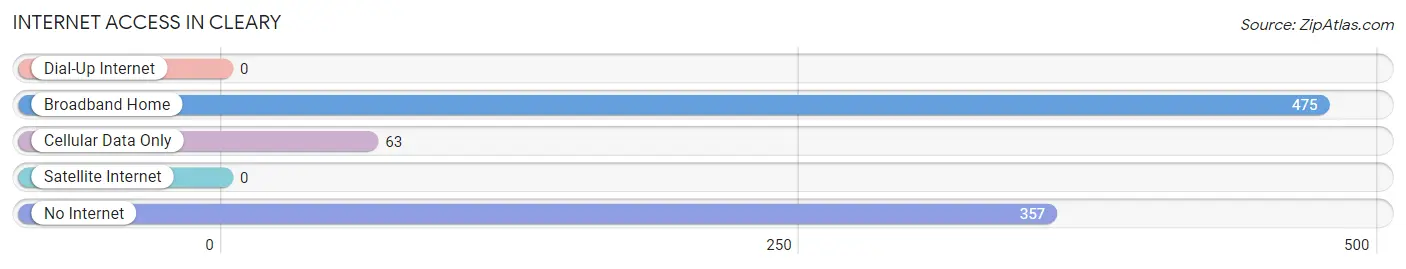
| Internet Type | # Households | % Households |
| Dial-Up Internet | 0 | 0.0% |
| Broadband Home | 475 | 53.1% |
| Cellular Data Only | 63 | 7.0% |
| Satellite Internet | 0 | 0.0% |
| No Internet | 357 | 39.9% |
| Total | 895 | 100.0% |
Cleary Summary
MS History
Mississippi is a state located in the southeastern region of the United States. It is bordered by Tennessee to the north, Alabama to the east, the Gulf of Mexico to the south, and Louisiana and Arkansas to the west. Mississippi was admitted to the Union as the 20th state on December 10, 1817.
The history of Mississippi dates back to the Paleo-Indian period, which began around 12,000 years ago. The first inhabitants of the area were Native American tribes, including the Choctaw, Chickasaw, and Natchez. The first Europeans to explore the area were the Spanish, who arrived in the early 16th century. The French also explored the area, establishing settlements in the late 17th century.
In 1798, the Mississippi Territory was created, which included the present-day states of Mississippi and Alabama. The territory was divided in 1817, with Mississippi becoming the 20th state in the Union.
During the 19th century, Mississippi was a slave state and was the site of several battles during the Civil War. After the war, the state was subject to Reconstruction, which lasted until 1876. During this period, African Americans were granted the right to vote and hold office.
In the early 20th century, Mississippi was a major producer of cotton and other agricultural products. The state also experienced a period of industrialization, with the development of the timber, oil, and gas industries.
In the 1950s and 1960s, Mississippi was the site of the civil rights movement, which sought to end racial segregation and discrimination. The movement was successful, and in 1964, the Civil Rights Act was passed, which outlawed discrimination based on race, color, religion, sex, or national origin.
Geography
Mississippi is located in the southeastern region of the United States. It is bordered by Tennessee to the north, Alabama to the east, the Gulf of Mexico to the south, and Louisiana and Arkansas to the west.
The state has a total area of 48,430 square miles, making it the 32nd largest state in the country. Mississippi is divided into three distinct geographic regions: the Gulf Coastal Plain, the Mississippi Alluvial Plain, and the Mississippi Hills.
The Gulf Coastal Plain is located along the Gulf of Mexico and is characterized by flat, low-lying land. The Mississippi Alluvial Plain is located in the northern part of the state and is characterized by flat, fertile land. The Mississippi Hills are located in the western part of the state and are characterized by rolling hills and valleys.
Economy
Mississippi has a diverse economy, with a mix of agriculture, manufacturing, and services. The state’s main agricultural products include cotton, soybeans, corn, and poultry.
Manufacturing is a major part of the state’s economy, with products such as furniture, chemicals, and processed foods. The state is also home to several major oil and gas companies.
The service sector is also an important part of the state’s economy, with tourism being a major contributor. Mississippi is home to several popular tourist destinations, including the Gulf Coast, the Mississippi Delta, and the Natchez Trace Parkway.
Demographics
As of 2019, Mississippi had an estimated population of 2,976,149. The state has a population density of 60.3 people per square mile, making it the 37th most densely populated state in the country.
The racial makeup of Mississippi is 63.7% White, 37.3% African American, 0.3% Native American, 0.5% Asian, 0.1% Pacific Islander, 0.2% from other races, and 1.9% from two or more races. The state also has a large Hispanic population, with 4.3% of the population being of Hispanic or Latino origin.
The median household income in Mississippi is $41,754, and the median home value is $118,400. The state has a poverty rate of 19.7%, which is higher than the national average.
Common Questions
What is Per Capita Income in Cleary?
Per Capita income in Cleary is $33,528.
What is the Median Family Income in Cleary?
Median Family Income in Cleary is $96,607.
What is Income or Wage Gap in Cleary?
Income or Wage Gap in Cleary is 43.5%.
Women in Cleary earn 56.5 cents for every dollar earned by a man.
What is Inequality or Gini Index in Cleary?
Inequality or Gini Index in Cleary is 0.46.
What is the Total Population of Cleary?
Total Population of Cleary is 2,010.
What is the Total Male Population of Cleary?
Total Male Population of Cleary is 947.
What is the Total Female Population of Cleary?
Total Female Population of Cleary is 1,063.
What is the Ratio of Males per 100 Females in Cleary?
There are 89.09 Males per 100 Females in Cleary.
What is the Ratio of Females per 100 Males in Cleary?
There are 112.25 Females per 100 Males in Cleary.
What is the Median Population Age in Cleary?
Median Population Age in Cleary is 42.4 Years.
What is the Average Family Size in Cleary
Average Family Size in Cleary is 3.4 People.
What is the Average Household Size in Cleary
Average Household Size in Cleary is 2.2 People.
How Large is the Labor Force in Cleary?
There are 889 People in the Labor Forcein in Cleary.
What is the Percentage of People in the Labor Force in Cleary?
51.5% of People are in the Labor Force in Cleary.
What is the Unemployment Rate in Cleary?
Unemployment Rate in Cleary is 15.5%.