Zip Codes with the Highest Percentage of Population Employed in Security & Protection in Hattiesburg, MS
RELATED REPORTS & OPTIONS
Security & Protection
Hattiesburg
Compare Zip Codes
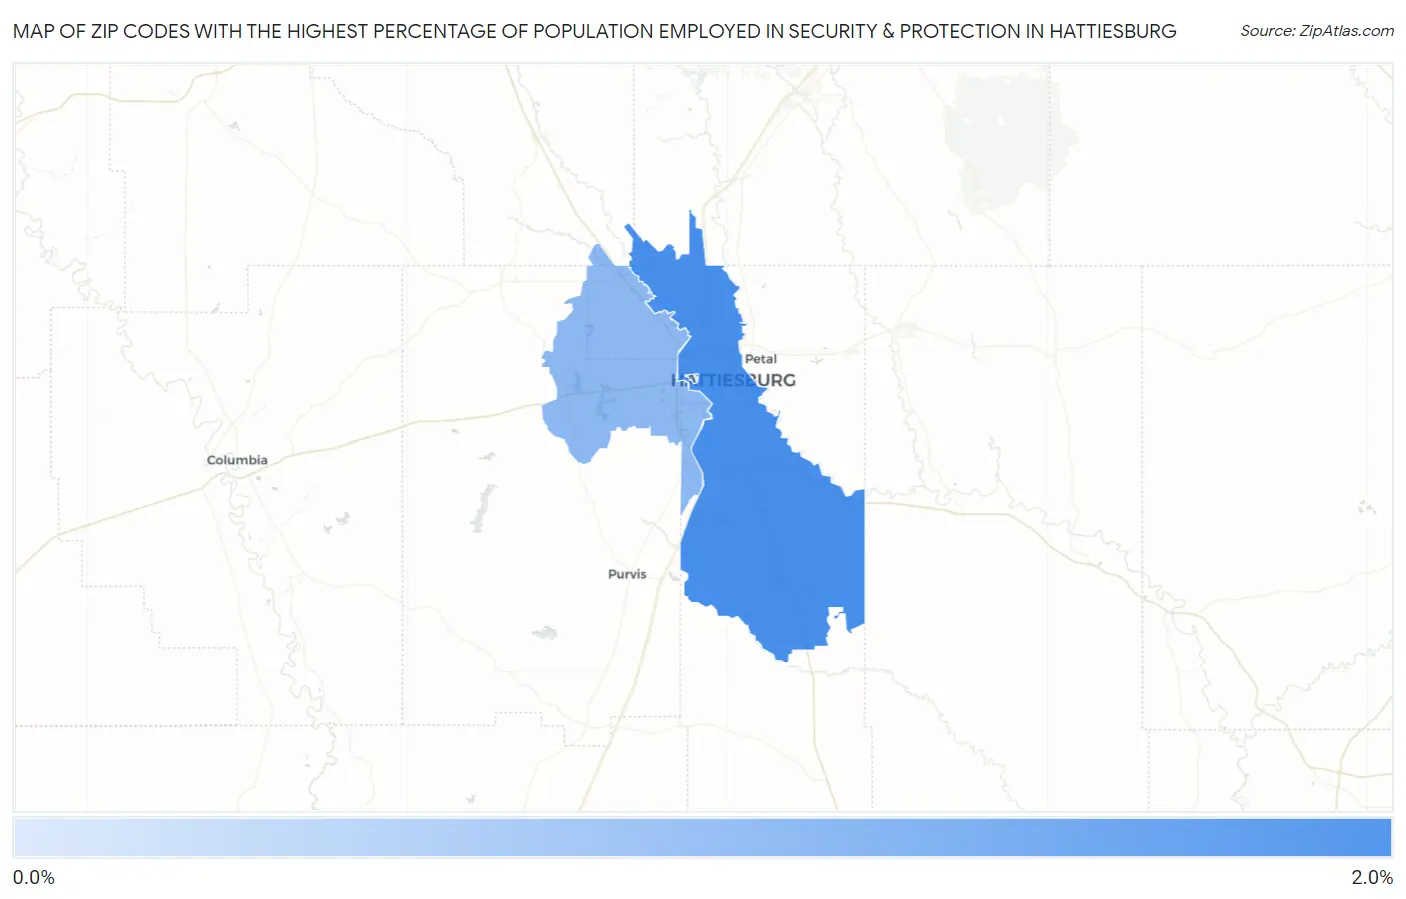
Map of Zip Codes with the Highest Percentage of Population Employed in Security & Protection in Hattiesburg
0.48%
1.8%
Zip Codes with the Highest Percentage of Population Employed in Security & Protection in Hattiesburg, MS
| Zip Code | % Employed | vs State | vs National | |
| 1. | 39401 | 1.8% | 2.4%(-0.579)#196 | 2.1%(-0.350)#13,967 |
| 2. | 39402 | 1.2% | 2.4%(-1.18)#239 | 2.1%(-0.955)#18,557 |
| 3. | 39406 | 0.48% | 2.4%(-1.90)#284 | 2.1%(-1.67)#23,356 |
1
Common Questions
What are the Top Zip Codes with the Highest Percentage of Population Employed in Security & Protection in Hattiesburg, MS?
Top Zip Codes with the Highest Percentage of Population Employed in Security & Protection in Hattiesburg, MS are:
What zip code has the Highest Percentage of Population Employed in Security & Protection in Hattiesburg, MS?
39401 has the Highest Percentage of Population Employed in Security & Protection in Hattiesburg, MS with 1.8%.
What is the Percentage of Population Employed in Security & Protection in Hattiesburg, MS?
Percentage of Population Employed in Security & Protection in Hattiesburg is 1.9%.
What is the Percentage of Population Employed in Security & Protection in Mississippi?
Percentage of Population Employed in Security & Protection in Mississippi is 2.4%.
What is the Percentage of Population Employed in Security & Protection in the United States?
Percentage of Population Employed in Security & Protection in the United States is 2.1%.