Learned, MS Map & Demographics
Learned Map
Learned Overview
$36,725
PER CAPITA INCOME
$76,250
AVG FAMILY INCOME
$73,250
AVG HOUSEHOLD INCOME
0.37
INEQUALITY / GINI INDEX
51
TOTAL POPULATION
30
MALE POPULATION
21
FEMALE POPULATION
142.86
MALES / 100 FEMALES
70.00
FEMALES / 100 MALES
68.5
MEDIAN AGE
2.4
AVG FAMILY SIZE
2.0
AVG HOUSEHOLD SIZE
11
LABOR FORCE [ PEOPLE ]
23.9%
PERCENT IN LABOR FORCE
18.2%
UNEMPLOYMENT RATE
Learned Area Codes
Income in Learned
Income Overview in Learned
Per Capita Income in Learned is $36,725, while median incomes of families and households are $76,250 and $73,250 respectively.
| Characteristic | Number | Measure |
| Per Capita Income | 51 | $36,725 |
| Median Family Income | 18 | $76,250 |
| Mean Family Income | 18 | $97,683 |
| Median Household Income | 25 | $73,250 |
| Mean Household Income | 25 | $74,560 |
| Income Deficit | 18 | $0 |
| Wage / Income Gap (%) | 51 | 0.00% |
| Wage / Income Gap ($) | 51 | 100.00¢ per $1 |
| Gini / Inequality Index | 51 | 0.37 |
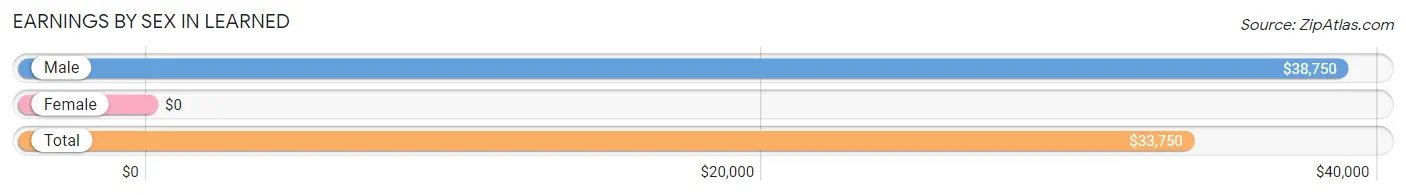
Earnings by Sex in Learned
| Sex | Number | Average Earnings |
| Male | 10 (71.4%) | $38,750 |
| Female | 4 (28.6%) | $0 |
| Total | 14 (100.0%) | $33,750 |
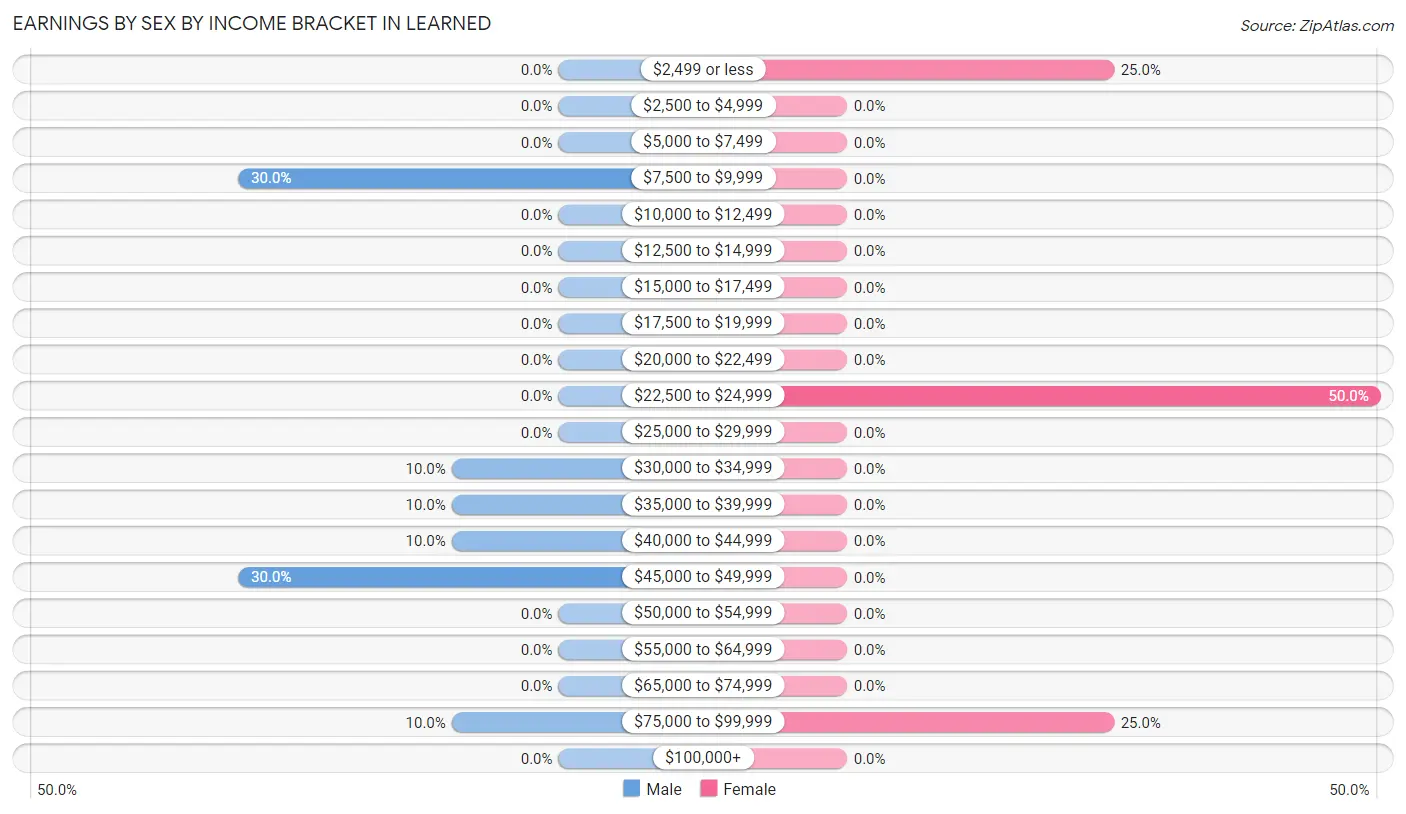
Earnings by Sex by Income Bracket in Learned
The most common earnings brackets in Learned are $7,500 to $9,999 for men (3 | 30.0%) and $22,500 to $24,999 for women (2 | 50.0%).
| Income | Male | Female |
| $2,499 or less | 0 (0.0%) | 1 (25.0%) |
| $2,500 to $4,999 | 0 (0.0%) | 0 (0.0%) |
| $5,000 to $7,499 | 0 (0.0%) | 0 (0.0%) |
| $7,500 to $9,999 | 3 (30.0%) | 0 (0.0%) |
| $10,000 to $12,499 | 0 (0.0%) | 0 (0.0%) |
| $12,500 to $14,999 | 0 (0.0%) | 0 (0.0%) |
| $15,000 to $17,499 | 0 (0.0%) | 0 (0.0%) |
| $17,500 to $19,999 | 0 (0.0%) | 0 (0.0%) |
| $20,000 to $22,499 | 0 (0.0%) | 0 (0.0%) |
| $22,500 to $24,999 | 0 (0.0%) | 2 (50.0%) |
| $25,000 to $29,999 | 0 (0.0%) | 0 (0.0%) |
| $30,000 to $34,999 | 1 (10.0%) | 0 (0.0%) |
| $35,000 to $39,999 | 1 (10.0%) | 0 (0.0%) |
| $40,000 to $44,999 | 1 (10.0%) | 0 (0.0%) |
| $45,000 to $49,999 | 3 (30.0%) | 0 (0.0%) |
| $50,000 to $54,999 | 0 (0.0%) | 0 (0.0%) |
| $55,000 to $64,999 | 0 (0.0%) | 0 (0.0%) |
| $65,000 to $74,999 | 0 (0.0%) | 0 (0.0%) |
| $75,000 to $99,999 | 1 (10.0%) | 1 (25.0%) |
| $100,000+ | 0 (0.0%) | 0 (0.0%) |
| Total | 10 (100.0%) | 4 (100.0%) |
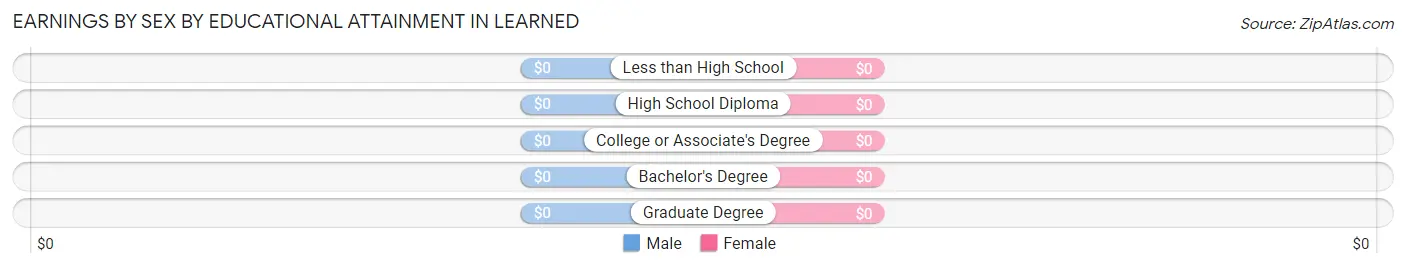
Earnings by Sex by Educational Attainment in Learned
| Educational Attainment | Male Income | Female Income |
| Less than High School | - | - |
| High School Diploma | - | - |
| College or Associate's Degree | - | - |
| Bachelor's Degree | - | - |
| Graduate Degree | - | - |
| Total | $38,750 | $0 |
Family Income in Learned
Family Income Brackets in Learned
According to the Learned family income data, there are 8 families falling into the $50,000 to $74,999 income range, which is the most common income bracket and makes up 44.4% of all families.
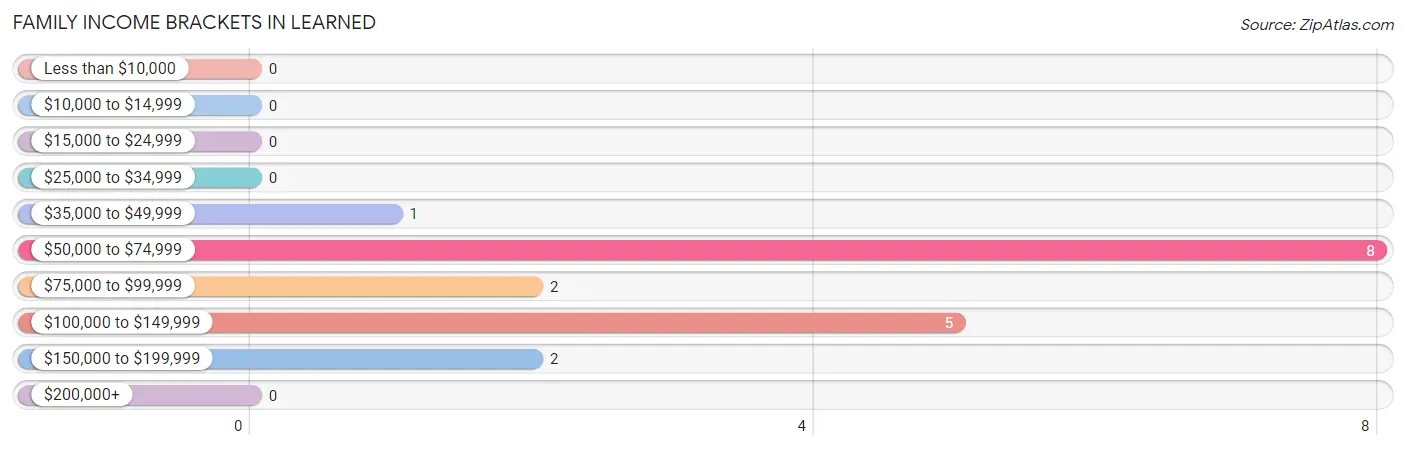
| Income Bracket | # Families | % Families |
| Less than $10,000 | 0 | 0.0% |
| $10,000 to $14,999 | 0 | 0.0% |
| $15,000 to $24,999 | 0 | 0.0% |
| $25,000 to $34,999 | 0 | 0.0% |
| $35,000 to $49,999 | 1 | 5.6% |
| $50,000 to $74,999 | 8 | 44.4% |
| $75,000 to $99,999 | 2 | 11.1% |
| $100,000 to $149,999 | 5 | 27.8% |
| $150,000 to $199,999 | 2 | 11.1% |
| $200,000+ | 0 | 0.0% |
Family Income by Famaliy Size in Learned
3-person families (4 | 22.2%) account for the highest median family income in Learned with $76,250 per family, while 3-person families (4 | 22.2%) have the highest median income of $25,417 per family member.
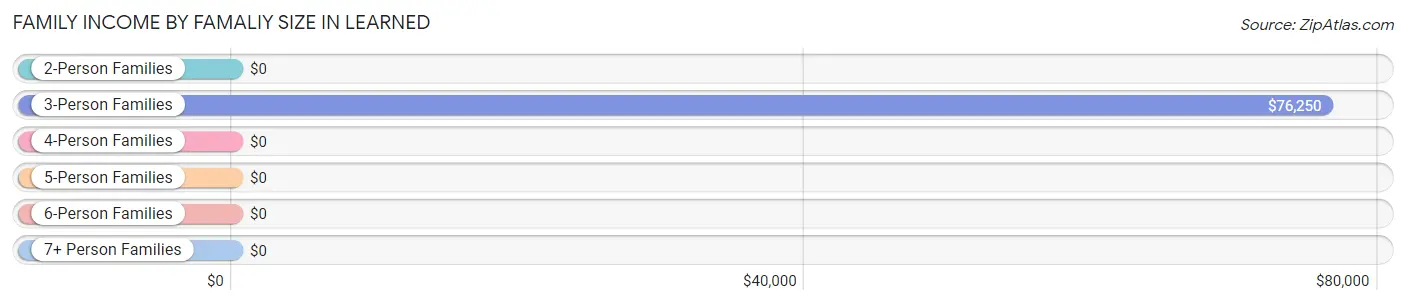
| Income Bracket | # Families | Median Income |
| 2-Person Families | 13 (72.2%) | $0 |
| 3-Person Families | 4 (22.2%) | $76,250 |
| 4-Person Families | 0 (0.0%) | $0 |
| 5-Person Families | 1 (5.6%) | $0 |
| 6-Person Families | 0 (0.0%) | $0 |
| 7+ Person Families | 0 (0.0%) | $0 |
| Total | 18 (100.0%) | $76,250 |
Family Income by Number of Earners in Learned
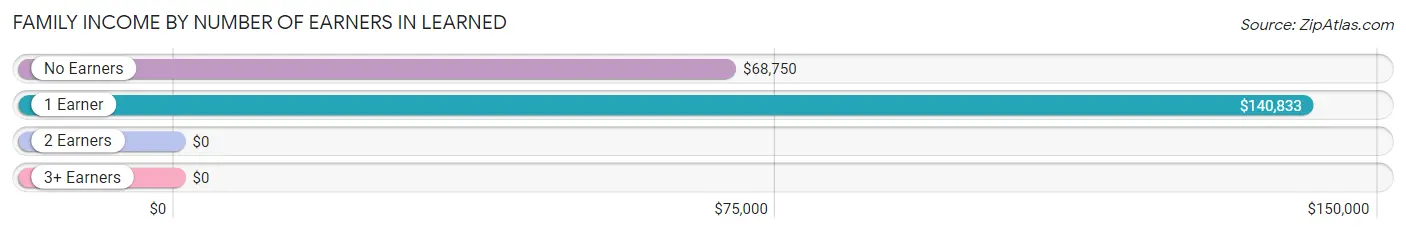
| Number of Earners | # Families | Median Income |
| No Earners | 7 (38.9%) | $68,750 |
| 1 Earner | 8 (44.4%) | $140,833 |
| 2 Earners | 3 (16.7%) | $0 |
| 3+ Earners | 0 (0.0%) | $0 |
| Total | 18 (100.0%) | $76,250 |
Household Income in Learned
Household Income Brackets in Learned
With 8 households falling in the category, the $50,000 to $74,999 income range is the most frequent in Learned, accounting for 32.0% of all households.
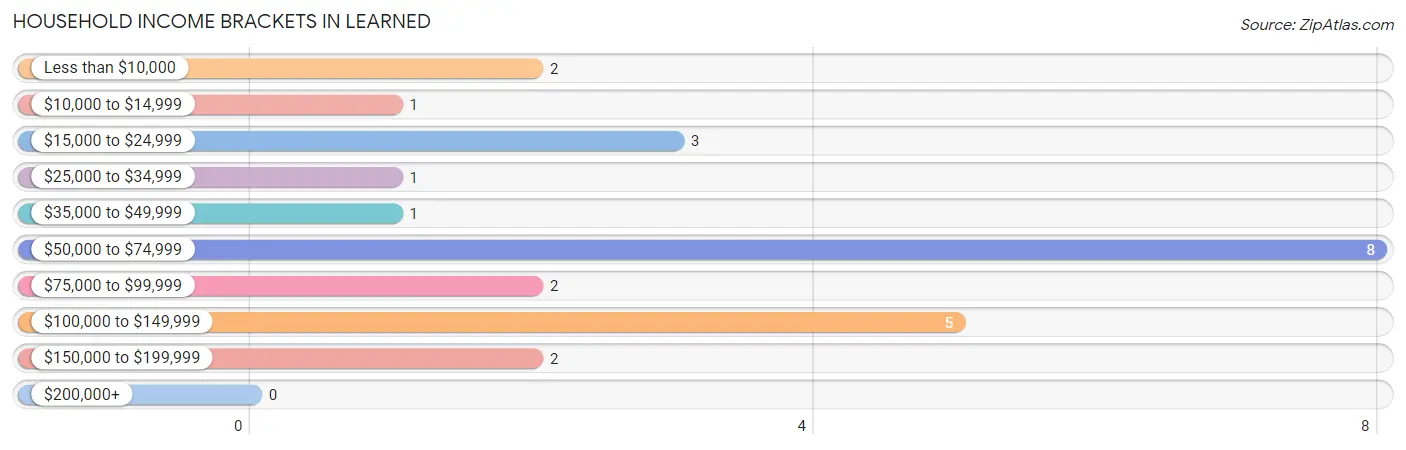
| Income Bracket | # Households | % Households |
| Less than $10,000 | 2 | 8.0% |
| $10,000 to $14,999 | 1 | 4.0% |
| $15,000 to $24,999 | 3 | 12.0% |
| $25,000 to $34,999 | 1 | 4.0% |
| $35,000 to $49,999 | 1 | 4.0% |
| $50,000 to $74,999 | 8 | 32.0% |
| $75,000 to $99,999 | 2 | 8.0% |
| $100,000 to $149,999 | 5 | 20.0% |
| $150,000 to $199,999 | 2 | 8.0% |
| $200,000+ | 0 | 0.0% |
Household Income by Householder Age in Learned
The median household income in Learned is $73,250, with the highest median household income of $72,917 found in the 65+ years age bracket for the primary householder. A total of 21 households (84.0%) fall into this category.
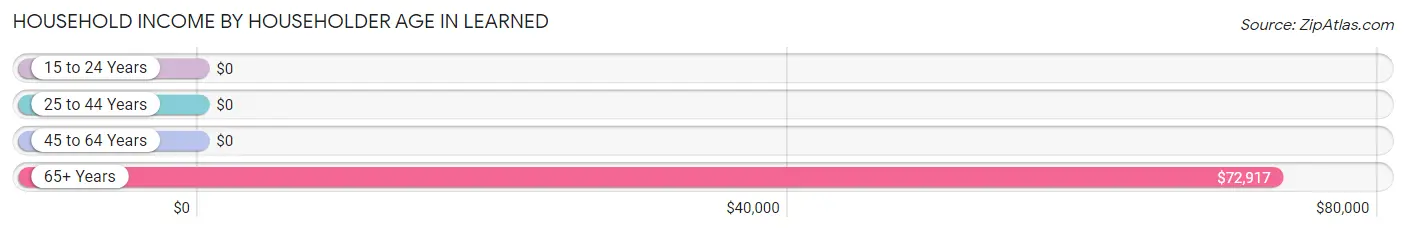
| Income Bracket | # Households | Median Income |
| 15 to 24 Years | 0 (0.0%) | $0 |
| 25 to 44 Years | 1 (4.0%) | $0 |
| 45 to 64 Years | 3 (12.0%) | $0 |
| 65+ Years | 21 (84.0%) | $72,917 |
| Total | 25 (100.0%) | $73,250 |
Poverty in Learned
Income Below Poverty by Sex and Age in Learned
With 6.7% poverty level for males and 4.8% for females among the residents of Learned, 65 to 74 year old males and 75 year old and over females are the most vulnerable to poverty, with 2 males (25.0%) and 1 females (11.1%) in their respective age groups living below the poverty level.
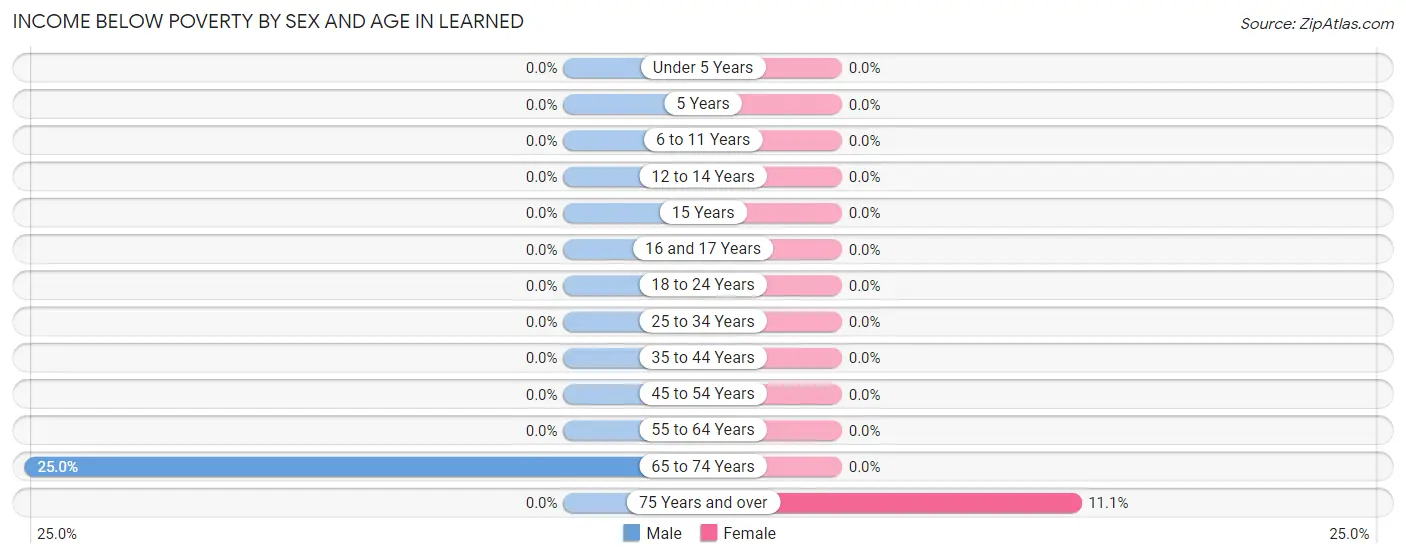
| Age Bracket | Male | Female |
| Under 5 Years | 0 (0.0%) | 0 (0.0%) |
| 5 Years | 0 (0.0%) | 0 (0.0%) |
| 6 to 11 Years | 0 (0.0%) | 0 (0.0%) |
| 12 to 14 Years | 0 (0.0%) | 0 (0.0%) |
| 15 Years | 0 (0.0%) | 0 (0.0%) |
| 16 and 17 Years | 0 (0.0%) | 0 (0.0%) |
| 18 to 24 Years | 0 (0.0%) | 0 (0.0%) |
| 25 to 34 Years | 0 (0.0%) | 0 (0.0%) |
| 35 to 44 Years | 0 (0.0%) | 0 (0.0%) |
| 45 to 54 Years | 0 (0.0%) | 0 (0.0%) |
| 55 to 64 Years | 0 (0.0%) | 0 (0.0%) |
| 65 to 74 Years | 2 (25.0%) | 0 (0.0%) |
| 75 Years and over | 0 (0.0%) | 1 (11.1%) |
| Total | 2 (6.7%) | 1 (4.8%) |
Income Above Poverty by Sex and Age in Learned
According to the poverty statistics in Learned, males aged 12 to 14 years and females aged 35 to 44 years are the age groups that are most secure financially, with 100.0% of males and 100.0% of females in these age groups living above the poverty line.
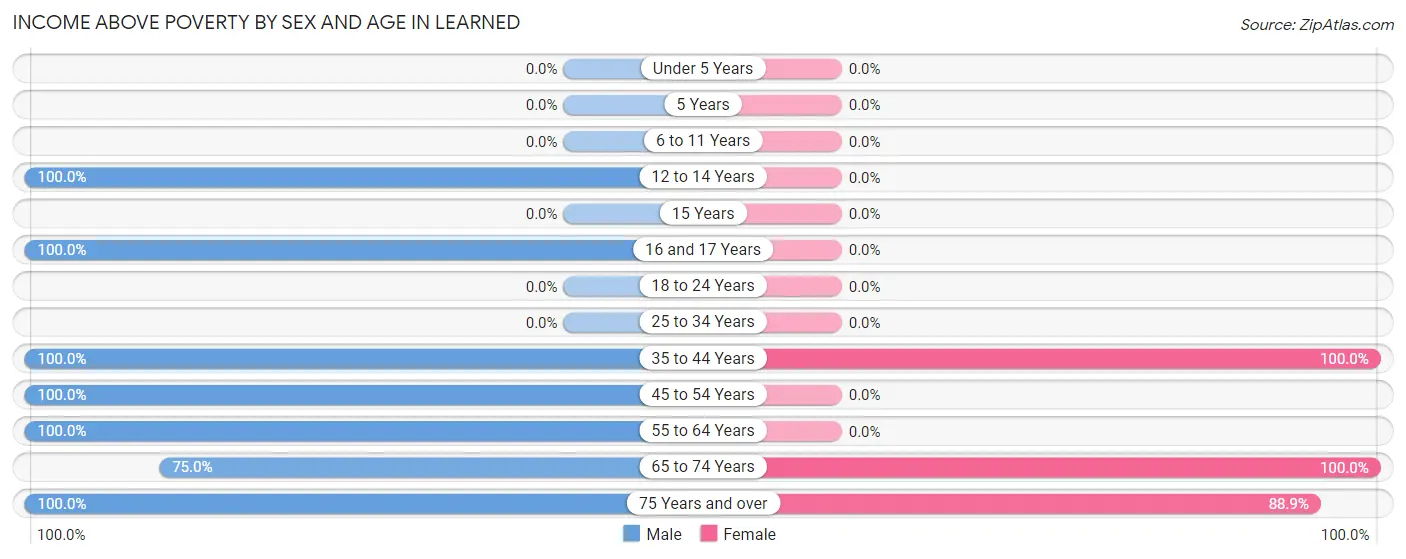
| Age Bracket | Male | Female |
| Under 5 Years | 0 (0.0%) | 0 (0.0%) |
| 5 Years | 0 (0.0%) | 0 (0.0%) |
| 6 to 11 Years | 0 (0.0%) | 0 (0.0%) |
| 12 to 14 Years | 5 (100.0%) | 0 (0.0%) |
| 15 Years | 0 (0.0%) | 0 (0.0%) |
| 16 and 17 Years | 2 (100.0%) | 0 (0.0%) |
| 18 to 24 Years | 0 (0.0%) | 0 (0.0%) |
| 25 to 34 Years | 0 (0.0%) | 0 (0.0%) |
| 35 to 44 Years | 3 (100.0%) | 3 (100.0%) |
| 45 to 54 Years | 6 (100.0%) | 0 (0.0%) |
| 55 to 64 Years | 1 (100.0%) | 0 (0.0%) |
| 65 to 74 Years | 6 (75.0%) | 9 (100.0%) |
| 75 Years and over | 5 (100.0%) | 8 (88.9%) |
| Total | 28 (93.3%) | 20 (95.2%) |
Income Below Poverty Among Married-Couple Families in Learned
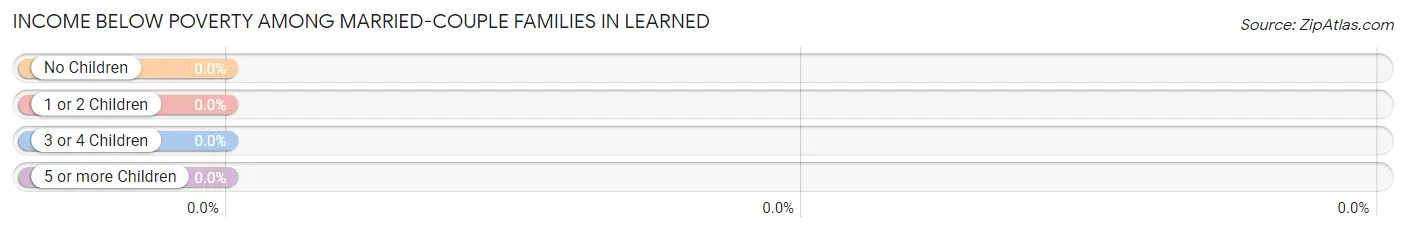
| Children | Above Poverty | Below Poverty |
| No Children | 11 (100.0%) | 0 (0.0%) |
| 1 or 2 Children | 2 (100.0%) | 0 (0.0%) |
| 3 or 4 Children | 1 (100.0%) | 0 (0.0%) |
| 5 or more Children | 0 (0.0%) | 0 (0.0%) |
| Total | 14 (100.0%) | 0 (0.0%) |
Income Below Poverty Among Single-Parent Households in Learned
| Children | Single Father | Single Mother |
| No Children | 0 (0.0%) | 0 (0.0%) |
| 1 or 2 Children | 0 (0.0%) | 0 (0.0%) |
| 3 or 4 Children | 0 (0.0%) | 0 (0.0%) |
| 5 or more Children | 0 (0.0%) | 0 (0.0%) |
| Total | 0 (0.0%) | 0 (0.0%) |
Income Below Poverty Among Married-Couple vs Single-Parent Households in Learned
| Children | Married-Couple Families | Single-Parent Households |
| No Children | 0 (0.0%) | 0 (0.0%) |
| 1 or 2 Children | 0 (0.0%) | 0 (0.0%) |
| 3 or 4 Children | 0 (0.0%) | 0 (0.0%) |
| 5 or more Children | 0 (0.0%) | 0 (0.0%) |
| Total | 0 (0.0%) | 0 (0.0%) |
Race in Learned
The most populous races in Learned are White / Caucasian (50 | 98.0%), and Black / African American (1 | 2.0%).
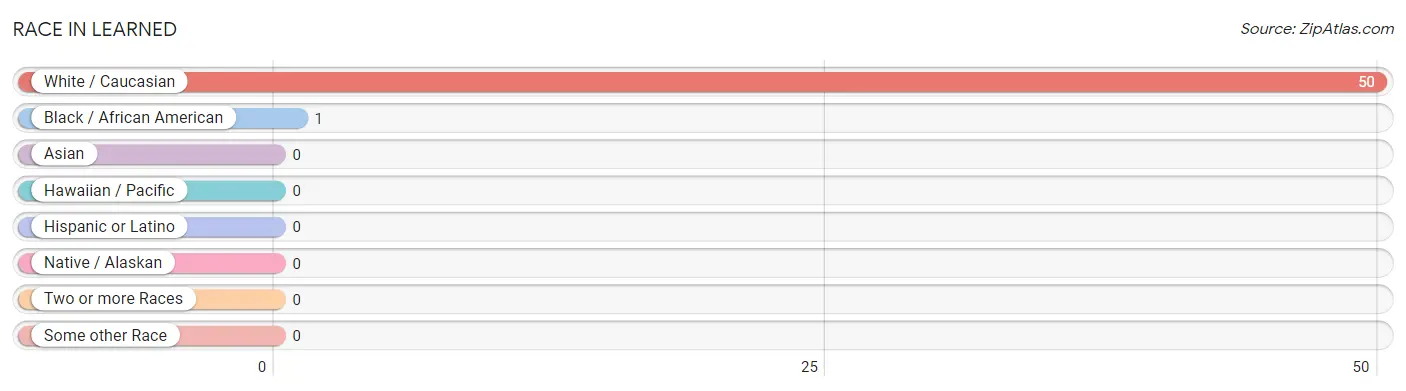
| Race | # Population | % Population |
| Asian | 0 | 0.0% |
| Black / African American | 1 | 2.0% |
| Hawaiian / Pacific | 0 | 0.0% |
| Hispanic or Latino | 0 | 0.0% |
| Native / Alaskan | 0 | 0.0% |
| White / Caucasian | 50 | 98.0% |
| Two or more Races | 0 | 0.0% |
| Some other Race | 0 | 0.0% |
| Total | 51 | 100.0% |
Ancestry in Learned
The most populous ancestries reported in Learned are American (12 | 23.5%), German (10 | 19.6%), English (8 | 15.7%), Irish (4 | 7.8%), and Italian (2 | 3.9%), together accounting for 70.6% of all Learned residents.
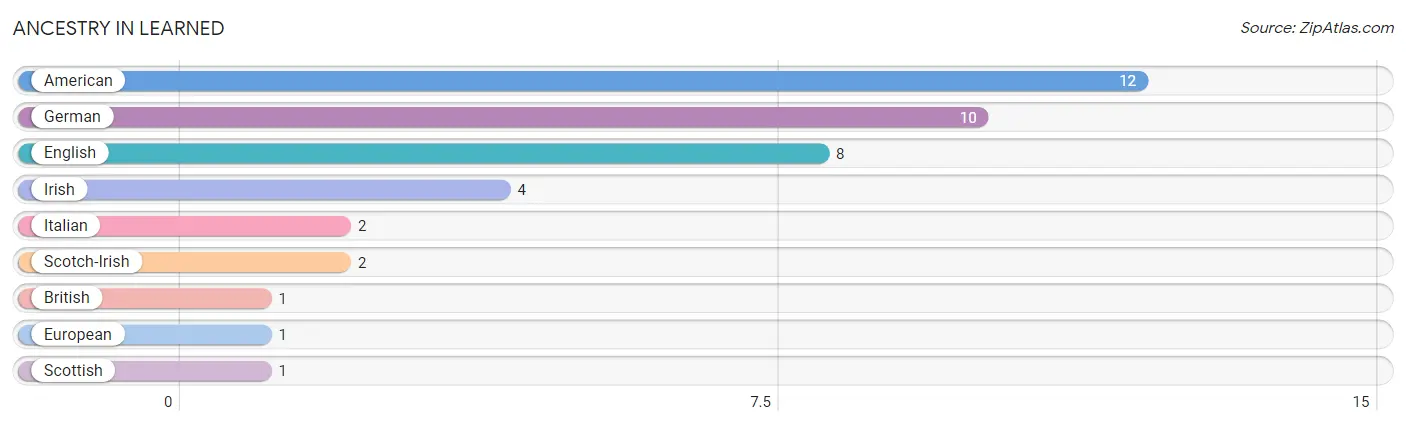
| Ancestry | # Population | % Population |
| American | 12 | 23.5% |
| British | 1 | 2.0% |
| English | 8 | 15.7% |
| European | 1 | 2.0% |
| German | 10 | 19.6% |
| Irish | 4 | 7.8% |
| Italian | 2 | 3.9% |
| Scotch-Irish | 2 | 3.9% |
| Scottish | 1 | 2.0% | View All 9 Rows |
Immigrants in Learned

| Immigration Origin | # Population | % Population | View All 0 Rows |
Sex and Age in Learned
Sex and Age in Learned
The most populous age groups in Learned are 70 to 74 Years (6 | 20.0%) for men and 65 to 69 Years (7 | 33.3%) for women.
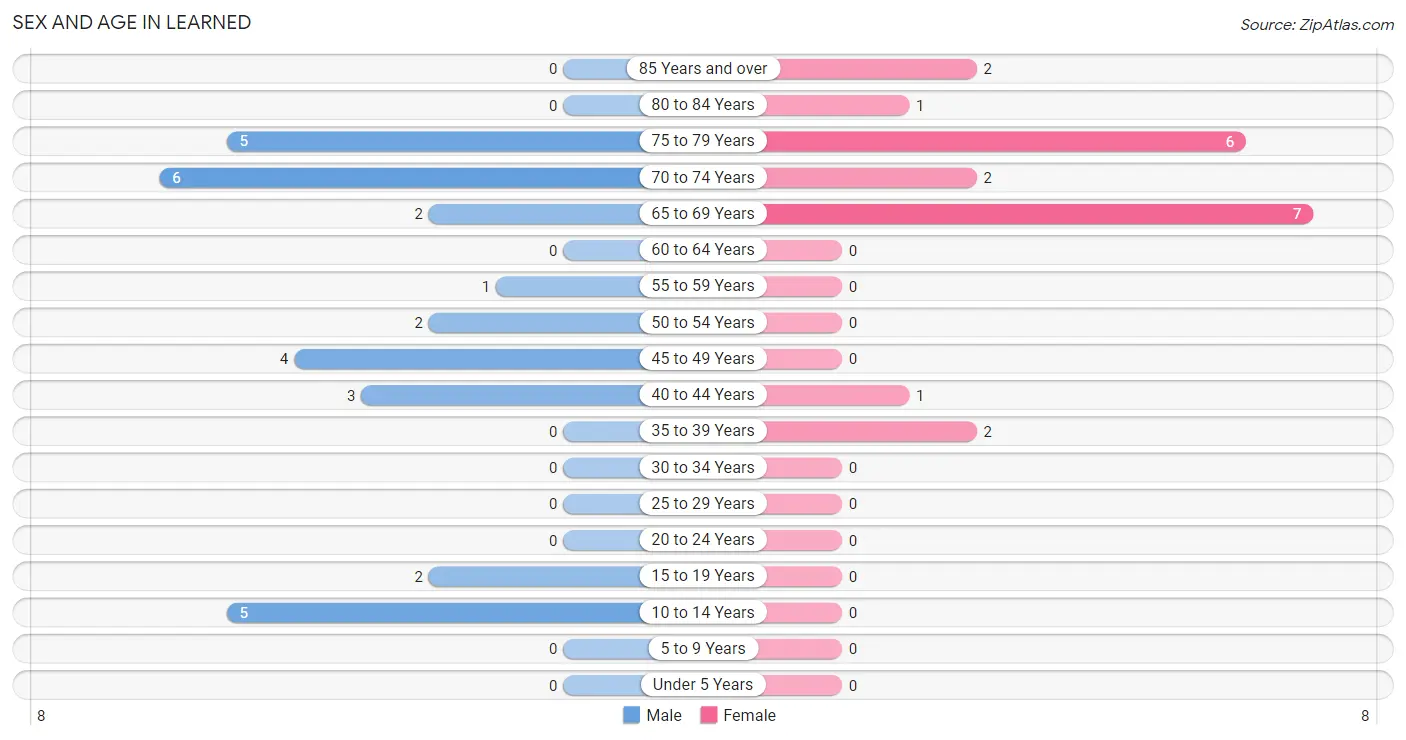
| Age Bracket | Male | Female |
| Under 5 Years | 0 (0.0%) | 0 (0.0%) |
| 5 to 9 Years | 0 (0.0%) | 0 (0.0%) |
| 10 to 14 Years | 5 (16.7%) | 0 (0.0%) |
| 15 to 19 Years | 2 (6.7%) | 0 (0.0%) |
| 20 to 24 Years | 0 (0.0%) | 0 (0.0%) |
| 25 to 29 Years | 0 (0.0%) | 0 (0.0%) |
| 30 to 34 Years | 0 (0.0%) | 0 (0.0%) |
| 35 to 39 Years | 0 (0.0%) | 2 (9.5%) |
| 40 to 44 Years | 3 (10.0%) | 1 (4.8%) |
| 45 to 49 Years | 4 (13.3%) | 0 (0.0%) |
| 50 to 54 Years | 2 (6.7%) | 0 (0.0%) |
| 55 to 59 Years | 1 (3.3%) | 0 (0.0%) |
| 60 to 64 Years | 0 (0.0%) | 0 (0.0%) |
| 65 to 69 Years | 2 (6.7%) | 7 (33.3%) |
| 70 to 74 Years | 6 (20.0%) | 2 (9.5%) |
| 75 to 79 Years | 5 (16.7%) | 6 (28.6%) |
| 80 to 84 Years | 0 (0.0%) | 1 (4.8%) |
| 85 Years and over | 0 (0.0%) | 2 (9.5%) |
| Total | 30 (100.0%) | 21 (100.0%) |
Families and Households in Learned
Median Family Size in Learned
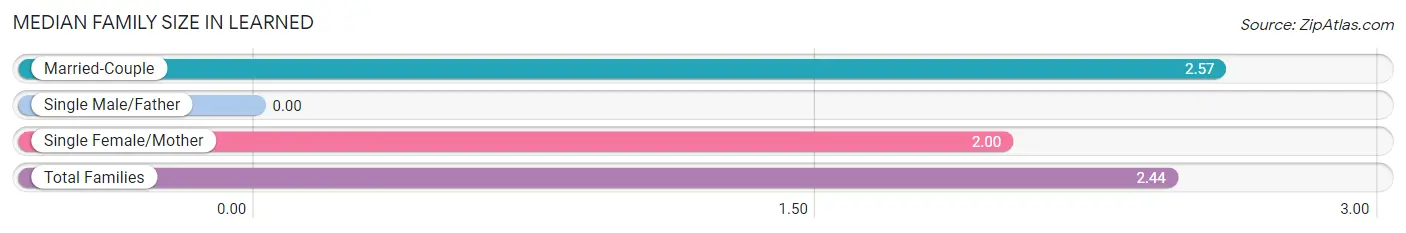
| Family Type | # Families | Family Size |
| Married-Couple | 14 (77.8%) | 2.57 |
| Single Male/Father | 0 (0.0%) | - |
| Single Female/Mother | 4 (22.2%) | 2.00 |
| Total Families | 18 (100.0%) | 2.44 |
Median Household Size in Learned
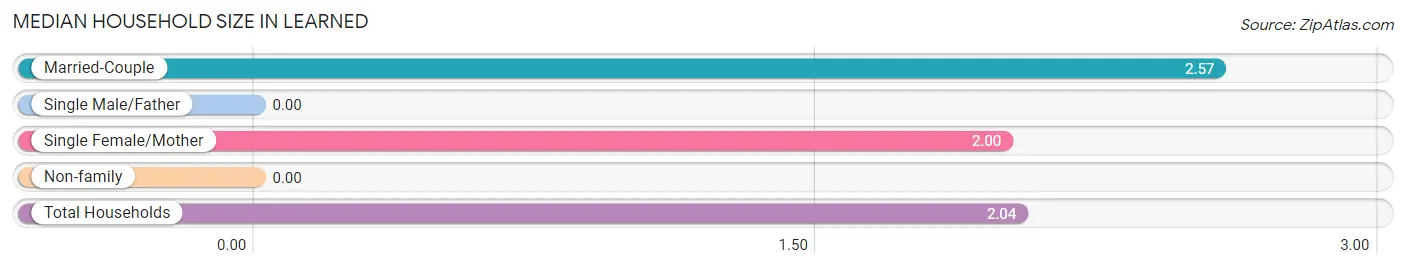
| Household Type | # Households | Household Size |
| Married-Couple | 14 (56.0%) | 2.57 |
| Single Male/Father | 0 (0.0%) | - |
| Single Female/Mother | 4 (16.0%) | 2.00 |
| Non-family | 7 (28.0%) | - |
| Total Households | 25 (100.0%) | 2.04 |
Household Size by Marriage Status in Learned
Out of a total of 25 households in Learned, 18 (72.0%) are family households, while 7 (28.0%) are nonfamily households. The most numerous type of family households are 2-person households, comprising 13, and the most common type of nonfamily households are 1-person households, comprising 7.
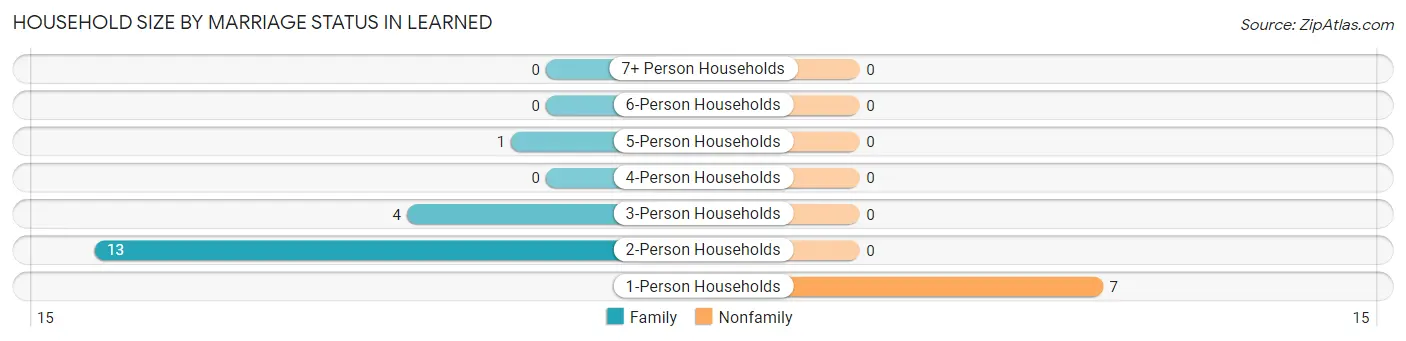
| Household Size | Family Households | Nonfamily Households |
| 1-Person Households | - | 7 (28.0%) |
| 2-Person Households | 13 (52.0%) | 0 (0.0%) |
| 3-Person Households | 4 (16.0%) | 0 (0.0%) |
| 4-Person Households | 0 (0.0%) | 0 (0.0%) |
| 5-Person Households | 1 (4.0%) | 0 (0.0%) |
| 6-Person Households | 0 (0.0%) | 0 (0.0%) |
| 7+ Person Households | 0 (0.0%) | 0 (0.0%) |
| Total | 18 (72.0%) | 7 (28.0%) |
Female Fertility in Learned
Fertility by Age in Learned
| Age Bracket | Women with Births | Births / 1,000 Women |
| 15 to 19 years | 0 (0.0%) | 0.0 |
| 20 to 34 years | 0 (0.0%) | 0.0 |
| 35 to 50 years | 0 (0.0%) | 0.0 |
| Total | 0 (0.0%) | 0.0 |
Fertility by Age by Marriage Status in Learned
| Age Bracket | Married | Unmarried |
| 15 to 19 years | 0 (0.0%) | 0 (0.0%) |
| 20 to 34 years | 0 (0.0%) | 0 (0.0%) |
| 35 to 50 years | 0 (0.0%) | 0 (0.0%) |
| Total | 0 (0.0%) | 0 (0.0%) |
Fertility by Education in Learned
| Educational Attainment | Women with Births | Births / 1,000 Women |
| Less than High School | 0 (0.0%) | 0.0 |
| High School Diploma | 0 (0.0%) | 0.0 |
| College or Associate's Degree | 0 (0.0%) | 0.0 |
| Bachelor's Degree | 0 (0.0%) | 0.0 |
| Graduate Degree | 0 (0.0%) | 0.0 |
| Total | 0 (0.0%) | 0.0 |
Fertility by Education by Marriage Status in Learned
| Educational Attainment | Married | Unmarried |
| Less than High School | 0 (0.0%) | 0 (0.0%) |
| High School Diploma | 0 (0.0%) | 0 (0.0%) |
| College or Associate's Degree | 0 (0.0%) | 0 (0.0%) |
| Bachelor's Degree | 0 (0.0%) | 0 (0.0%) |
| Graduate Degree | 0 (0.0%) | 0 (0.0%) |
| Total | 0 (0.0%) | 0 (0.0%) |
Employment Characteristics in Learned
Employment by Class of Employer in Learned
Among the 9 employed individuals in Learned, private company employees (6 | 66.7%), state government employees (2 | 22.2%), and not-for-profit organizations (1 | 11.1%) make up the most common classes of employment.
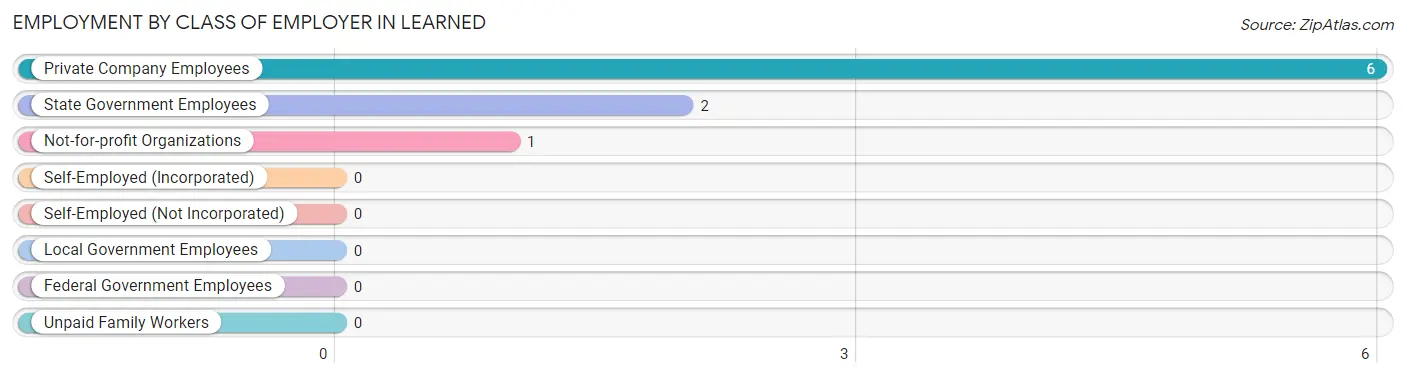
| Employer Class | # Employees | % Employees |
| Private Company Employees | 6 | 66.7% |
| Self-Employed (Incorporated) | 0 | 0.0% |
| Self-Employed (Not Incorporated) | 0 | 0.0% |
| Not-for-profit Organizations | 1 | 11.1% |
| Local Government Employees | 0 | 0.0% |
| State Government Employees | 2 | 22.2% |
| Federal Government Employees | 0 | 0.0% |
| Unpaid Family Workers | 0 | 0.0% |
| Total | 9 | 100.0% |
Employment Status by Age in Learned
According to the labor force statistics for Learned, out of the total population over 16 years of age (46), 23.9% or 11 individuals are in the labor force, with 18.2% or 2 of them unemployed. The age group with the highest labor force participation rate is 55 to 59 years, with 100.0% or 1 individuals in the labor force. Within the labor force, the 45 to 54 years age range has the highest percentage of unemployed individuals, with 40.0% or 2 of them being unemployed.
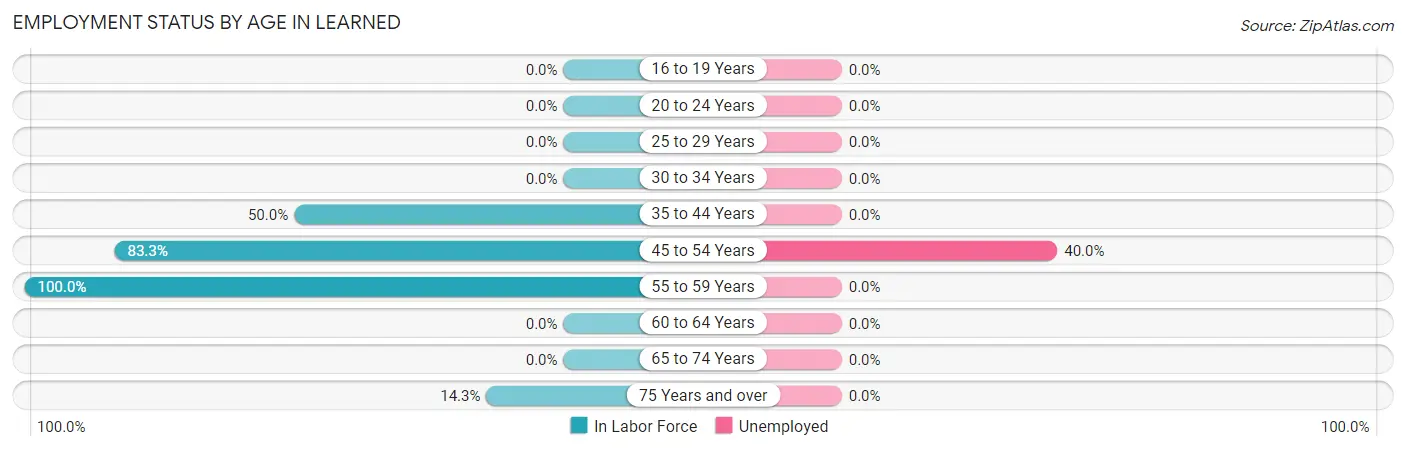
| Age Bracket | In Labor Force | Unemployed |
| 16 to 19 Years | 0 (0.0%) | 0 (0.0%) |
| 20 to 24 Years | 0 (0.0%) | 0 (0.0%) |
| 25 to 29 Years | 0 (0.0%) | 0 (0.0%) |
| 30 to 34 Years | 0 (0.0%) | 0 (0.0%) |
| 35 to 44 Years | 3 (50.0%) | 0 (0.0%) |
| 45 to 54 Years | 5 (83.3%) | 2 (40.0%) |
| 55 to 59 Years | 1 (100.0%) | 0 (0.0%) |
| 60 to 64 Years | 0 (0.0%) | 0 (0.0%) |
| 65 to 74 Years | 0 (0.0%) | 0 (0.0%) |
| 75 Years and over | 2 (14.3%) | 0 (0.0%) |
| Total | 11 (23.9%) | 2 (18.2%) |
Employment Status by Educational Attainment in Learned
According to labor force statistics for Learned, 69.2% of individuals (9) out of the total population between 25 and 64 years of age (13) are in the labor force, with 22.2% or 2 of them being unemployed. The group with the highest labor force participation rate are those with the educational attainment of high school diploma, with 100.0% or 1 individuals in the labor force. Within the labor force, individuals with high school diploma education have the highest percentage of unemployment, with 100.0% or 1 of them being unemployed.
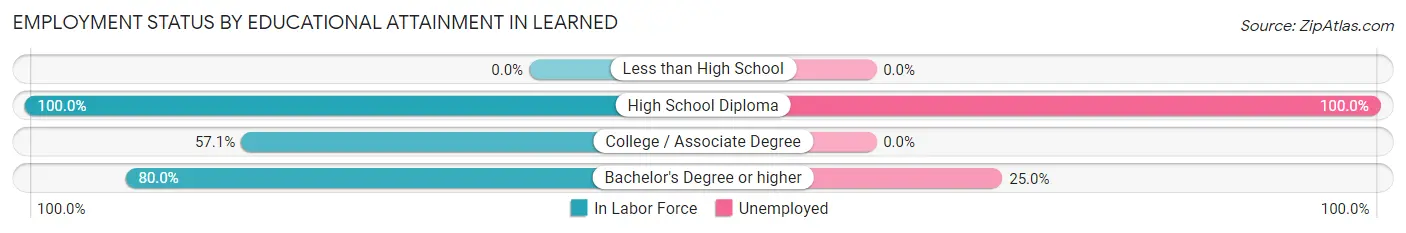
| Educational Attainment | In Labor Force | Unemployed |
| Less than High School | 0 (0.0%) | 0 (0.0%) |
| High School Diploma | 1 (100.0%) | 1 (100.0%) |
| College / Associate Degree | 4 (57.1%) | 0 (0.0%) |
| Bachelor's Degree or higher | 4 (80.0%) | 1 (25.0%) |
| Total | 9 (69.2%) | 3 (22.2%) |
Employment Occupations by Sex in Learned
Management, Business, Science and Arts Occupations
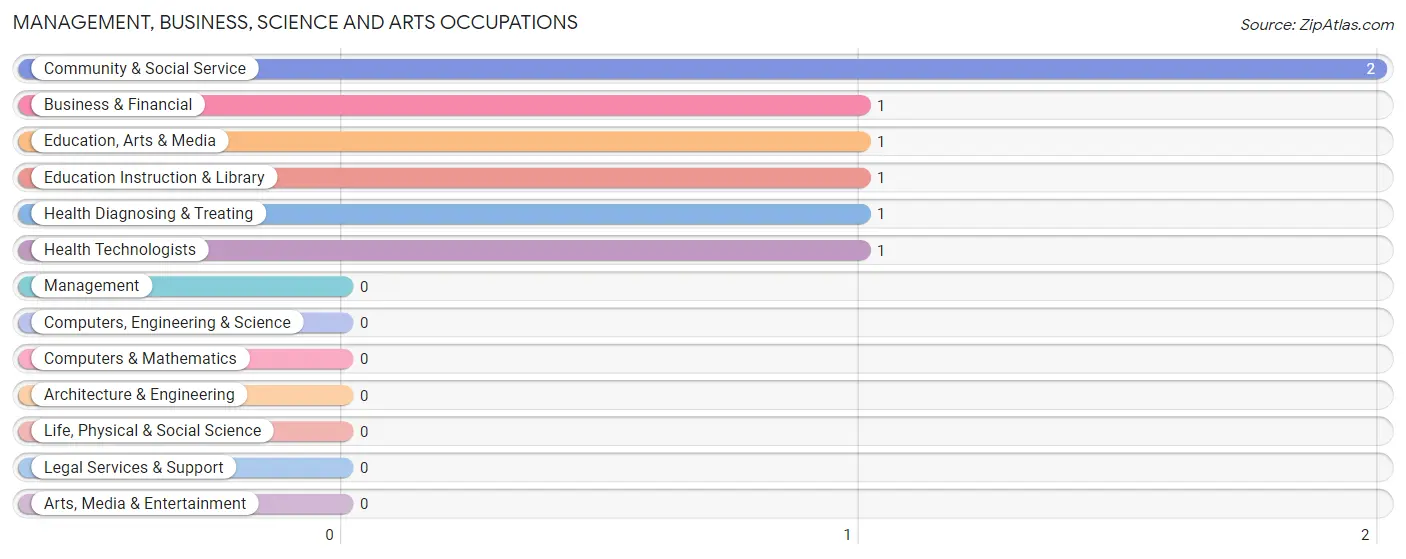
The most common Management, Business, Science and Arts occupations in Learned are Community & Social Service (2 | 22.2%), Business & Financial (1 | 11.1%), Education, Arts & Media (1 | 11.1%), Education Instruction & Library (1 | 11.1%), and Health Diagnosing & Treating (1 | 11.1%).
Management, Business, Science and Arts Occupations by Sex
Within the Management, Business, Science and Arts occupations in Learned, the most male-oriented occupations are Business & Financial (100.0%), Education, Arts & Media (100.0%), and Community & Social Service (50.0%), while the most female-oriented occupations are Education Instruction & Library (100.0%), Health Diagnosing & Treating (100.0%), and Health Technologists (100.0%).
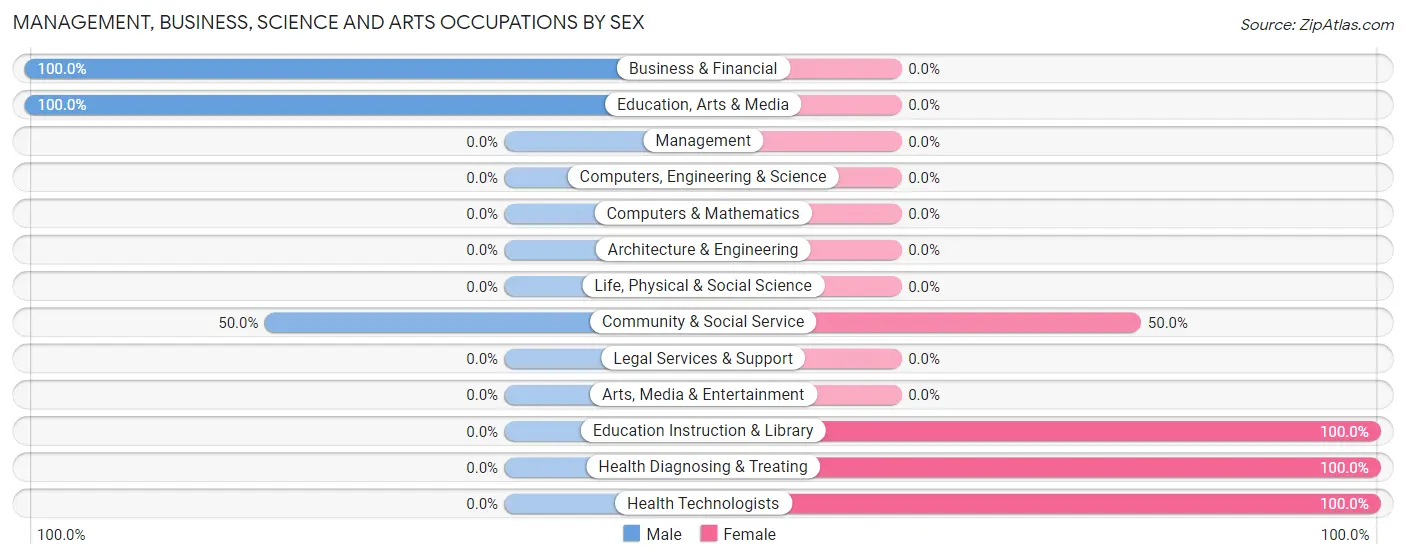
| Occupation | Male | Female |
| Management | 0 (0.0%) | 0 (0.0%) |
| Business & Financial | 1 (100.0%) | 0 (0.0%) |
| Computers, Engineering & Science | 0 (0.0%) | 0 (0.0%) |
| Computers & Mathematics | 0 (0.0%) | 0 (0.0%) |
| Architecture & Engineering | 0 (0.0%) | 0 (0.0%) |
| Life, Physical & Social Science | 0 (0.0%) | 0 (0.0%) |
| Community & Social Service | 1 (50.0%) | 1 (50.0%) |
| Education, Arts & Media | 1 (100.0%) | 0 (0.0%) |
| Legal Services & Support | 0 (0.0%) | 0 (0.0%) |
| Education Instruction & Library | 0 (0.0%) | 1 (100.0%) |
| Arts, Media & Entertainment | 0 (0.0%) | 0 (0.0%) |
| Health Diagnosing & Treating | 0 (0.0%) | 1 (100.0%) |
| Health Technologists | 0 (0.0%) | 1 (100.0%) |
| Total (Category) | 2 (50.0%) | 2 (50.0%) |
| Total (Overall) | 5 (55.6%) | 4 (44.4%) |
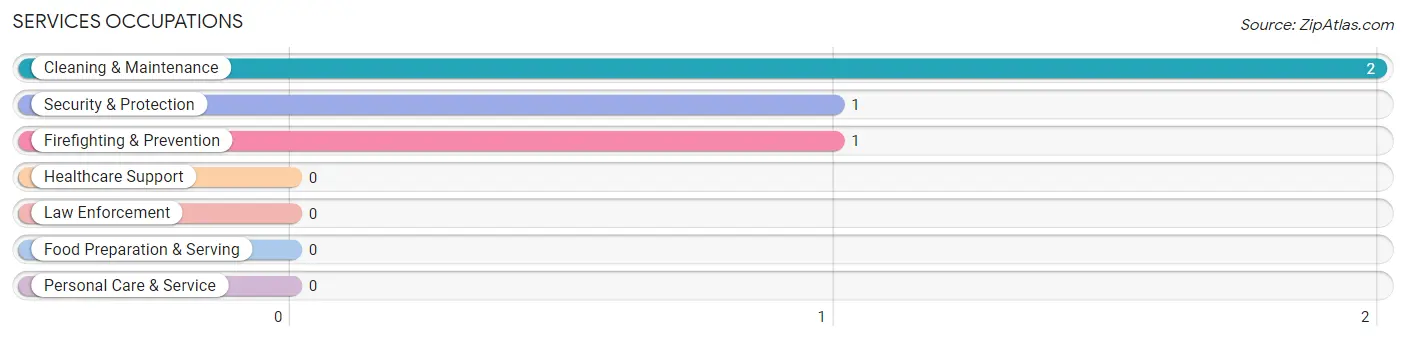
Services Occupations
The most common Services occupations in Learned are Cleaning & Maintenance (2 | 22.2%), Security & Protection (1 | 11.1%), and Firefighting & Prevention (1 | 11.1%).
Services Occupations by Sex
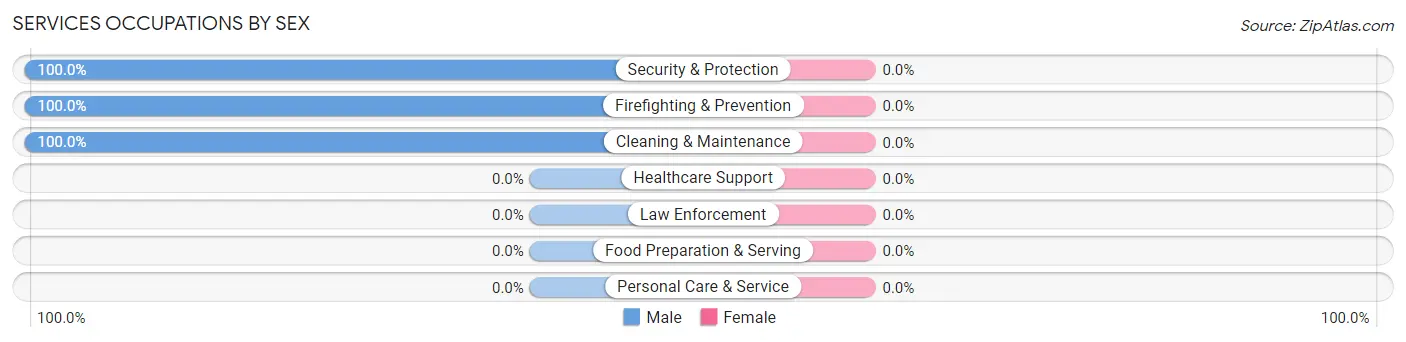
| Occupation | Male | Female |
| Healthcare Support | 0 (0.0%) | 0 (0.0%) |
| Security & Protection | 1 (100.0%) | 0 (0.0%) |
| Firefighting & Prevention | 1 (100.0%) | 0 (0.0%) |
| Law Enforcement | 0 (0.0%) | 0 (0.0%) |
| Food Preparation & Serving | 0 (0.0%) | 0 (0.0%) |
| Cleaning & Maintenance | 2 (100.0%) | 0 (0.0%) |
| Personal Care & Service | 0 (0.0%) | 0 (0.0%) |
| Total (Category) | 3 (100.0%) | 0 (0.0%) |
| Total (Overall) | 5 (55.6%) | 4 (44.4%) |
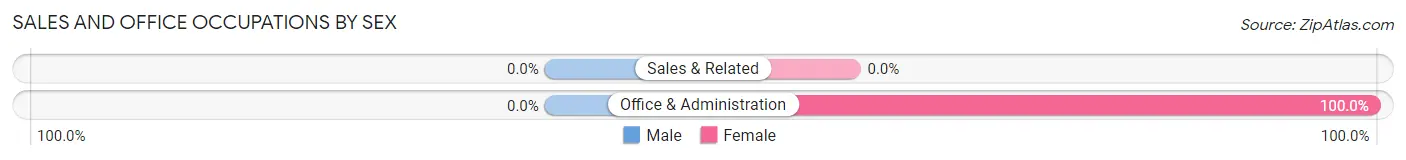
Sales and Office Occupations
The most common Sales and Office occupations in Learned are , and Office & Administration (2 | 22.2%).
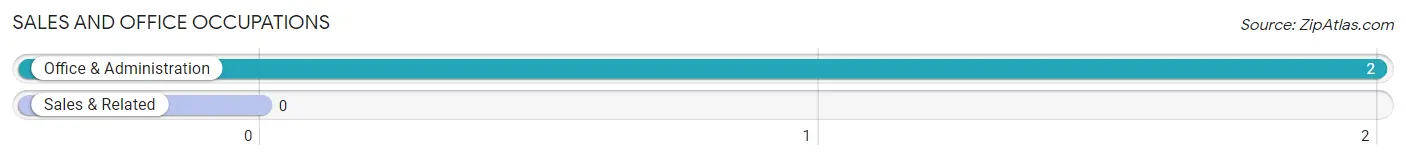
Sales and Office Occupations by Sex
| Occupation | Male | Female |
| Sales & Related | 0 (0.0%) | 0 (0.0%) |
| Office & Administration | 0 (0.0%) | 2 (100.0%) |
| Total (Category) | 0 (0.0%) | 2 (100.0%) |
| Total (Overall) | 5 (55.6%) | 4 (44.4%) |
Natural Resources, Construction and Maintenance Occupations
Natural Resources, Construction and Maintenance Occupations by Sex
| Occupation | Male | Female |
| Farming, Fishing & Forestry | 0 (0.0%) | 0 (0.0%) |
| Construction & Extraction | 0 (0.0%) | 0 (0.0%) |
| Installation, Maintenance & Repair | 0 (0.0%) | 0 (0.0%) |
| Total (Category) | 0 (0.0%) | 0 (0.0%) |
| Total (Overall) | 5 (55.6%) | 4 (44.4%) |
Production, Transportation and Moving Occupations
Production, Transportation and Moving Occupations by Sex
| Occupation | Male | Female |
| Production | 0 (0.0%) | 0 (0.0%) |
| Transportation | 0 (0.0%) | 0 (0.0%) |
| Material Moving | 0 (0.0%) | 0 (0.0%) |
| Total (Category) | 0 (0.0%) | 0 (0.0%) |
| Total (Overall) | 5 (55.6%) | 4 (44.4%) |
Employment Industries by Sex in Learned
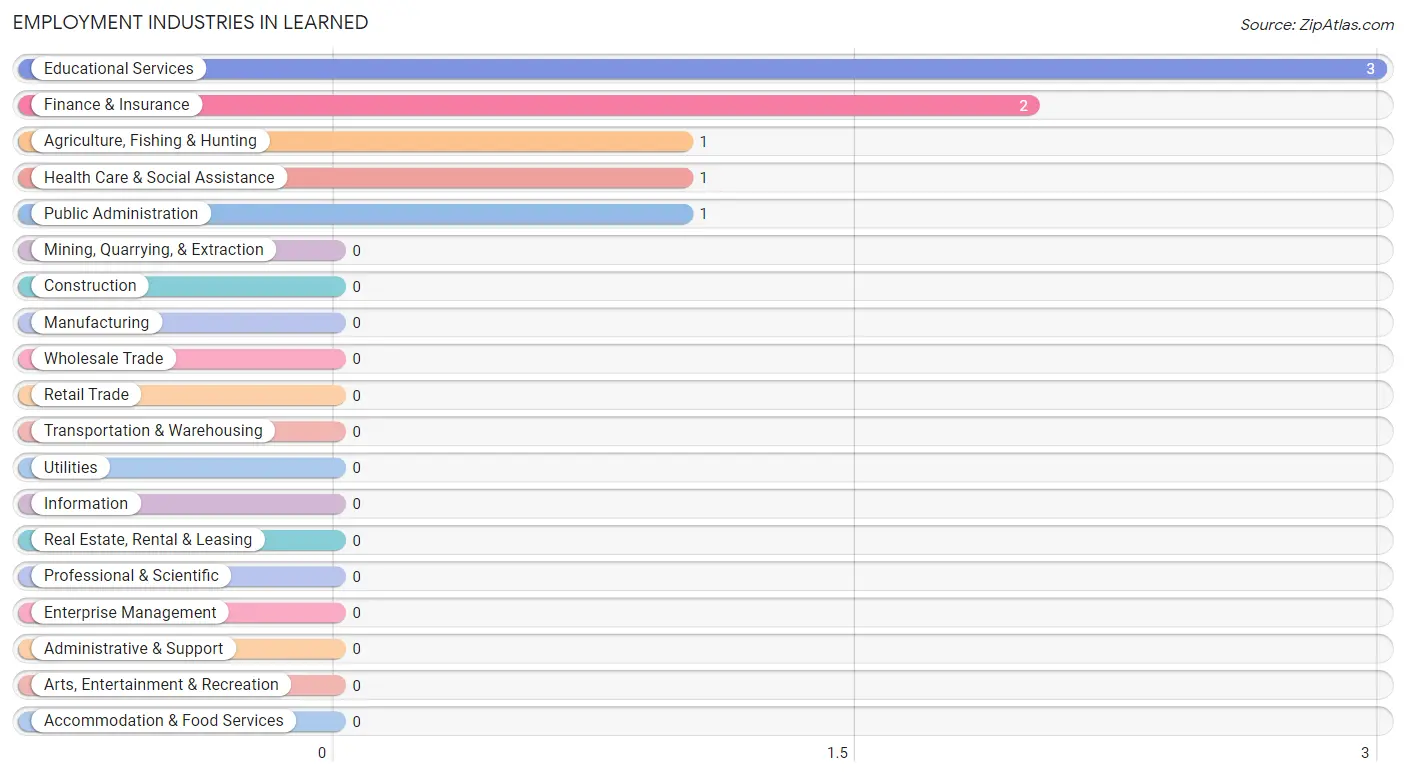
Employment Industries in Learned
The major employment industries in Learned include Educational Services (3 | 33.3%), Finance & Insurance (2 | 22.2%), Agriculture, Fishing & Hunting (1 | 11.1%), Health Care & Social Assistance (1 | 11.1%), and Public Administration (1 | 11.1%).
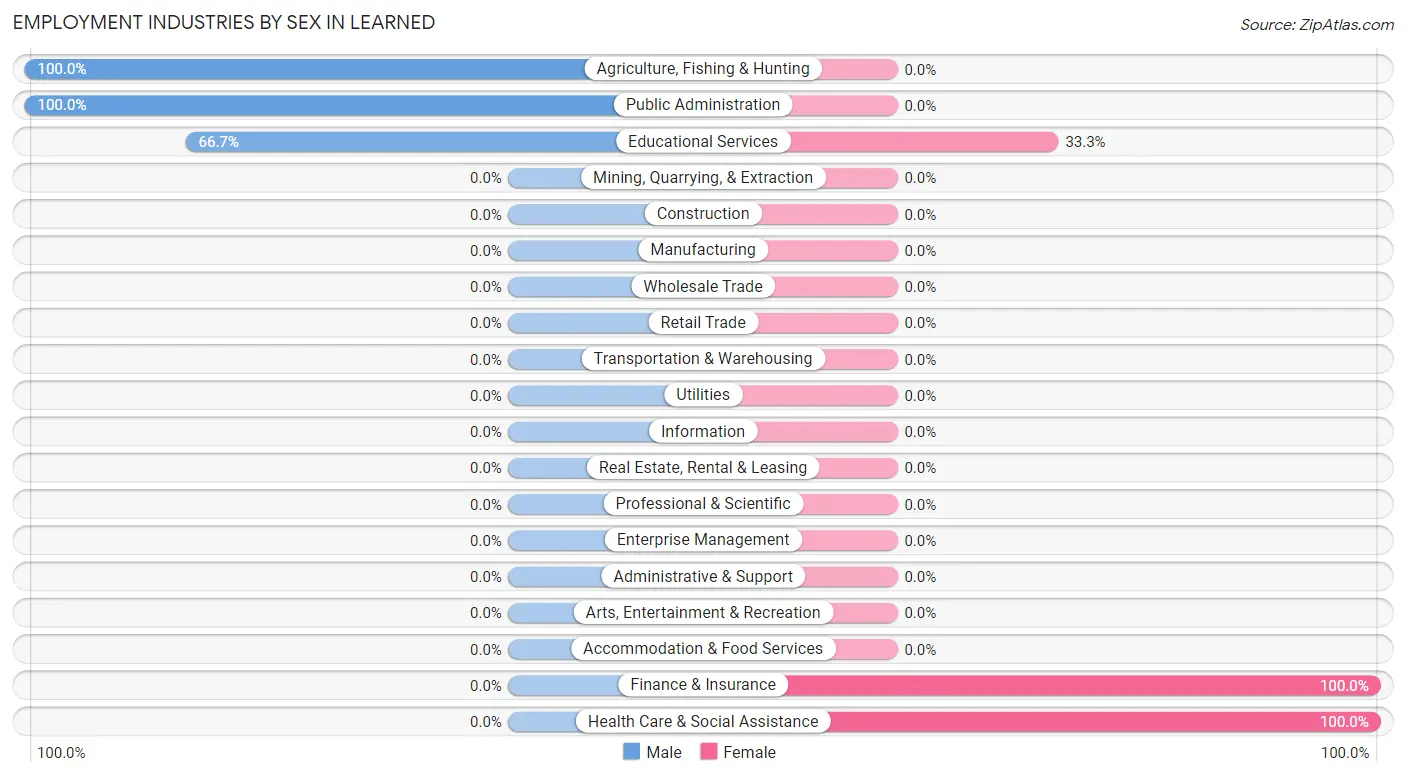
Employment Industries by Sex in Learned
The Learned industries that see more men than women are Agriculture, Fishing & Hunting (100.0%), Public Administration (100.0%), and Educational Services (66.7%), whereas the industries that tend to have a higher number of women are Finance & Insurance (100.0%), Health Care & Social Assistance (100.0%), and Educational Services (33.3%).
| Industry | Male | Female |
| Agriculture, Fishing & Hunting | 1 (100.0%) | 0 (0.0%) |
| Mining, Quarrying, & Extraction | 0 (0.0%) | 0 (0.0%) |
| Construction | 0 (0.0%) | 0 (0.0%) |
| Manufacturing | 0 (0.0%) | 0 (0.0%) |
| Wholesale Trade | 0 (0.0%) | 0 (0.0%) |
| Retail Trade | 0 (0.0%) | 0 (0.0%) |
| Transportation & Warehousing | 0 (0.0%) | 0 (0.0%) |
| Utilities | 0 (0.0%) | 0 (0.0%) |
| Information | 0 (0.0%) | 0 (0.0%) |
| Finance & Insurance | 0 (0.0%) | 2 (100.0%) |
| Real Estate, Rental & Leasing | 0 (0.0%) | 0 (0.0%) |
| Professional & Scientific | 0 (0.0%) | 0 (0.0%) |
| Enterprise Management | 0 (0.0%) | 0 (0.0%) |
| Administrative & Support | 0 (0.0%) | 0 (0.0%) |
| Educational Services | 2 (66.7%) | 1 (33.3%) |
| Health Care & Social Assistance | 0 (0.0%) | 1 (100.0%) |
| Arts, Entertainment & Recreation | 0 (0.0%) | 0 (0.0%) |
| Accommodation & Food Services | 0 (0.0%) | 0 (0.0%) |
| Public Administration | 1 (100.0%) | 0 (0.0%) |
| Total | 5 (55.6%) | 4 (44.4%) |
Education in Learned
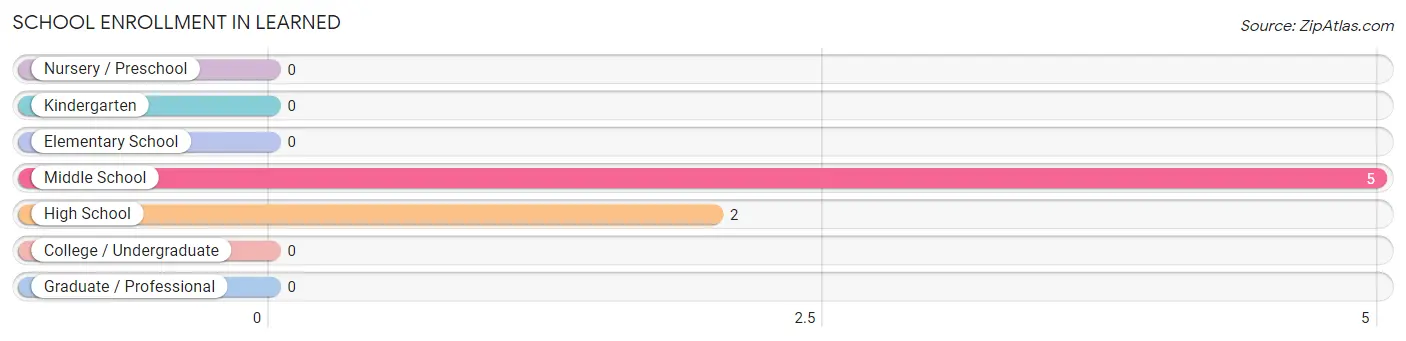
School Enrollment in Learned
The most common levels of schooling among the 7 students in Learned are middle school (5 | 71.4%), and high school (2 | 28.6%).
| School Level | # Students | % Students |
| Nursery / Preschool | 0 | 0.0% |
| Kindergarten | 0 | 0.0% |
| Elementary School | 0 | 0.0% |
| Middle School | 5 | 71.4% |
| High School | 2 | 28.6% |
| College / Undergraduate | 0 | 0.0% |
| Graduate / Professional | 0 | 0.0% |
| Total | 7 | 100.0% |
School Enrollment by Age by Funding Source in Learned
Out of a total of 7 students who are enrolled in schools in Learned, 3 (42.9%) attend a private institution, while the remaining 4 (57.1%) are enrolled in public schools. The age group of 10 to 14 year olds has the highest likelihood of being enrolled in private schools, with 3 (60.0% in the age bracket) enrolled. Conversely, the age group of 15 to 17 year olds has the lowest likelihood of being enrolled in a private school, with 2 (100.0% in the age bracket) attending a public institution.
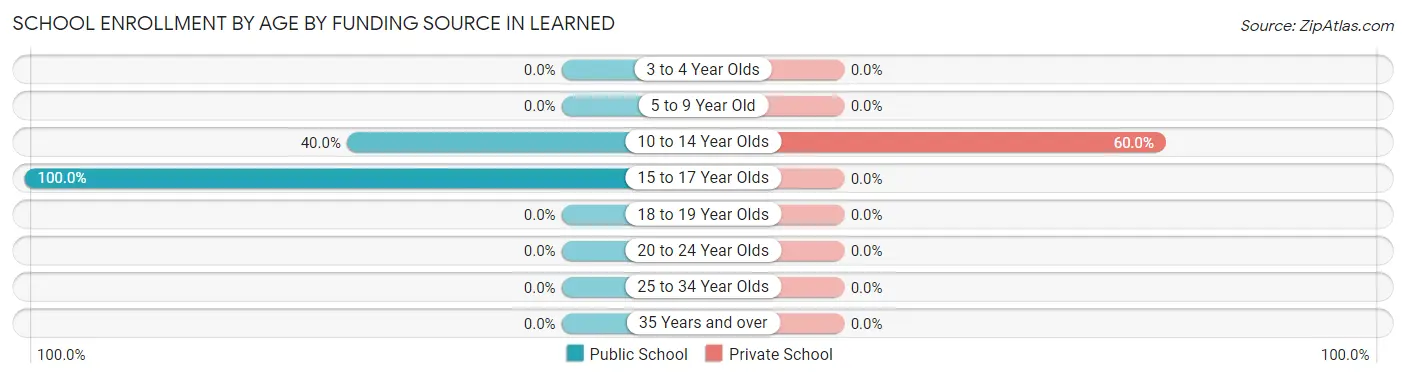
| Age Bracket | Public School | Private School |
| 3 to 4 Year Olds | 0 (0.0%) | 0 (0.0%) |
| 5 to 9 Year Old | 0 (0.0%) | 0 (0.0%) |
| 10 to 14 Year Olds | 2 (40.0%) | 3 (60.0%) |
| 15 to 17 Year Olds | 2 (100.0%) | 0 (0.0%) |
| 18 to 19 Year Olds | 0 (0.0%) | 0 (0.0%) |
| 20 to 24 Year Olds | 0 (0.0%) | 0 (0.0%) |
| 25 to 34 Year Olds | 0 (0.0%) | 0 (0.0%) |
| 35 Years and over | 0 (0.0%) | 0 (0.0%) |
| Total | 4 (57.1%) | 3 (42.9%) |
Educational Attainment by Field of Study in Learned
Education (9 | 40.9%), computers & mathematics (4 | 18.2%), business (4 | 18.2%), liberal arts & history (2 | 9.1%), and bio, nature & agricultural (1 | 4.5%) are the most common fields of study among 22 individuals in Learned who have obtained a bachelor's degree or higher.
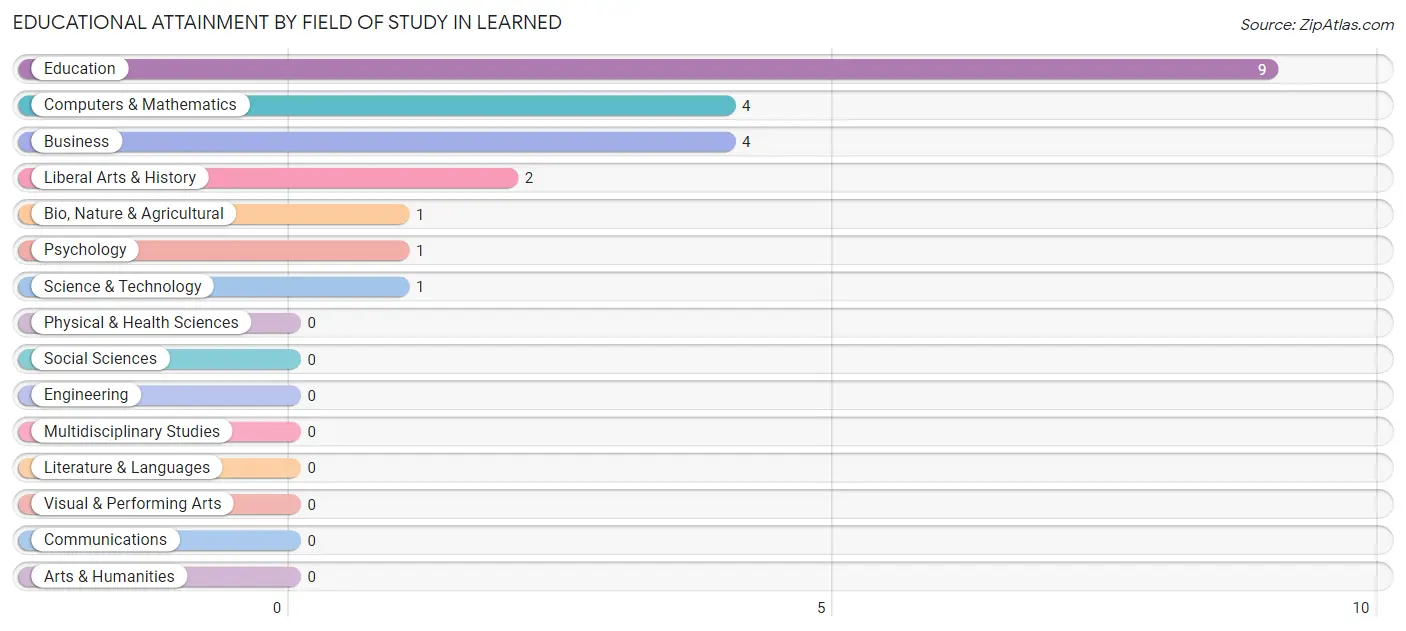
| Field of Study | # Graduates | % Graduates |
| Computers & Mathematics | 4 | 18.2% |
| Bio, Nature & Agricultural | 1 | 4.5% |
| Physical & Health Sciences | 0 | 0.0% |
| Psychology | 1 | 4.5% |
| Social Sciences | 0 | 0.0% |
| Engineering | 0 | 0.0% |
| Multidisciplinary Studies | 0 | 0.0% |
| Science & Technology | 1 | 4.5% |
| Business | 4 | 18.2% |
| Education | 9 | 40.9% |
| Literature & Languages | 0 | 0.0% |
| Liberal Arts & History | 2 | 9.1% |
| Visual & Performing Arts | 0 | 0.0% |
| Communications | 0 | 0.0% |
| Arts & Humanities | 0 | 0.0% |
| Total | 22 | 100.0% |
Transportation & Commute in Learned
Vehicle Availability by Sex in Learned
The most prevalent vehicle ownership categories in Learned are males with 3 vehicles (4, accounting for 80.0%) and females with 3 vehicles (3, making up 100.0%).
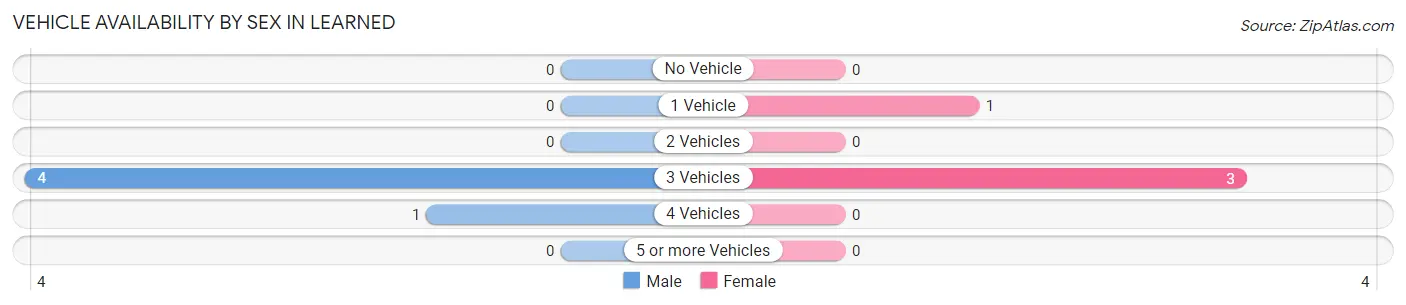
| Vehicles Available | Male | Female |
| No Vehicle | 0 (0.0%) | 0 (0.0%) |
| 1 Vehicle | 0 (0.0%) | 1 (25.0%) |
| 2 Vehicles | 0 (0.0%) | 0 (0.0%) |
| 3 Vehicles | 4 (80.0%) | 3 (75.0%) |
| 4 Vehicles | 1 (20.0%) | 0 (0.0%) |
| 5 or more Vehicles | 0 (0.0%) | 0 (0.0%) |
| Total | 5 (100.0%) | 4 (100.0%) |
Commute Time in Learned
The most frequently occuring commute durations in Learned are 30 to 34 minutes (4 commuters, 44.4%), 25 to 29 minutes (3 commuters, 33.3%), and 15 to 19 minutes (1 commuters, 11.1%).
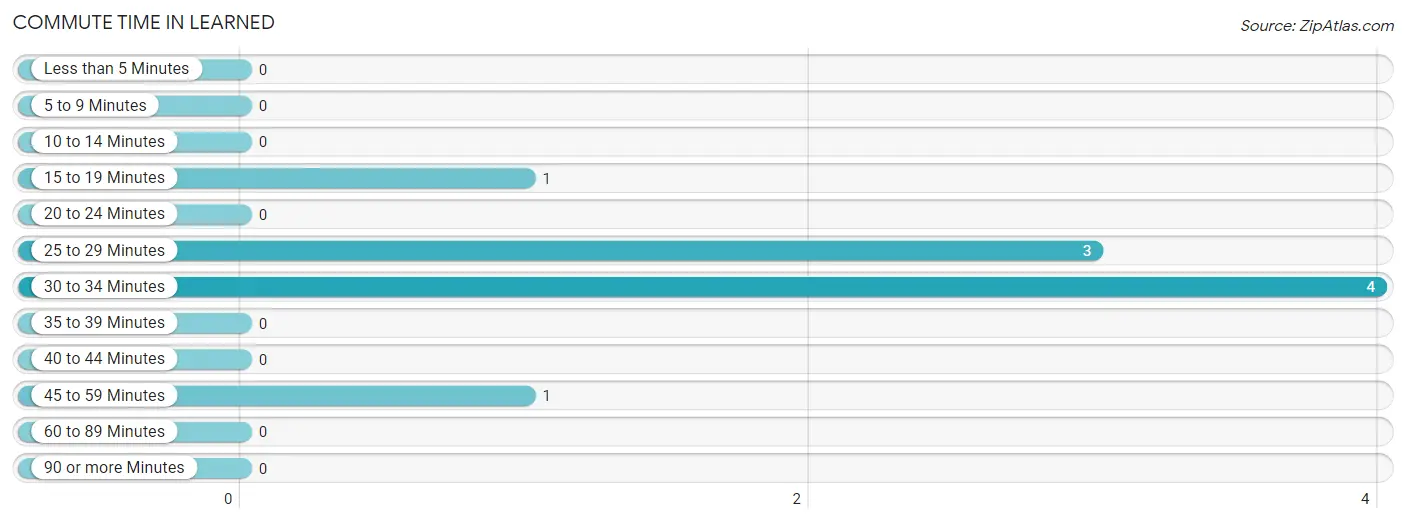
| Commute Time | # Commuters | % Commuters |
| Less than 5 Minutes | 0 | 0.0% |
| 5 to 9 Minutes | 0 | 0.0% |
| 10 to 14 Minutes | 0 | 0.0% |
| 15 to 19 Minutes | 1 | 11.1% |
| 20 to 24 Minutes | 0 | 0.0% |
| 25 to 29 Minutes | 3 | 33.3% |
| 30 to 34 Minutes | 4 | 44.4% |
| 35 to 39 Minutes | 0 | 0.0% |
| 40 to 44 Minutes | 0 | 0.0% |
| 45 to 59 Minutes | 1 | 11.1% |
| 60 to 89 Minutes | 0 | 0.0% |
| 90 or more Minutes | 0 | 0.0% |
Commute Time by Sex in Learned
The most common commute times in Learned are 25 to 29 minutes (2 commuters, 40.0%) for males and 30 to 34 minutes (3 commuters, 75.0%) for females.
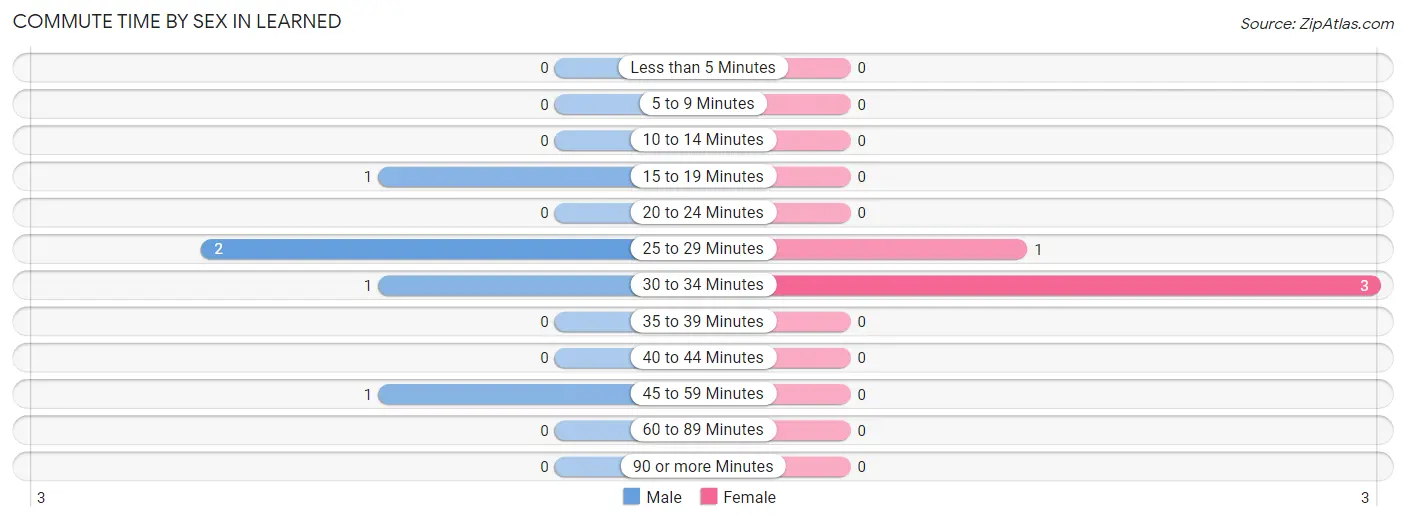
| Commute Time | Male | Female |
| Less than 5 Minutes | 0 (0.0%) | 0 (0.0%) |
| 5 to 9 Minutes | 0 (0.0%) | 0 (0.0%) |
| 10 to 14 Minutes | 0 (0.0%) | 0 (0.0%) |
| 15 to 19 Minutes | 1 (20.0%) | 0 (0.0%) |
| 20 to 24 Minutes | 0 (0.0%) | 0 (0.0%) |
| 25 to 29 Minutes | 2 (40.0%) | 1 (25.0%) |
| 30 to 34 Minutes | 1 (20.0%) | 3 (75.0%) |
| 35 to 39 Minutes | 0 (0.0%) | 0 (0.0%) |
| 40 to 44 Minutes | 0 (0.0%) | 0 (0.0%) |
| 45 to 59 Minutes | 1 (20.0%) | 0 (0.0%) |
| 60 to 89 Minutes | 0 (0.0%) | 0 (0.0%) |
| 90 or more Minutes | 0 (0.0%) | 0 (0.0%) |
Time of Departure to Work by Sex in Learned
The most frequent times of departure to work in Learned are 5:30 AM to 5:59 AM (2, 40.0%) for males and 7:00 AM to 7:29 AM (2, 50.0%) for females.
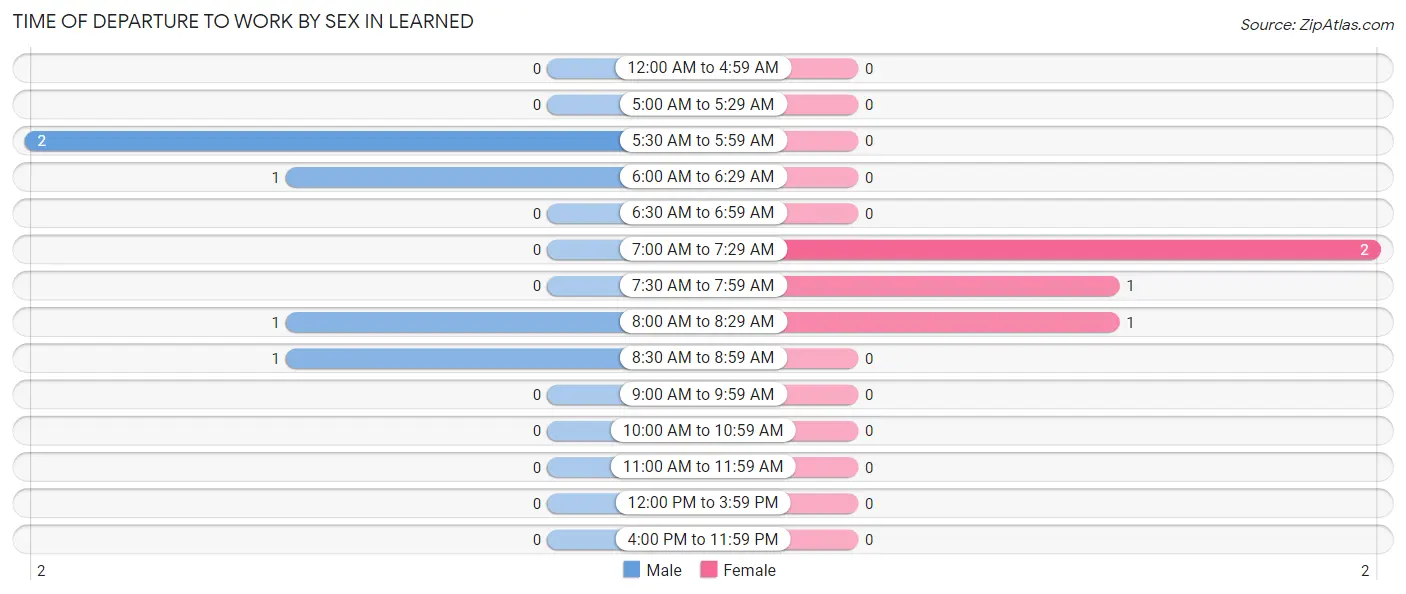
| Time of Departure | Male | Female |
| 12:00 AM to 4:59 AM | 0 (0.0%) | 0 (0.0%) |
| 5:00 AM to 5:29 AM | 0 (0.0%) | 0 (0.0%) |
| 5:30 AM to 5:59 AM | 2 (40.0%) | 0 (0.0%) |
| 6:00 AM to 6:29 AM | 1 (20.0%) | 0 (0.0%) |
| 6:30 AM to 6:59 AM | 0 (0.0%) | 0 (0.0%) |
| 7:00 AM to 7:29 AM | 0 (0.0%) | 2 (50.0%) |
| 7:30 AM to 7:59 AM | 0 (0.0%) | 1 (25.0%) |
| 8:00 AM to 8:29 AM | 1 (20.0%) | 1 (25.0%) |
| 8:30 AM to 8:59 AM | 1 (20.0%) | 0 (0.0%) |
| 9:00 AM to 9:59 AM | 0 (0.0%) | 0 (0.0%) |
| 10:00 AM to 10:59 AM | 0 (0.0%) | 0 (0.0%) |
| 11:00 AM to 11:59 AM | 0 (0.0%) | 0 (0.0%) |
| 12:00 PM to 3:59 PM | 0 (0.0%) | 0 (0.0%) |
| 4:00 PM to 11:59 PM | 0 (0.0%) | 0 (0.0%) |
| Total | 5 (100.0%) | 4 (100.0%) |
Housing Occupancy in Learned
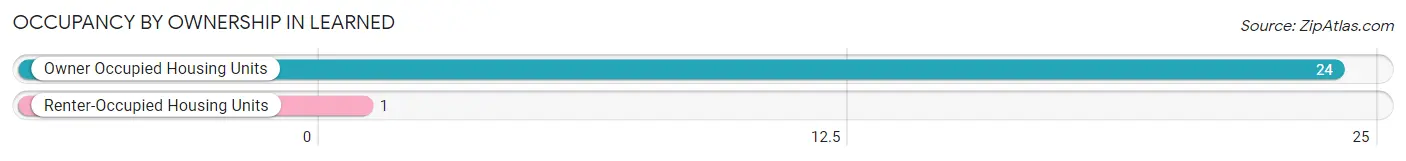
Occupancy by Ownership in Learned
Of the total 25 dwellings in Learned, owner-occupied units account for 24 (96.0%), while renter-occupied units make up 1 (4.0%).
| Occupancy | # Housing Units | % Housing Units |
| Owner Occupied Housing Units | 24 | 96.0% |
| Renter-Occupied Housing Units | 1 | 4.0% |
| Total Occupied Housing Units | 25 | 100.0% |
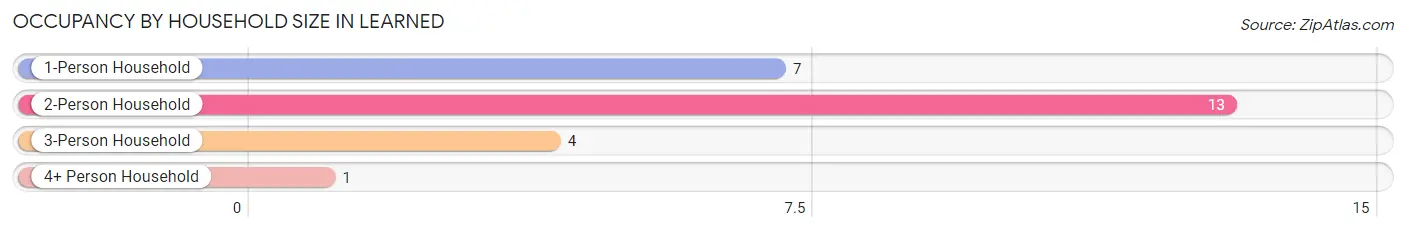
Occupancy by Household Size in Learned
| Household Size | # Housing Units | % Housing Units |
| 1-Person Household | 7 | 28.0% |
| 2-Person Household | 13 | 52.0% |
| 3-Person Household | 4 | 16.0% |
| 4+ Person Household | 1 | 4.0% |
| Total Housing Units | 25 | 100.0% |
Occupancy by Ownership by Household Size in Learned
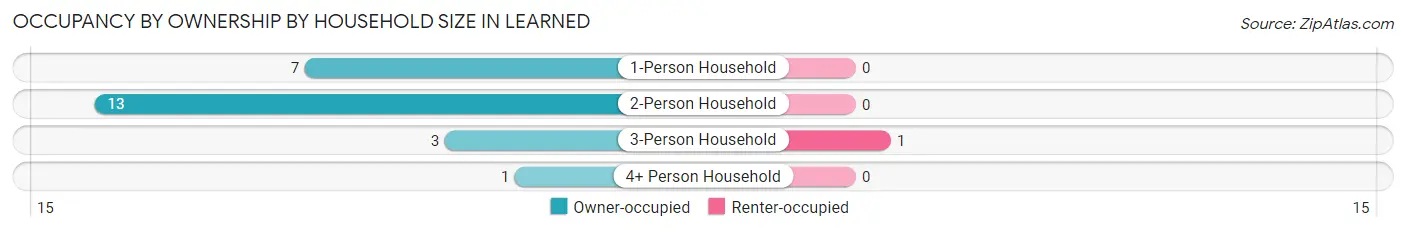
| Household Size | Owner-occupied | Renter-occupied |
| 1-Person Household | 7 (100.0%) | 0 (0.0%) |
| 2-Person Household | 13 (100.0%) | 0 (0.0%) |
| 3-Person Household | 3 (75.0%) | 1 (25.0%) |
| 4+ Person Household | 1 (100.0%) | 0 (0.0%) |
| Total Housing Units | 24 (96.0%) | 1 (4.0%) |
Occupancy by Educational Attainment in Learned
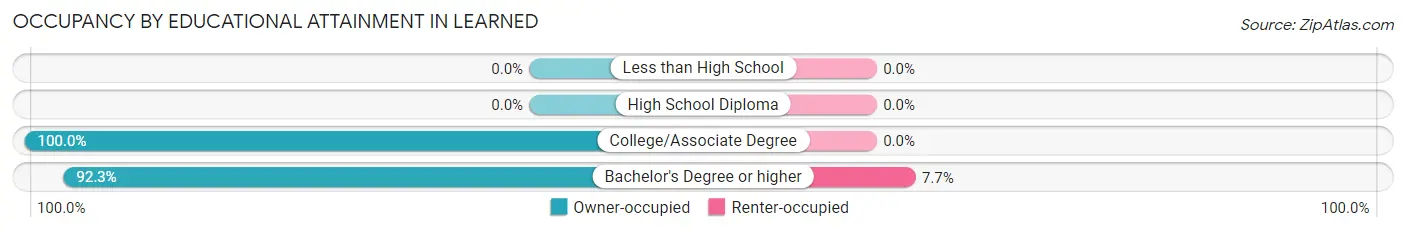
| Household Size | Owner-occupied | Renter-occupied |
| Less than High School | 0 (0.0%) | 0 (0.0%) |
| High School Diploma | 0 (0.0%) | 0 (0.0%) |
| College/Associate Degree | 12 (100.0%) | 0 (0.0%) |
| Bachelor's Degree or higher | 12 (92.3%) | 1 (7.7%) |
Occupancy by Age of Householder in Learned
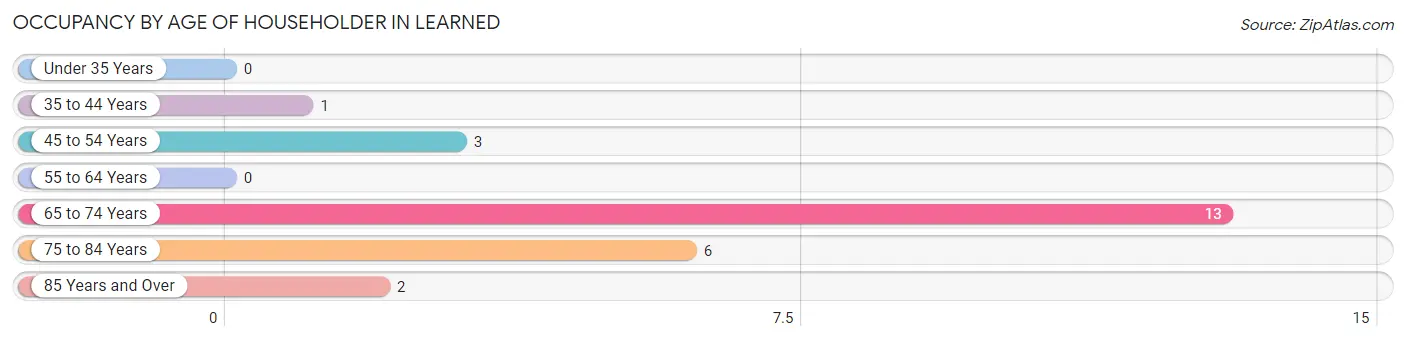
| Age Bracket | # Households | % Households |
| Under 35 Years | 0 | 0.0% |
| 35 to 44 Years | 1 | 4.0% |
| 45 to 54 Years | 3 | 12.0% |
| 55 to 64 Years | 0 | 0.0% |
| 65 to 74 Years | 13 | 52.0% |
| 75 to 84 Years | 6 | 24.0% |
| 85 Years and Over | 2 | 8.0% |
| Total | 25 | 100.0% |
Housing Finances in Learned
Median Income by Occupancy in Learned
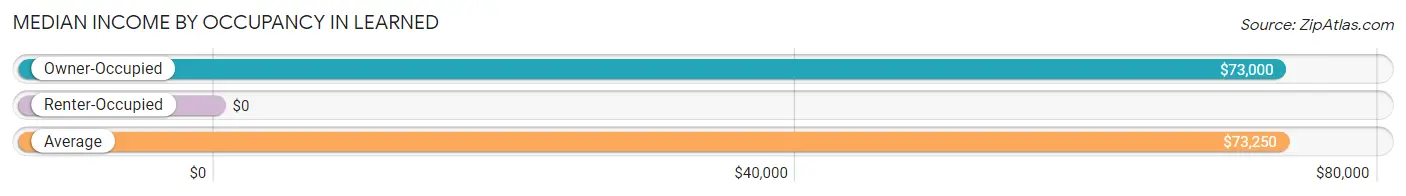
| Occupancy Type | # Households | Median Income |
| Owner-Occupied | 24 (96.0%) | $73,000 |
| Renter-Occupied | 1 (4.0%) | $0 |
| Average | 25 (100.0%) | $73,250 |
Occupancy by Householder Income Bracket in Learned
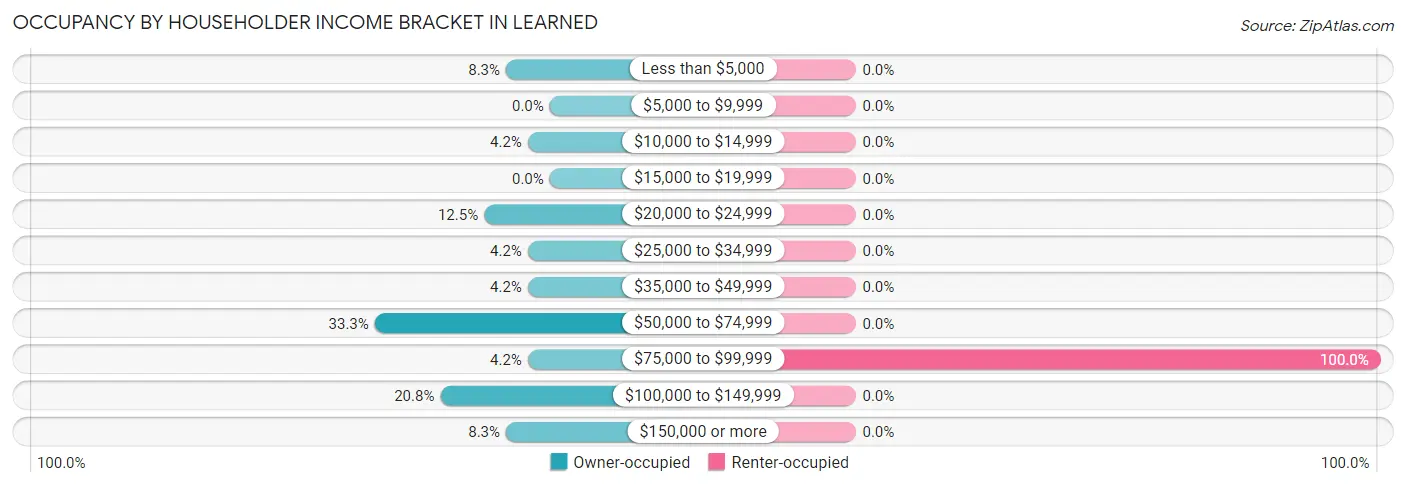
| Income Bracket | Owner-occupied | Renter-occupied |
| Less than $5,000 | 2 (8.3%) | 0 (0.0%) |
| $5,000 to $9,999 | 0 (0.0%) | 0 (0.0%) |
| $10,000 to $14,999 | 1 (4.2%) | 0 (0.0%) |
| $15,000 to $19,999 | 0 (0.0%) | 0 (0.0%) |
| $20,000 to $24,999 | 3 (12.5%) | 0 (0.0%) |
| $25,000 to $34,999 | 1 (4.2%) | 0 (0.0%) |
| $35,000 to $49,999 | 1 (4.2%) | 0 (0.0%) |
| $50,000 to $74,999 | 8 (33.3%) | 0 (0.0%) |
| $75,000 to $99,999 | 1 (4.2%) | 1 (100.0%) |
| $100,000 to $149,999 | 5 (20.8%) | 0 (0.0%) |
| $150,000 or more | 2 (8.3%) | 0 (0.0%) |
| Total | 24 (100.0%) | 1 (100.0%) |
Monthly Housing Cost Tiers in Learned
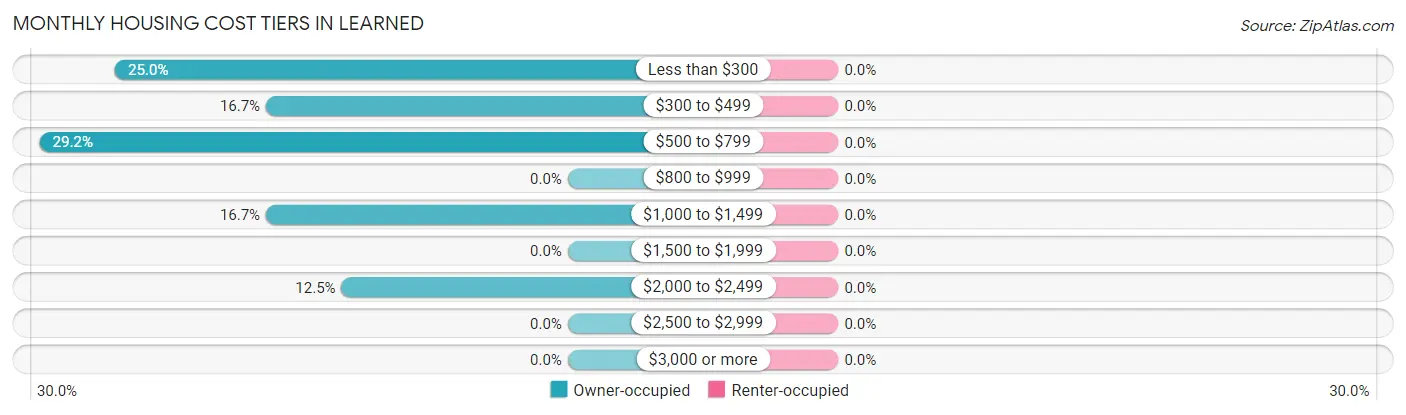
| Monthly Cost | Owner-occupied | Renter-occupied |
| Less than $300 | 6 (25.0%) | 0 (0.0%) |
| $300 to $499 | 4 (16.7%) | 0 (0.0%) |
| $500 to $799 | 7 (29.2%) | 0 (0.0%) |
| $800 to $999 | 0 (0.0%) | 0 (0.0%) |
| $1,000 to $1,499 | 4 (16.7%) | 0 (0.0%) |
| $1,500 to $1,999 | 0 (0.0%) | 0 (0.0%) |
| $2,000 to $2,499 | 3 (12.5%) | 0 (0.0%) |
| $2,500 to $2,999 | 0 (0.0%) | 0 (0.0%) |
| $3,000 or more | 0 (0.0%) | 0 (0.0%) |
| Total | 24 (100.0%) | 1 (100.0%) |
Physical Housing Characteristics in Learned
Housing Structures in Learned
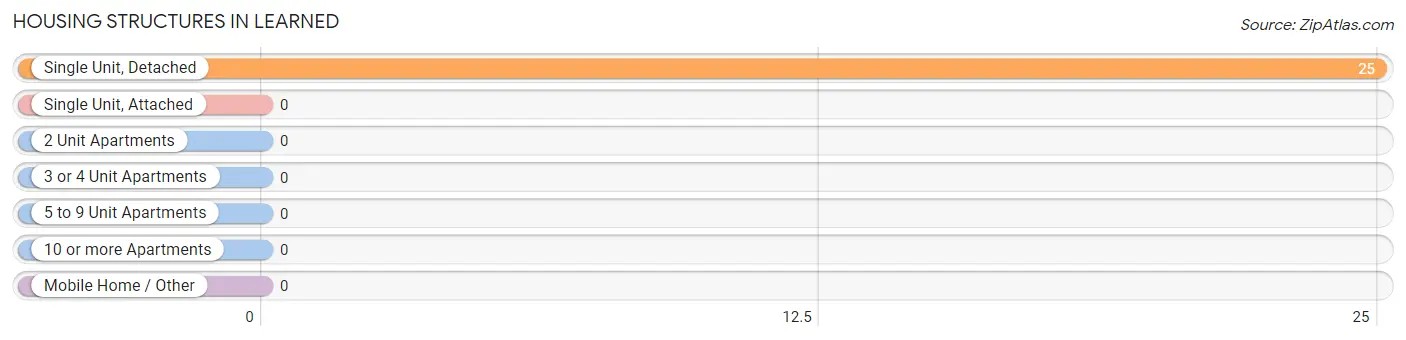
| Structure Type | # Housing Units | % Housing Units |
| Single Unit, Detached | 25 | 100.0% |
| Single Unit, Attached | 0 | 0.0% |
| 2 Unit Apartments | 0 | 0.0% |
| 3 or 4 Unit Apartments | 0 | 0.0% |
| 5 to 9 Unit Apartments | 0 | 0.0% |
| 10 or more Apartments | 0 | 0.0% |
| Mobile Home / Other | 0 | 0.0% |
| Total | 25 | 100.0% |
Housing Structures by Occupancy in Learned
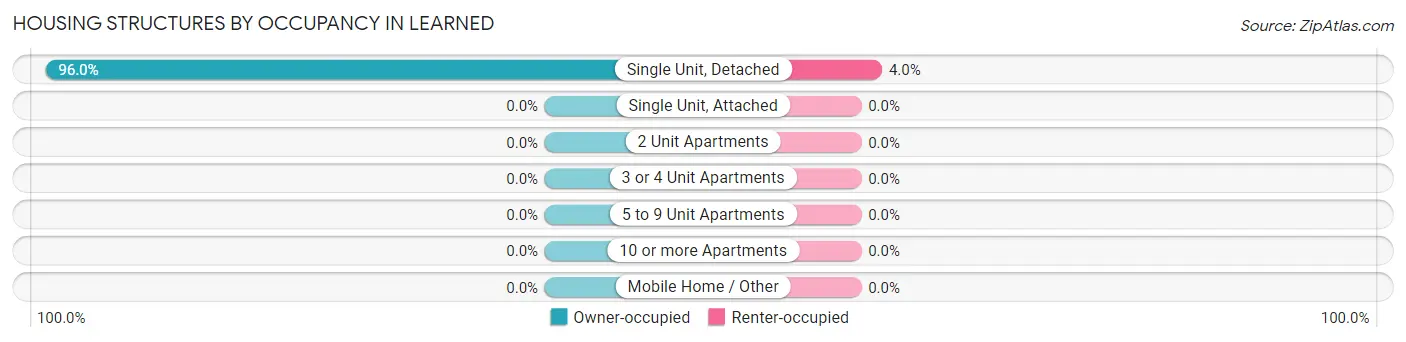
| Structure Type | Owner-occupied | Renter-occupied |
| Single Unit, Detached | 24 (96.0%) | 1 (4.0%) |
| Single Unit, Attached | 0 (0.0%) | 0 (0.0%) |
| 2 Unit Apartments | 0 (0.0%) | 0 (0.0%) |
| 3 or 4 Unit Apartments | 0 (0.0%) | 0 (0.0%) |
| 5 to 9 Unit Apartments | 0 (0.0%) | 0 (0.0%) |
| 10 or more Apartments | 0 (0.0%) | 0 (0.0%) |
| Mobile Home / Other | 0 (0.0%) | 0 (0.0%) |
| Total | 24 (96.0%) | 1 (4.0%) |
Housing Structures by Number of Rooms in Learned
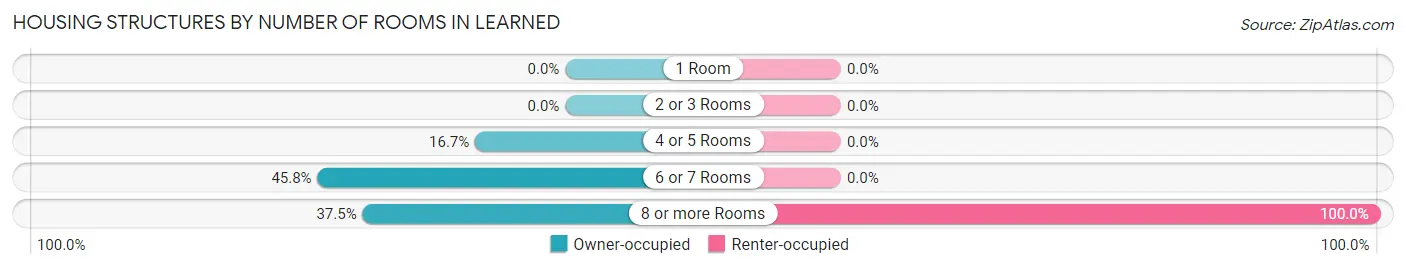
| Number of Rooms | Owner-occupied | Renter-occupied |
| 1 Room | 0 (0.0%) | 0 (0.0%) |
| 2 or 3 Rooms | 0 (0.0%) | 0 (0.0%) |
| 4 or 5 Rooms | 4 (16.7%) | 0 (0.0%) |
| 6 or 7 Rooms | 11 (45.8%) | 0 (0.0%) |
| 8 or more Rooms | 9 (37.5%) | 1 (100.0%) |
| Total | 24 (100.0%) | 1 (100.0%) |
Housing Structure by Heating Type in Learned
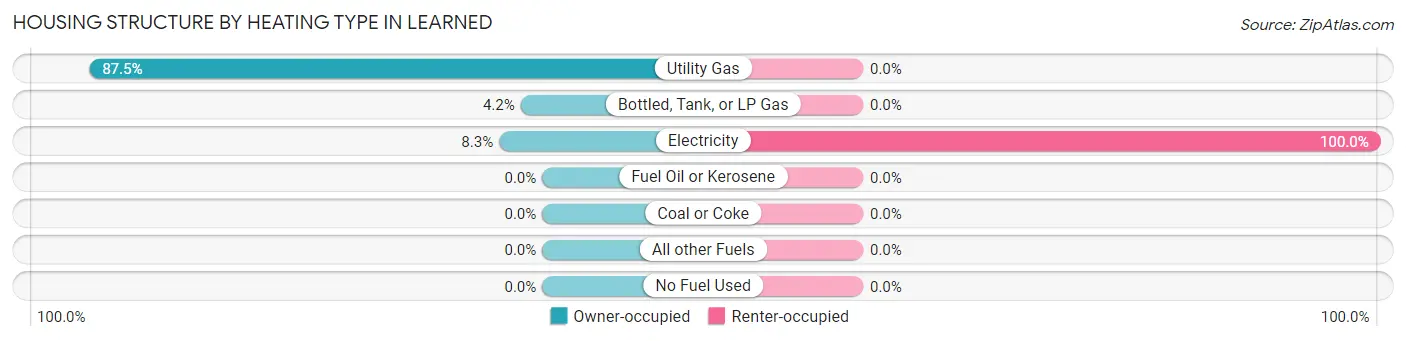
| Heating Type | Owner-occupied | Renter-occupied |
| Utility Gas | 21 (87.5%) | 0 (0.0%) |
| Bottled, Tank, or LP Gas | 1 (4.2%) | 0 (0.0%) |
| Electricity | 2 (8.3%) | 1 (100.0%) |
| Fuel Oil or Kerosene | 0 (0.0%) | 0 (0.0%) |
| Coal or Coke | 0 (0.0%) | 0 (0.0%) |
| All other Fuels | 0 (0.0%) | 0 (0.0%) |
| No Fuel Used | 0 (0.0%) | 0 (0.0%) |
| Total | 24 (100.0%) | 1 (100.0%) |
Household Vehicle Usage in Learned
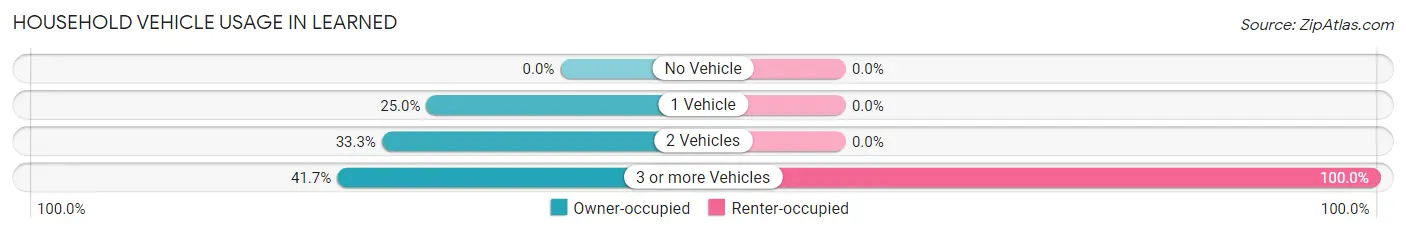
| Vehicles per Household | Owner-occupied | Renter-occupied |
| No Vehicle | 0 (0.0%) | 0 (0.0%) |
| 1 Vehicle | 6 (25.0%) | 0 (0.0%) |
| 2 Vehicles | 8 (33.3%) | 0 (0.0%) |
| 3 or more Vehicles | 10 (41.7%) | 1 (100.0%) |
| Total | 24 (100.0%) | 1 (100.0%) |
Real Estate & Mortgages in Learned
Real Estate and Mortgage Overview in Learned
| Characteristic | Without Mortgage | With Mortgage |
| Housing Units | 17 | 7 |
| Median Property Value | $162,500 | $215,000 |
| Median Household Income | $54,375 | $0 |
| Monthly Housing Costs | $392 | $0 |
| Real Estate Taxes | $225 | $3 |
Property Value by Mortgage Status in Learned
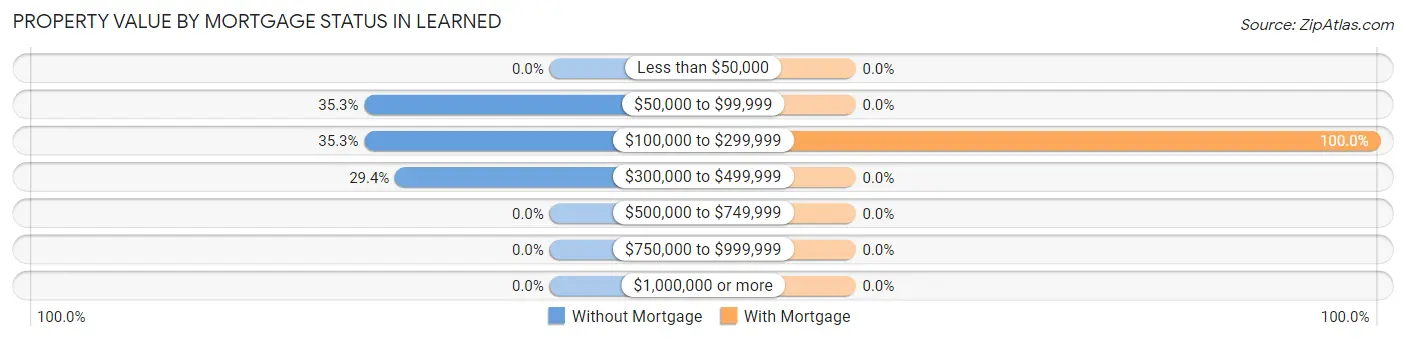
| Property Value | Without Mortgage | With Mortgage |
| Less than $50,000 | 0 (0.0%) | 0 (0.0%) |
| $50,000 to $99,999 | 6 (35.3%) | 0 (0.0%) |
| $100,000 to $299,999 | 6 (35.3%) | 7 (100.0%) |
| $300,000 to $499,999 | 5 (29.4%) | 0 (0.0%) |
| $500,000 to $749,999 | 0 (0.0%) | 0 (0.0%) |
| $750,000 to $999,999 | 0 (0.0%) | 0 (0.0%) |
| $1,000,000 or more | 0 (0.0%) | 0 (0.0%) |
| Total | 17 (100.0%) | 7 (100.0%) |
Household Income by Mortgage Status in Learned
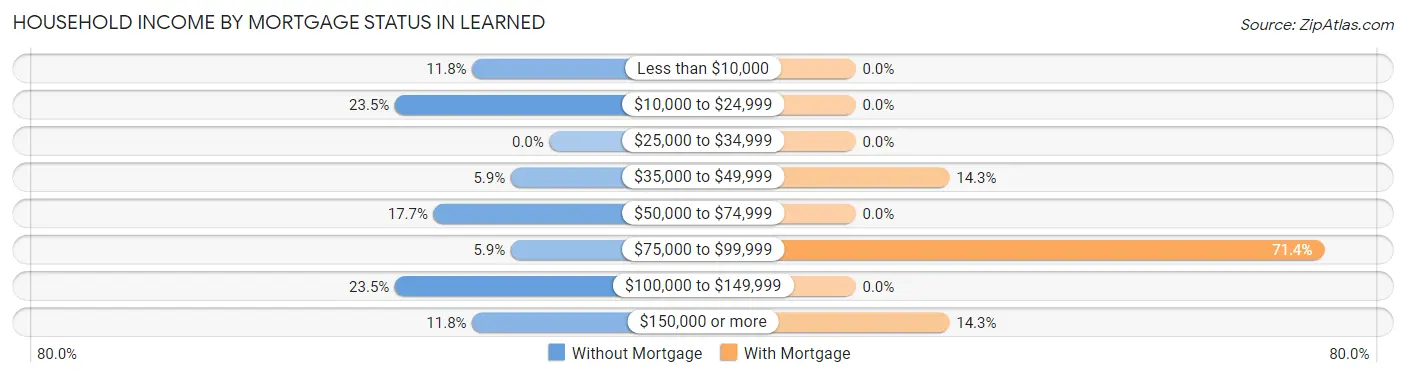
| Household Income | Without Mortgage | With Mortgage |
| Less than $10,000 | 2 (11.8%) | 0 (0.0%) |
| $10,000 to $24,999 | 4 (23.5%) | 0 (0.0%) |
| $25,000 to $34,999 | 0 (0.0%) | 0 (0.0%) |
| $35,000 to $49,999 | 1 (5.9%) | 1 (14.3%) |
| $50,000 to $74,999 | 3 (17.6%) | 0 (0.0%) |
| $75,000 to $99,999 | 1 (5.9%) | 5 (71.4%) |
| $100,000 to $149,999 | 4 (23.5%) | 0 (0.0%) |
| $150,000 or more | 2 (11.8%) | 1 (14.3%) |
| Total | 17 (100.0%) | 7 (100.0%) |
Property Value to Household Income Ratio in Learned
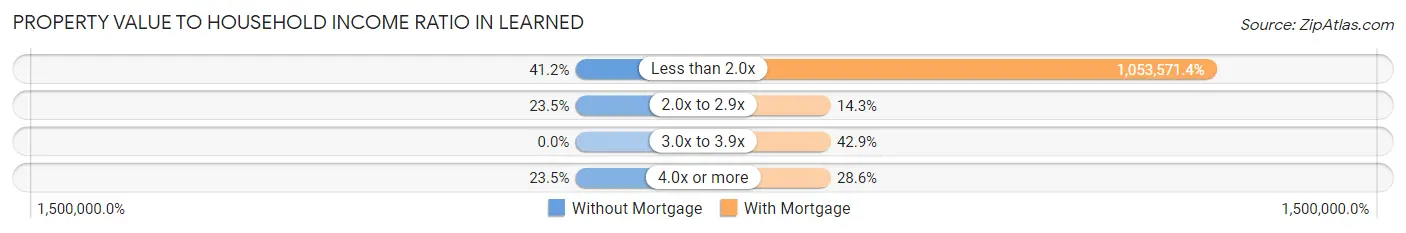
| Value-to-Income Ratio | Without Mortgage | With Mortgage |
| Less than 2.0x | 7 (41.2%) | 73,750 (1,053,571.4%) |
| 2.0x to 2.9x | 4 (23.5%) | 1 (14.3%) |
| 3.0x to 3.9x | 0 (0.0%) | 3 (42.9%) |
| 4.0x or more | 4 (23.5%) | 2 (28.6%) |
| Total | 17 (100.0%) | 7 (100.0%) |
Real Estate Taxes by Mortgage Status in Learned
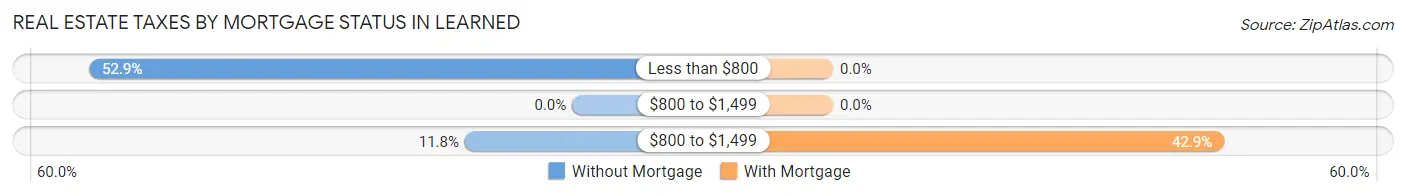
| Property Taxes | Without Mortgage | With Mortgage |
| Less than $800 | 9 (52.9%) | 0 (0.0%) |
| $800 to $1,499 | 0 (0.0%) | 0 (0.0%) |
| $800 to $1,499 | 2 (11.8%) | 3 (42.9%) |
| Total | 17 (100.0%) | 7 (100.0%) |
Health & Disability in Learned
Health Insurance Coverage by Age in Learned
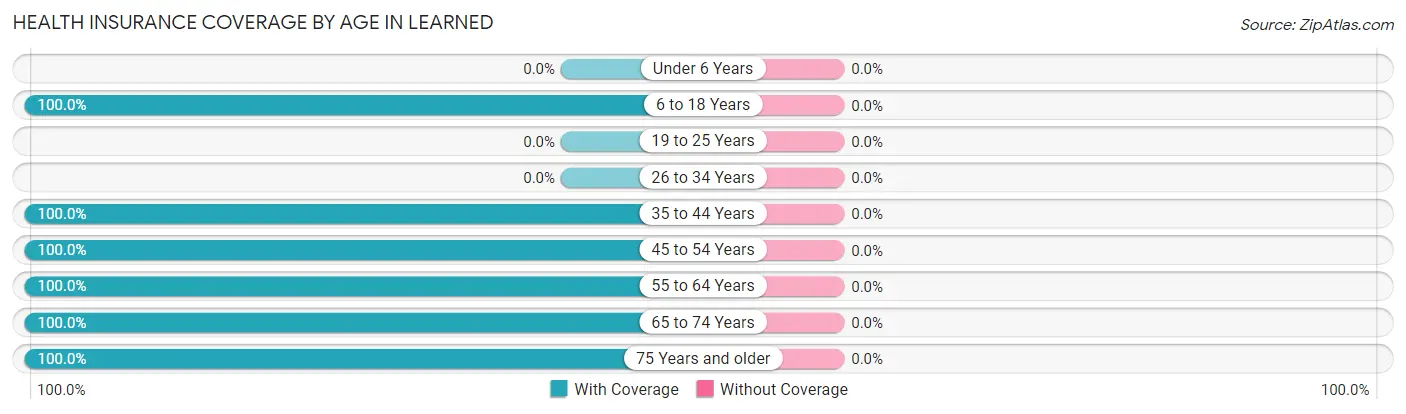
| Age Bracket | With Coverage | Without Coverage |
| Under 6 Years | 0 (0.0%) | 0 (0.0%) |
| 6 to 18 Years | 7 (100.0%) | 0 (0.0%) |
| 19 to 25 Years | 0 (0.0%) | 0 (0.0%) |
| 26 to 34 Years | 0 (0.0%) | 0 (0.0%) |
| 35 to 44 Years | 6 (100.0%) | 0 (0.0%) |
| 45 to 54 Years | 6 (100.0%) | 0 (0.0%) |
| 55 to 64 Years | 1 (100.0%) | 0 (0.0%) |
| 65 to 74 Years | 17 (100.0%) | 0 (0.0%) |
| 75 Years and older | 14 (100.0%) | 0 (0.0%) |
| Total | 51 (100.0%) | 0 (0.0%) |
Health Insurance Coverage by Citizenship Status in Learned
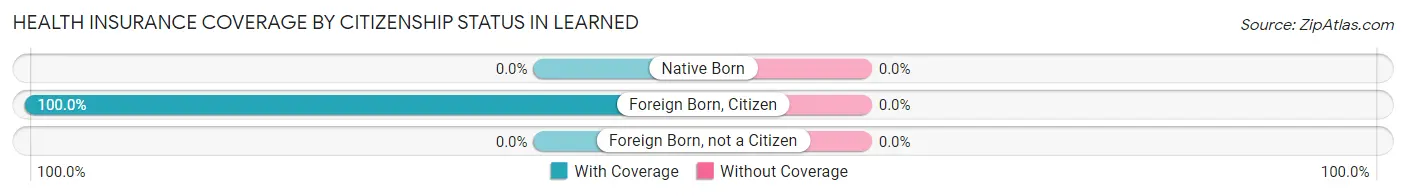
| Citizenship Status | With Coverage | Without Coverage |
| Native Born | 0 (0.0%) | 0 (0.0%) |
| Foreign Born, Citizen | 7 (100.0%) | 0 (0.0%) |
| Foreign Born, not a Citizen | 0 (0.0%) | 0 (0.0%) |
Health Insurance Coverage by Household Income in Learned
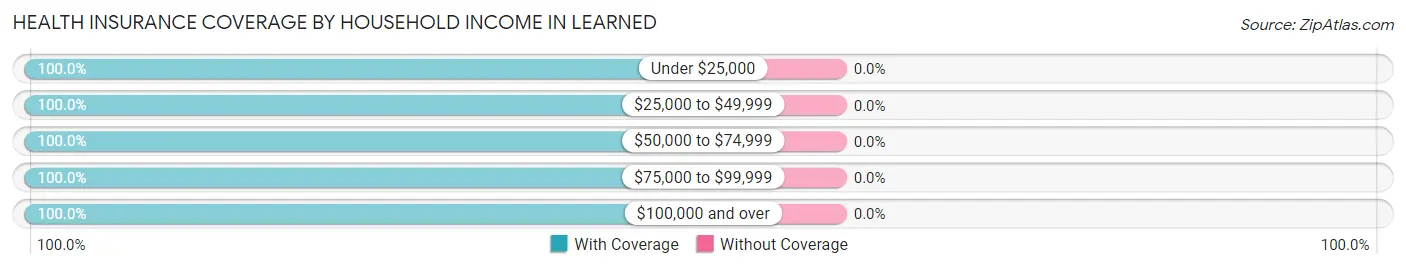
| Household Income | With Coverage | Without Coverage |
| Under $25,000 | 6 (100.0%) | 0 (0.0%) |
| $25,000 to $49,999 | 3 (100.0%) | 0 (0.0%) |
| $50,000 to $74,999 | 18 (100.0%) | 0 (0.0%) |
| $75,000 to $99,999 | 6 (100.0%) | 0 (0.0%) |
| $100,000 and over | 18 (100.0%) | 0 (0.0%) |
Public vs Private Health Insurance Coverage by Age in Learned
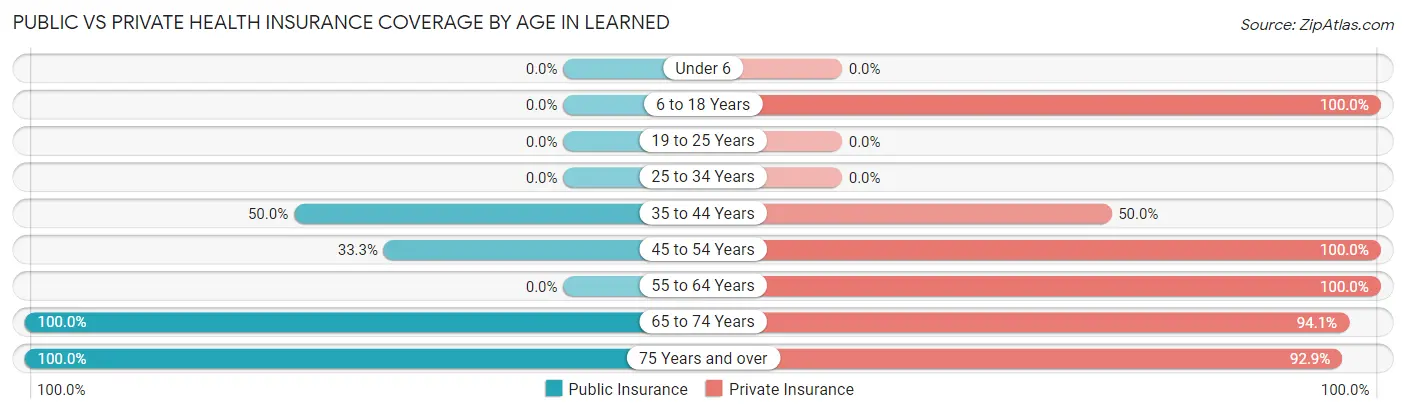
| Age Bracket | Public Insurance | Private Insurance |
| Under 6 | 0 (0.0%) | 0 (0.0%) |
| 6 to 18 Years | 0 (0.0%) | 7 (100.0%) |
| 19 to 25 Years | 0 (0.0%) | 0 (0.0%) |
| 25 to 34 Years | 0 (0.0%) | 0 (0.0%) |
| 35 to 44 Years | 3 (50.0%) | 3 (50.0%) |
| 45 to 54 Years | 2 (33.3%) | 6 (100.0%) |
| 55 to 64 Years | 0 (0.0%) | 1 (100.0%) |
| 65 to 74 Years | 17 (100.0%) | 16 (94.1%) |
| 75 Years and over | 14 (100.0%) | 13 (92.9%) |
| Total | 36 (70.6%) | 46 (90.2%) |
Disability Status by Sex by Age in Learned
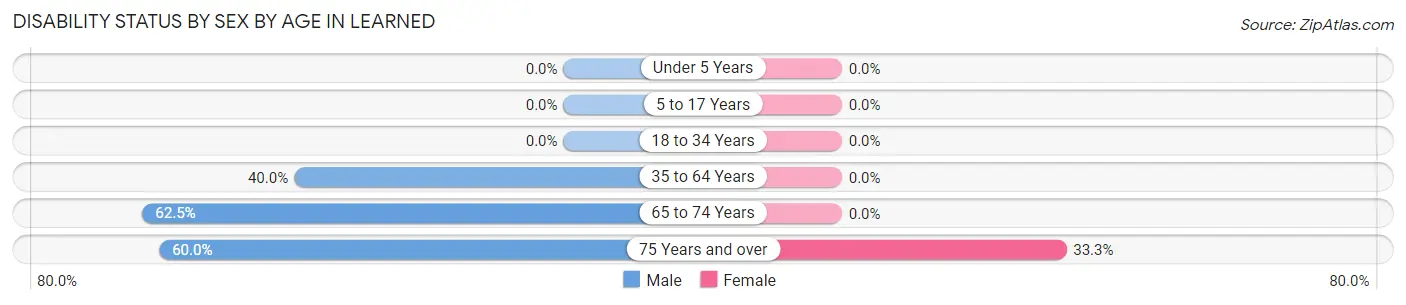
| Age Bracket | Male | Female |
| Under 5 Years | 0 (0.0%) | 0 (0.0%) |
| 5 to 17 Years | 0 (0.0%) | 0 (0.0%) |
| 18 to 34 Years | 0 (0.0%) | 0 (0.0%) |
| 35 to 64 Years | 4 (40.0%) | 0 (0.0%) |
| 65 to 74 Years | 5 (62.5%) | 0 (0.0%) |
| 75 Years and over | 3 (60.0%) | 3 (33.3%) |
Disability Class by Sex by Age in Learned
Disability Class: Hearing Difficulty
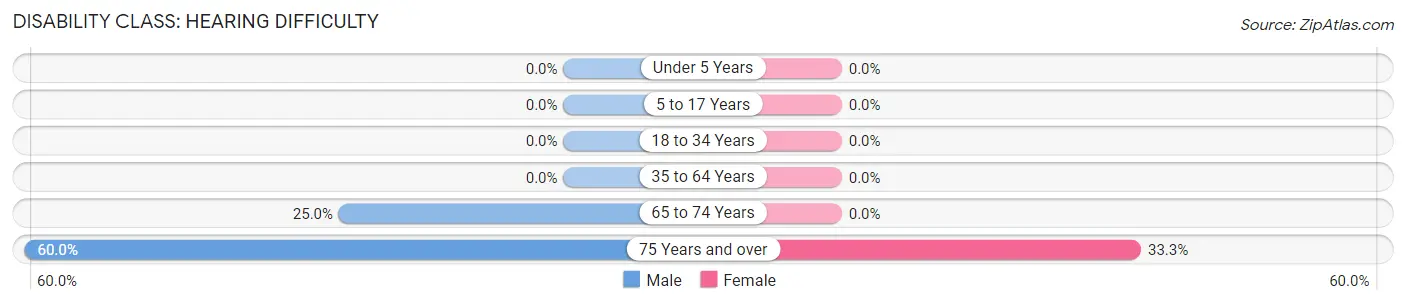
| Age Bracket | Male | Female |
| Under 5 Years | 0 (0.0%) | 0 (0.0%) |
| 5 to 17 Years | 0 (0.0%) | 0 (0.0%) |
| 18 to 34 Years | 0 (0.0%) | 0 (0.0%) |
| 35 to 64 Years | 0 (0.0%) | 0 (0.0%) |
| 65 to 74 Years | 2 (25.0%) | 0 (0.0%) |
| 75 Years and over | 3 (60.0%) | 3 (33.3%) |
Disability Class: Vision Difficulty
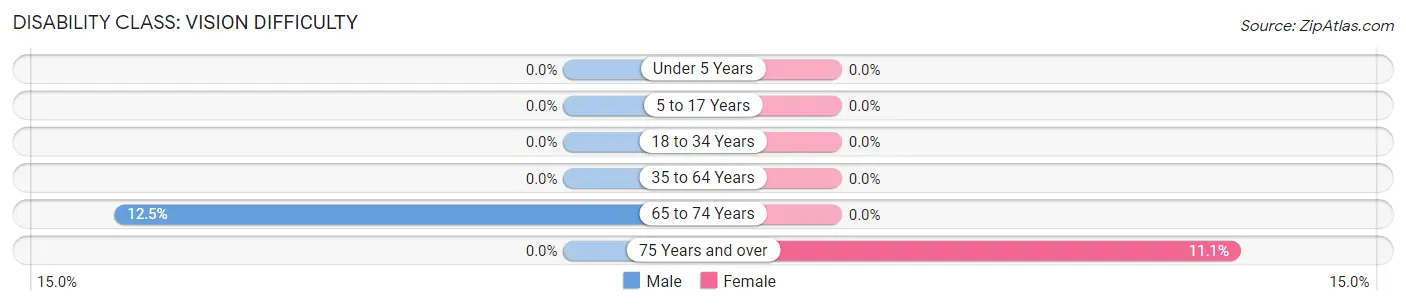
| Age Bracket | Male | Female |
| Under 5 Years | 0 (0.0%) | 0 (0.0%) |
| 5 to 17 Years | 0 (0.0%) | 0 (0.0%) |
| 18 to 34 Years | 0 (0.0%) | 0 (0.0%) |
| 35 to 64 Years | 0 (0.0%) | 0 (0.0%) |
| 65 to 74 Years | 1 (12.5%) | 0 (0.0%) |
| 75 Years and over | 0 (0.0%) | 1 (11.1%) |
Disability Class: Cognitive Difficulty
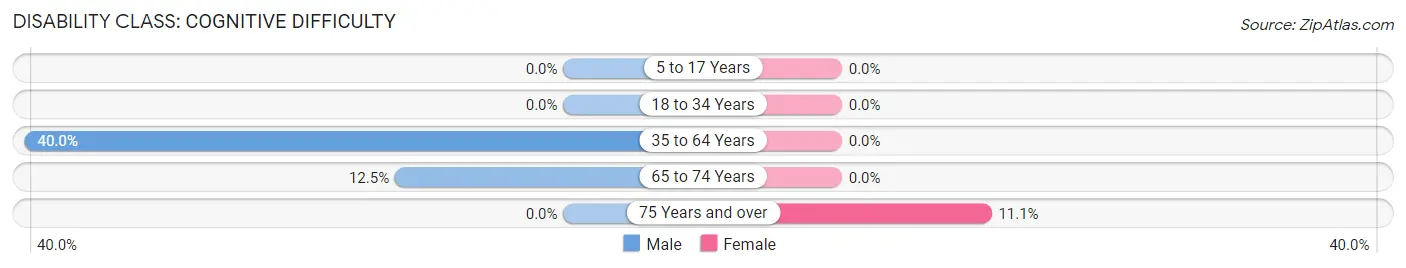
| Age Bracket | Male | Female |
| 5 to 17 Years | 0 (0.0%) | 0 (0.0%) |
| 18 to 34 Years | 0 (0.0%) | 0 (0.0%) |
| 35 to 64 Years | 4 (40.0%) | 0 (0.0%) |
| 65 to 74 Years | 1 (12.5%) | 0 (0.0%) |
| 75 Years and over | 0 (0.0%) | 1 (11.1%) |
Disability Class: Ambulatory Difficulty
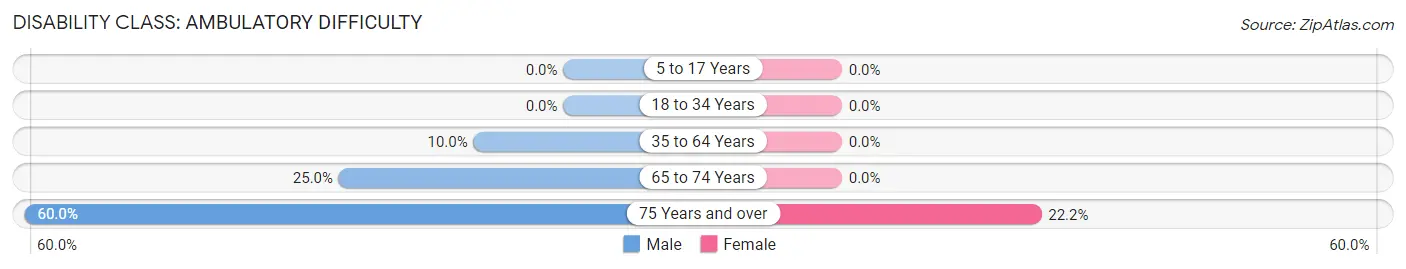
| Age Bracket | Male | Female |
| 5 to 17 Years | 0 (0.0%) | 0 (0.0%) |
| 18 to 34 Years | 0 (0.0%) | 0 (0.0%) |
| 35 to 64 Years | 1 (10.0%) | 0 (0.0%) |
| 65 to 74 Years | 2 (25.0%) | 0 (0.0%) |
| 75 Years and over | 3 (60.0%) | 2 (22.2%) |
Disability Class: Self-Care Difficulty
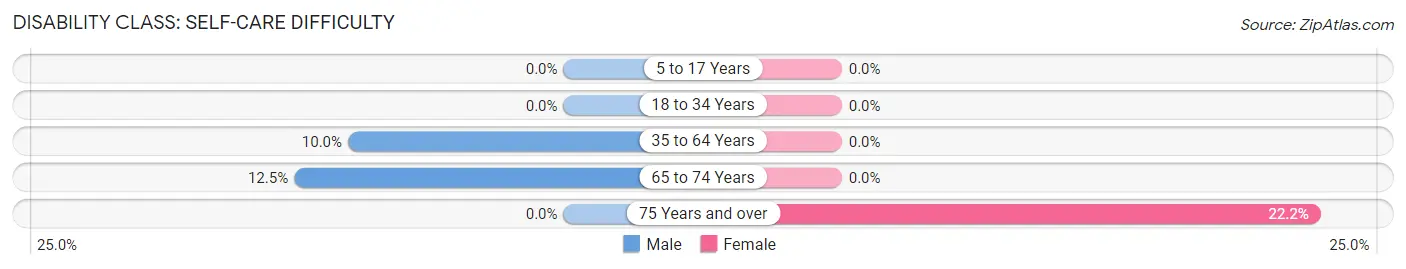
| Age Bracket | Male | Female |
| 5 to 17 Years | 0 (0.0%) | 0 (0.0%) |
| 18 to 34 Years | 0 (0.0%) | 0 (0.0%) |
| 35 to 64 Years | 1 (10.0%) | 0 (0.0%) |
| 65 to 74 Years | 1 (12.5%) | 0 (0.0%) |
| 75 Years and over | 0 (0.0%) | 2 (22.2%) |
Technology Access in Learned
Computing Device Access in Learned
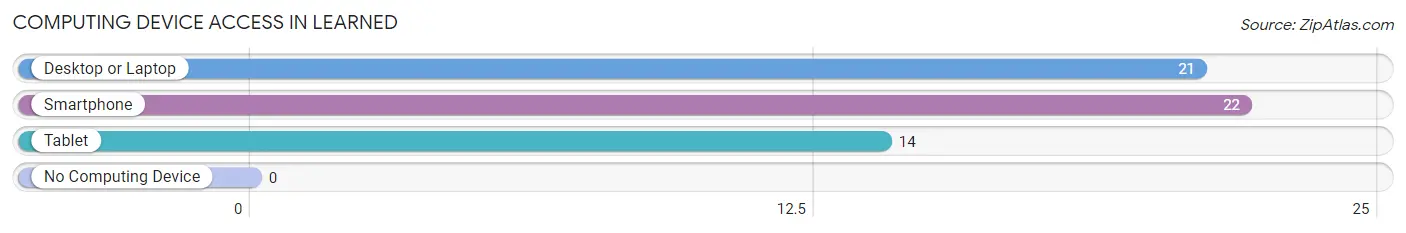
| Device Type | # Households | % Households |
| Desktop or Laptop | 21 | 84.0% |
| Smartphone | 22 | 88.0% |
| Tablet | 14 | 56.0% |
| No Computing Device | 0 | 0.0% |
| Total | 25 | 100.0% |
Internet Access in Learned
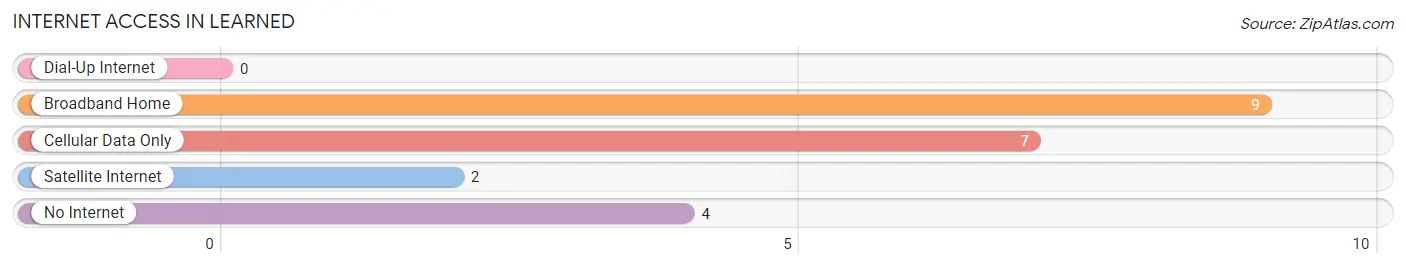
| Internet Type | # Households | % Households |
| Dial-Up Internet | 0 | 0.0% |
| Broadband Home | 9 | 36.0% |
| Cellular Data Only | 7 | 28.0% |
| Satellite Internet | 2 | 8.0% |
| No Internet | 4 | 16.0% |
| Total | 25 | 100.0% |
Learned Summary
History
Mississippi is a state located in the southeastern region of the United States. It is bordered by Tennessee to the north, Alabama to the east, the Gulf of Mexico to the south, and Louisiana and Arkansas to the west. Mississippi has a rich and varied history, beginning with its Native American inhabitants and continuing through its colonial period, statehood, and the Civil War.
The first inhabitants of Mississippi were Native American tribes, including the Choctaw, Chickasaw, and Natchez. These tribes were largely nomadic, living off the land and trading with other tribes. The first Europeans to explore the area were the Spanish, who arrived in the early 16th century. The French soon followed, establishing settlements along the Mississippi River.
In 1798, Mississippi became the 20th state to join the Union. During the early 19th century, Mississippi was a slave state, and cotton was the primary crop. The state was a major contributor to the Confederacy during the Civil War, and many battles were fought in the state. After the war, Mississippi was the first state to ratify the 13th Amendment, which abolished slavery.
In the late 19th century, Mississippi was a major center of the Jim Crow laws, which enforced racial segregation. This period was marked by violence and discrimination against African Americans. In the 1950s and 1960s, the civil rights movement gained momentum in Mississippi, and the state was the site of several major civil rights protests.
Geography
Mississippi is located in the southeastern United States, bordered by Tennessee to the north, Alabama to the east, the Gulf of Mexico to the south, and Louisiana and Arkansas to the west. The state is divided into three distinct geographic regions: the Gulf Coastal Plain, the Piedmont Plateau, and the Mississippi Alluvial Plain.
The Gulf Coastal Plain is located along the Gulf of Mexico and is characterized by flat, low-lying land. The Piedmont Plateau is located in the northern part of the state and is characterized by rolling hills and valleys. The Mississippi Alluvial Plain is located in the western part of the state and is characterized by flat, fertile land.
The state is home to several major rivers, including the Mississippi, the Yazoo, and the Pearl. The Mississippi River forms the western border of the state and is the second-longest river in the United States. The state is also home to several major lakes, including Ross Barnett Reservoir, Sardis Lake, and Grenada Lake.
Economy
Mississippi’s economy is largely based on agriculture, manufacturing, and tourism. The state is a major producer of cotton, soybeans, corn, and rice. It is also a major producer of timber, and the state is home to several major lumber mills.
Manufacturing is also an important part of the state’s economy. Mississippi is home to several major automotive plants, as well as steel mills, chemical plants, and food processing plants. The state is also home to several major military bases, which provide a significant boost to the economy.
Tourism is also an important part of the state’s economy. Mississippi is home to several major tourist attractions, including the Gulf Coast beaches, the Natchez Trace Parkway, and the Mississippi Delta. The state is also home to several major casinos, which attract visitors from all over the world.
Demographics
As of 2020, Mississippi had an estimated population of 2,976,149. The state is predominantly white, with African Americans making up 38.3% of the population. Other racial groups include Hispanics (3.7%), Asians (1.2%), and Native Americans (0.7%).
The median household income in Mississippi is $45,744, and the median home value is $128,400. The state has a poverty rate of 19.2%, and the unemployment rate is 5.2%. The largest cities in the state are Jackson, Gulfport, and Hattiesburg.
Common Questions
What is Per Capita Income in Learned?
Per Capita income in Learned is $36,725.
What is the Median Family Income in Learned?
Median Family Income in Learned is $76,250.
What is the Median Household income in Learned?
Median Household Income in Learned is $73,250.
What is Inequality or Gini Index in Learned?
Inequality or Gini Index in Learned is 0.37.
What is the Total Population of Learned?
Total Population of Learned is 51.
What is the Total Male Population of Learned?
Total Male Population of Learned is 30.
What is the Total Female Population of Learned?
Total Female Population of Learned is 21.
What is the Ratio of Males per 100 Females in Learned?
There are 142.86 Males per 100 Females in Learned.
What is the Ratio of Females per 100 Males in Learned?
There are 70.00 Females per 100 Males in Learned.
What is the Median Population Age in Learned?
Median Population Age in Learned is 68.5 Years.
What is the Average Family Size in Learned
Average Family Size in Learned is 2.4 People.
What is the Average Household Size in Learned
Average Household Size in Learned is 2.0 People.
How Large is the Labor Force in Learned?
There are 11 People in the Labor Forcein in Learned.
What is the Percentage of People in the Labor Force in Learned?
23.9% of People are in the Labor Force in Learned.
What is the Unemployment Rate in Learned?
Unemployment Rate in Learned is 18.2%.