Marion, MS Map & Demographics
Marion Map
Marion Overview
$25,751
PER CAPITA INCOME
$65,272
AVG FAMILY INCOME
$61,328
AVG HOUSEHOLD INCOME
61.8%
WAGE / INCOME GAP [ % ]
38.2¢/ $1
WAGE / INCOME GAP [ $ ]
0.48
INEQUALITY / GINI INDEX
2,257
TOTAL POPULATION
989
MALE POPULATION
1,268
FEMALE POPULATION
78.00
MALES / 100 FEMALES
128.21
FEMALES / 100 MALES
27.5
MEDIAN AGE
3.7
AVG FAMILY SIZE
3.1
AVG HOUSEHOLD SIZE
894
LABOR FORCE [ PEOPLE ]
59.8%
PERCENT IN LABOR FORCE
5.7%
UNEMPLOYMENT RATE
Marion Zip Codes
Income in Marion
Income Overview in Marion
Per Capita Income in Marion is $25,751, while median incomes of families and households are $65,272 and $61,328 respectively.
| Characteristic | Number | Measure |
| Per Capita Income | 2,257 | $25,751 |
| Median Family Income | 543 | $65,272 |
| Mean Family Income | 543 | $84,768 |
| Median Household Income | 732 | $61,328 |
| Mean Household Income | 732 | $73,629 |
| Income Deficit | 543 | $0 |
| Wage / Income Gap (%) | 2,257 | 61.83% |
| Wage / Income Gap ($) | 2,257 | 38.17¢ per $1 |
| Gini / Inequality Index | 2,257 | 0.48 |
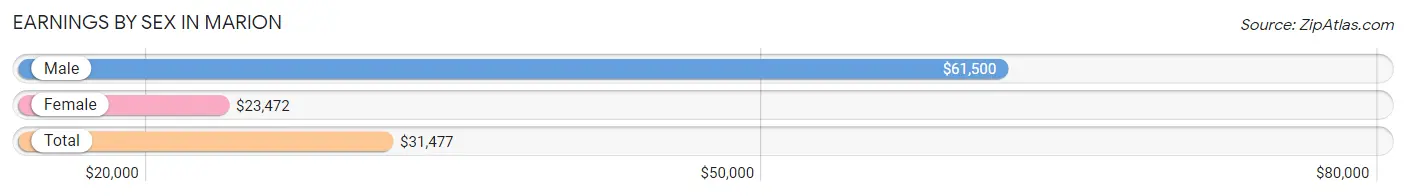
Earnings by Sex in Marion
Average Earnings in Marion are $31,477, $61,500 for men and $23,472 for women, a difference of 61.8%.
| Sex | Number | Average Earnings |
| Male | 306 (33.3%) | $61,500 |
| Female | 613 (66.7%) | $23,472 |
| Total | 919 (100.0%) | $31,477 |
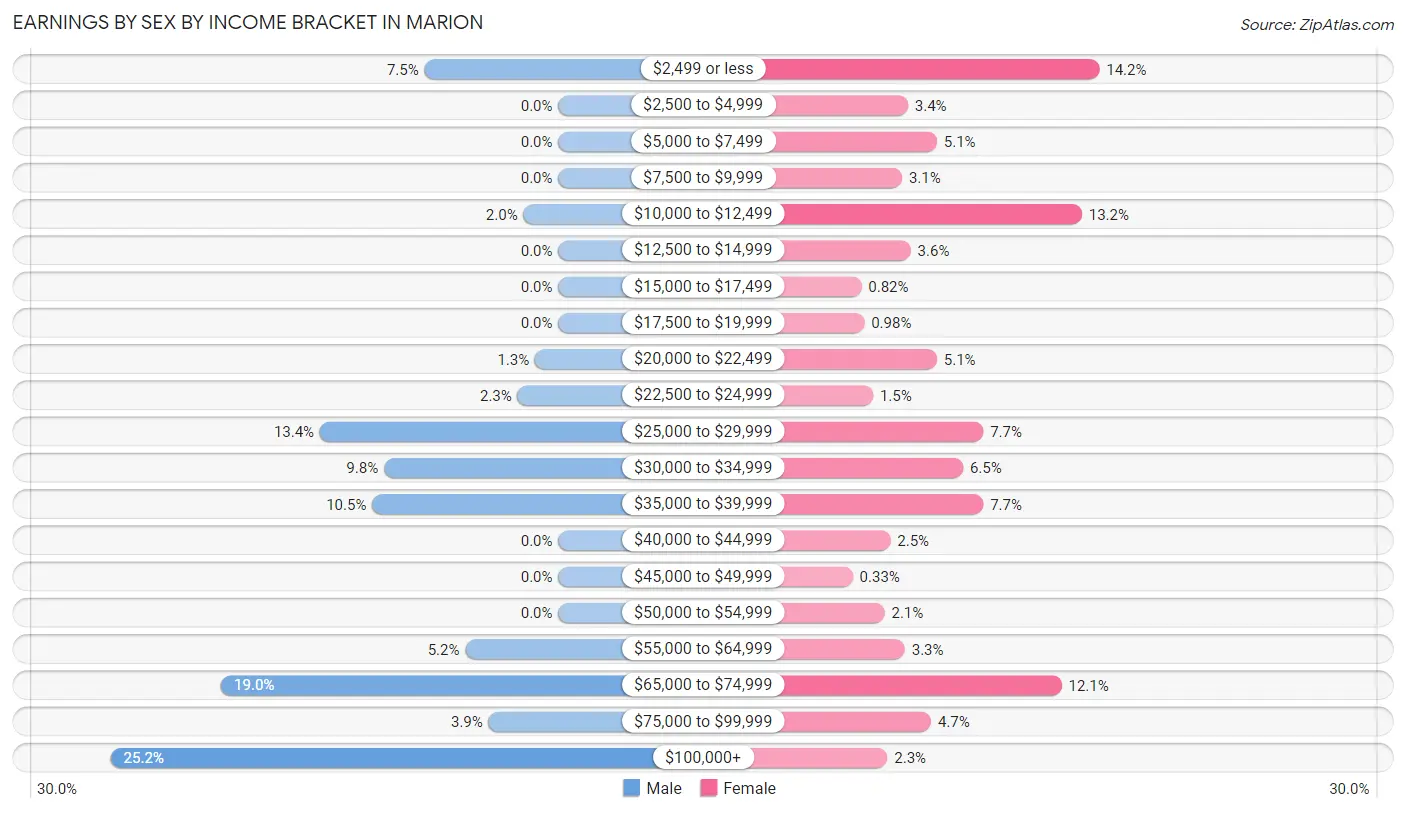
Earnings by Sex by Income Bracket in Marion
The most common earnings brackets in Marion are $100,000+ for men (77 | 25.2%) and $2,499 or less for women (87 | 14.2%).
| Income | Male | Female |
| $2,499 or less | 23 (7.5%) | 87 (14.2%) |
| $2,500 to $4,999 | 0 (0.0%) | 21 (3.4%) |
| $5,000 to $7,499 | 0 (0.0%) | 31 (5.1%) |
| $7,500 to $9,999 | 0 (0.0%) | 19 (3.1%) |
| $10,000 to $12,499 | 6 (2.0%) | 81 (13.2%) |
| $12,500 to $14,999 | 0 (0.0%) | 22 (3.6%) |
| $15,000 to $17,499 | 0 (0.0%) | 5 (0.8%) |
| $17,500 to $19,999 | 0 (0.0%) | 6 (1.0%) |
| $20,000 to $22,499 | 4 (1.3%) | 31 (5.1%) |
| $22,500 to $24,999 | 7 (2.3%) | 9 (1.5%) |
| $25,000 to $29,999 | 41 (13.4%) | 47 (7.7%) |
| $30,000 to $34,999 | 30 (9.8%) | 40 (6.5%) |
| $35,000 to $39,999 | 32 (10.5%) | 47 (7.7%) |
| $40,000 to $44,999 | 0 (0.0%) | 15 (2.5%) |
| $45,000 to $49,999 | 0 (0.0%) | 2 (0.3%) |
| $50,000 to $54,999 | 0 (0.0%) | 13 (2.1%) |
| $55,000 to $64,999 | 16 (5.2%) | 20 (3.3%) |
| $65,000 to $74,999 | 58 (19.0%) | 74 (12.1%) |
| $75,000 to $99,999 | 12 (3.9%) | 29 (4.7%) |
| $100,000+ | 77 (25.2%) | 14 (2.3%) |
| Total | 306 (100.0%) | 613 (100.0%) |
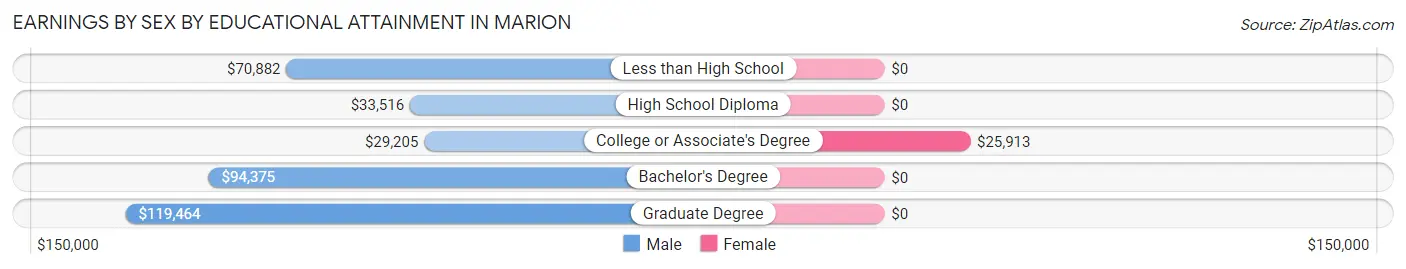
Earnings by Sex by Educational Attainment in Marion
Average earnings in Marion are $62,000 for men and $26,941 for women, a difference of 56.6%. Men with an educational attainment of graduate degree enjoy the highest average annual earnings of $119,464, while those with college or associate's degree education earn the least with $29,205. Women with an educational attainment of college or associate's degree earn the most with the average annual earnings of $25,913, while those with college or associate's degree education have the smallest earnings of $25,913.
| Educational Attainment | Male Income | Female Income |
| Less than High School | $70,882 | $0 |
| High School Diploma | $33,516 | $0 |
| College or Associate's Degree | $29,205 | $25,913 |
| Bachelor's Degree | $94,375 | $0 |
| Graduate Degree | $119,464 | $0 |
| Total | $62,000 | $26,941 |
Family Income in Marion
Family Income Brackets in Marion
According to the Marion family income data, there are 175 families falling into the $50,000 to $74,999 income range, which is the most common income bracket and makes up 32.2% of all families. Conversely, the less than $10,000 income bracket is the least frequent group with only 2 families (0.4%) belonging to this category.
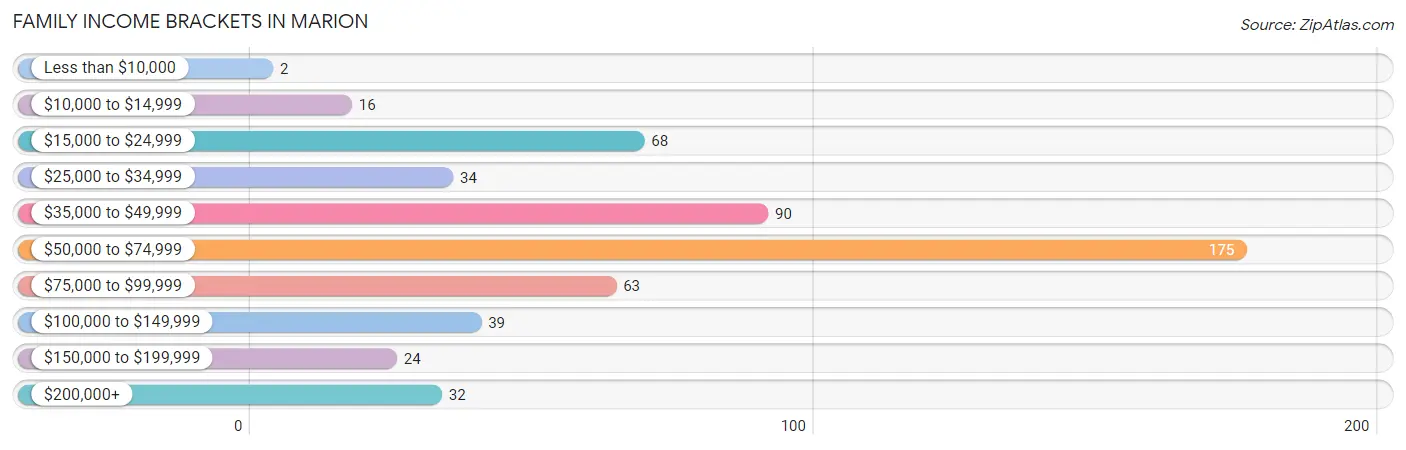
| Income Bracket | # Families | % Families |
| Less than $10,000 | 2 | 0.4% |
| $10,000 to $14,999 | 16 | 2.9% |
| $15,000 to $24,999 | 68 | 12.5% |
| $25,000 to $34,999 | 34 | 6.3% |
| $35,000 to $49,999 | 90 | 16.6% |
| $50,000 to $74,999 | 175 | 32.2% |
| $75,000 to $99,999 | 63 | 11.6% |
| $100,000 to $149,999 | 39 | 7.2% |
| $150,000 to $199,999 | 24 | 4.4% |
| $200,000+ | 32 | 5.9% |
Family Income by Famaliy Size in Marion
4-person families (170 | 31.3%) account for the highest median family income in Marion with $68,711 per family, while 2-person families (216 | 39.8%) have the highest median income of $31,340 per family member.
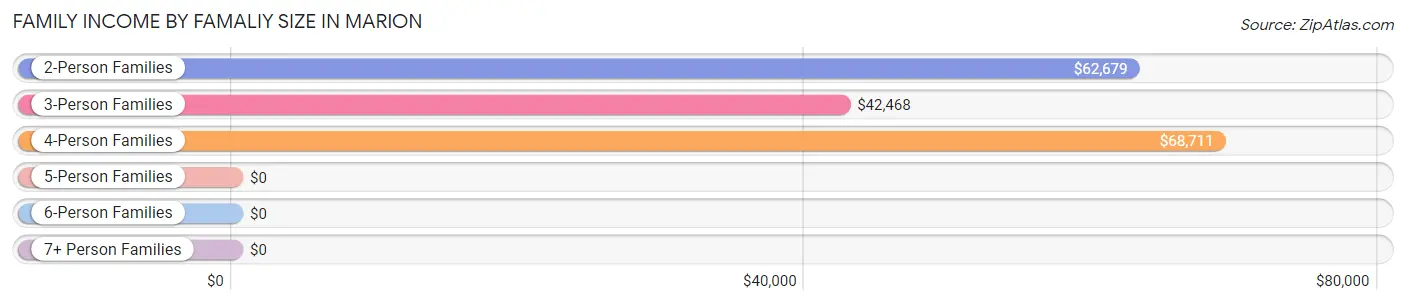
| Income Bracket | # Families | Median Income |
| 2-Person Families | 216 (39.8%) | $62,679 |
| 3-Person Families | 101 (18.6%) | $42,468 |
| 4-Person Families | 170 (31.3%) | $68,711 |
| 5-Person Families | 38 (7.0%) | $0 |
| 6-Person Families | 18 (3.3%) | $0 |
| 7+ Person Families | 0 (0.0%) | $0 |
| Total | 543 (100.0%) | $65,272 |
Family Income by Number of Earners in Marion
The median family income in Marion is $65,272, with families comprising 1 earner (225) having the highest median family income of $67,520, while families with no earners (81) have the lowest median family income of $44,125, accounting for 41.4% and 14.9% of families, respectively.
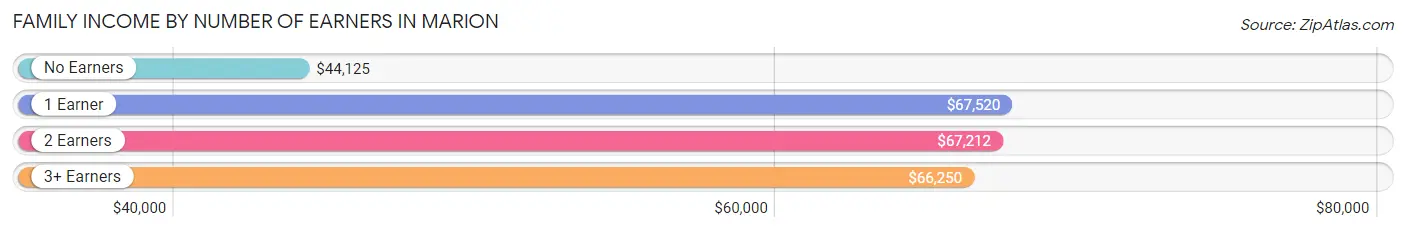
| Number of Earners | # Families | Median Income |
| No Earners | 81 (14.9%) | $44,125 |
| 1 Earner | 225 (41.4%) | $67,520 |
| 2 Earners | 193 (35.5%) | $67,212 |
| 3+ Earners | 44 (8.1%) | $66,250 |
| Total | 543 (100.0%) | $65,272 |
Household Income in Marion
Household Income Brackets in Marion
With 185 households falling in the category, the $50,000 to $74,999 income range is the most frequent in Marion, accounting for 25.3% of all households. In contrast, only 24 households (3.3%) fall into the $150,000 to $199,999 income bracket, making it the least populous group.
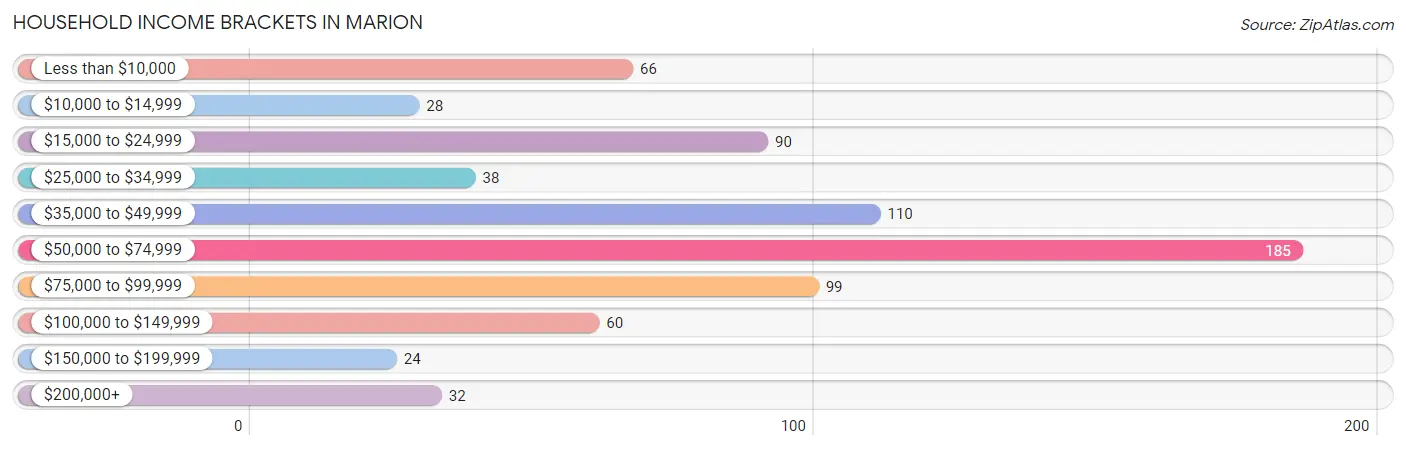
| Income Bracket | # Households | % Households |
| Less than $10,000 | 66 | 9.0% |
| $10,000 to $14,999 | 28 | 3.8% |
| $15,000 to $24,999 | 90 | 12.3% |
| $25,000 to $34,999 | 38 | 5.2% |
| $35,000 to $49,999 | 110 | 15.0% |
| $50,000 to $74,999 | 185 | 25.3% |
| $75,000 to $99,999 | 99 | 13.5% |
| $100,000 to $149,999 | 60 | 8.2% |
| $150,000 to $199,999 | 24 | 3.3% |
| $200,000+ | 32 | 4.4% |
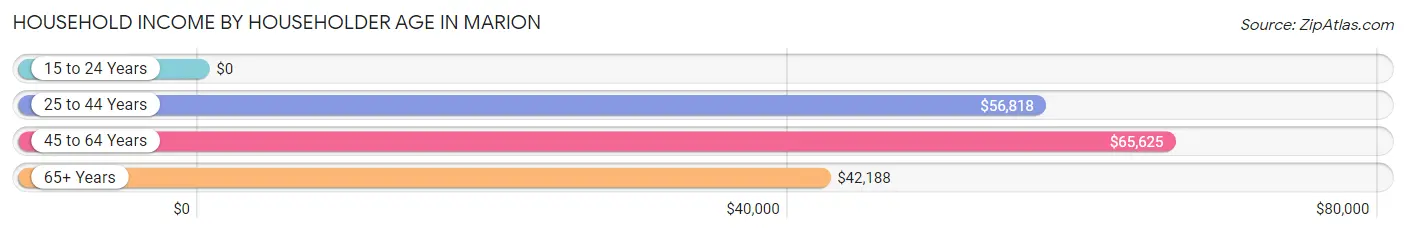
Household Income by Householder Age in Marion
The median household income in Marion is $61,328, with the highest median household income of $65,625 found in the 45 to 64 years age bracket for the primary householder. A total of 299 households (40.8%) fall into this category.
| Income Bracket | # Households | Median Income |
| 15 to 24 Years | 0 (0.0%) | $0 |
| 25 to 44 Years | 264 (36.1%) | $56,818 |
| 45 to 64 Years | 299 (40.8%) | $65,625 |
| 65+ Years | 169 (23.1%) | $42,188 |
| Total | 732 (100.0%) | $61,328 |
Poverty in Marion
Income Below Poverty by Sex and Age in Marion
With 20.3% poverty level for males and 22.3% for females among the residents of Marion, under 5 year old males and 15 year old females are the most vulnerable to poverty, with 16 males (66.7%) and 19 females (79.2%) in their respective age groups living below the poverty level.
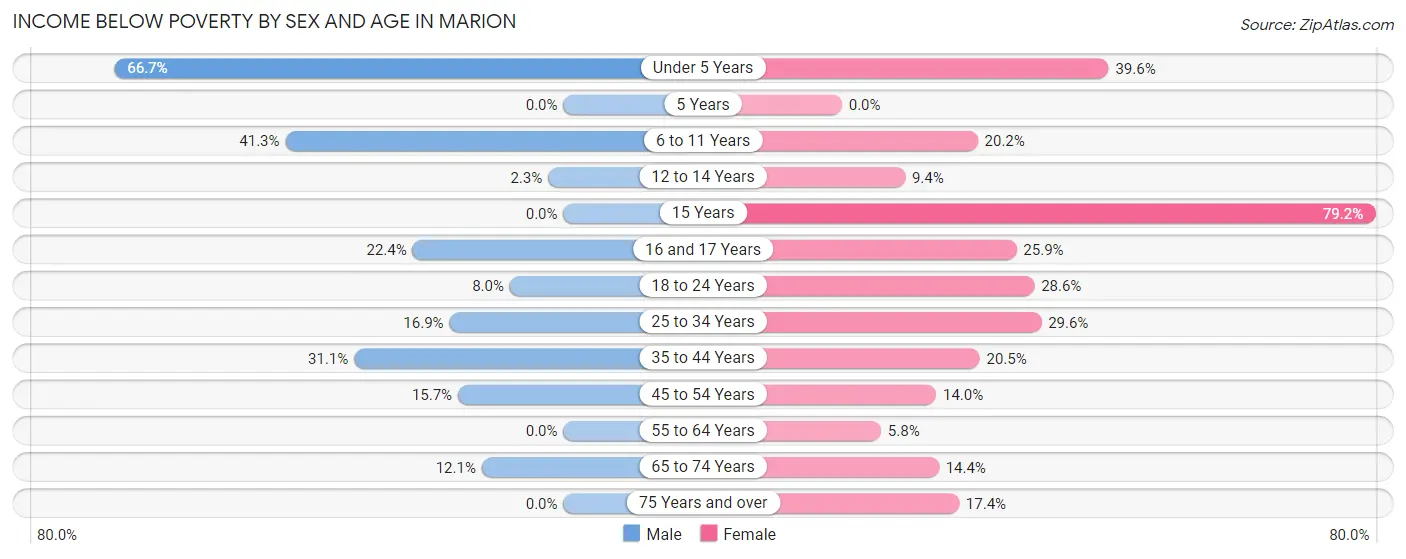
| Age Bracket | Male | Female |
| Under 5 Years | 16 (66.7%) | 40 (39.6%) |
| 5 Years | 0 (0.0%) | 0 (0.0%) |
| 6 to 11 Years | 90 (41.3%) | 47 (20.2%) |
| 12 to 14 Years | 2 (2.3%) | 3 (9.4%) |
| 15 Years | 0 (0.0%) | 19 (79.2%) |
| 16 and 17 Years | 15 (22.4%) | 7 (25.9%) |
| 18 to 24 Years | 7 (8.0%) | 24 (28.6%) |
| 25 to 34 Years | 11 (16.9%) | 53 (29.6%) |
| 35 to 44 Years | 32 (31.1%) | 36 (20.4%) |
| 45 to 54 Years | 18 (15.7%) | 21 (14.0%) |
| 55 to 64 Years | 0 (0.0%) | 5 (5.8%) |
| 65 to 74 Years | 8 (12.1%) | 19 (14.4%) |
| 75 Years and over | 0 (0.0%) | 4 (17.4%) |
| Total | 199 (20.3%) | 278 (22.3%) |
Income Above Poverty by Sex and Age in Marion
According to the poverty statistics in Marion, males aged 5 years and females aged 55 to 64 years are the age groups that are most secure financially, with 100.0% of males and 94.2% of females in these age groups living above the poverty line.
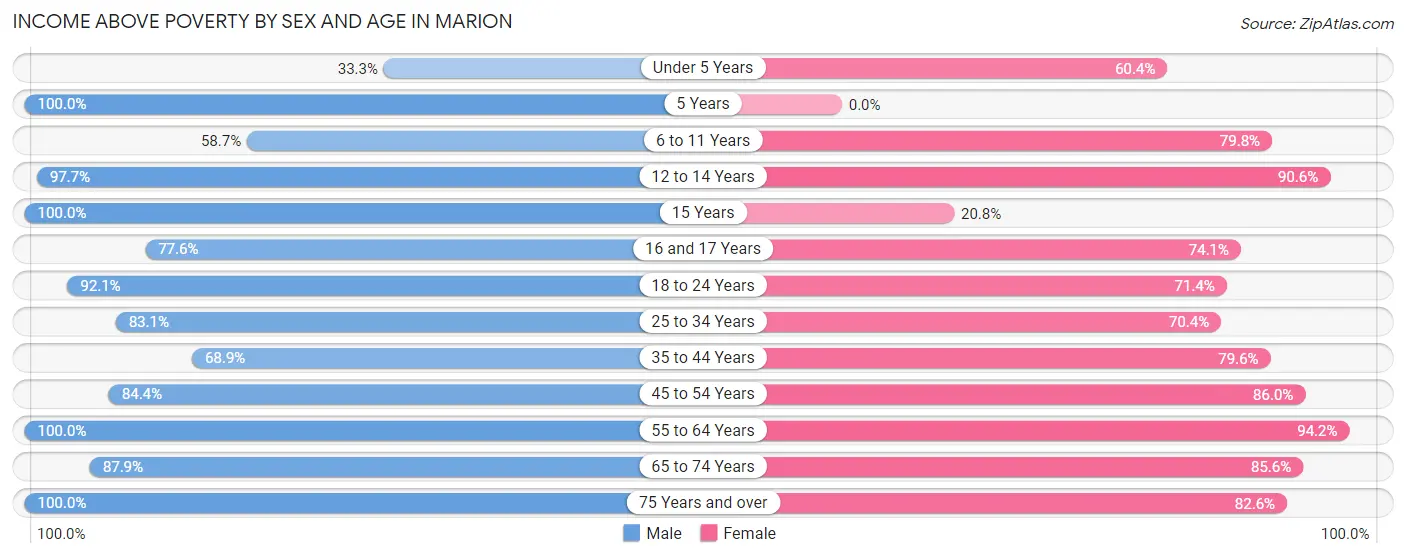
| Age Bracket | Male | Female |
| Under 5 Years | 8 (33.3%) | 61 (60.4%) |
| 5 Years | 9 (100.0%) | 0 (0.0%) |
| 6 to 11 Years | 128 (58.7%) | 186 (79.8%) |
| 12 to 14 Years | 86 (97.7%) | 29 (90.6%) |
| 15 Years | 18 (100.0%) | 5 (20.8%) |
| 16 and 17 Years | 52 (77.6%) | 20 (74.1%) |
| 18 to 24 Years | 81 (92.0%) | 60 (71.4%) |
| 25 to 34 Years | 54 (83.1%) | 126 (70.4%) |
| 35 to 44 Years | 71 (68.9%) | 140 (79.5%) |
| 45 to 54 Years | 97 (84.4%) | 129 (86.0%) |
| 55 to 64 Years | 91 (100.0%) | 81 (94.2%) |
| 65 to 74 Years | 58 (87.9%) | 113 (85.6%) |
| 75 Years and over | 30 (100.0%) | 19 (82.6%) |
| Total | 783 (79.7%) | 969 (77.7%) |
Income Below Poverty Among Married-Couple Families in Marion
The poverty statistics for married-couple families in Marion show that 16.6% or 44 of the total 265 families live below the poverty line. Families with 3 or 4 children have the highest poverty rate of 100.0%, comprising of 21 families. On the other hand, families with 1 or 2 children have the lowest poverty rate of 0.0%, which includes 0 families.
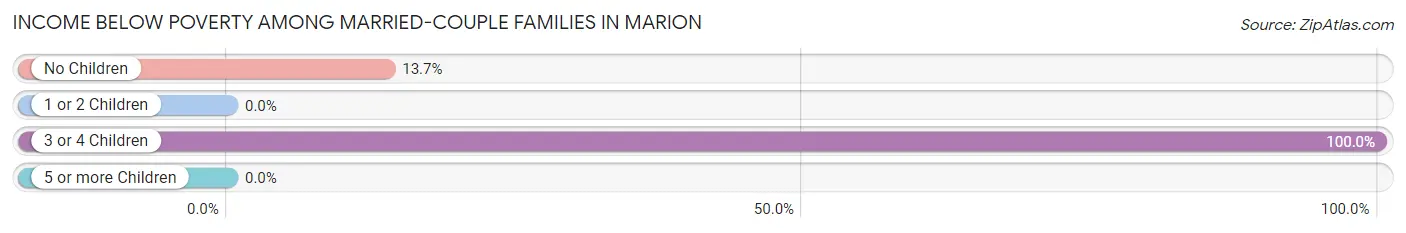
| Children | Above Poverty | Below Poverty |
| No Children | 145 (86.3%) | 23 (13.7%) |
| 1 or 2 Children | 76 (100.0%) | 0 (0.0%) |
| 3 or 4 Children | 0 (0.0%) | 21 (100.0%) |
| 5 or more Children | 0 (0.0%) | 0 (0.0%) |
| Total | 221 (83.4%) | 44 (16.6%) |
Income Below Poverty Among Single-Parent Households in Marion
According to the poverty data in Marion, 22.2% or 6 single-father households and 13.6% or 34 single-mother households are living below the poverty line. Among single-father households, those with 1 or 2 children have the highest poverty rate, with 6 households (100.0%) experiencing poverty. Likewise, among single-mother households, those with 1 or 2 children have the highest poverty rate, with 21 households (22.8%) falling below the poverty line.
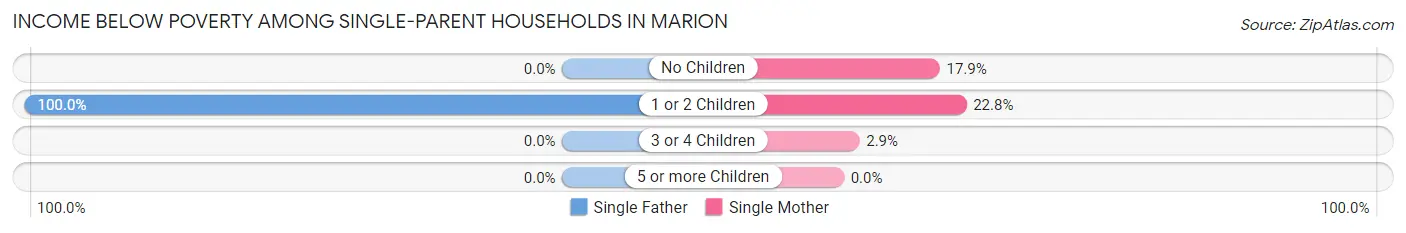
| Children | Single Father | Single Mother |
| No Children | 0 (0.0%) | 10 (17.9%) |
| 1 or 2 Children | 6 (100.0%) | 21 (22.8%) |
| 3 or 4 Children | 0 (0.0%) | 3 (2.9%) |
| 5 or more Children | 0 (0.0%) | 0 (0.0%) |
| Total | 6 (22.2%) | 34 (13.6%) |
Income Below Poverty Among Married-Couple vs Single-Parent Households in Marion
The poverty data for Marion shows that 44 of the married-couple family households (16.6%) and 40 of the single-parent households (14.4%) are living below the poverty level. Within the married-couple family households, those with 3 or 4 children have the highest poverty rate, with 21 households (100.0%) falling below the poverty line. Among the single-parent households, those with 1 or 2 children have the highest poverty rate, with 27 household (27.6%) living below poverty.
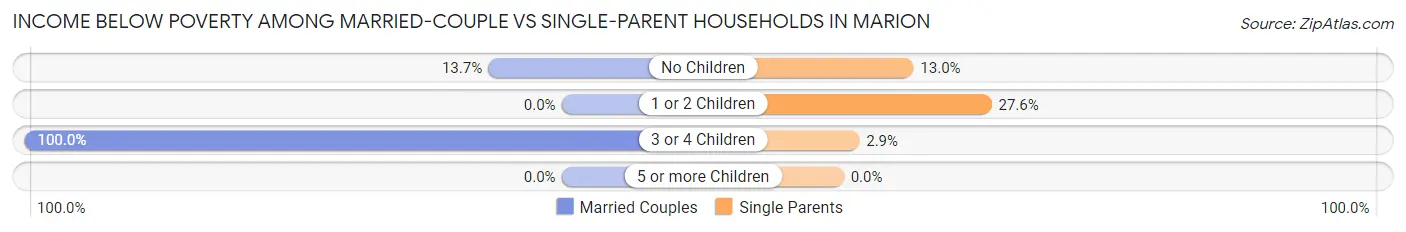
| Children | Married-Couple Families | Single-Parent Households |
| No Children | 23 (13.7%) | 10 (13.0%) |
| 1 or 2 Children | 0 (0.0%) | 27 (27.6%) |
| 3 or 4 Children | 21 (100.0%) | 3 (2.9%) |
| 5 or more Children | 0 (0.0%) | 0 (0.0%) |
| Total | 44 (16.6%) | 40 (14.4%) |
Race in Marion
The most populous races in Marion are Black / African American (1,296 | 57.4%), White / Caucasian (892 | 39.5%), and Hispanic or Latino (285 | 12.6%).
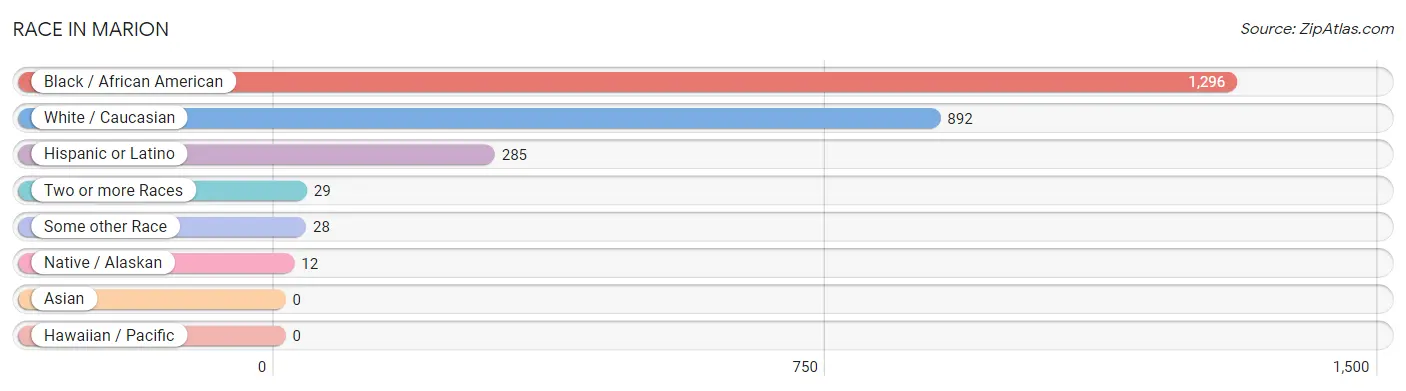
| Race | # Population | % Population |
| Asian | 0 | 0.0% |
| Black / African American | 1,296 | 57.4% |
| Hawaiian / Pacific | 0 | 0.0% |
| Hispanic or Latino | 285 | 12.6% |
| Native / Alaskan | 12 | 0.5% |
| White / Caucasian | 892 | 39.5% |
| Two or more Races | 29 | 1.3% |
| Some other Race | 28 | 1.2% |
| Total | 2,257 | 100.0% |
Ancestry in Marion
The most populous ancestries reported in Marion are Mexican (277 | 12.3%), American (95 | 4.2%), European (75 | 3.3%), Irish (65 | 2.9%), and English (58 | 2.6%), together accounting for 25.3% of all Marion residents.
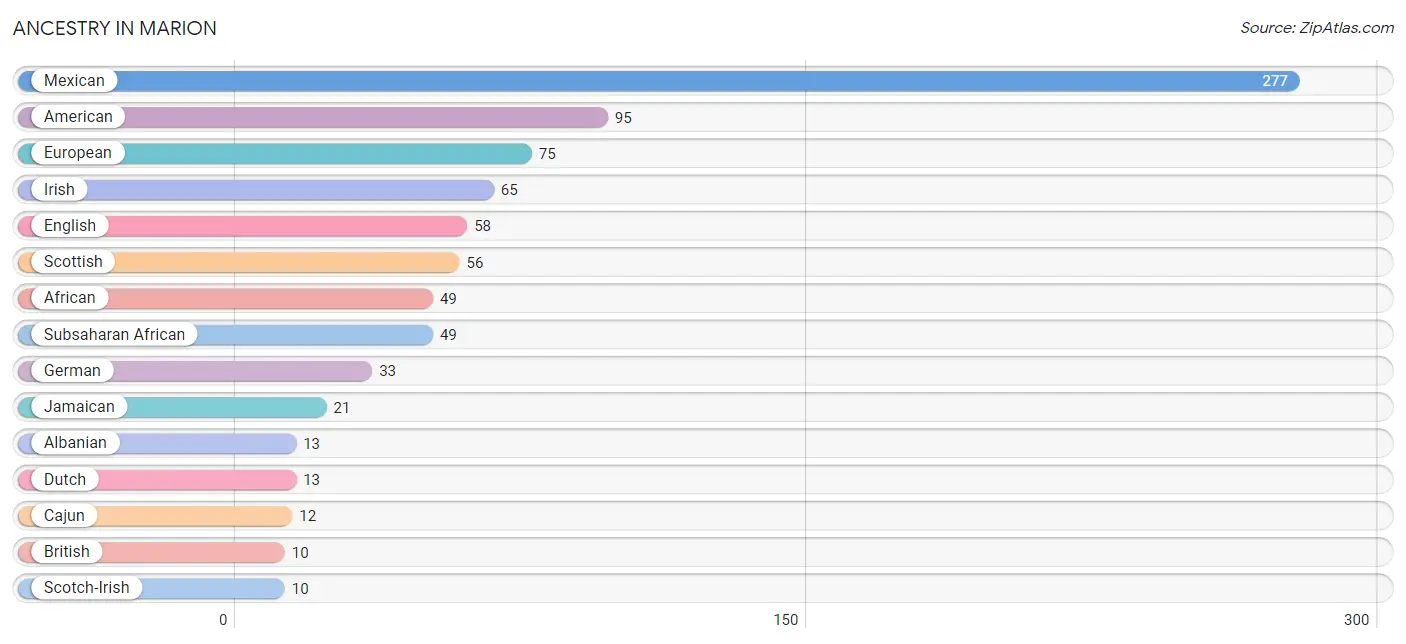
| Ancestry | # Population | % Population |
| African | 49 | 2.2% |
| Albanian | 13 | 0.6% |
| American | 95 | 4.2% |
| Arab | 3 | 0.1% |
| British | 10 | 0.4% |
| Cajun | 12 | 0.5% |
| Dominican | 8 | 0.4% |
| Dutch | 13 | 0.6% |
| English | 58 | 2.6% |
| European | 75 | 3.3% |
| French | 4 | 0.2% |
| German | 33 | 1.5% |
| Greek | 5 | 0.2% |
| Hungarian | 2 | 0.1% |
| Irish | 65 | 2.9% |
| Italian | 6 | 0.3% |
| Jamaican | 21 | 0.9% |
| Mexican | 277 | 12.3% |
| Moroccan | 3 | 0.1% |
| Norwegian | 2 | 0.1% |
| Portuguese | 1 | 0.0% |
| Scotch-Irish | 10 | 0.4% |
| Scottish | 56 | 2.5% |
| Subsaharan African | 49 | 2.2% |
| Swedish | 1 | 0.0% | View All 25 Rows |
Immigrants in Marion
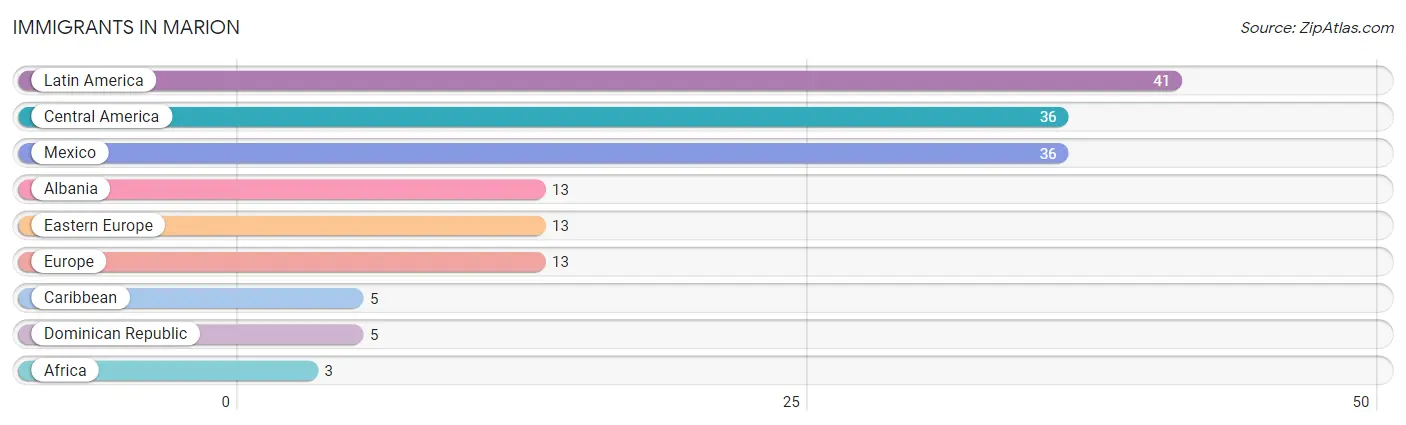
The most numerous immigrant groups reported in Marion came from Latin America (41 | 1.8%), Central America (36 | 1.6%), Mexico (36 | 1.6%), Albania (13 | 0.6%), and Eastern Europe (13 | 0.6%), together accounting for 6.2% of all Marion residents.
| Immigration Origin | # Population | % Population |
| Africa | 3 | 0.1% |
| Albania | 13 | 0.6% |
| Caribbean | 5 | 0.2% |
| Central America | 36 | 1.6% |
| Dominican Republic | 5 | 0.2% |
| Eastern Europe | 13 | 0.6% |
| Europe | 13 | 0.6% |
| Latin America | 41 | 1.8% |
| Mexico | 36 | 1.6% | View All 9 Rows |
Sex and Age in Marion
Sex and Age in Marion
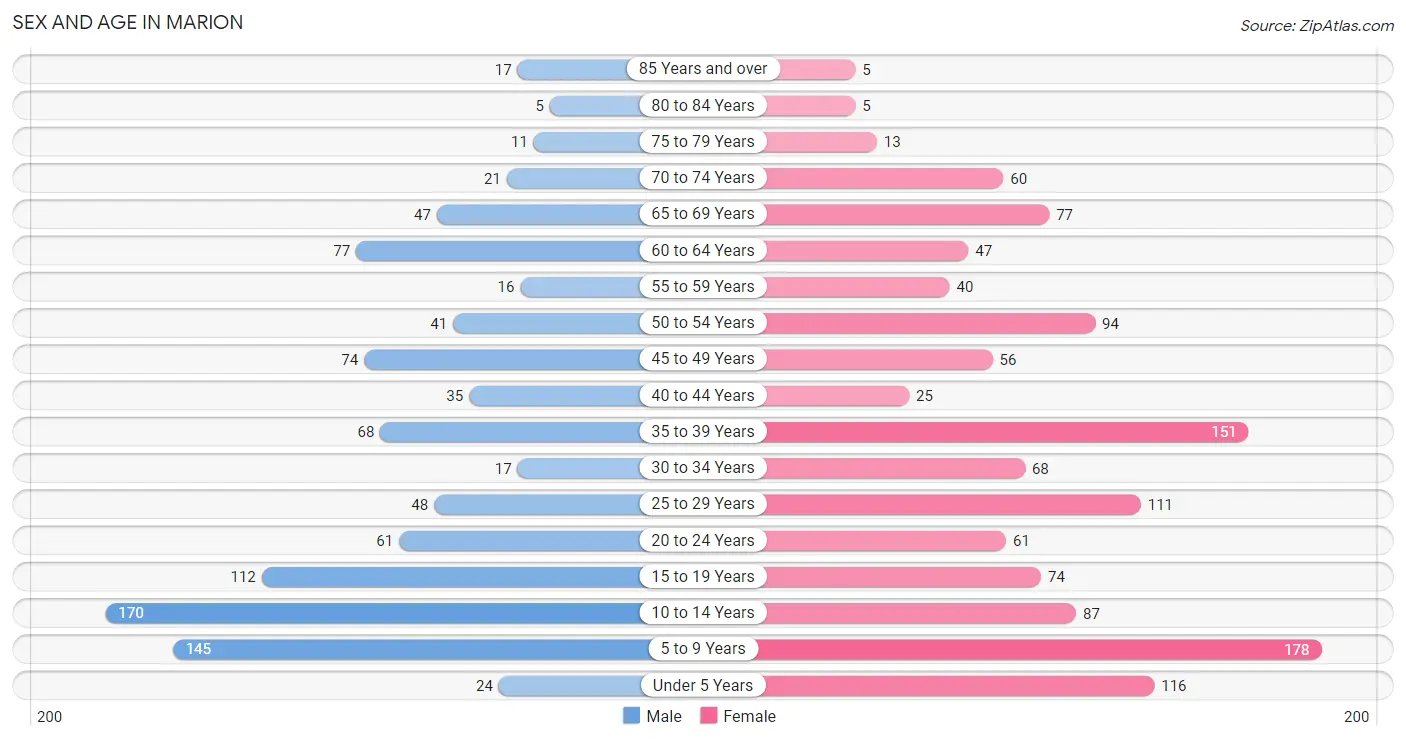
The most populous age groups in Marion are 10 to 14 Years (170 | 17.2%) for men and 5 to 9 Years (178 | 14.0%) for women.
| Age Bracket | Male | Female |
| Under 5 Years | 24 (2.4%) | 116 (9.1%) |
| 5 to 9 Years | 145 (14.7%) | 178 (14.0%) |
| 10 to 14 Years | 170 (17.2%) | 87 (6.9%) |
| 15 to 19 Years | 112 (11.3%) | 74 (5.8%) |
| 20 to 24 Years | 61 (6.2%) | 61 (4.8%) |
| 25 to 29 Years | 48 (4.9%) | 111 (8.7%) |
| 30 to 34 Years | 17 (1.7%) | 68 (5.4%) |
| 35 to 39 Years | 68 (6.9%) | 151 (11.9%) |
| 40 to 44 Years | 35 (3.5%) | 25 (2.0%) |
| 45 to 49 Years | 74 (7.5%) | 56 (4.4%) |
| 50 to 54 Years | 41 (4.2%) | 94 (7.4%) |
| 55 to 59 Years | 16 (1.6%) | 40 (3.2%) |
| 60 to 64 Years | 77 (7.8%) | 47 (3.7%) |
| 65 to 69 Years | 47 (4.8%) | 77 (6.1%) |
| 70 to 74 Years | 21 (2.1%) | 60 (4.7%) |
| 75 to 79 Years | 11 (1.1%) | 13 (1.0%) |
| 80 to 84 Years | 5 (0.5%) | 5 (0.4%) |
| 85 Years and over | 17 (1.7%) | 5 (0.4%) |
| Total | 989 (100.0%) | 1,268 (100.0%) |
Families and Households in Marion
Median Family Size in Marion
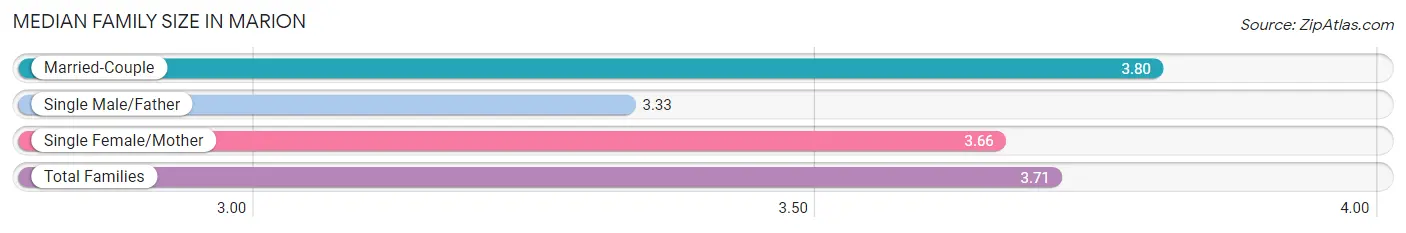
The median family size in Marion is 3.71 persons per family, with married-couple families (265 | 48.8%) accounting for the largest median family size of 3.8 persons per family. On the other hand, single male/father families (27 | 5.0%) represent the smallest median family size with 3.33 persons per family.
| Family Type | # Families | Family Size |
| Married-Couple | 265 (48.8%) | 3.80 |
| Single Male/Father | 27 (5.0%) | 3.33 |
| Single Female/Mother | 251 (46.2%) | 3.66 |
| Total Families | 543 (100.0%) | 3.71 |
Median Household Size in Marion
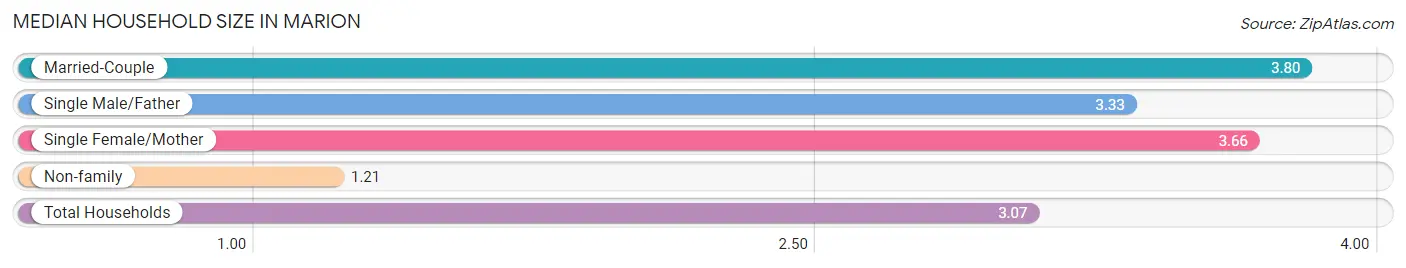
The median household size in Marion is 3.07 persons per household, with married-couple households (265 | 36.2%) accounting for the largest median household size of 3.8 persons per household. non-family households (189 | 25.8%) represent the smallest median household size with 1.21 persons per household.
| Household Type | # Households | Household Size |
| Married-Couple | 265 (36.2%) | 3.80 |
| Single Male/Father | 27 (3.7%) | 3.33 |
| Single Female/Mother | 251 (34.3%) | 3.66 |
| Non-family | 189 (25.8%) | 1.21 |
| Total Households | 732 (100.0%) | 3.07 |
Household Size by Marriage Status in Marion
Out of a total of 732 households in Marion, 543 (74.2%) are family households, while 189 (25.8%) are nonfamily households. The most numerous type of family households are 2-person households, comprising 216, and the most common type of nonfamily households are 1-person households, comprising 150.
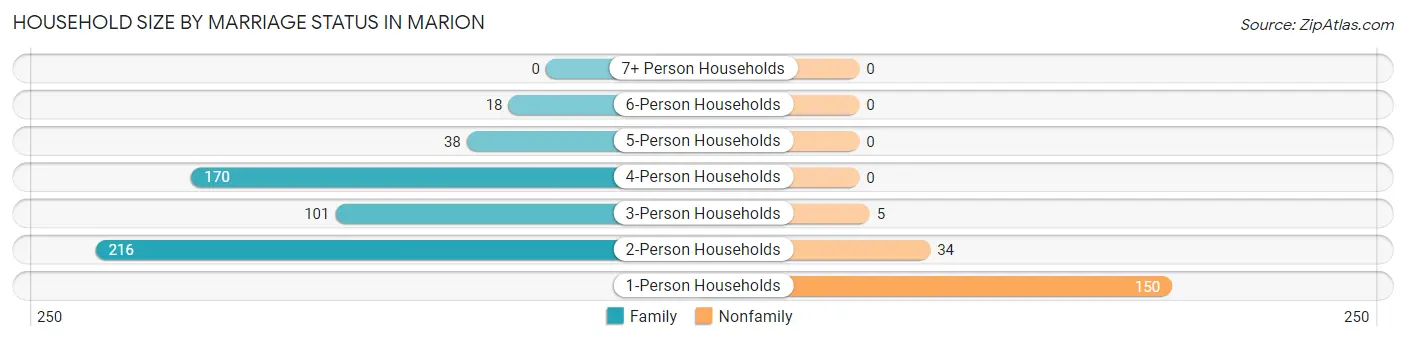
| Household Size | Family Households | Nonfamily Households |
| 1-Person Households | - | 150 (20.5%) |
| 2-Person Households | 216 (29.5%) | 34 (4.6%) |
| 3-Person Households | 101 (13.8%) | 5 (0.7%) |
| 4-Person Households | 170 (23.2%) | 0 (0.0%) |
| 5-Person Households | 38 (5.2%) | 0 (0.0%) |
| 6-Person Households | 18 (2.5%) | 0 (0.0%) |
| 7+ Person Households | 0 (0.0%) | 0 (0.0%) |
| Total | 543 (74.2%) | 189 (25.8%) |
Female Fertility in Marion
Fertility by Age in Marion
Average fertility rate in Marion is 5.0 births per 1,000 women. Women in the age bracket of 20 to 34 years have the highest fertility rate with 13.0 births per 1,000 women. Women in the age bracket of 20 to 34 years acount for 100.0% of all women with births.
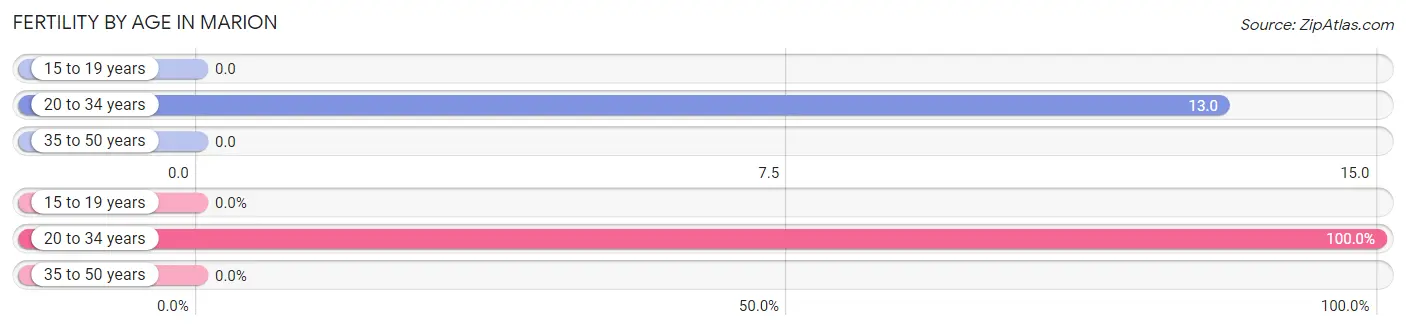
| Age Bracket | Women with Births | Births / 1,000 Women |
| 15 to 19 years | 0 (0.0%) | 0.0 |
| 20 to 34 years | 3 (100.0%) | 13.0 |
| 35 to 50 years | 0 (0.0%) | 0.0 |
| Total | 3 (100.0%) | 5.0 |
Fertility by Age by Marriage Status in Marion
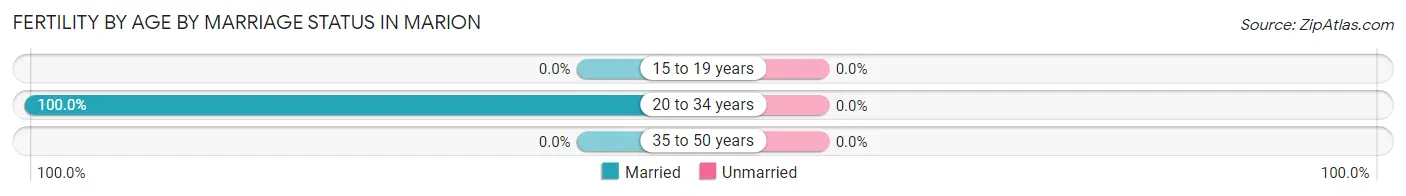
| Age Bracket | Married | Unmarried |
| 15 to 19 years | 0 (0.0%) | 0 (0.0%) |
| 20 to 34 years | 3 (100.0%) | 0 (0.0%) |
| 35 to 50 years | 0 (0.0%) | 0 (0.0%) |
| Total | 3 (100.0%) | 0 (0.0%) |
Fertility by Education in Marion
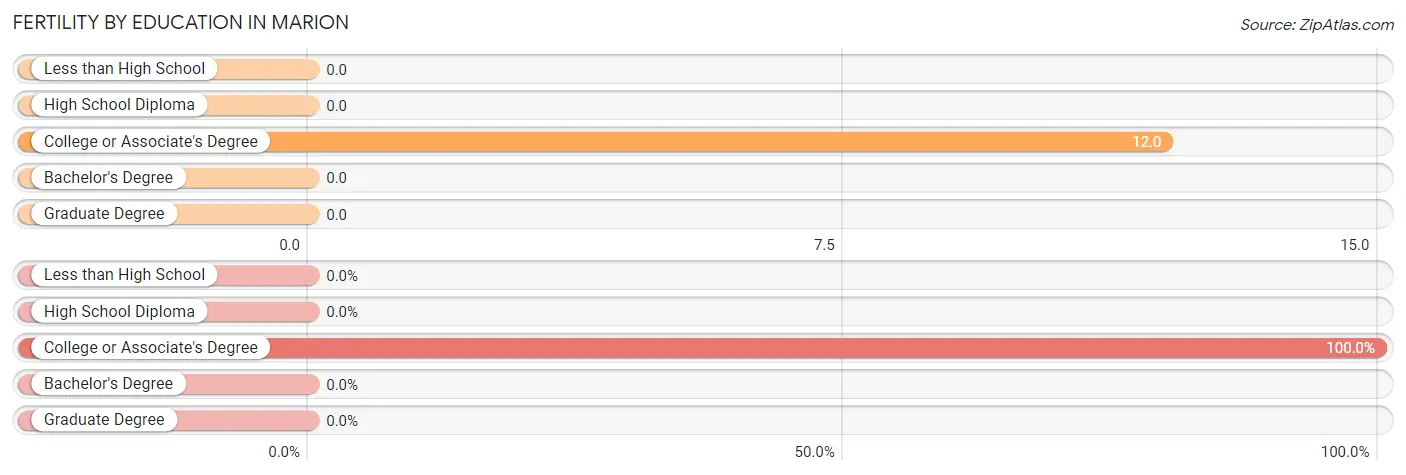
| Educational Attainment | Women with Births | Births / 1,000 Women |
| Less than High School | 0 (0.0%) | 0.0 |
| High School Diploma | 0 (0.0%) | 0.0 |
| College or Associate's Degree | 3 (100.0%) | 12.0 |
| Bachelor's Degree | 0 (0.0%) | 0.0 |
| Graduate Degree | 0 (0.0%) | 0.0 |
| Total | 3 (100.0%) | 5.0 |
Fertility by Education by Marriage Status in Marion
| Educational Attainment | Married | Unmarried |
| Less than High School | 0 (0.0%) | 0 (0.0%) |
| High School Diploma | 0 (0.0%) | 0 (0.0%) |
| College or Associate's Degree | 3 (100.0%) | 0 (0.0%) |
| Bachelor's Degree | 0 (0.0%) | 0 (0.0%) |
| Graduate Degree | 0 (0.0%) | 0 (0.0%) |
| Total | 3 (100.0%) | 0 (0.0%) |
Employment Characteristics in Marion
Employment by Class of Employer in Marion
Among the 807 employed individuals in Marion, private company employees (548 | 67.9%), self-employed (not incorporated) (71 | 8.8%), and state government employees (64 | 7.9%) make up the most common classes of employment.
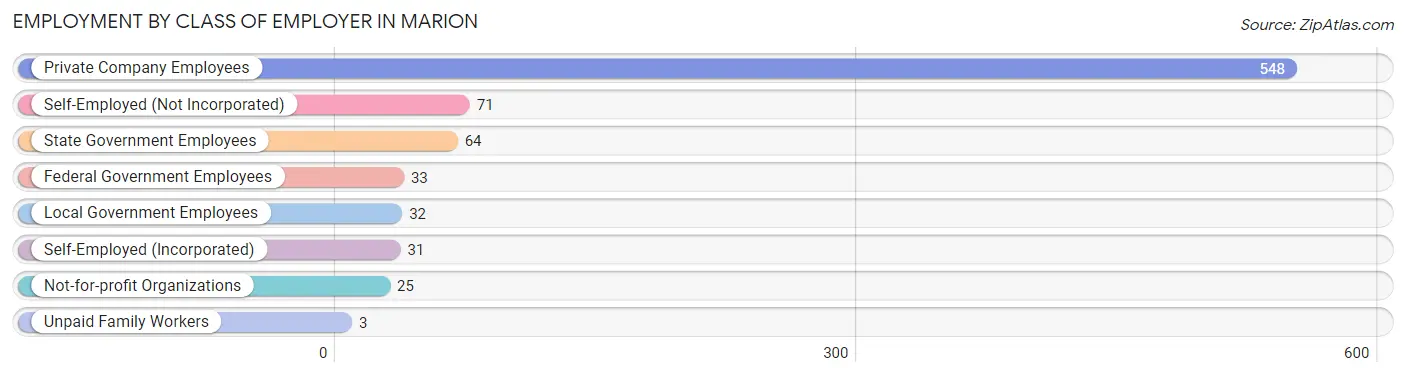
| Employer Class | # Employees | % Employees |
| Private Company Employees | 548 | 67.9% |
| Self-Employed (Incorporated) | 31 | 3.8% |
| Self-Employed (Not Incorporated) | 71 | 8.8% |
| Not-for-profit Organizations | 25 | 3.1% |
| Local Government Employees | 32 | 4.0% |
| State Government Employees | 64 | 7.9% |
| Federal Government Employees | 33 | 4.1% |
| Unpaid Family Workers | 3 | 0.4% |
| Total | 807 | 100.0% |
Employment Status by Age in Marion
According to the labor force statistics for Marion, out of the total population over 16 years of age (1,495), 59.8% or 894 individuals are in the labor force, with 5.7% or 51 of them unemployed. The age group with the highest labor force participation rate is 45 to 54 years, with 98.1% or 260 individuals in the labor force. Within the labor force, the 30 to 34 years age range has the highest percentage of unemployed individuals, with 40.3% or 29 of them being unemployed.
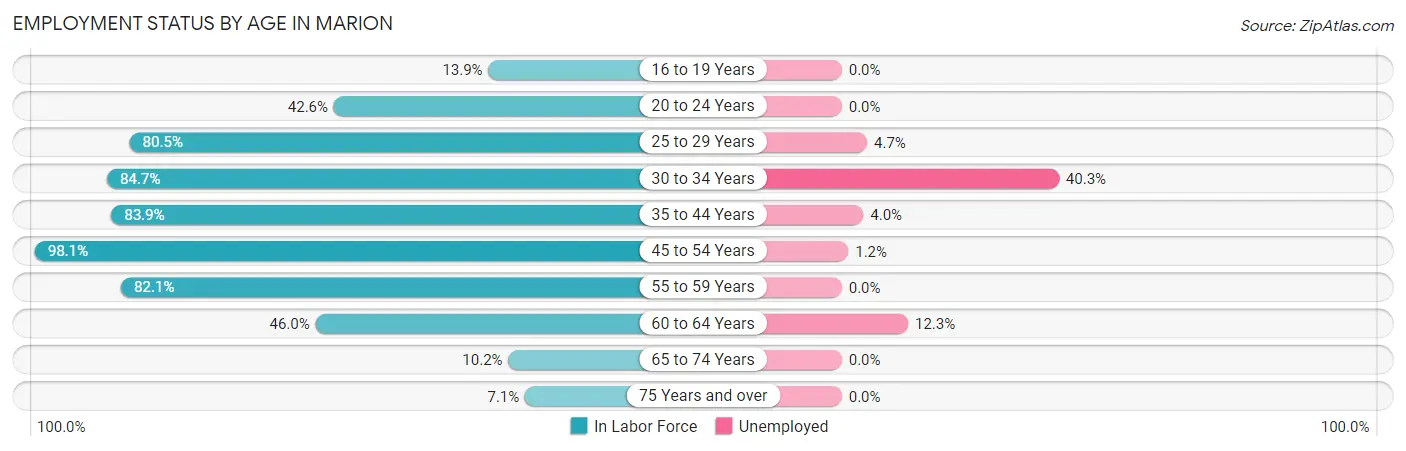
| Age Bracket | In Labor Force | Unemployed |
| 16 to 19 Years | 20 (13.9%) | 0 (0.0%) |
| 20 to 24 Years | 52 (42.6%) | 0 (0.0%) |
| 25 to 29 Years | 128 (80.5%) | 6 (4.7%) |
| 30 to 34 Years | 72 (84.7%) | 29 (40.3%) |
| 35 to 44 Years | 234 (83.9%) | 9 (4.0%) |
| 45 to 54 Years | 260 (98.1%) | 3 (1.2%) |
| 55 to 59 Years | 46 (82.1%) | 0 (0.0%) |
| 60 to 64 Years | 57 (46.0%) | 7 (12.3%) |
| 65 to 74 Years | 21 (10.2%) | 0 (0.0%) |
| 75 Years and over | 4 (7.1%) | 0 (0.0%) |
| Total | 894 (59.8%) | 51 (5.7%) |
Employment Status by Educational Attainment in Marion
According to labor force statistics for Marion, 82.3% of individuals (797) out of the total population between 25 and 64 years of age (968) are in the labor force, with 6.4% or 51 of them being unemployed. The group with the highest labor force participation rate are those with the educational attainment of bachelor's degree or higher, with 93.6% or 277 individuals in the labor force. Within the labor force, individuals with college / associate degree education have the highest percentage of unemployment, with 8.6% or 25 of them being unemployed.
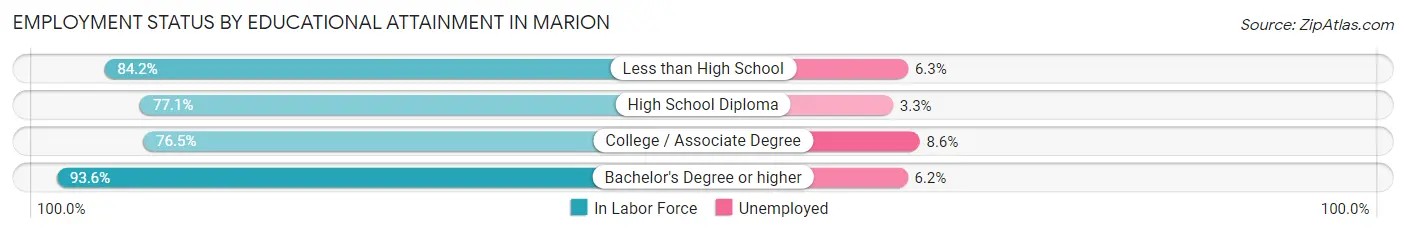
| Educational Attainment | In Labor Force | Unemployed |
| Less than High School | 48 (84.2%) | 4 (6.3%) |
| High School Diploma | 182 (77.1%) | 8 (3.3%) |
| College / Associate Degree | 290 (76.5%) | 33 (8.6%) |
| Bachelor's Degree or higher | 277 (93.6%) | 18 (6.2%) |
| Total | 797 (82.3%) | 62 (6.4%) |
Employment Occupations by Sex in Marion
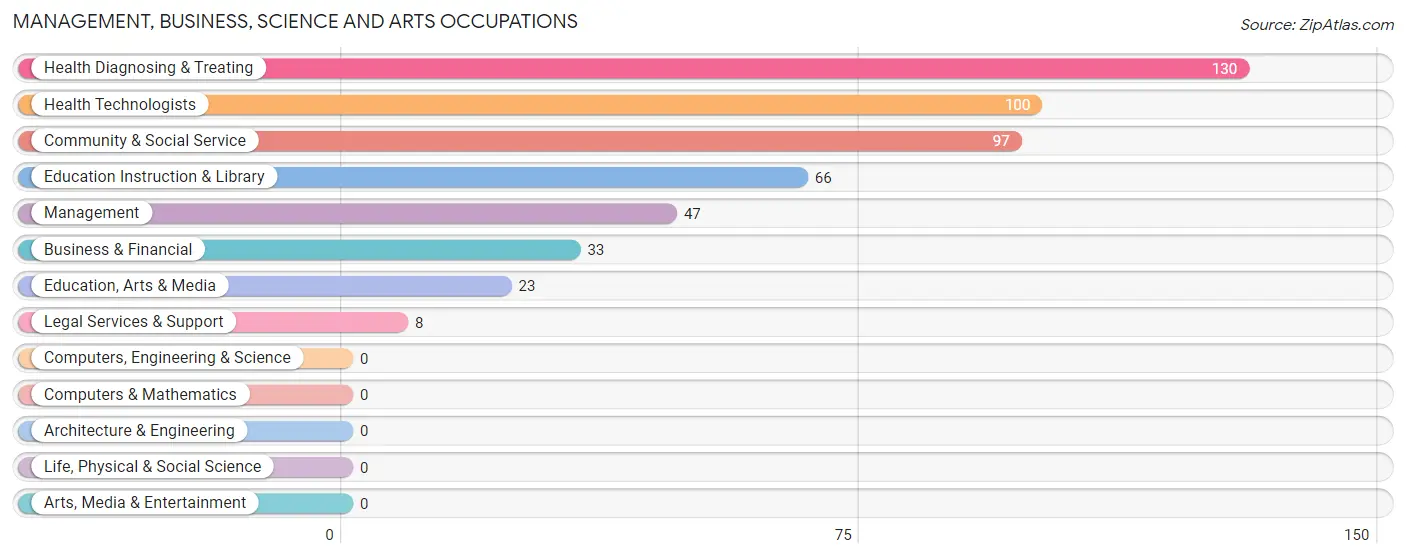
Management, Business, Science and Arts Occupations
The most common Management, Business, Science and Arts occupations in Marion are Health Diagnosing & Treating (130 | 15.8%), Health Technologists (100 | 12.1%), Community & Social Service (97 | 11.8%), Education Instruction & Library (66 | 8.0%), and Management (47 | 5.7%).
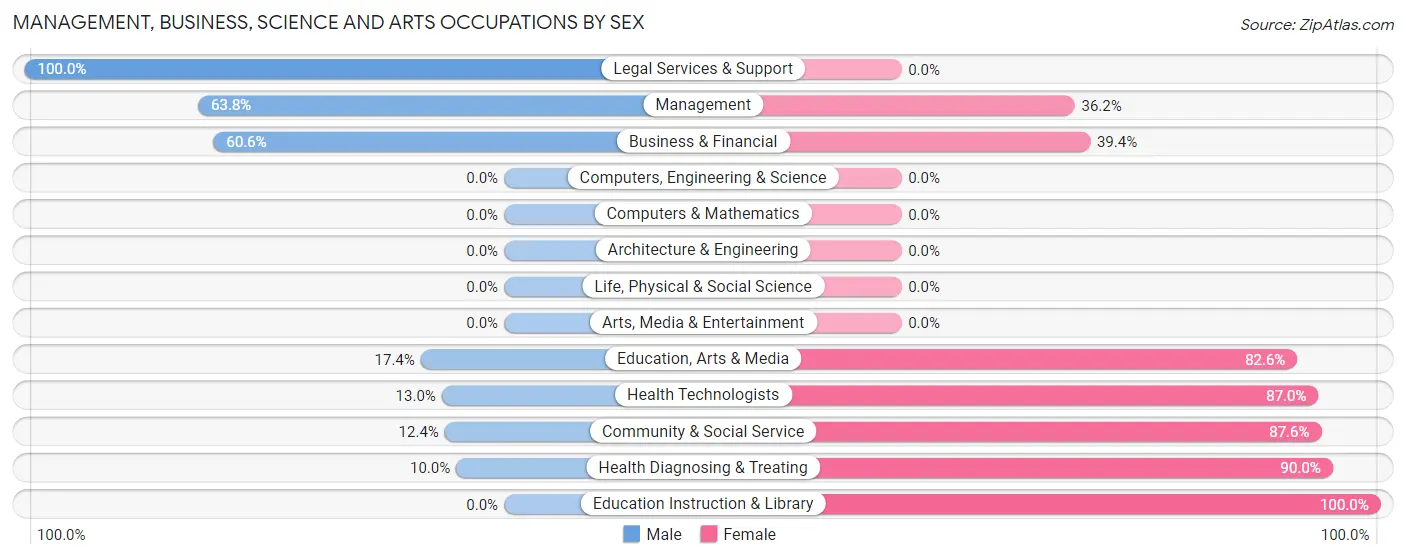
Management, Business, Science and Arts Occupations by Sex
Within the Management, Business, Science and Arts occupations in Marion, the most male-oriented occupations are Legal Services & Support (100.0%), Management (63.8%), and Business & Financial (60.6%), while the most female-oriented occupations are Education Instruction & Library (100.0%), Health Diagnosing & Treating (90.0%), and Community & Social Service (87.6%).
| Occupation | Male | Female |
| Management | 30 (63.8%) | 17 (36.2%) |
| Business & Financial | 20 (60.6%) | 13 (39.4%) |
| Computers, Engineering & Science | 0 (0.0%) | 0 (0.0%) |
| Computers & Mathematics | 0 (0.0%) | 0 (0.0%) |
| Architecture & Engineering | 0 (0.0%) | 0 (0.0%) |
| Life, Physical & Social Science | 0 (0.0%) | 0 (0.0%) |
| Community & Social Service | 12 (12.4%) | 85 (87.6%) |
| Education, Arts & Media | 4 (17.4%) | 19 (82.6%) |
| Legal Services & Support | 8 (100.0%) | 0 (0.0%) |
| Education Instruction & Library | 0 (0.0%) | 66 (100.0%) |
| Arts, Media & Entertainment | 0 (0.0%) | 0 (0.0%) |
| Health Diagnosing & Treating | 13 (10.0%) | 117 (90.0%) |
| Health Technologists | 13 (13.0%) | 87 (87.0%) |
| Total (Category) | 75 (24.4%) | 232 (75.6%) |
| Total (Overall) | 252 (30.5%) | 573 (69.5%) |
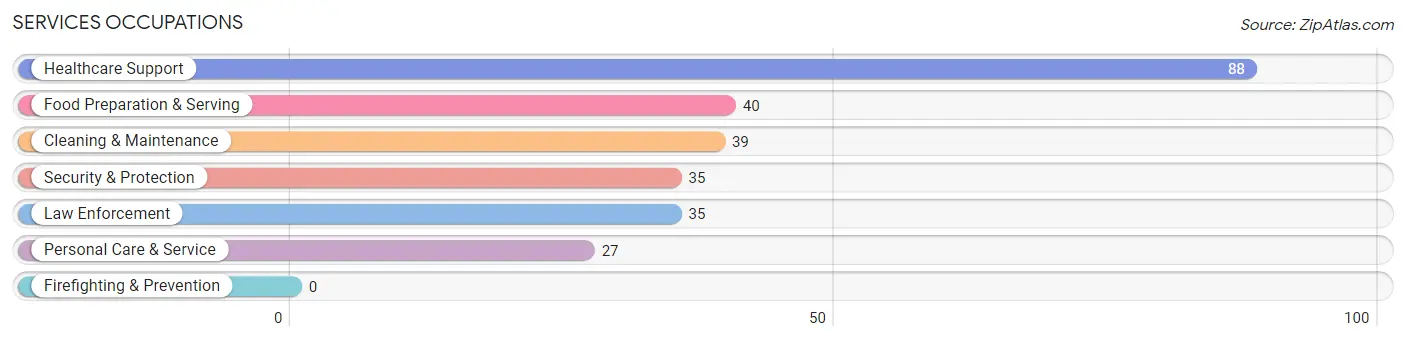
Services Occupations
The most common Services occupations in Marion are Healthcare Support (88 | 10.7%), Food Preparation & Serving (40 | 4.9%), Cleaning & Maintenance (39 | 4.7%), Security & Protection (35 | 4.2%), and Law Enforcement (35 | 4.2%).
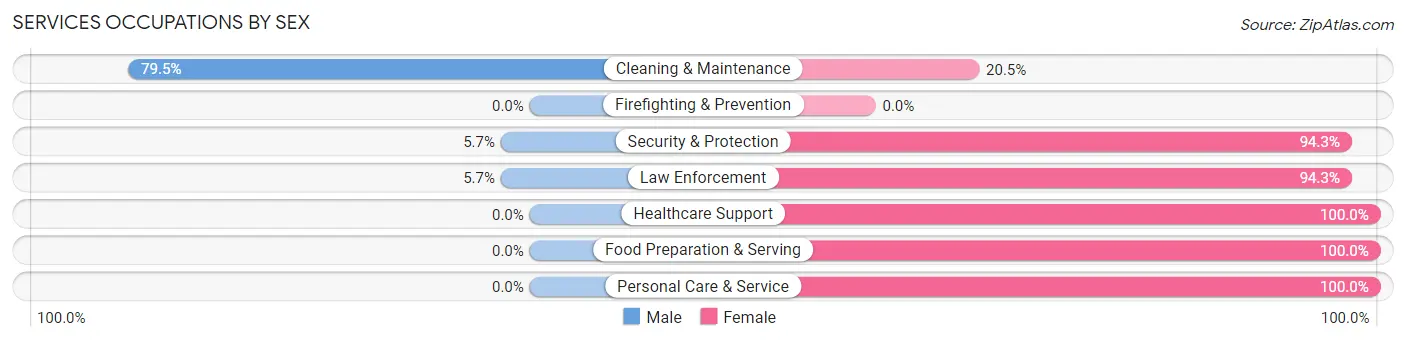
Services Occupations by Sex
Within the Services occupations in Marion, the most male-oriented occupations are Cleaning & Maintenance (79.5%), Security & Protection (5.7%), and Law Enforcement (5.7%), while the most female-oriented occupations are Healthcare Support (100.0%), Food Preparation & Serving (100.0%), and Personal Care & Service (100.0%).
| Occupation | Male | Female |
| Healthcare Support | 0 (0.0%) | 88 (100.0%) |
| Security & Protection | 2 (5.7%) | 33 (94.3%) |
| Firefighting & Prevention | 0 (0.0%) | 0 (0.0%) |
| Law Enforcement | 2 (5.7%) | 33 (94.3%) |
| Food Preparation & Serving | 0 (0.0%) | 40 (100.0%) |
| Cleaning & Maintenance | 31 (79.5%) | 8 (20.5%) |
| Personal Care & Service | 0 (0.0%) | 27 (100.0%) |
| Total (Category) | 33 (14.4%) | 196 (85.6%) |
| Total (Overall) | 252 (30.5%) | 573 (69.5%) |
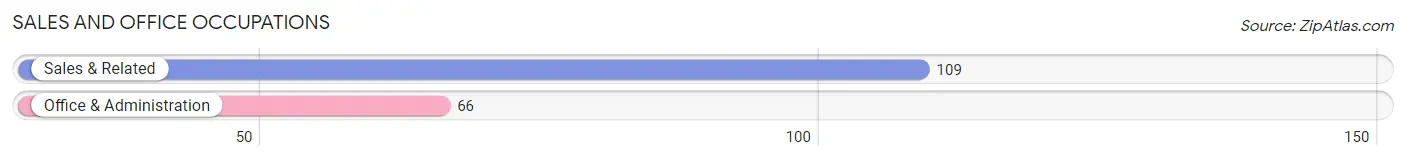
Sales and Office Occupations
The most common Sales and Office occupations in Marion are Sales & Related (109 | 13.2%), and Office & Administration (66 | 8.0%).
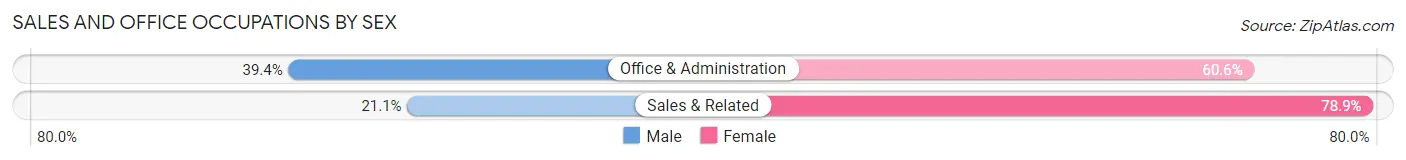
Sales and Office Occupations by Sex
| Occupation | Male | Female |
| Sales & Related | 23 (21.1%) | 86 (78.9%) |
| Office & Administration | 26 (39.4%) | 40 (60.6%) |
| Total (Category) | 49 (28.0%) | 126 (72.0%) |
| Total (Overall) | 252 (30.5%) | 573 (69.5%) |
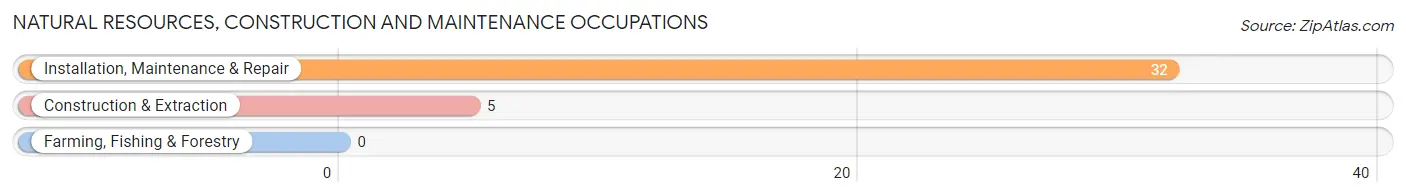
Natural Resources, Construction and Maintenance Occupations
The most common Natural Resources, Construction and Maintenance occupations in Marion are Installation, Maintenance & Repair (32 | 3.9%), and Construction & Extraction (5 | 0.6%).
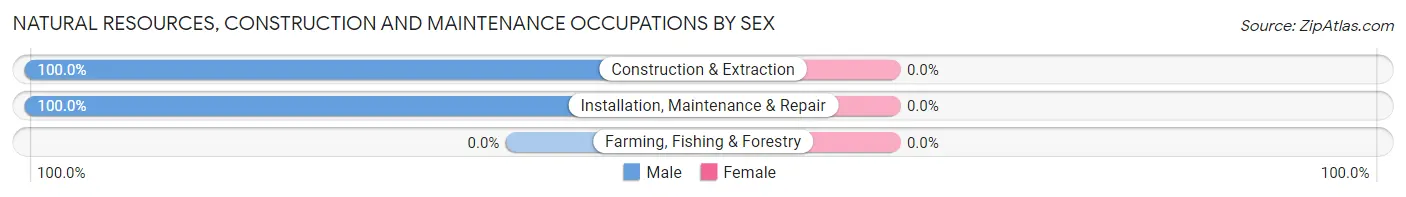
Natural Resources, Construction and Maintenance Occupations by Sex
| Occupation | Male | Female |
| Farming, Fishing & Forestry | 0 (0.0%) | 0 (0.0%) |
| Construction & Extraction | 5 (100.0%) | 0 (0.0%) |
| Installation, Maintenance & Repair | 32 (100.0%) | 0 (0.0%) |
| Total (Category) | 37 (100.0%) | 0 (0.0%) |
| Total (Overall) | 252 (30.5%) | 573 (69.5%) |
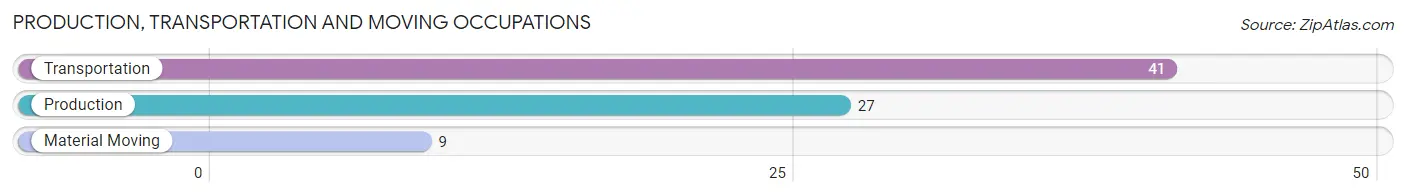
Production, Transportation and Moving Occupations
The most common Production, Transportation and Moving occupations in Marion are Transportation (41 | 5.0%), Production (27 | 3.3%), and Material Moving (9 | 1.1%).
Production, Transportation and Moving Occupations by Sex
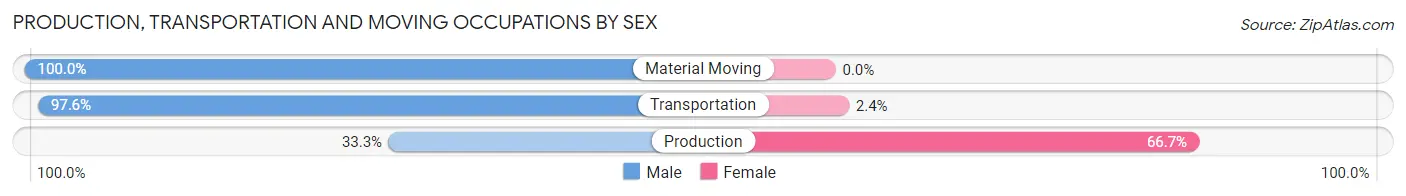
| Occupation | Male | Female |
| Production | 9 (33.3%) | 18 (66.7%) |
| Transportation | 40 (97.6%) | 1 (2.4%) |
| Material Moving | 9 (100.0%) | 0 (0.0%) |
| Total (Category) | 58 (75.3%) | 19 (24.7%) |
| Total (Overall) | 252 (30.5%) | 573 (69.5%) |
Employment Industries by Sex in Marion
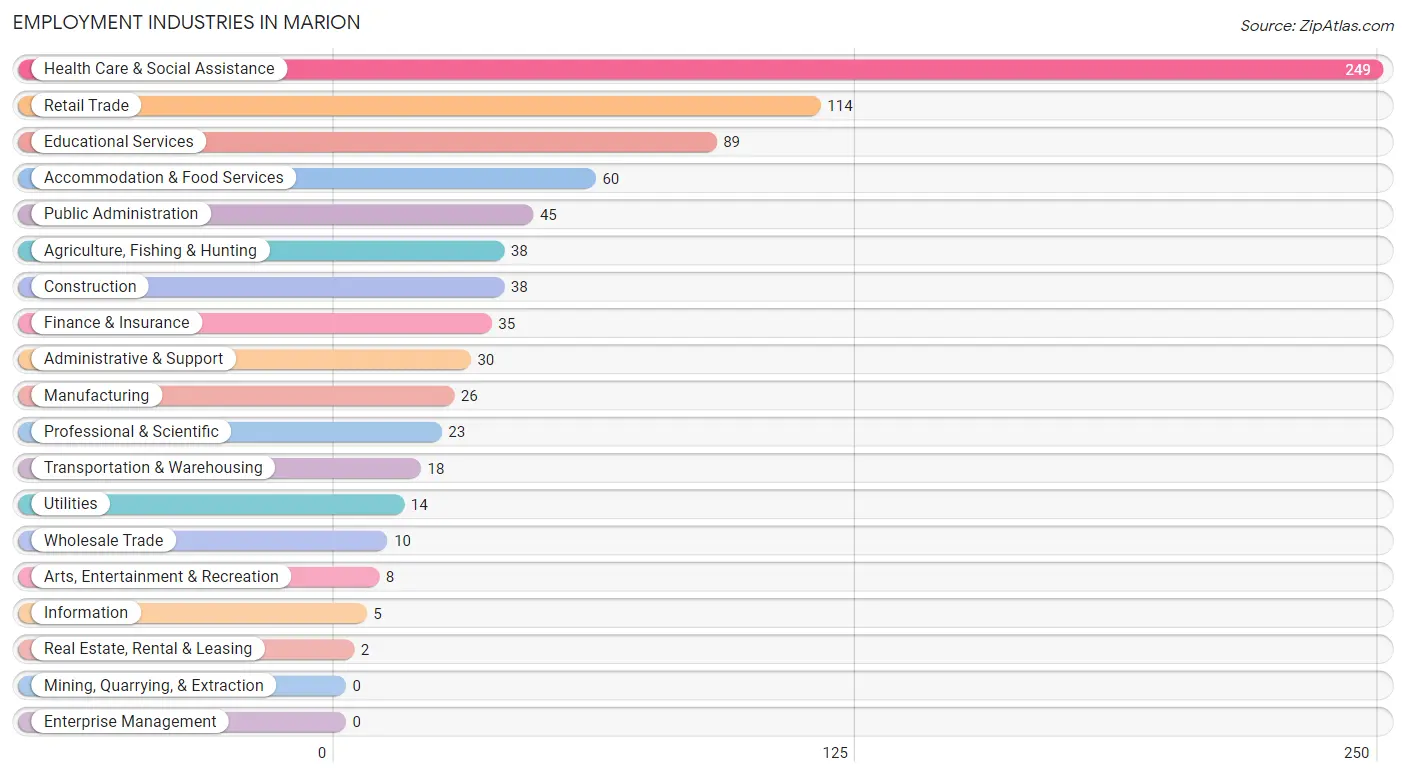
Employment Industries in Marion
The major employment industries in Marion include Health Care & Social Assistance (249 | 30.2%), Retail Trade (114 | 13.8%), Educational Services (89 | 10.8%), Accommodation & Food Services (60 | 7.3%), and Public Administration (45 | 5.4%).
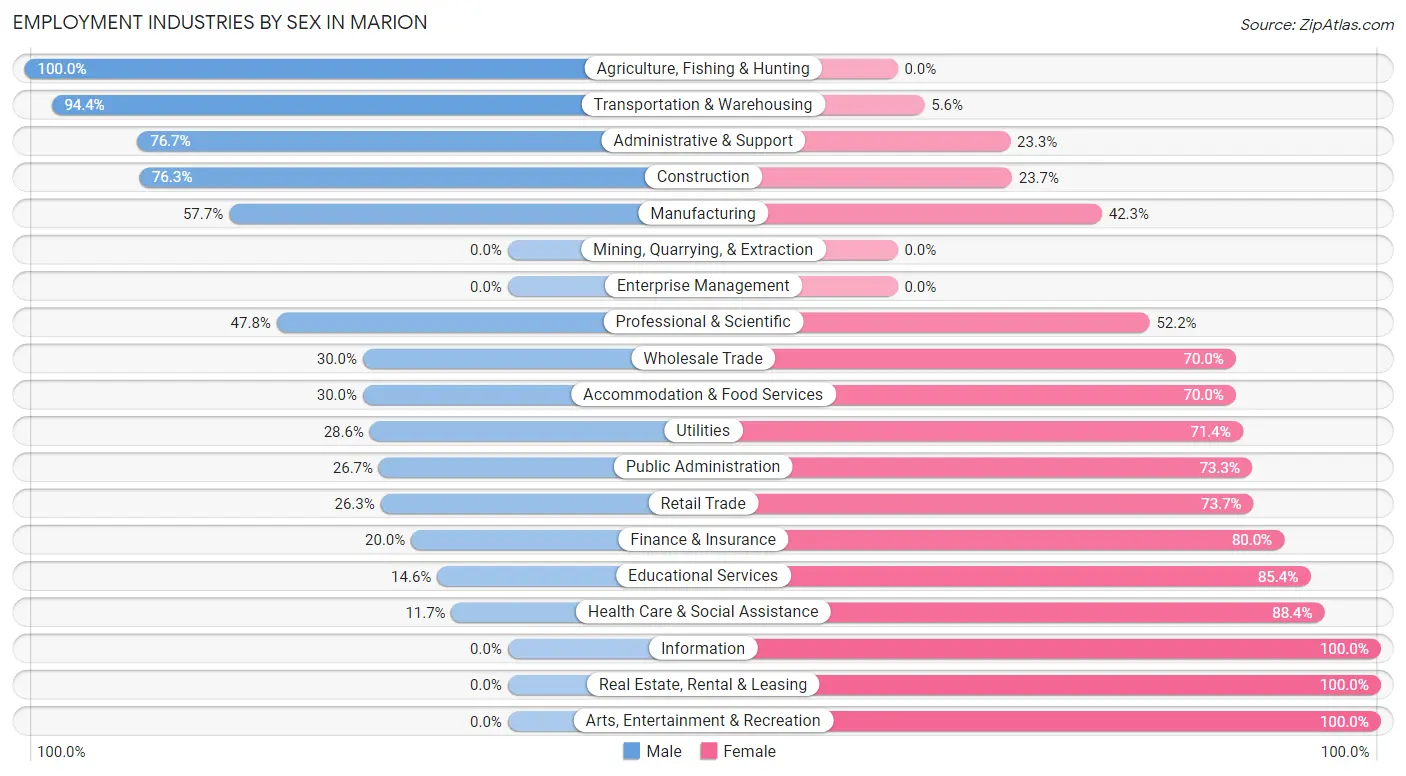
Employment Industries by Sex in Marion
The Marion industries that see more men than women are Agriculture, Fishing & Hunting (100.0%), Transportation & Warehousing (94.4%), and Administrative & Support (76.7%), whereas the industries that tend to have a higher number of women are Information (100.0%), Real Estate, Rental & Leasing (100.0%), and Arts, Entertainment & Recreation (100.0%).
| Industry | Male | Female |
| Agriculture, Fishing & Hunting | 38 (100.0%) | 0 (0.0%) |
| Mining, Quarrying, & Extraction | 0 (0.0%) | 0 (0.0%) |
| Construction | 29 (76.3%) | 9 (23.7%) |
| Manufacturing | 15 (57.7%) | 11 (42.3%) |
| Wholesale Trade | 3 (30.0%) | 7 (70.0%) |
| Retail Trade | 30 (26.3%) | 84 (73.7%) |
| Transportation & Warehousing | 17 (94.4%) | 1 (5.6%) |
| Utilities | 4 (28.6%) | 10 (71.4%) |
| Information | 0 (0.0%) | 5 (100.0%) |
| Finance & Insurance | 7 (20.0%) | 28 (80.0%) |
| Real Estate, Rental & Leasing | 0 (0.0%) | 2 (100.0%) |
| Professional & Scientific | 11 (47.8%) | 12 (52.2%) |
| Enterprise Management | 0 (0.0%) | 0 (0.0%) |
| Administrative & Support | 23 (76.7%) | 7 (23.3%) |
| Educational Services | 13 (14.6%) | 76 (85.4%) |
| Health Care & Social Assistance | 29 (11.7%) | 220 (88.3%) |
| Arts, Entertainment & Recreation | 0 (0.0%) | 8 (100.0%) |
| Accommodation & Food Services | 18 (30.0%) | 42 (70.0%) |
| Public Administration | 12 (26.7%) | 33 (73.3%) |
| Total | 252 (30.5%) | 573 (69.5%) |
Education in Marion
School Enrollment in Marion
The most common levels of schooling among the 1,014 students in Marion are elementary school (303 | 29.9%), middle school (206 | 20.3%), and college / undergraduate (198 | 19.5%).
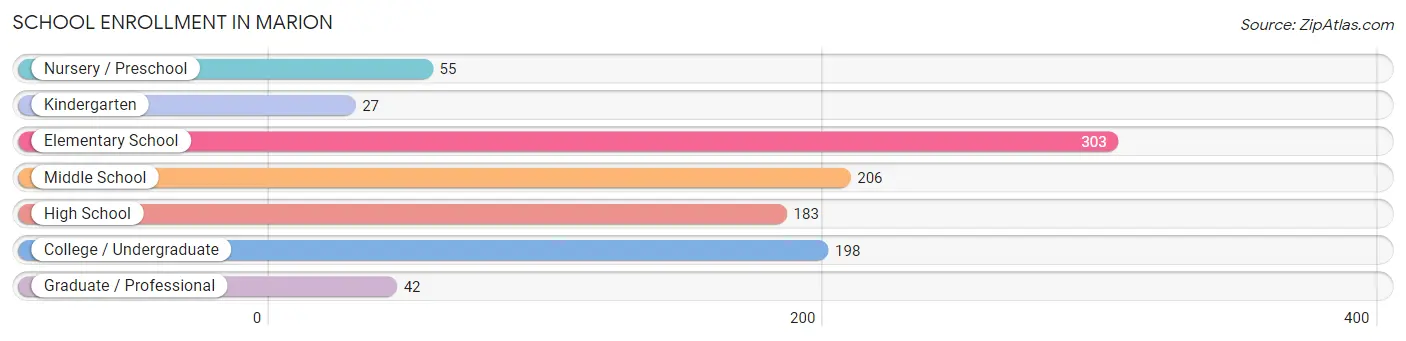
| School Level | # Students | % Students |
| Nursery / Preschool | 55 | 5.4% |
| Kindergarten | 27 | 2.7% |
| Elementary School | 303 | 29.9% |
| Middle School | 206 | 20.3% |
| High School | 183 | 18.0% |
| College / Undergraduate | 198 | 19.5% |
| Graduate / Professional | 42 | 4.1% |
| Total | 1,014 | 100.0% |
School Enrollment by Age by Funding Source in Marion
Out of a total of 1,014 students who are enrolled in schools in Marion, 88 (8.7%) attend a private institution, while the remaining 926 (91.3%) are enrolled in public schools. The age group of 3 to 4 year olds has the highest likelihood of being enrolled in private schools, with 8 (14.5% in the age bracket) enrolled. Conversely, the age group of 20 to 24 year olds has the lowest likelihood of being enrolled in a private school, with 80 (100.0% in the age bracket) attending a public institution.
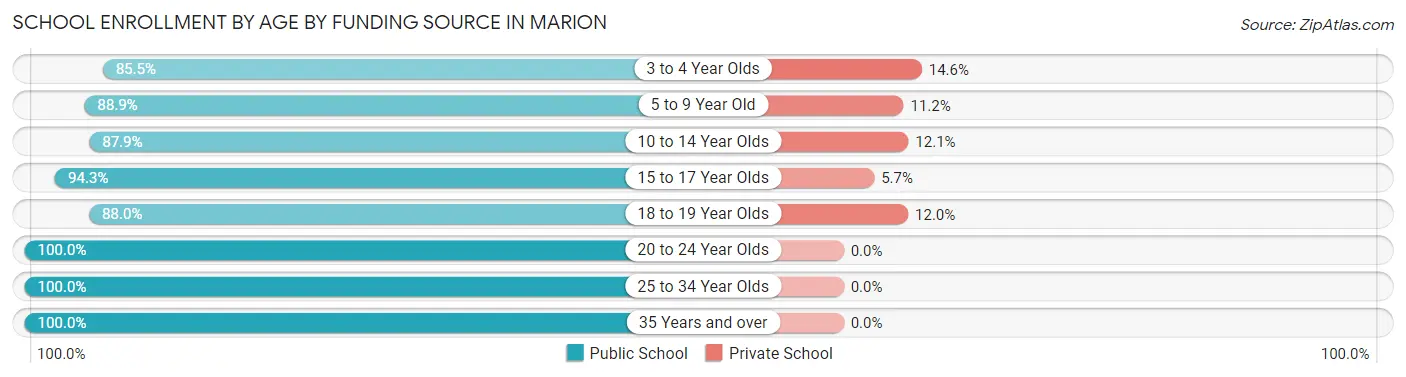
| Age Bracket | Public School | Private School |
| 3 to 4 Year Olds | 47 (85.5%) | 8 (14.5%) |
| 5 to 9 Year Old | 287 (88.8%) | 36 (11.2%) |
| 10 to 14 Year Olds | 226 (87.9%) | 31 (12.1%) |
| 15 to 17 Year Olds | 116 (94.3%) | 7 (5.7%) |
| 18 to 19 Year Olds | 44 (88.0%) | 6 (12.0%) |
| 20 to 24 Year Olds | 80 (100.0%) | 0 (0.0%) |
| 25 to 34 Year Olds | 74 (100.0%) | 0 (0.0%) |
| 35 Years and over | 52 (100.0%) | 0 (0.0%) |
| Total | 926 (91.3%) | 88 (8.7%) |
Educational Attainment by Field of Study in Marion
Science & technology (86 | 25.2%), education (64 | 18.8%), liberal arts & history (38 | 11.1%), business (36 | 10.6%), and bio, nature & agricultural (33 | 9.7%) are the most common fields of study among 341 individuals in Marion who have obtained a bachelor's degree or higher.
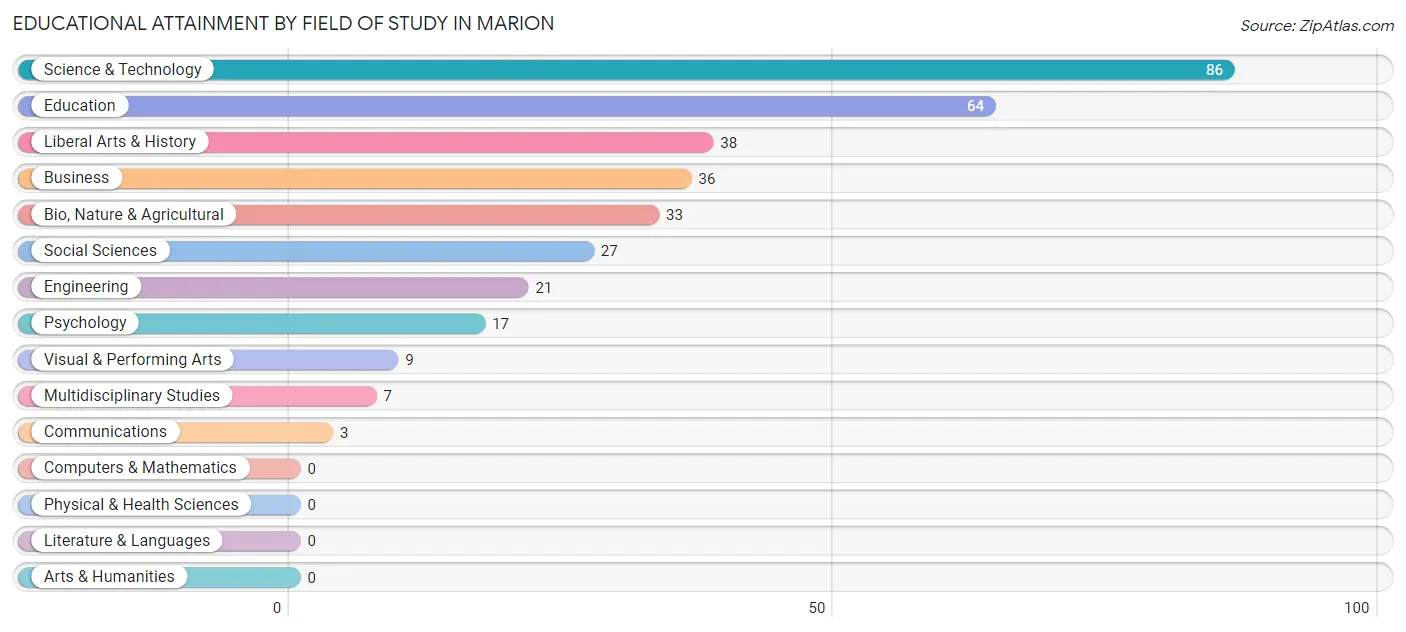
| Field of Study | # Graduates | % Graduates |
| Computers & Mathematics | 0 | 0.0% |
| Bio, Nature & Agricultural | 33 | 9.7% |
| Physical & Health Sciences | 0 | 0.0% |
| Psychology | 17 | 5.0% |
| Social Sciences | 27 | 7.9% |
| Engineering | 21 | 6.2% |
| Multidisciplinary Studies | 7 | 2.1% |
| Science & Technology | 86 | 25.2% |
| Business | 36 | 10.6% |
| Education | 64 | 18.8% |
| Literature & Languages | 0 | 0.0% |
| Liberal Arts & History | 38 | 11.1% |
| Visual & Performing Arts | 9 | 2.6% |
| Communications | 3 | 0.9% |
| Arts & Humanities | 0 | 0.0% |
| Total | 341 | 100.0% |
Transportation & Commute in Marion
Vehicle Availability by Sex in Marion
The most prevalent vehicle ownership categories in Marion are males with 2 vehicles (172, accounting for 65.9%) and females with 2 vehicles (246, making up 31.5%).
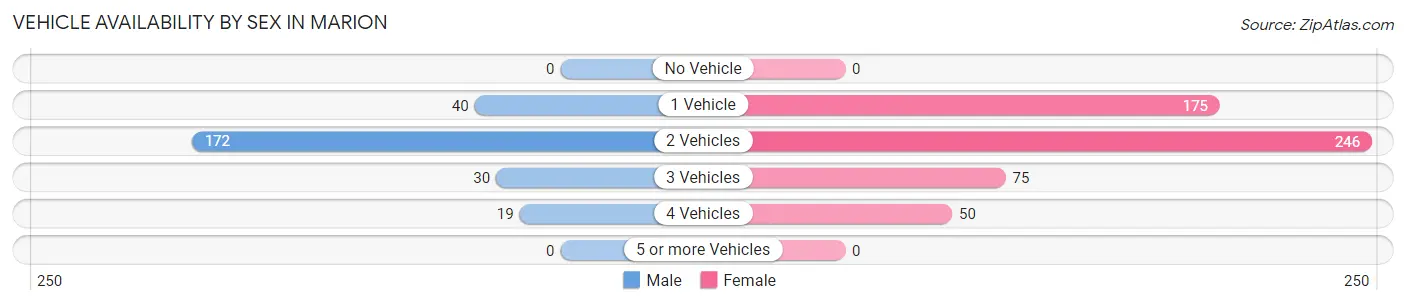
| Vehicles Available | Male | Female |
| No Vehicle | 0 (0.0%) | 0 (0.0%) |
| 1 Vehicle | 40 (15.3%) | 175 (32.1%) |
| 2 Vehicles | 172 (65.9%) | 246 (45.1%) |
| 3 Vehicles | 30 (11.5%) | 75 (13.7%) |
| 4 Vehicles | 19 (7.3%) | 50 (9.2%) |
| 5 or more Vehicles | 0 (0.0%) | 0 (0.0%) |
| Total | 261 (100.0%) | 546 (100.0%) |
Commute Time in Marion
The most frequently occuring commute durations in Marion are 10 to 14 minutes (276 commuters, 35.8%), 15 to 19 minutes (158 commuters, 20.5%), and 20 to 24 minutes (138 commuters, 17.9%).
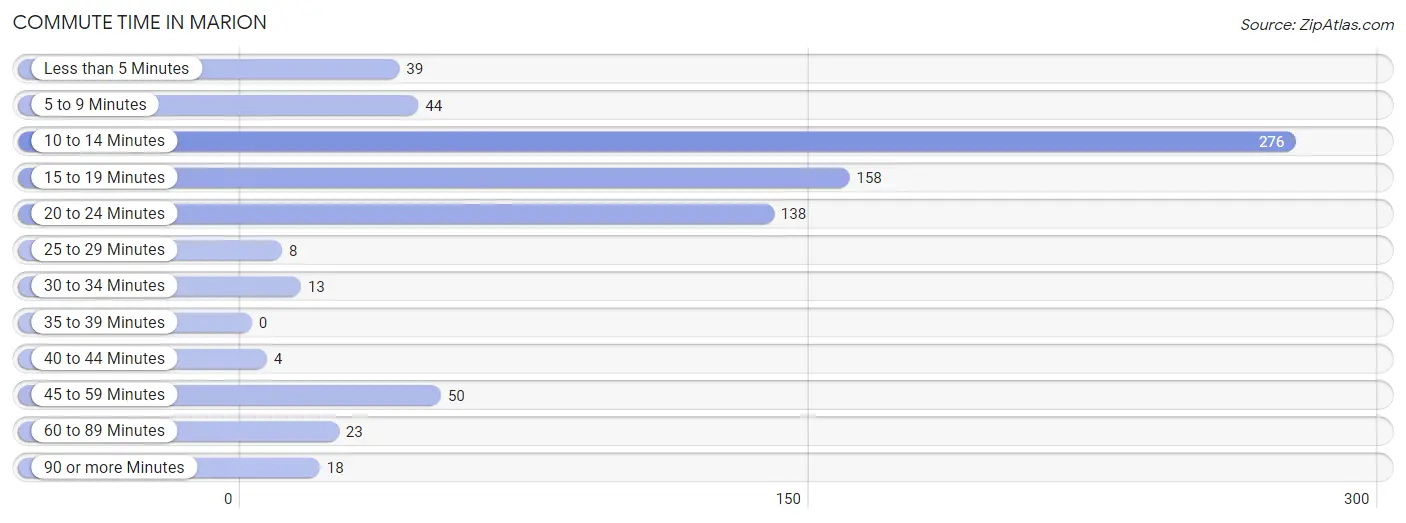
| Commute Time | # Commuters | % Commuters |
| Less than 5 Minutes | 39 | 5.1% |
| 5 to 9 Minutes | 44 | 5.7% |
| 10 to 14 Minutes | 276 | 35.8% |
| 15 to 19 Minutes | 158 | 20.5% |
| 20 to 24 Minutes | 138 | 17.9% |
| 25 to 29 Minutes | 8 | 1.0% |
| 30 to 34 Minutes | 13 | 1.7% |
| 35 to 39 Minutes | 0 | 0.0% |
| 40 to 44 Minutes | 4 | 0.5% |
| 45 to 59 Minutes | 50 | 6.5% |
| 60 to 89 Minutes | 23 | 3.0% |
| 90 or more Minutes | 18 | 2.3% |
Commute Time by Sex in Marion
The most common commute times in Marion are 15 to 19 minutes (66 commuters, 25.7%) for males and 10 to 14 minutes (228 commuters, 44.4%) for females.
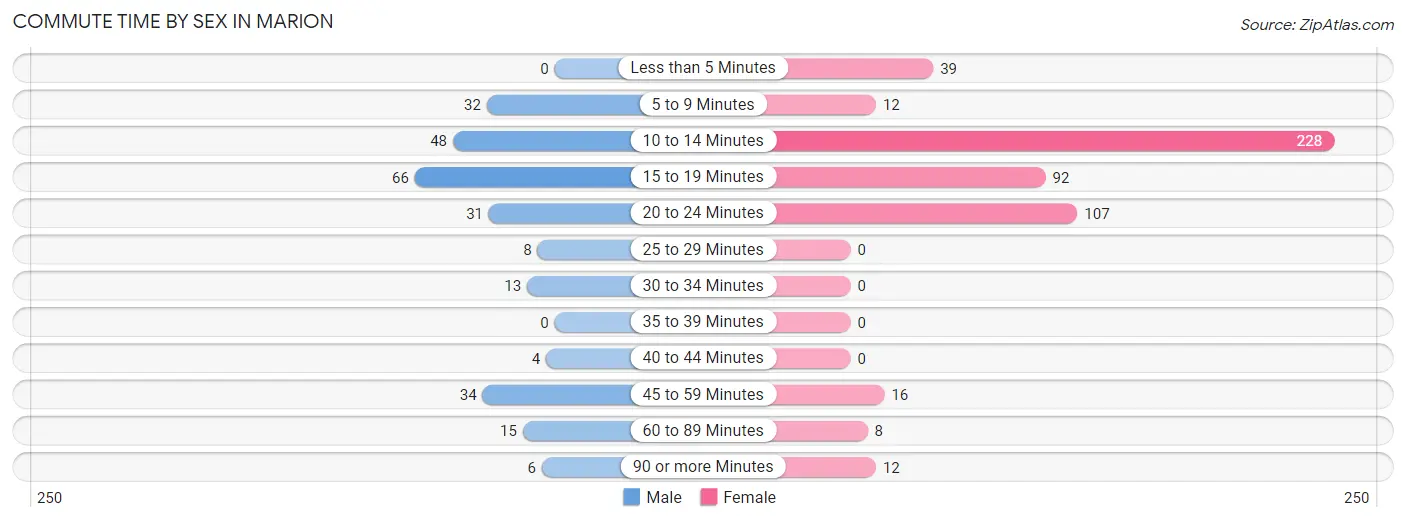
| Commute Time | Male | Female |
| Less than 5 Minutes | 0 (0.0%) | 39 (7.6%) |
| 5 to 9 Minutes | 32 (12.4%) | 12 (2.3%) |
| 10 to 14 Minutes | 48 (18.7%) | 228 (44.4%) |
| 15 to 19 Minutes | 66 (25.7%) | 92 (17.9%) |
| 20 to 24 Minutes | 31 (12.1%) | 107 (20.8%) |
| 25 to 29 Minutes | 8 (3.1%) | 0 (0.0%) |
| 30 to 34 Minutes | 13 (5.1%) | 0 (0.0%) |
| 35 to 39 Minutes | 0 (0.0%) | 0 (0.0%) |
| 40 to 44 Minutes | 4 (1.6%) | 0 (0.0%) |
| 45 to 59 Minutes | 34 (13.2%) | 16 (3.1%) |
| 60 to 89 Minutes | 15 (5.8%) | 8 (1.6%) |
| 90 or more Minutes | 6 (2.3%) | 12 (2.3%) |
Time of Departure to Work by Sex in Marion
The most frequent times of departure to work in Marion are 6:30 AM to 6:59 AM (62, 24.1%) for males and 6:30 AM to 6:59 AM (135, 26.3%) for females.
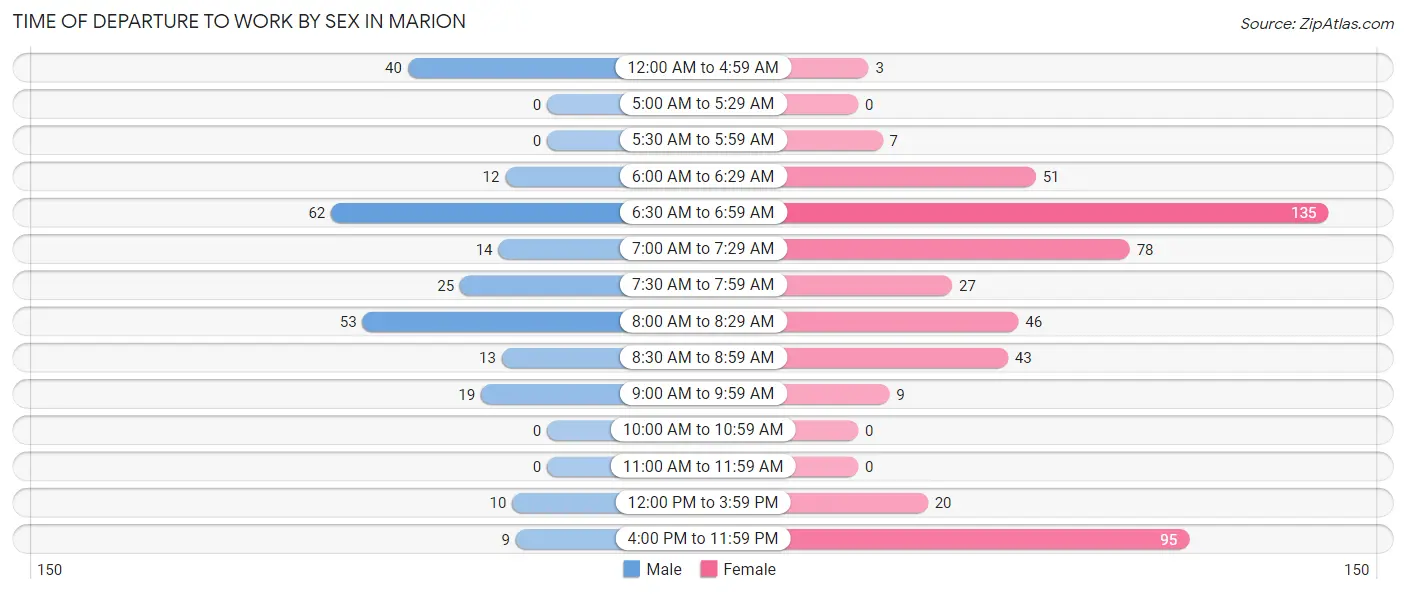
| Time of Departure | Male | Female |
| 12:00 AM to 4:59 AM | 40 (15.6%) | 3 (0.6%) |
| 5:00 AM to 5:29 AM | 0 (0.0%) | 0 (0.0%) |
| 5:30 AM to 5:59 AM | 0 (0.0%) | 7 (1.4%) |
| 6:00 AM to 6:29 AM | 12 (4.7%) | 51 (9.9%) |
| 6:30 AM to 6:59 AM | 62 (24.1%) | 135 (26.3%) |
| 7:00 AM to 7:29 AM | 14 (5.4%) | 78 (15.2%) |
| 7:30 AM to 7:59 AM | 25 (9.7%) | 27 (5.2%) |
| 8:00 AM to 8:29 AM | 53 (20.6%) | 46 (8.9%) |
| 8:30 AM to 8:59 AM | 13 (5.1%) | 43 (8.4%) |
| 9:00 AM to 9:59 AM | 19 (7.4%) | 9 (1.8%) |
| 10:00 AM to 10:59 AM | 0 (0.0%) | 0 (0.0%) |
| 11:00 AM to 11:59 AM | 0 (0.0%) | 0 (0.0%) |
| 12:00 PM to 3:59 PM | 10 (3.9%) | 20 (3.9%) |
| 4:00 PM to 11:59 PM | 9 (3.5%) | 95 (18.5%) |
| Total | 257 (100.0%) | 514 (100.0%) |
Housing Occupancy in Marion
Occupancy by Ownership in Marion
Of the total 732 dwellings in Marion, owner-occupied units account for 373 (51.0%), while renter-occupied units make up 359 (49.0%).
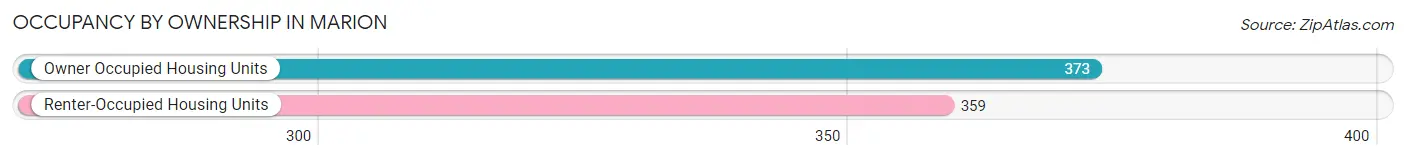
| Occupancy | # Housing Units | % Housing Units |
| Owner Occupied Housing Units | 373 | 51.0% |
| Renter-Occupied Housing Units | 359 | 49.0% |
| Total Occupied Housing Units | 732 | 100.0% |
Occupancy by Household Size in Marion
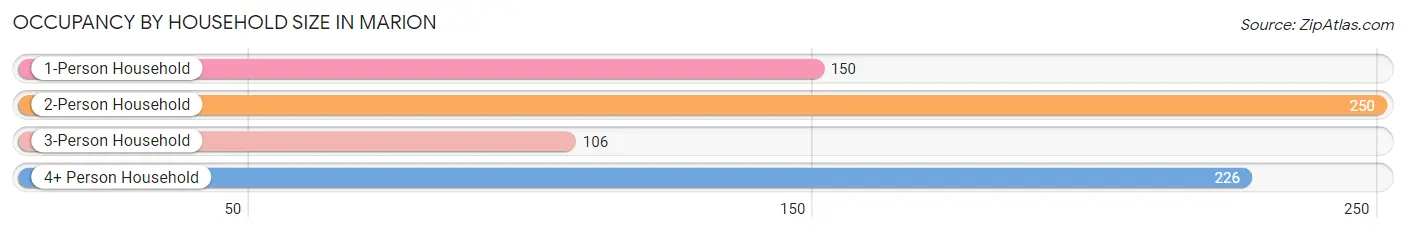
| Household Size | # Housing Units | % Housing Units |
| 1-Person Household | 150 | 20.5% |
| 2-Person Household | 250 | 34.2% |
| 3-Person Household | 106 | 14.5% |
| 4+ Person Household | 226 | 30.9% |
| Total Housing Units | 732 | 100.0% |
Occupancy by Ownership by Household Size in Marion
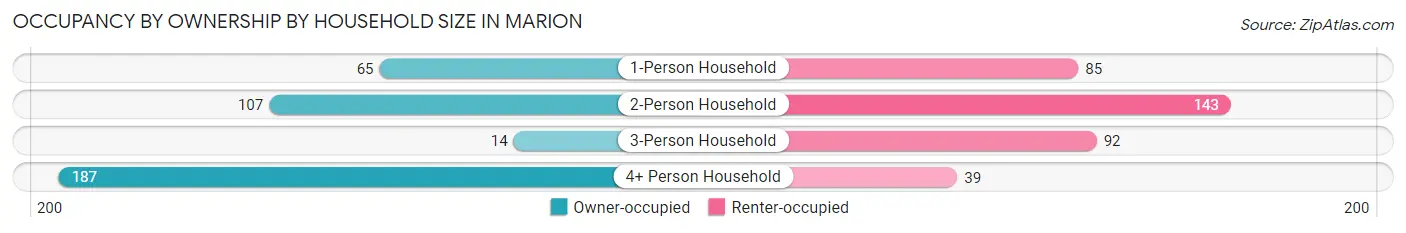
| Household Size | Owner-occupied | Renter-occupied |
| 1-Person Household | 65 (43.3%) | 85 (56.7%) |
| 2-Person Household | 107 (42.8%) | 143 (57.2%) |
| 3-Person Household | 14 (13.2%) | 92 (86.8%) |
| 4+ Person Household | 187 (82.7%) | 39 (17.3%) |
| Total Housing Units | 373 (51.0%) | 359 (49.0%) |
Occupancy by Educational Attainment in Marion
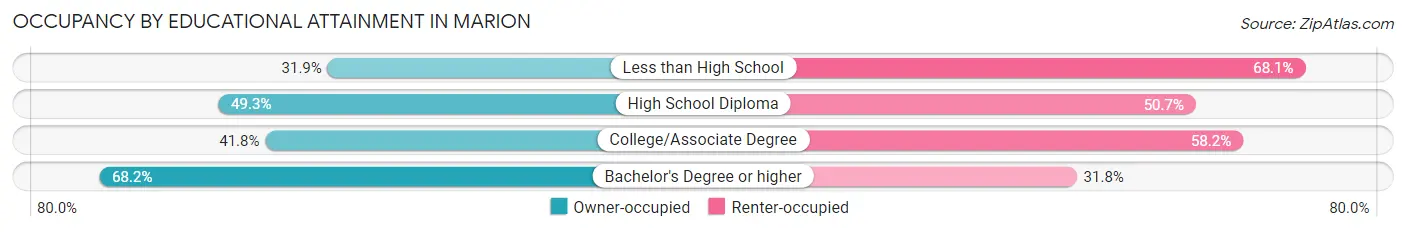
| Household Size | Owner-occupied | Renter-occupied |
| Less than High School | 23 (31.9%) | 49 (68.1%) |
| High School Diploma | 72 (49.3%) | 74 (50.7%) |
| College/Associate Degree | 115 (41.8%) | 160 (58.2%) |
| Bachelor's Degree or higher | 163 (68.2%) | 76 (31.8%) |
Occupancy by Age of Householder in Marion
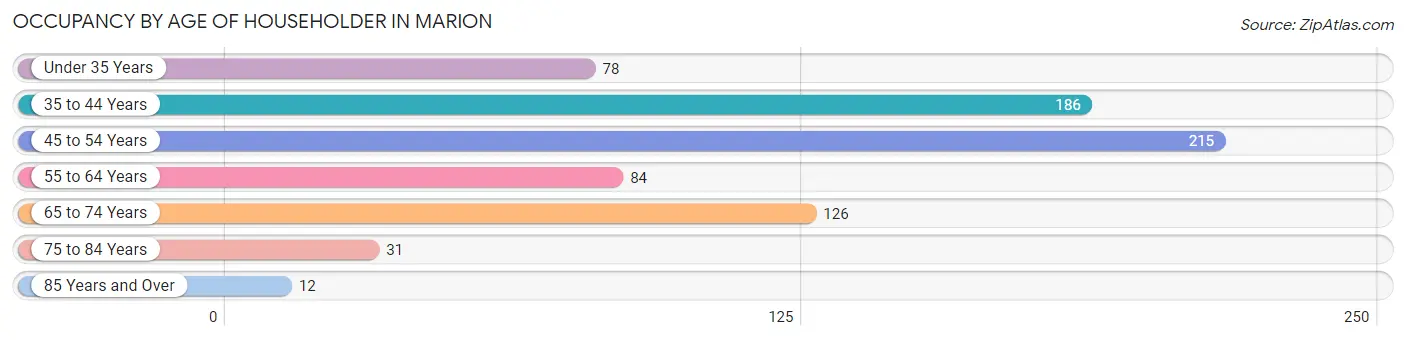
| Age Bracket | # Households | % Households |
| Under 35 Years | 78 | 10.7% |
| 35 to 44 Years | 186 | 25.4% |
| 45 to 54 Years | 215 | 29.4% |
| 55 to 64 Years | 84 | 11.5% |
| 65 to 74 Years | 126 | 17.2% |
| 75 to 84 Years | 31 | 4.2% |
| 85 Years and Over | 12 | 1.6% |
| Total | 732 | 100.0% |
Housing Finances in Marion
Median Income by Occupancy in Marion
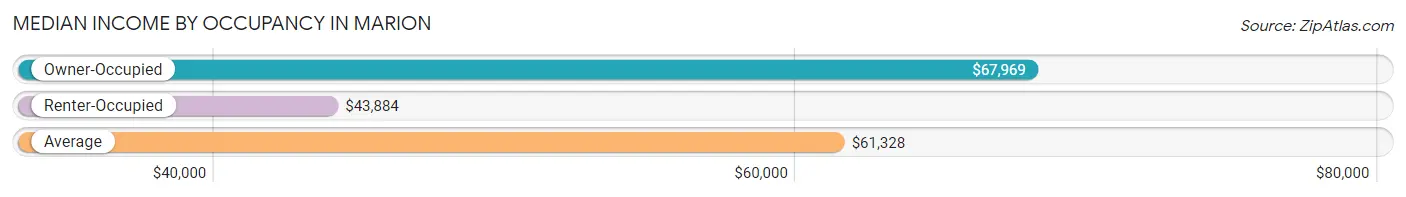
| Occupancy Type | # Households | Median Income |
| Owner-Occupied | 373 (51.0%) | $67,969 |
| Renter-Occupied | 359 (49.0%) | $43,884 |
| Average | 732 (100.0%) | $61,328 |
Occupancy by Householder Income Bracket in Marion
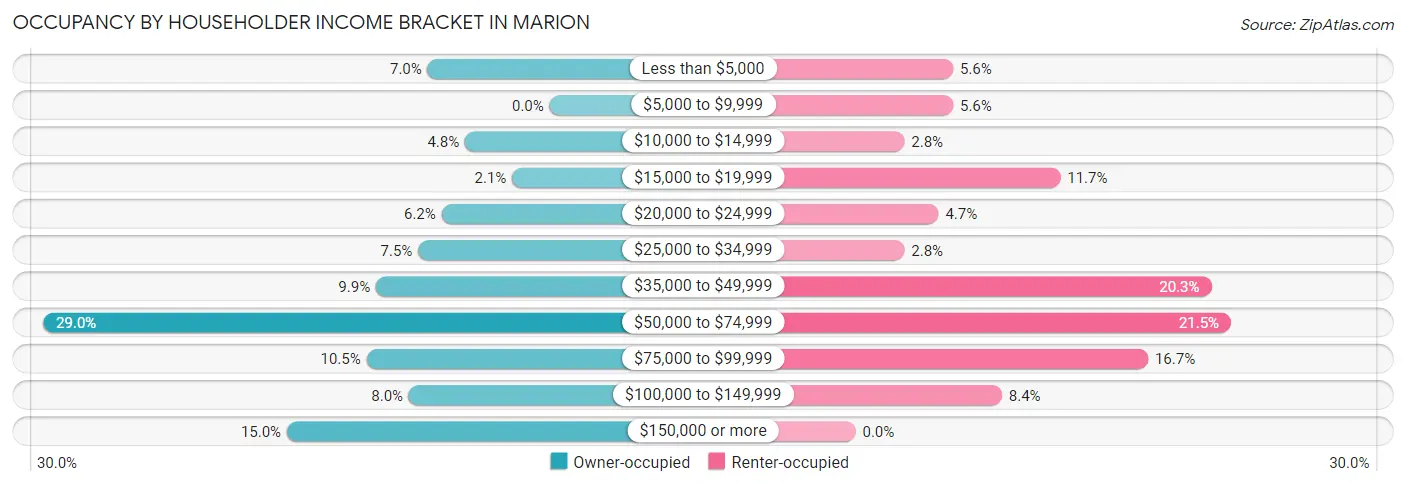
| Income Bracket | Owner-occupied | Renter-occupied |
| Less than $5,000 | 26 (7.0%) | 20 (5.6%) |
| $5,000 to $9,999 | 0 (0.0%) | 20 (5.6%) |
| $10,000 to $14,999 | 18 (4.8%) | 10 (2.8%) |
| $15,000 to $19,999 | 8 (2.1%) | 42 (11.7%) |
| $20,000 to $24,999 | 23 (6.2%) | 17 (4.7%) |
| $25,000 to $34,999 | 28 (7.5%) | 10 (2.8%) |
| $35,000 to $49,999 | 37 (9.9%) | 73 (20.3%) |
| $50,000 to $74,999 | 108 (28.9%) | 77 (21.4%) |
| $75,000 to $99,999 | 39 (10.5%) | 60 (16.7%) |
| $100,000 to $149,999 | 30 (8.0%) | 30 (8.4%) |
| $150,000 or more | 56 (15.0%) | 0 (0.0%) |
| Total | 373 (100.0%) | 359 (100.0%) |
Monthly Housing Cost Tiers in Marion
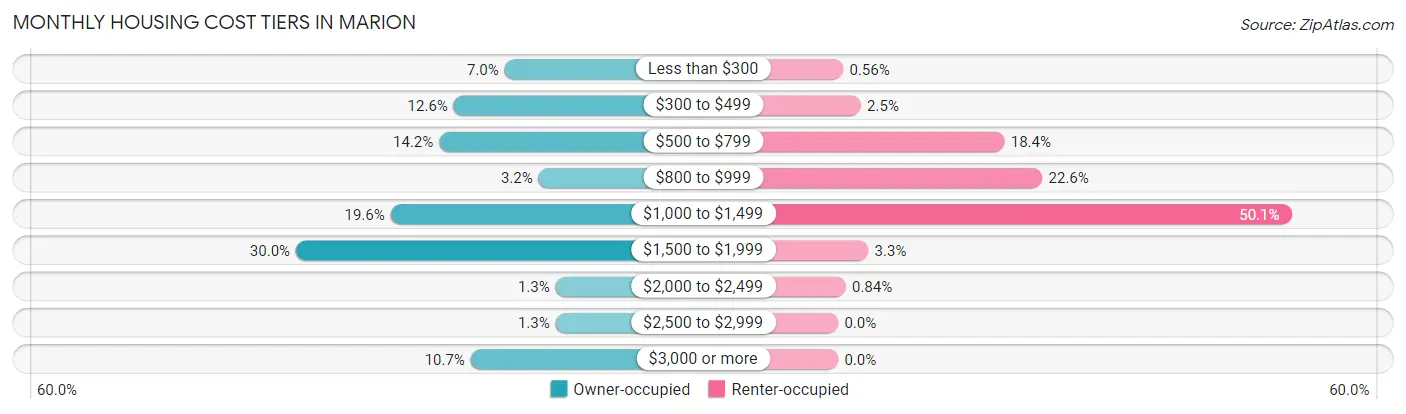
| Monthly Cost | Owner-occupied | Renter-occupied |
| Less than $300 | 26 (7.0%) | 2 (0.6%) |
| $300 to $499 | 47 (12.6%) | 9 (2.5%) |
| $500 to $799 | 53 (14.2%) | 66 (18.4%) |
| $800 to $999 | 12 (3.2%) | 81 (22.6%) |
| $1,000 to $1,499 | 73 (19.6%) | 180 (50.1%) |
| $1,500 to $1,999 | 112 (30.0%) | 12 (3.3%) |
| $2,000 to $2,499 | 5 (1.3%) | 3 (0.8%) |
| $2,500 to $2,999 | 5 (1.3%) | 0 (0.0%) |
| $3,000 or more | 40 (10.7%) | 0 (0.0%) |
| Total | 373 (100.0%) | 359 (100.0%) |
Physical Housing Characteristics in Marion
Housing Structures in Marion
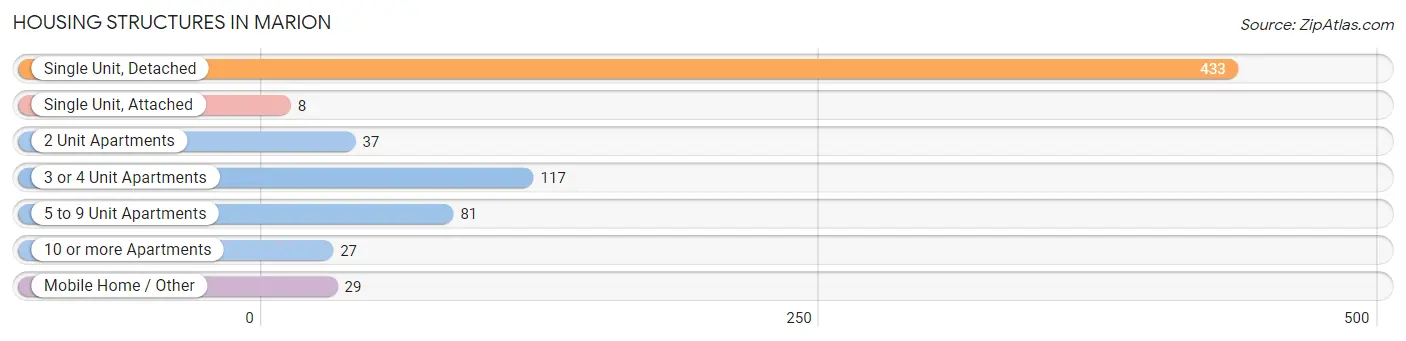
| Structure Type | # Housing Units | % Housing Units |
| Single Unit, Detached | 433 | 59.2% |
| Single Unit, Attached | 8 | 1.1% |
| 2 Unit Apartments | 37 | 5.1% |
| 3 or 4 Unit Apartments | 117 | 16.0% |
| 5 to 9 Unit Apartments | 81 | 11.1% |
| 10 or more Apartments | 27 | 3.7% |
| Mobile Home / Other | 29 | 4.0% |
| Total | 732 | 100.0% |
Housing Structures by Occupancy in Marion
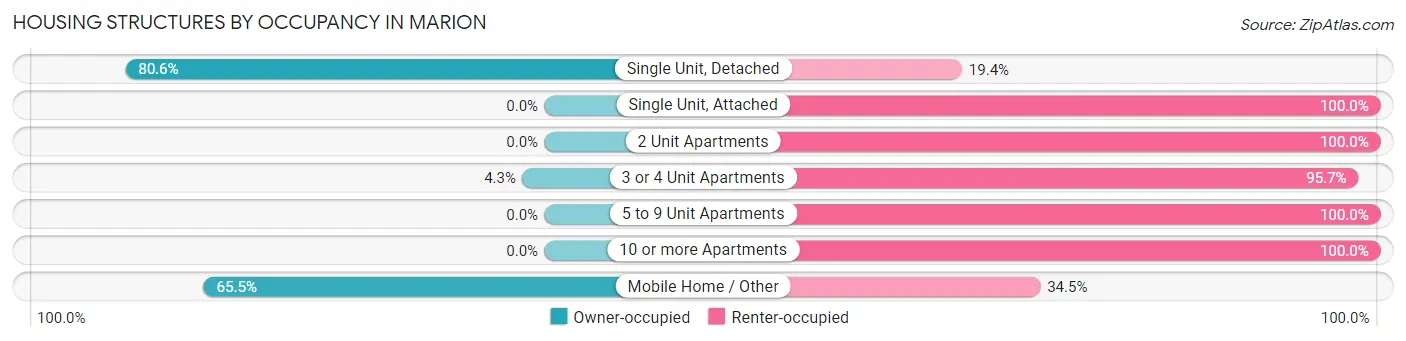
| Structure Type | Owner-occupied | Renter-occupied |
| Single Unit, Detached | 349 (80.6%) | 84 (19.4%) |
| Single Unit, Attached | 0 (0.0%) | 8 (100.0%) |
| 2 Unit Apartments | 0 (0.0%) | 37 (100.0%) |
| 3 or 4 Unit Apartments | 5 (4.3%) | 112 (95.7%) |
| 5 to 9 Unit Apartments | 0 (0.0%) | 81 (100.0%) |
| 10 or more Apartments | 0 (0.0%) | 27 (100.0%) |
| Mobile Home / Other | 19 (65.5%) | 10 (34.5%) |
| Total | 373 (51.0%) | 359 (49.0%) |
Housing Structures by Number of Rooms in Marion
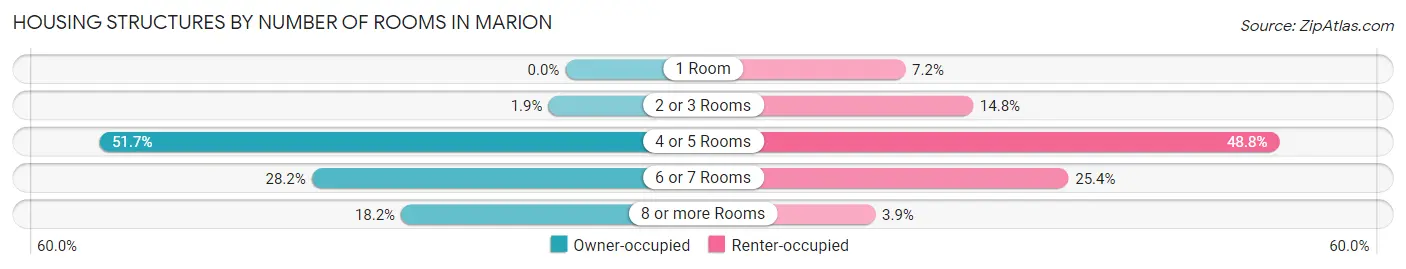
| Number of Rooms | Owner-occupied | Renter-occupied |
| 1 Room | 0 (0.0%) | 26 (7.2%) |
| 2 or 3 Rooms | 7 (1.9%) | 53 (14.8%) |
| 4 or 5 Rooms | 193 (51.7%) | 175 (48.7%) |
| 6 or 7 Rooms | 105 (28.1%) | 91 (25.4%) |
| 8 or more Rooms | 68 (18.2%) | 14 (3.9%) |
| Total | 373 (100.0%) | 359 (100.0%) |
Housing Structure by Heating Type in Marion
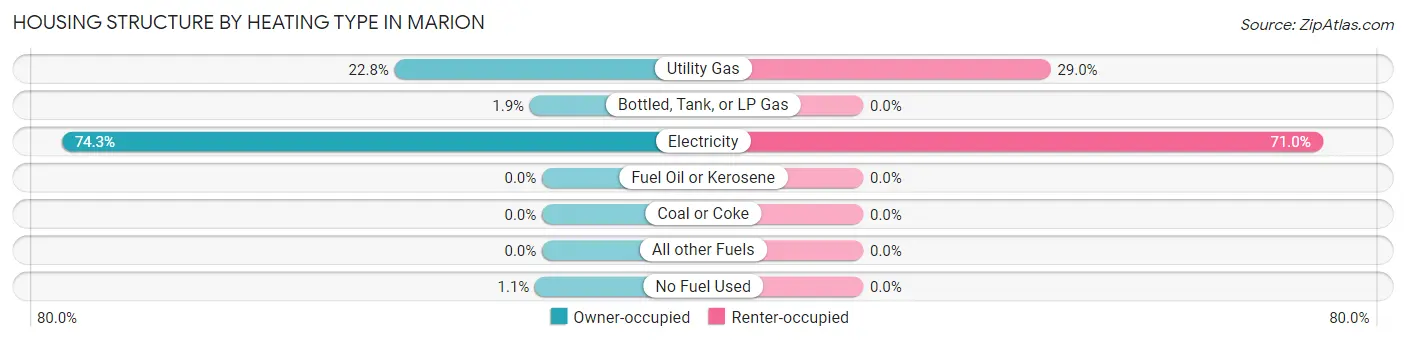
| Heating Type | Owner-occupied | Renter-occupied |
| Utility Gas | 85 (22.8%) | 104 (29.0%) |
| Bottled, Tank, or LP Gas | 7 (1.9%) | 0 (0.0%) |
| Electricity | 277 (74.3%) | 255 (71.0%) |
| Fuel Oil or Kerosene | 0 (0.0%) | 0 (0.0%) |
| Coal or Coke | 0 (0.0%) | 0 (0.0%) |
| All other Fuels | 0 (0.0%) | 0 (0.0%) |
| No Fuel Used | 4 (1.1%) | 0 (0.0%) |
| Total | 373 (100.0%) | 359 (100.0%) |
Household Vehicle Usage in Marion
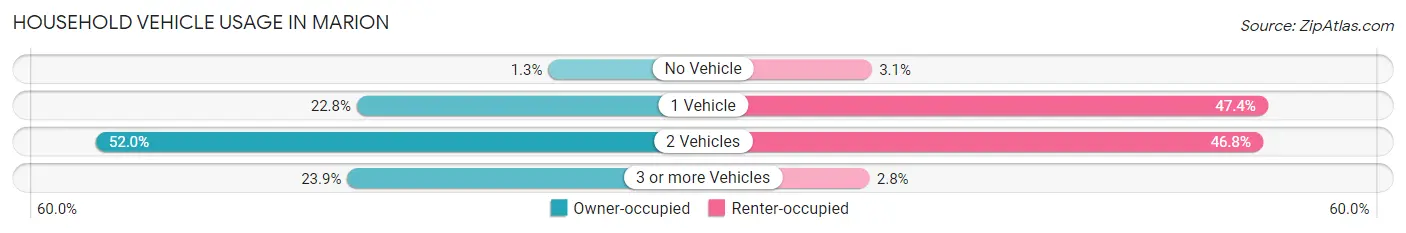
| Vehicles per Household | Owner-occupied | Renter-occupied |
| No Vehicle | 5 (1.3%) | 11 (3.1%) |
| 1 Vehicle | 85 (22.8%) | 170 (47.3%) |
| 2 Vehicles | 194 (52.0%) | 168 (46.8%) |
| 3 or more Vehicles | 89 (23.9%) | 10 (2.8%) |
| Total | 373 (100.0%) | 359 (100.0%) |
Real Estate & Mortgages in Marion
Real Estate and Mortgage Overview in Marion
| Characteristic | Without Mortgage | With Mortgage |
| Housing Units | 123 | 250 |
| Median Property Value | $153,100 | $189,700 |
| Median Household Income | $35,208 | $47 |
| Monthly Housing Costs | $481 | $37 |
| Real Estate Taxes | - | - |
Property Value by Mortgage Status in Marion
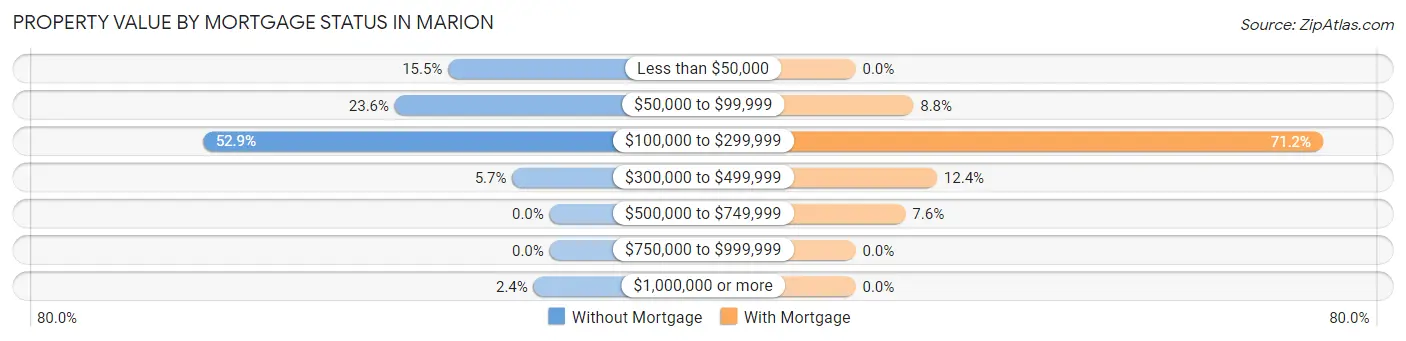
| Property Value | Without Mortgage | With Mortgage |
| Less than $50,000 | 19 (15.4%) | 0 (0.0%) |
| $50,000 to $99,999 | 29 (23.6%) | 22 (8.8%) |
| $100,000 to $299,999 | 65 (52.8%) | 178 (71.2%) |
| $300,000 to $499,999 | 7 (5.7%) | 31 (12.4%) |
| $500,000 to $749,999 | 0 (0.0%) | 19 (7.6%) |
| $750,000 to $999,999 | 0 (0.0%) | 0 (0.0%) |
| $1,000,000 or more | 3 (2.4%) | 0 (0.0%) |
| Total | 123 (100.0%) | 250 (100.0%) |
Household Income by Mortgage Status in Marion
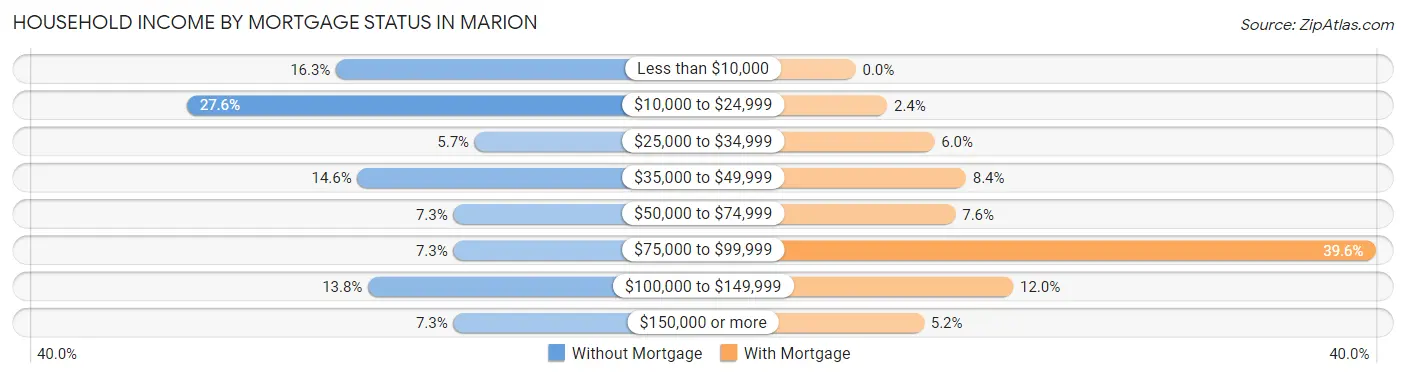
| Household Income | Without Mortgage | With Mortgage |
| Less than $10,000 | 20 (16.3%) | 0 (0.0%) |
| $10,000 to $24,999 | 34 (27.6%) | 6 (2.4%) |
| $25,000 to $34,999 | 7 (5.7%) | 15 (6.0%) |
| $35,000 to $49,999 | 18 (14.6%) | 21 (8.4%) |
| $50,000 to $74,999 | 9 (7.3%) | 19 (7.6%) |
| $75,000 to $99,999 | 9 (7.3%) | 99 (39.6%) |
| $100,000 to $149,999 | 17 (13.8%) | 30 (12.0%) |
| $150,000 or more | 9 (7.3%) | 13 (5.2%) |
| Total | 123 (100.0%) | 250 (100.0%) |
Property Value to Household Income Ratio in Marion
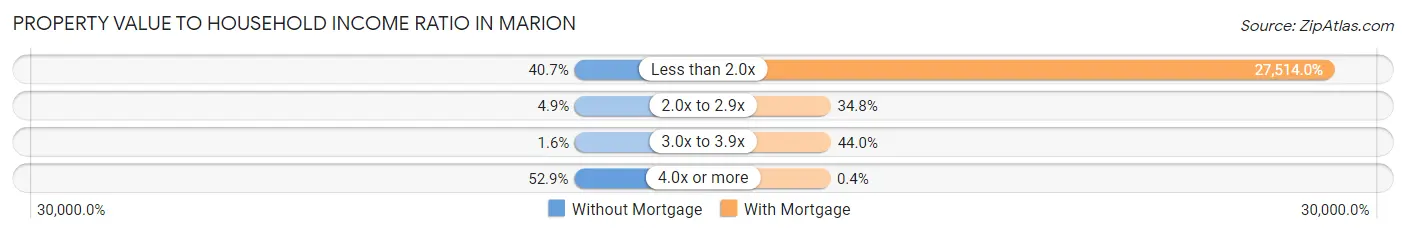
| Value-to-Income Ratio | Without Mortgage | With Mortgage |
| Less than 2.0x | 50 (40.6%) | 68,785 (27,514.0%) |
| 2.0x to 2.9x | 6 (4.9%) | 87 (34.8%) |
| 3.0x to 3.9x | 2 (1.6%) | 110 (44.0%) |
| 4.0x or more | 65 (52.8%) | 1 (0.4%) |
| Total | 123 (100.0%) | 250 (100.0%) |
Real Estate Taxes by Mortgage Status in Marion
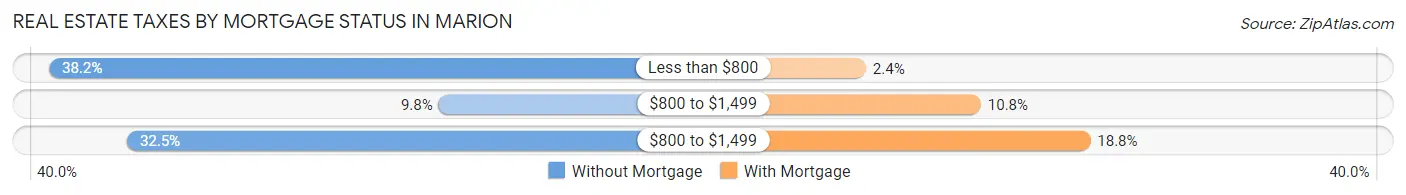
| Property Taxes | Without Mortgage | With Mortgage |
| Less than $800 | 47 (38.2%) | 6 (2.4%) |
| $800 to $1,499 | 12 (9.8%) | 27 (10.8%) |
| $800 to $1,499 | 40 (32.5%) | 47 (18.8%) |
| Total | 123 (100.0%) | 250 (100.0%) |
Health & Disability in Marion
Health Insurance Coverage by Age in Marion
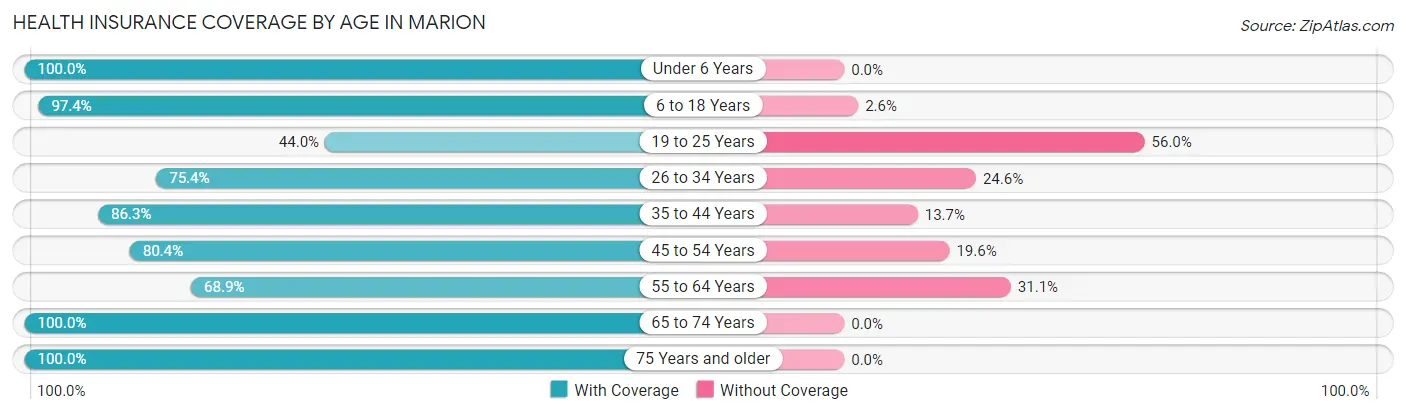
| Age Bracket | With Coverage | Without Coverage |
| Under 6 Years | 149 (100.0%) | 0 (0.0%) |
| 6 to 18 Years | 716 (97.4%) | 19 (2.6%) |
| 19 to 25 Years | 66 (44.0%) | 84 (56.0%) |
| 26 to 34 Years | 172 (75.4%) | 56 (24.6%) |
| 35 to 44 Years | 233 (86.3%) | 37 (13.7%) |
| 45 to 54 Years | 213 (80.4%) | 52 (19.6%) |
| 55 to 64 Years | 122 (68.9%) | 55 (31.1%) |
| 65 to 74 Years | 198 (100.0%) | 0 (0.0%) |
| 75 Years and older | 53 (100.0%) | 0 (0.0%) |
| Total | 1,922 (86.4%) | 303 (13.6%) |
Health Insurance Coverage by Citizenship Status in Marion
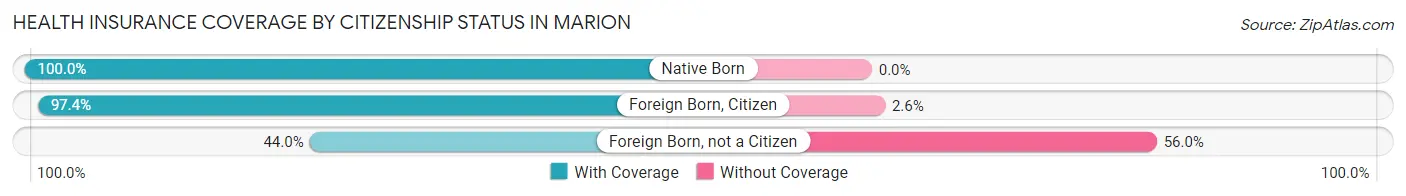
| Citizenship Status | With Coverage | Without Coverage |
| Native Born | 149 (100.0%) | 0 (0.0%) |
| Foreign Born, Citizen | 716 (97.4%) | 19 (2.6%) |
| Foreign Born, not a Citizen | 66 (44.0%) | 84 (56.0%) |
Health Insurance Coverage by Household Income in Marion
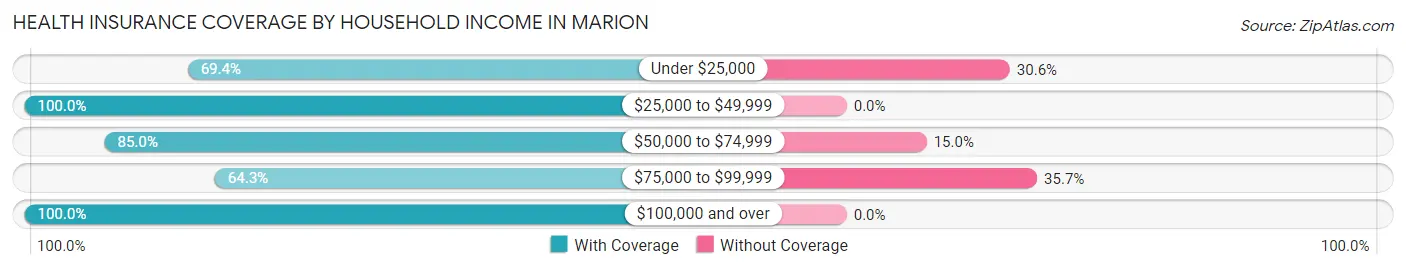
| Household Income | With Coverage | Without Coverage |
| Under $25,000 | 234 (69.4%) | 103 (30.6%) |
| $25,000 to $49,999 | 559 (100.0%) | 0 (0.0%) |
| $50,000 to $74,999 | 613 (85.0%) | 108 (15.0%) |
| $75,000 to $99,999 | 166 (64.3%) | 92 (35.7%) |
| $100,000 and over | 350 (100.0%) | 0 (0.0%) |
Public vs Private Health Insurance Coverage by Age in Marion
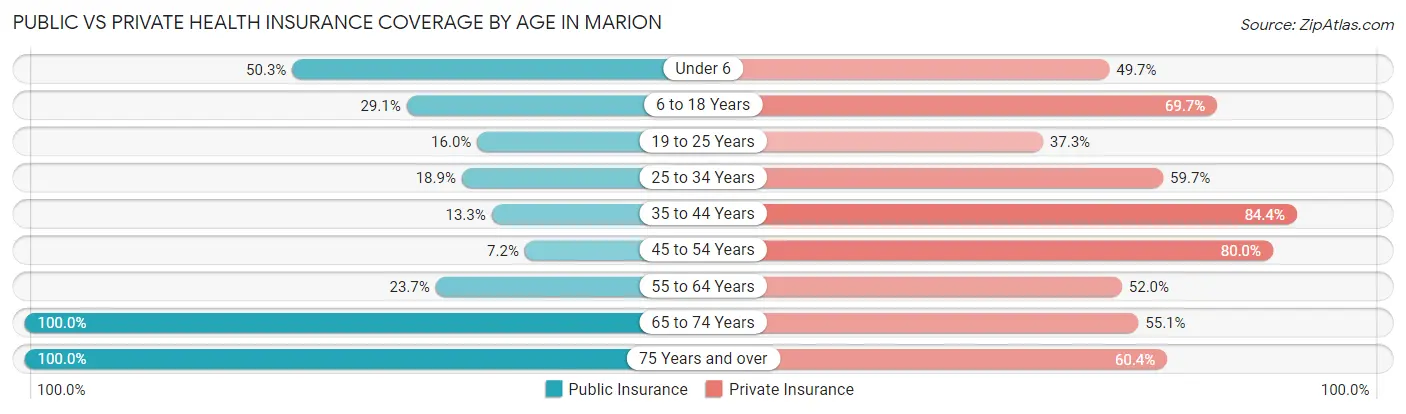
| Age Bracket | Public Insurance | Private Insurance |
| Under 6 | 75 (50.3%) | 74 (49.7%) |
| 6 to 18 Years | 214 (29.1%) | 512 (69.7%) |
| 19 to 25 Years | 24 (16.0%) | 56 (37.3%) |
| 25 to 34 Years | 43 (18.9%) | 136 (59.7%) |
| 35 to 44 Years | 36 (13.3%) | 228 (84.4%) |
| 45 to 54 Years | 19 (7.2%) | 212 (80.0%) |
| 55 to 64 Years | 42 (23.7%) | 92 (52.0%) |
| 65 to 74 Years | 198 (100.0%) | 109 (55.0%) |
| 75 Years and over | 53 (100.0%) | 32 (60.4%) |
| Total | 704 (31.6%) | 1,451 (65.2%) |
Disability Status by Sex by Age in Marion
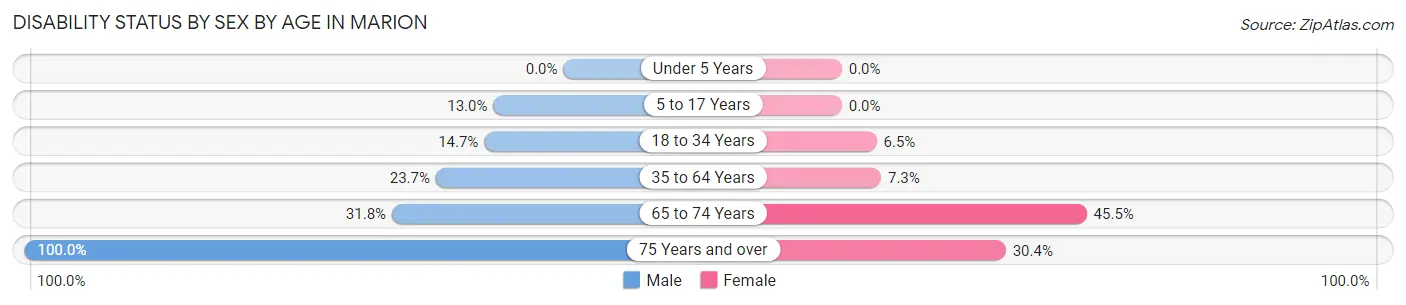
| Age Bracket | Male | Female |
| Under 5 Years | 0 (0.0%) | 0 (0.0%) |
| 5 to 17 Years | 52 (13.0%) | 0 (0.0%) |
| 18 to 34 Years | 21 (14.7%) | 17 (6.5%) |
| 35 to 64 Years | 71 (23.7%) | 30 (7.3%) |
| 65 to 74 Years | 21 (31.8%) | 60 (45.5%) |
| 75 Years and over | 30 (100.0%) | 7 (30.4%) |
Disability Class by Sex by Age in Marion
Disability Class: Hearing Difficulty
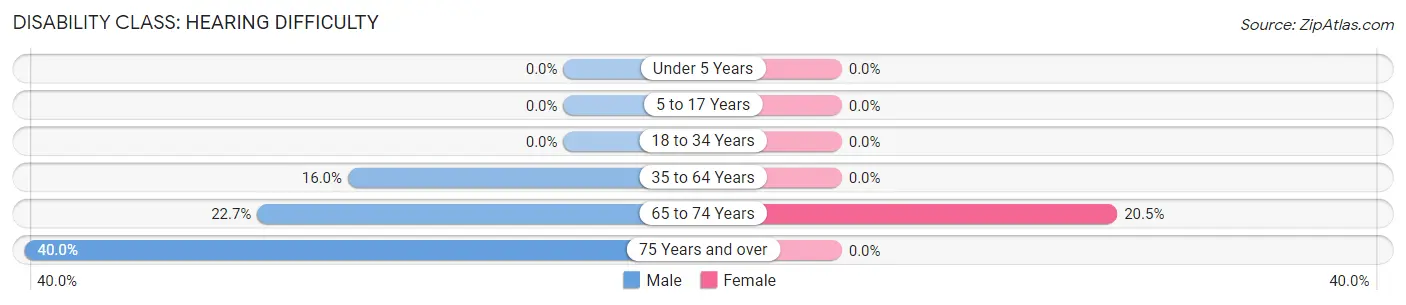
| Age Bracket | Male | Female |
| Under 5 Years | 0 (0.0%) | 0 (0.0%) |
| 5 to 17 Years | 0 (0.0%) | 0 (0.0%) |
| 18 to 34 Years | 0 (0.0%) | 0 (0.0%) |
| 35 to 64 Years | 48 (16.0%) | 0 (0.0%) |
| 65 to 74 Years | 15 (22.7%) | 27 (20.4%) |
| 75 Years and over | 12 (40.0%) | 0 (0.0%) |
Disability Class: Vision Difficulty
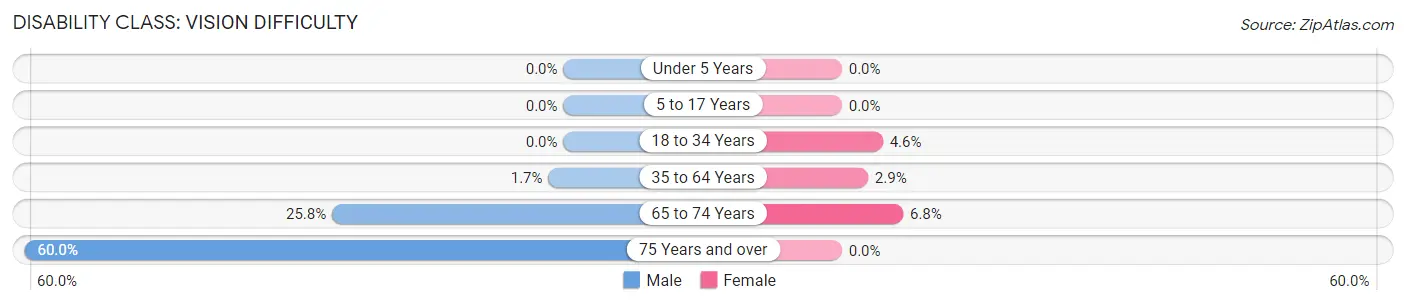
| Age Bracket | Male | Female |
| Under 5 Years | 0 (0.0%) | 0 (0.0%) |
| 5 to 17 Years | 0 (0.0%) | 0 (0.0%) |
| 18 to 34 Years | 0 (0.0%) | 12 (4.6%) |
| 35 to 64 Years | 5 (1.7%) | 12 (2.9%) |
| 65 to 74 Years | 17 (25.8%) | 9 (6.8%) |
| 75 Years and over | 18 (60.0%) | 0 (0.0%) |
Disability Class: Cognitive Difficulty
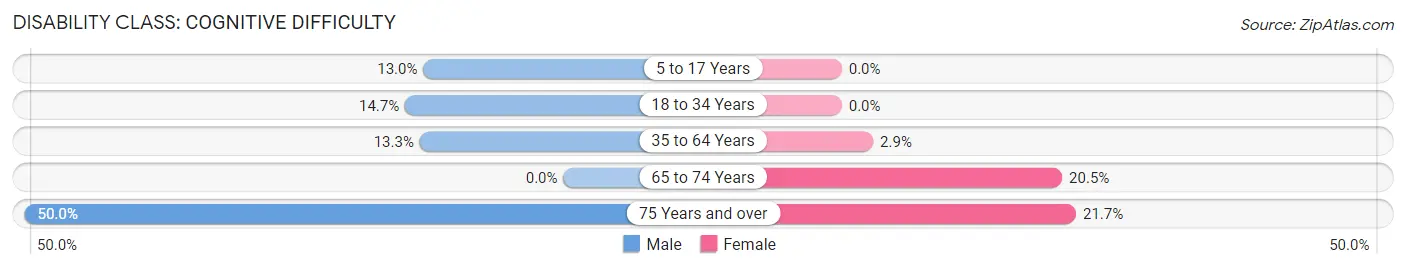
| Age Bracket | Male | Female |
| 5 to 17 Years | 52 (13.0%) | 0 (0.0%) |
| 18 to 34 Years | 21 (14.7%) | 0 (0.0%) |
| 35 to 64 Years | 40 (13.3%) | 12 (2.9%) |
| 65 to 74 Years | 0 (0.0%) | 27 (20.4%) |
| 75 Years and over | 15 (50.0%) | 5 (21.7%) |
Disability Class: Ambulatory Difficulty
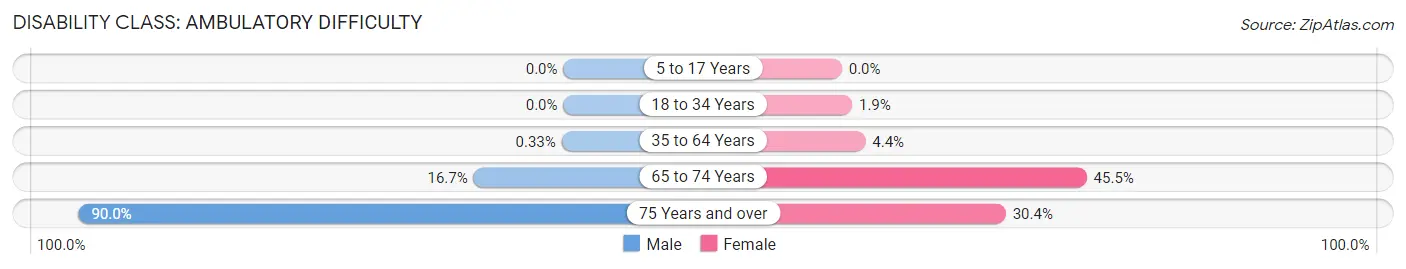
| Age Bracket | Male | Female |
| 5 to 17 Years | 0 (0.0%) | 0 (0.0%) |
| 18 to 34 Years | 0 (0.0%) | 5 (1.9%) |
| 35 to 64 Years | 1 (0.3%) | 18 (4.4%) |
| 65 to 74 Years | 11 (16.7%) | 60 (45.5%) |
| 75 Years and over | 27 (90.0%) | 7 (30.4%) |
Disability Class: Self-Care Difficulty
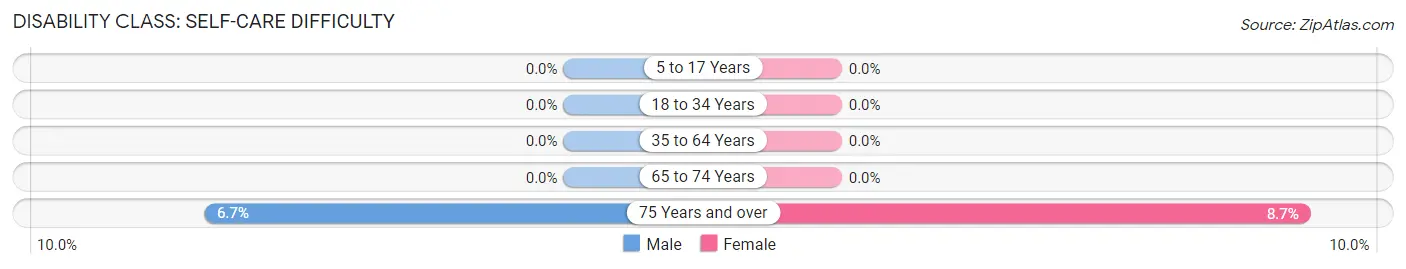
| Age Bracket | Male | Female |
| 5 to 17 Years | 0 (0.0%) | 0 (0.0%) |
| 18 to 34 Years | 0 (0.0%) | 0 (0.0%) |
| 35 to 64 Years | 0 (0.0%) | 0 (0.0%) |
| 65 to 74 Years | 0 (0.0%) | 0 (0.0%) |
| 75 Years and over | 2 (6.7%) | 2 (8.7%) |
Technology Access in Marion
Computing Device Access in Marion
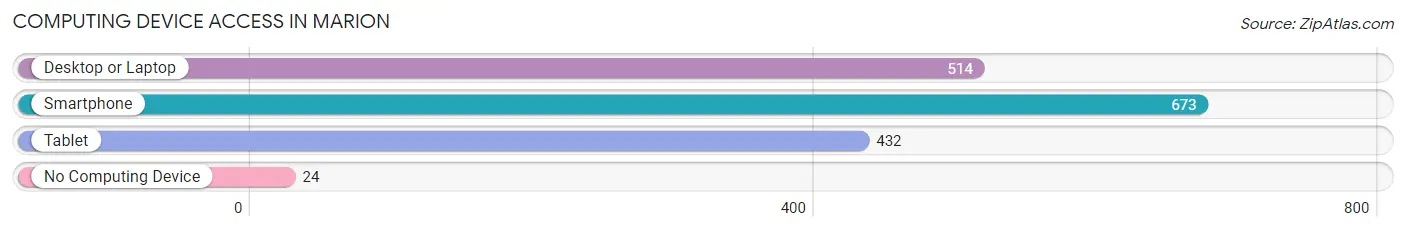
| Device Type | # Households | % Households |
| Desktop or Laptop | 514 | 70.2% |
| Smartphone | 673 | 91.9% |
| Tablet | 432 | 59.0% |
| No Computing Device | 24 | 3.3% |
| Total | 732 | 100.0% |
Internet Access in Marion
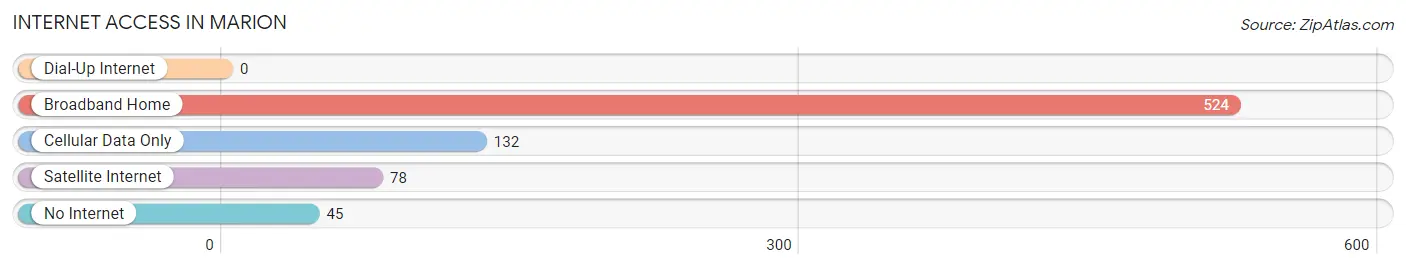
| Internet Type | # Households | % Households |
| Dial-Up Internet | 0 | 0.0% |
| Broadband Home | 524 | 71.6% |
| Cellular Data Only | 132 | 18.0% |
| Satellite Internet | 78 | 10.7% |
| No Internet | 45 | 6.1% |
| Total | 732 | 100.0% |
Marion Summary
Marion, Mississippi is a small town located in the northeast corner of the state, near the border of Alabama. It is the county seat of Perry County and is part of the Hattiesburg, Mississippi Metropolitan Statistical Area. The town has a population of approximately 1,500 people and is known for its rural charm and friendly atmosphere.
Geography
Marion is located in the northeast corner of Mississippi, near the border of Alabama. It is situated in the rolling hills of the Piney Woods region of the state. The town is located on the banks of the Leaf River, which flows through the center of town. The town is surrounded by forests and farmland, and is home to a variety of wildlife.
The climate in Marion is humid subtropical, with hot, humid summers and mild winters. The average annual temperature is around 70 degrees Fahrenheit, with an average high of around 90 degrees in the summer and an average low of around 50 degrees in the winter.
Economy
Marion’s economy is largely based on agriculture and forestry. The town is home to several large farms, as well as a number of smaller family-owned farms. The town is also home to several timber companies, which harvest the surrounding forests for lumber.
In addition to agriculture and forestry, Marion is home to a number of small businesses, including restaurants, retail stores, and service providers. The town is also home to a number of manufacturing companies, which produce a variety of products, including furniture, clothing, and automotive parts.
Demographics
As of the 2010 census, Marion had a population of 1,500 people. The racial makeup of the town was 79.2% White, 17.7% African American, 0.7% Native American, 0.3% Asian, 0.1% Pacific Islander, and 1.9% from other races. Hispanic or Latino of any race were 2.3% of the population.
The median household income in Marion was $30,938, and the median family income was $37,500. The per capita income for the town was $15,945. About 22.2% of families and 25.2% of the population were below the poverty line, including 33.3% of those under age 18 and 16.7% of those age 65 or over.
Marion is a small town with a rich history and a friendly atmosphere. The town is home to a variety of businesses and industries, and is surrounded by beautiful forests and farmland. The town is a great place to live and work, and is a great example of rural Mississippi life.
Common Questions
What is Per Capita Income in Marion?
Per Capita income in Marion is $25,751.
What is the Median Family Income in Marion?
Median Family Income in Marion is $65,272.
What is the Median Household income in Marion?
Median Household Income in Marion is $61,328.
What is Income or Wage Gap in Marion?
Income or Wage Gap in Marion is 61.8%.
Women in Marion earn 38.2 cents for every dollar earned by a man.
What is Inequality or Gini Index in Marion?
Inequality or Gini Index in Marion is 0.48.
What is the Total Population of Marion?
Total Population of Marion is 2,257.
What is the Total Male Population of Marion?
Total Male Population of Marion is 989.
What is the Total Female Population of Marion?
Total Female Population of Marion is 1,268.
What is the Ratio of Males per 100 Females in Marion?
There are 78.00 Males per 100 Females in Marion.
What is the Ratio of Females per 100 Males in Marion?
There are 128.21 Females per 100 Males in Marion.
What is the Median Population Age in Marion?
Median Population Age in Marion is 27.5 Years.
What is the Average Family Size in Marion
Average Family Size in Marion is 3.7 People.
What is the Average Household Size in Marion
Average Household Size in Marion is 3.1 People.
How Large is the Labor Force in Marion?
There are 894 People in the Labor Forcein in Marion.
What is the Percentage of People in the Labor Force in Marion?
59.8% of People are in the Labor Force in Marion.
What is the Unemployment Rate in Marion?
Unemployment Rate in Marion is 5.7%.