DeLisle, MS Map & Demographics
DeLisle Map
DeLisle Overview
$27,172
PER CAPITA INCOME
$107,917
AVG FAMILY INCOME
$89,274
AVG HOUSEHOLD INCOME
0.40
INEQUALITY / GINI INDEX
1,583
TOTAL POPULATION
848
MALE POPULATION
735
FEMALE POPULATION
115.37
MALES / 100 FEMALES
86.67
FEMALES / 100 MALES
25.8
MEDIAN AGE
3.8
AVG FAMILY SIZE
3.5
AVG HOUSEHOLD SIZE
680
LABOR FORCE [ PEOPLE ]
56.4%
PERCENT IN LABOR FORCE
Income in DeLisle
Income Overview in DeLisle
Per Capita Income in DeLisle is $27,172, while median incomes of families and households are $107,917 and $89,274 respectively.
| Characteristic | Number | Measure |
| Per Capita Income | 1,583 | $27,172 |
| Median Family Income | 413 | $107,917 |
| Mean Family Income | 413 | $100,208 |
| Median Household Income | 448 | $89,274 |
| Mean Household Income | 448 | $93,860 |
| Income Deficit | 413 | $0 |
| Wage / Income Gap (%) | 1,583 | 0.00% |
| Wage / Income Gap ($) | 1,583 | 100.00¢ per $1 |
| Gini / Inequality Index | 1,583 | 0.40 |
Earnings by Sex in DeLisle
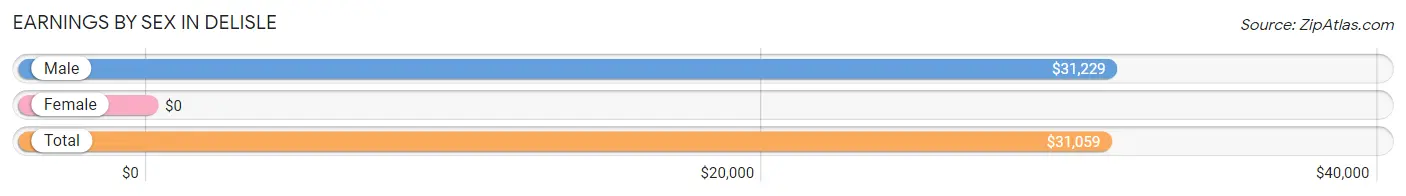
| Sex | Number | Average Earnings |
| Male | 334 (44.7%) | $31,229 |
| Female | 414 (55.3%) | $0 |
| Total | 748 (100.0%) | $31,059 |
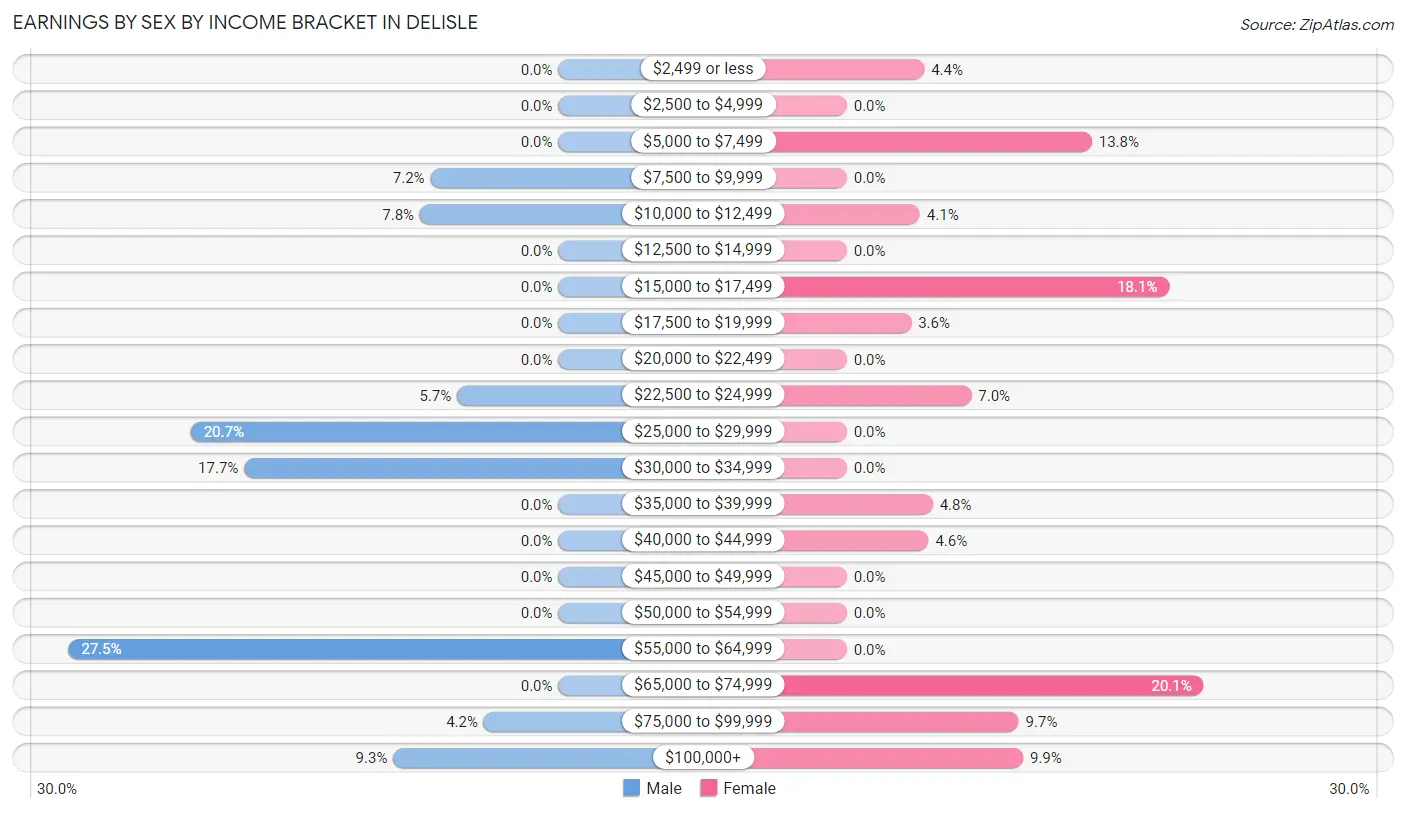
Earnings by Sex by Income Bracket in DeLisle
The most common earnings brackets in DeLisle are $55,000 to $64,999 for men (92 | 27.5%) and $65,000 to $74,999 for women (83 | 20.1%).
| Income | Male | Female |
| $2,499 or less | 0 (0.0%) | 18 (4.3%) |
| $2,500 to $4,999 | 0 (0.0%) | 0 (0.0%) |
| $5,000 to $7,499 | 0 (0.0%) | 57 (13.8%) |
| $7,500 to $9,999 | 24 (7.2%) | 0 (0.0%) |
| $10,000 to $12,499 | 26 (7.8%) | 17 (4.1%) |
| $12,500 to $14,999 | 0 (0.0%) | 0 (0.0%) |
| $15,000 to $17,499 | 0 (0.0%) | 75 (18.1%) |
| $17,500 to $19,999 | 0 (0.0%) | 15 (3.6%) |
| $20,000 to $22,499 | 0 (0.0%) | 0 (0.0%) |
| $22,500 to $24,999 | 19 (5.7%) | 29 (7.0%) |
| $25,000 to $29,999 | 69 (20.7%) | 0 (0.0%) |
| $30,000 to $34,999 | 59 (17.7%) | 0 (0.0%) |
| $35,000 to $39,999 | 0 (0.0%) | 20 (4.8%) |
| $40,000 to $44,999 | 0 (0.0%) | 19 (4.6%) |
| $45,000 to $49,999 | 0 (0.0%) | 0 (0.0%) |
| $50,000 to $54,999 | 0 (0.0%) | 0 (0.0%) |
| $55,000 to $64,999 | 92 (27.5%) | 0 (0.0%) |
| $65,000 to $74,999 | 0 (0.0%) | 83 (20.1%) |
| $75,000 to $99,999 | 14 (4.2%) | 40 (9.7%) |
| $100,000+ | 31 (9.3%) | 41 (9.9%) |
| Total | 334 (100.0%) | 414 (100.0%) |
Earnings by Sex by Educational Attainment in DeLisle
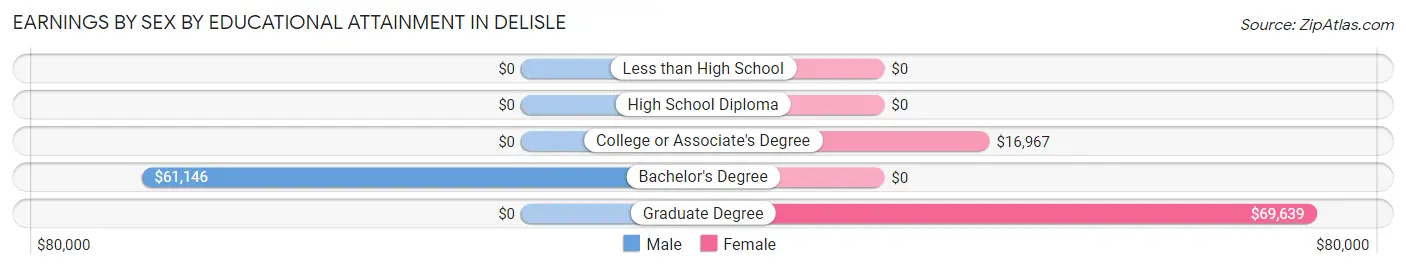
| Educational Attainment | Male Income | Female Income |
| Less than High School | - | - |
| High School Diploma | - | - |
| College or Associate's Degree | - | - |
| Bachelor's Degree | $61,146 | $0 |
| Graduate Degree | - | - |
| Total | $60,903 | $0 |
Family Income in DeLisle
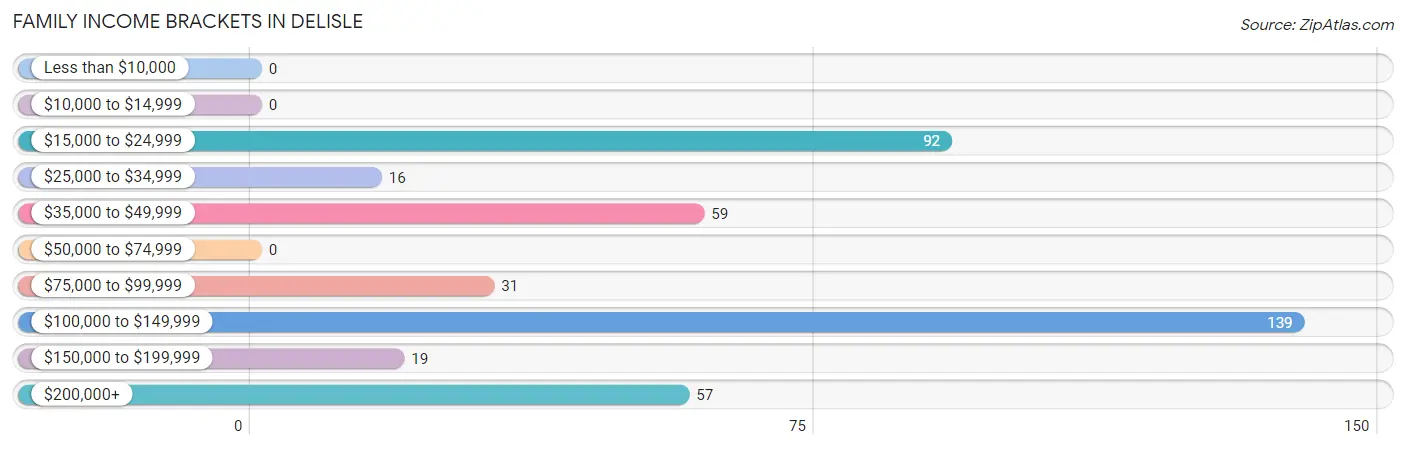
Family Income Brackets in DeLisle
According to the DeLisle family income data, there are 139 families falling into the $100,000 to $149,999 income range, which is the most common income bracket and makes up 33.7% of all families.
| Income Bracket | # Families | % Families |
| Less than $10,000 | 0 | 0.0% |
| $10,000 to $14,999 | 0 | 0.0% |
| $15,000 to $24,999 | 92 | 22.3% |
| $25,000 to $34,999 | 16 | 3.9% |
| $35,000 to $49,999 | 59 | 14.3% |
| $50,000 to $74,999 | 0 | 0.0% |
| $75,000 to $99,999 | 31 | 7.5% |
| $100,000 to $149,999 | 139 | 33.7% |
| $150,000 to $199,999 | 19 | 4.6% |
| $200,000+ | 57 | 13.8% |
Family Income by Famaliy Size in DeLisle
| Income Bracket | # Families | Median Income |
| 2-Person Families | 123 (29.8%) | $0 |
| 3-Person Families | 146 (35.3%) | $0 |
| 4-Person Families | 0 (0.0%) | $0 |
| 5-Person Families | 123 (29.8%) | $0 |
| 6-Person Families | 0 (0.0%) | $0 |
| 7+ Person Families | 21 (5.1%) | $0 |
| Total | 413 (100.0%) | $107,917 |
Family Income by Number of Earners in DeLisle
| Number of Earners | # Families | Median Income |
| No Earners | 63 (15.2%) | $0 |
| 1 Earner | 65 (15.7%) | $0 |
| 2 Earners | 226 (54.7%) | $0 |
| 3+ Earners | 59 (14.3%) | $0 |
| Total | 413 (100.0%) | $107,917 |
Household Income in DeLisle
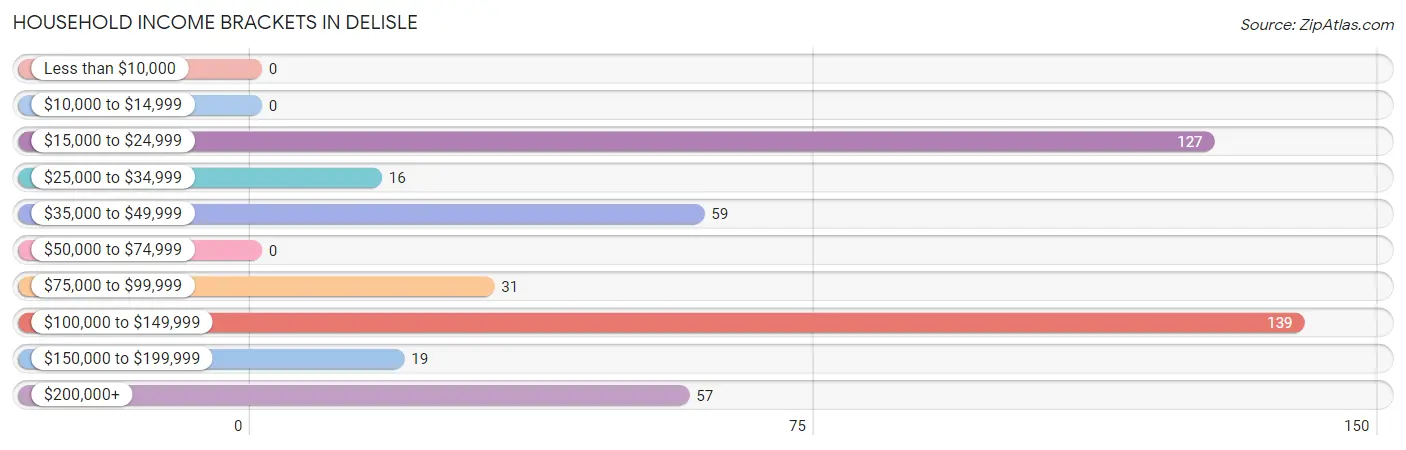
Household Income Brackets in DeLisle
With 139 households falling in the category, the $100,000 to $149,999 income range is the most frequent in DeLisle, accounting for 31.0% of all households.
| Income Bracket | # Households | % Households |
| Less than $10,000 | 0 | 0.0% |
| $10,000 to $14,999 | 0 | 0.0% |
| $15,000 to $24,999 | 127 | 28.3% |
| $25,000 to $34,999 | 16 | 3.6% |
| $35,000 to $49,999 | 59 | 13.2% |
| $50,000 to $74,999 | 0 | 0.0% |
| $75,000 to $99,999 | 31 | 6.9% |
| $100,000 to $149,999 | 139 | 31.0% |
| $150,000 to $199,999 | 19 | 4.2% |
| $200,000+ | 57 | 12.7% |
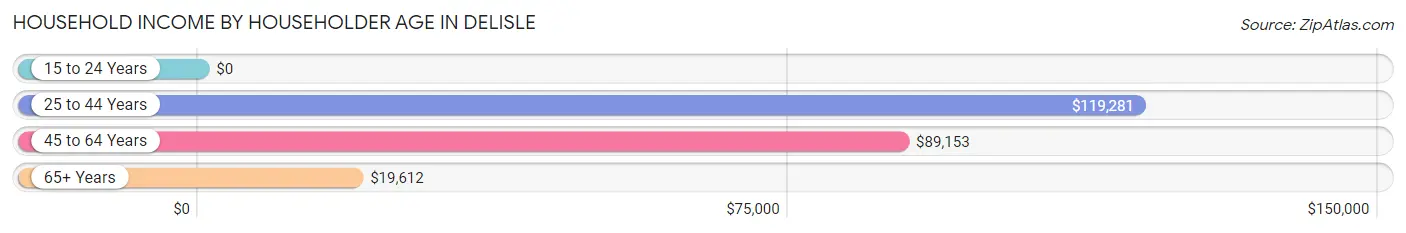
Household Income by Householder Age in DeLisle
The median household income in DeLisle is $89,274, with the highest median household income of $119,281 found in the 25 to 44 years age bracket for the primary householder. A total of 189 households (42.2%) fall into this category.
| Income Bracket | # Households | Median Income |
| 15 to 24 Years | 0 (0.0%) | $0 |
| 25 to 44 Years | 189 (42.2%) | $119,281 |
| 45 to 64 Years | 161 (35.9%) | $89,153 |
| 65+ Years | 98 (21.9%) | $19,612 |
| Total | 448 (100.0%) | $89,274 |
Poverty in DeLisle
Income Below Poverty by Sex and Age in DeLisle
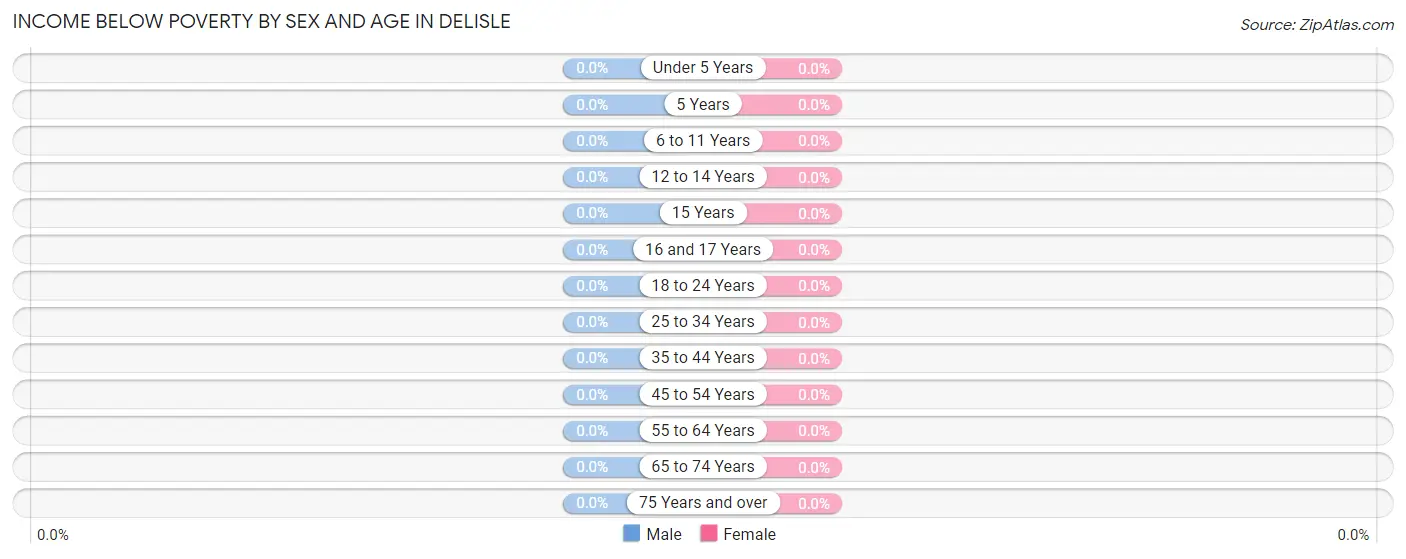
| Age Bracket | Male | Female |
| Under 5 Years | 0 (0.0%) | 0 (0.0%) |
| 5 Years | 0 (0.0%) | 0 (0.0%) |
| 6 to 11 Years | 0 (0.0%) | 0 (0.0%) |
| 12 to 14 Years | 0 (0.0%) | 0 (0.0%) |
| 15 Years | 0 (0.0%) | 0 (0.0%) |
| 16 and 17 Years | 0 (0.0%) | 0 (0.0%) |
| 18 to 24 Years | 0 (0.0%) | 0 (0.0%) |
| 25 to 34 Years | 0 (0.0%) | 0 (0.0%) |
| 35 to 44 Years | 0 (0.0%) | 0 (0.0%) |
| 45 to 54 Years | 0 (0.0%) | 0 (0.0%) |
| 55 to 64 Years | 0 (0.0%) | 0 (0.0%) |
| 65 to 74 Years | 0 (0.0%) | 0 (0.0%) |
| 75 Years and over | 0 (0.0%) | 0 (0.0%) |
| Total | 0 (0.0%) | 0 (0.0%) |
Income Above Poverty by Sex and Age in DeLisle
According to the poverty statistics in DeLisle, males aged under 5 years and females aged under 5 years are the age groups that are most secure financially, with 100.0% of males and 100.0% of females in these age groups living above the poverty line.
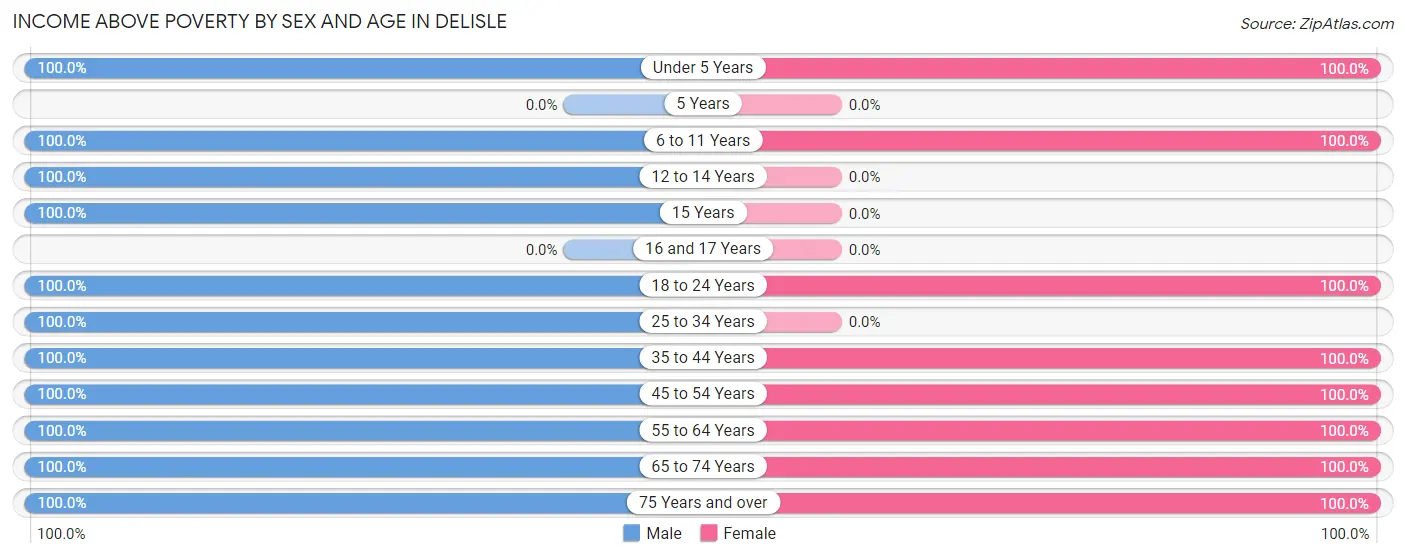
| Age Bracket | Male | Female |
| Under 5 Years | 60 (100.0%) | 22 (100.0%) |
| 5 Years | 0 (0.0%) | 0 (0.0%) |
| 6 to 11 Years | 95 (100.0%) | 92 (100.0%) |
| 12 to 14 Years | 71 (100.0%) | 0 (0.0%) |
| 15 Years | 38 (100.0%) | 0 (0.0%) |
| 16 and 17 Years | 0 (0.0%) | 0 (0.0%) |
| 18 to 24 Years | 197 (100.0%) | 103 (100.0%) |
| 25 to 34 Years | 161 (100.0%) | 0 (0.0%) |
| 35 to 44 Years | 99 (100.0%) | 200 (100.0%) |
| 45 to 54 Years | 70 (100.0%) | 152 (100.0%) |
| 55 to 64 Years | 30 (100.0%) | 44 (100.0%) |
| 65 to 74 Years | 13 (100.0%) | 98 (100.0%) |
| 75 Years and over | 14 (100.0%) | 24 (100.0%) |
| Total | 848 (100.0%) | 735 (100.0%) |
Income Below Poverty Among Married-Couple Families in DeLisle
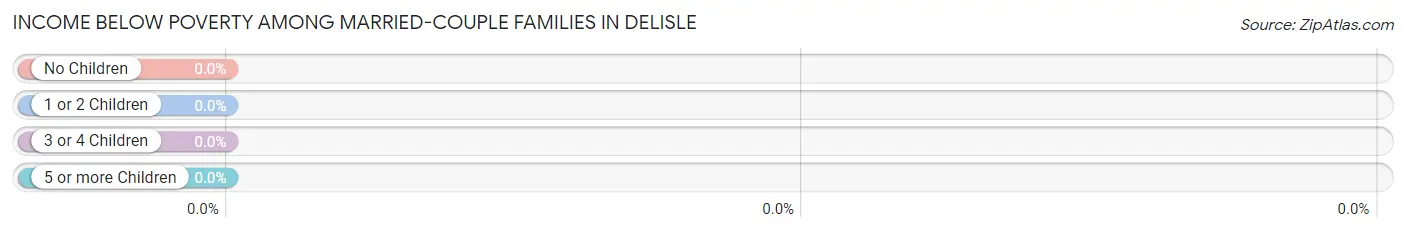
| Children | Above Poverty | Below Poverty |
| No Children | 89 (100.0%) | 0 (0.0%) |
| 1 or 2 Children | 13 (100.0%) | 0 (0.0%) |
| 3 or 4 Children | 104 (100.0%) | 0 (0.0%) |
| 5 or more Children | 0 (0.0%) | 0 (0.0%) |
| Total | 206 (100.0%) | 0 (0.0%) |
Income Below Poverty Among Single-Parent Households in DeLisle
| Children | Single Father | Single Mother |
| No Children | 0 (0.0%) | 0 (0.0%) |
| 1 or 2 Children | 0 (0.0%) | 0 (0.0%) |
| 3 or 4 Children | 0 (0.0%) | 0 (0.0%) |
| 5 or more Children | 0 (0.0%) | 0 (0.0%) |
| Total | 0 (0.0%) | 0 (0.0%) |
Income Below Poverty Among Married-Couple vs Single-Parent Households in DeLisle
| Children | Married-Couple Families | Single-Parent Households |
| No Children | 0 (0.0%) | 0 (0.0%) |
| 1 or 2 Children | 0 (0.0%) | 0 (0.0%) |
| 3 or 4 Children | 0 (0.0%) | 0 (0.0%) |
| 5 or more Children | 0 (0.0%) | 0 (0.0%) |
| Total | 0 (0.0%) | 0 (0.0%) |
Race in DeLisle
The most populous races in DeLisle are White / Caucasian (852 | 53.8%), Black / African American (700 | 44.2%), and Hispanic or Latino (173 | 10.9%).
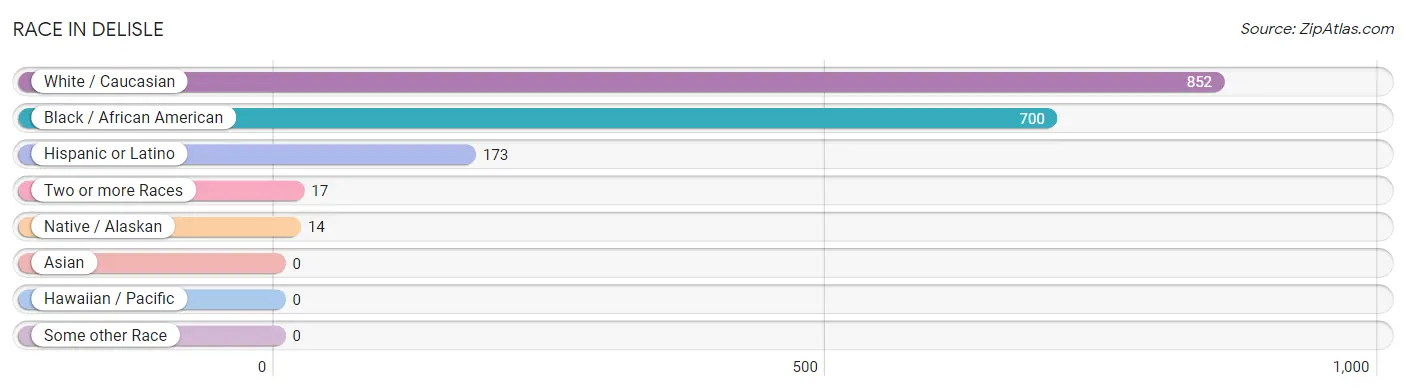
| Race | # Population | % Population |
| Asian | 0 | 0.0% |
| Black / African American | 700 | 44.2% |
| Hawaiian / Pacific | 0 | 0.0% |
| Hispanic or Latino | 173 | 10.9% |
| Native / Alaskan | 14 | 0.9% |
| White / Caucasian | 852 | 53.8% |
| Two or more Races | 17 | 1.1% |
| Some other Race | 0 | 0.0% |
| Total | 1,583 | 100.0% |
Ancestry in DeLisle
The most populous ancestries reported in DeLisle are Irish (276 | 17.4%), French (106 | 6.7%), Mexican (83 | 5.2%), Central American (69 | 4.4%), and Honduran (69 | 4.4%), together accounting for 38.1% of all DeLisle residents.
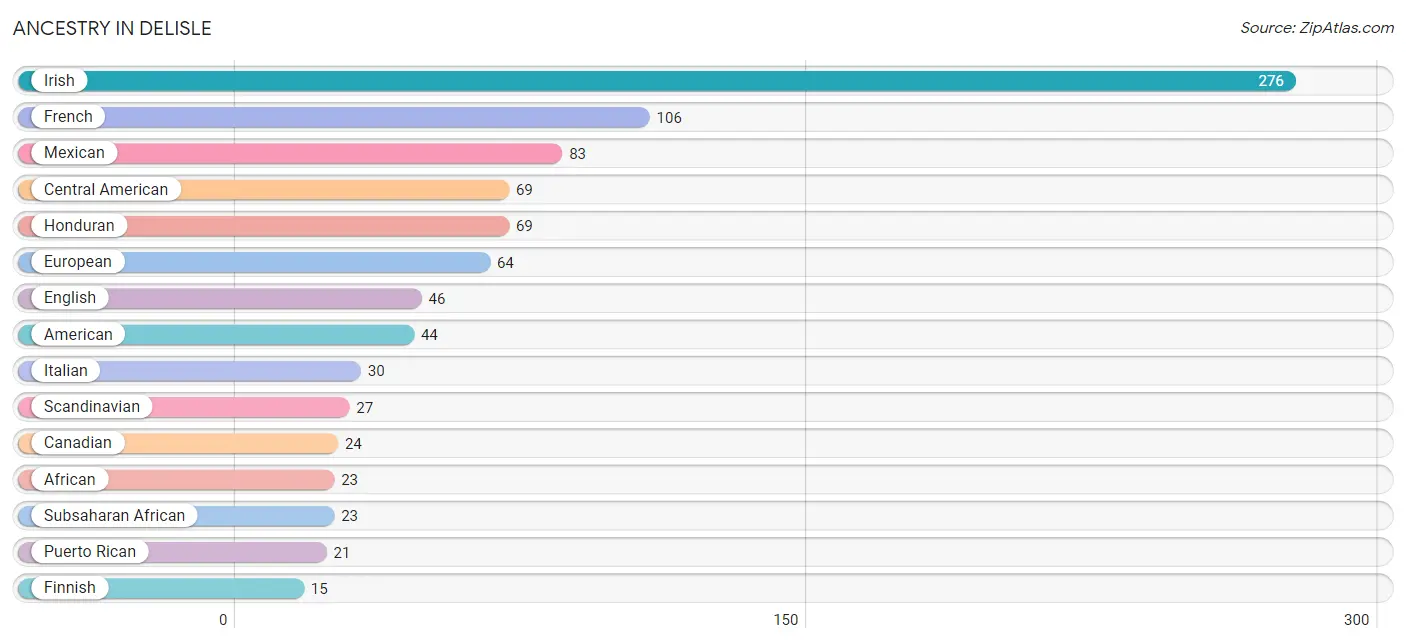
| Ancestry | # Population | % Population |
| African | 23 | 1.5% |
| American | 44 | 2.8% |
| Canadian | 24 | 1.5% |
| Central American | 69 | 4.4% |
| Creek | 14 | 0.9% |
| English | 46 | 2.9% |
| European | 64 | 4.0% |
| Finnish | 15 | 0.9% |
| French | 106 | 6.7% |
| Honduran | 69 | 4.4% |
| Irish | 276 | 17.4% |
| Italian | 30 | 1.9% |
| Mexican | 83 | 5.2% |
| Puerto Rican | 21 | 1.3% |
| Scandinavian | 27 | 1.7% |
| Subsaharan African | 23 | 1.5% | View All 16 Rows |
Immigrants in DeLisle

| Immigration Origin | # Population | % Population | View All 0 Rows |
Sex and Age in DeLisle
Sex and Age in DeLisle
The most populous age groups in DeLisle are 20 to 24 Years (177 | 20.9%) for men and 40 to 44 Years (189 | 25.7%) for women.
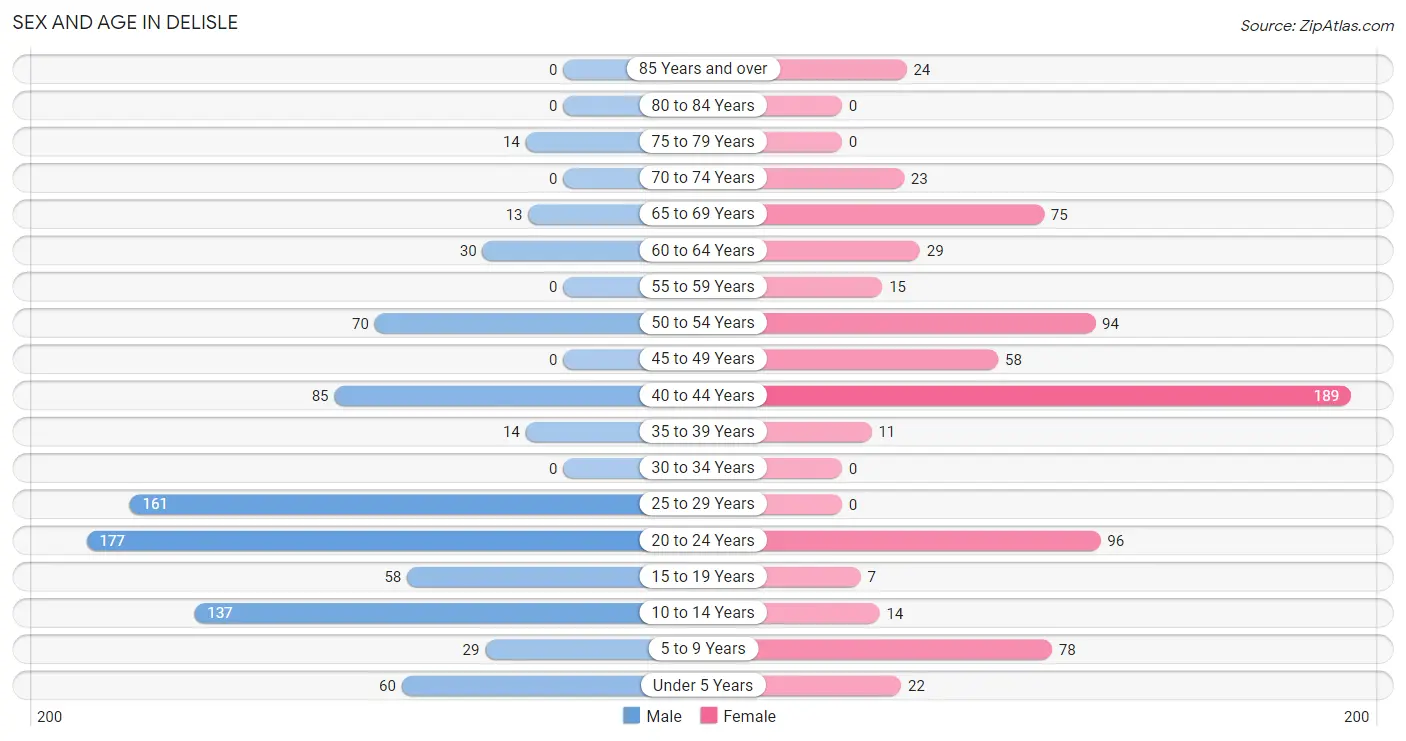
| Age Bracket | Male | Female |
| Under 5 Years | 60 (7.1%) | 22 (3.0%) |
| 5 to 9 Years | 29 (3.4%) | 78 (10.6%) |
| 10 to 14 Years | 137 (16.2%) | 14 (1.9%) |
| 15 to 19 Years | 58 (6.8%) | 7 (0.9%) |
| 20 to 24 Years | 177 (20.9%) | 96 (13.1%) |
| 25 to 29 Years | 161 (19.0%) | 0 (0.0%) |
| 30 to 34 Years | 0 (0.0%) | 0 (0.0%) |
| 35 to 39 Years | 14 (1.7%) | 11 (1.5%) |
| 40 to 44 Years | 85 (10.0%) | 189 (25.7%) |
| 45 to 49 Years | 0 (0.0%) | 58 (7.9%) |
| 50 to 54 Years | 70 (8.3%) | 94 (12.8%) |
| 55 to 59 Years | 0 (0.0%) | 15 (2.0%) |
| 60 to 64 Years | 30 (3.5%) | 29 (4.0%) |
| 65 to 69 Years | 13 (1.5%) | 75 (10.2%) |
| 70 to 74 Years | 0 (0.0%) | 23 (3.1%) |
| 75 to 79 Years | 14 (1.7%) | 0 (0.0%) |
| 80 to 84 Years | 0 (0.0%) | 0 (0.0%) |
| 85 Years and over | 0 (0.0%) | 24 (3.3%) |
| Total | 848 (100.0%) | 735 (100.0%) |
Families and Households in DeLisle
Median Family Size in DeLisle
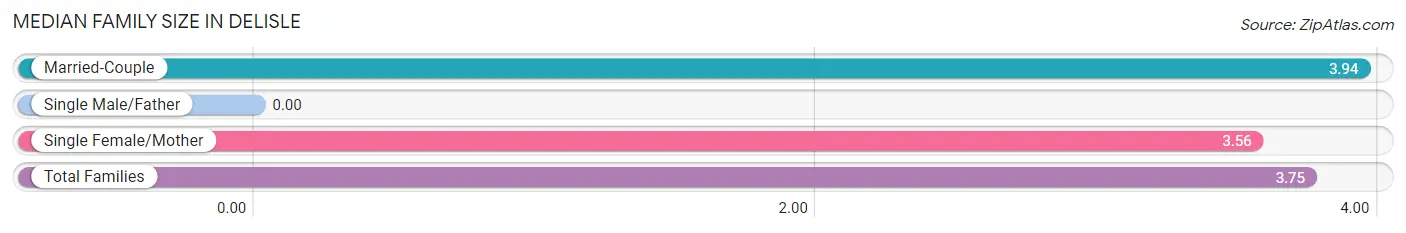
| Family Type | # Families | Family Size |
| Married-Couple | 206 (49.9%) | 3.94 |
| Single Male/Father | 0 (0.0%) | - |
| Single Female/Mother | 207 (50.1%) | 3.56 |
| Total Families | 413 (100.0%) | 3.75 |
Median Household Size in DeLisle
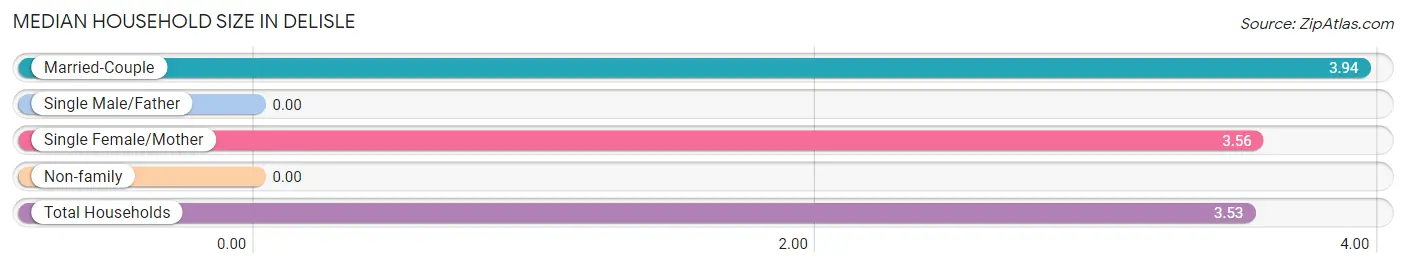
| Household Type | # Households | Household Size |
| Married-Couple | 206 (46.0%) | 3.94 |
| Single Male/Father | 0 (0.0%) | - |
| Single Female/Mother | 207 (46.2%) | 3.56 |
| Non-family | 35 (7.8%) | - |
| Total Households | 448 (100.0%) | 3.53 |
Household Size by Marriage Status in DeLisle
Out of a total of 448 households in DeLisle, 413 (92.2%) are family households, while 35 (7.8%) are nonfamily households. The most numerous type of family households are 3-person households, comprising 146, and the most common type of nonfamily households are 1-person households, comprising 35.
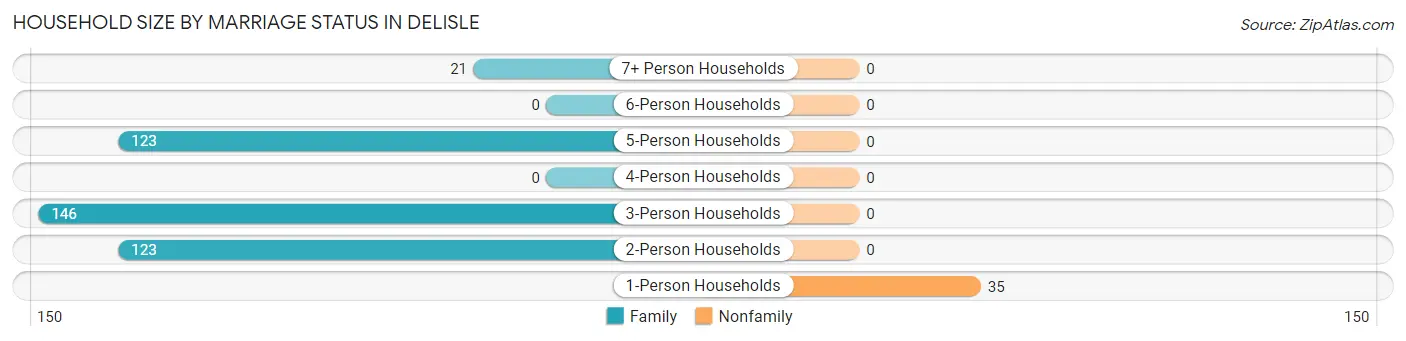
| Household Size | Family Households | Nonfamily Households |
| 1-Person Households | - | 35 (7.8%) |
| 2-Person Households | 123 (27.5%) | 0 (0.0%) |
| 3-Person Households | 146 (32.6%) | 0 (0.0%) |
| 4-Person Households | 0 (0.0%) | 0 (0.0%) |
| 5-Person Households | 123 (27.5%) | 0 (0.0%) |
| 6-Person Households | 0 (0.0%) | 0 (0.0%) |
| 7+ Person Households | 21 (4.7%) | 0 (0.0%) |
| Total | 413 (92.2%) | 35 (7.8%) |
Female Fertility in DeLisle
Fertility by Age in DeLisle
| Age Bracket | Women with Births | Births / 1,000 Women |
| 15 to 19 years | 0 (0.0%) | 0.0 |
| 20 to 34 years | 0 (0.0%) | 0.0 |
| 35 to 50 years | 0 (0.0%) | 0.0 |
| Total | 0 (0.0%) | 0.0 |
Fertility by Age by Marriage Status in DeLisle
| Age Bracket | Married | Unmarried |
| 15 to 19 years | 0 (0.0%) | 0 (0.0%) |
| 20 to 34 years | 0 (0.0%) | 0 (0.0%) |
| 35 to 50 years | 0 (0.0%) | 0 (0.0%) |
| Total | 0 (0.0%) | 0 (0.0%) |
Fertility by Education in DeLisle
| Educational Attainment | Women with Births | Births / 1,000 Women |
| Less than High School | 0 (0.0%) | 0.0 |
| High School Diploma | 0 (0.0%) | 0.0 |
| College or Associate's Degree | 0 (0.0%) | 0.0 |
| Bachelor's Degree | 0 (0.0%) | 0.0 |
| Graduate Degree | 0 (0.0%) | 0.0 |
| Total | 0 (0.0%) | 0.0 |
Fertility by Education by Marriage Status in DeLisle
| Educational Attainment | Married | Unmarried |
| Less than High School | 0 (0.0%) | 0 (0.0%) |
| High School Diploma | 0 (0.0%) | 0 (0.0%) |
| College or Associate's Degree | 0 (0.0%) | 0 (0.0%) |
| Bachelor's Degree | 0 (0.0%) | 0 (0.0%) |
| Graduate Degree | 0 (0.0%) | 0 (0.0%) |
| Total | 0 (0.0%) | 0 (0.0%) |
Employment Characteristics in DeLisle
Employment by Class of Employer in DeLisle
Among the 606 employed individuals in DeLisle, private company employees (306 | 50.5%), local government employees (155 | 25.6%), and state government employees (101 | 16.7%) make up the most common classes of employment.
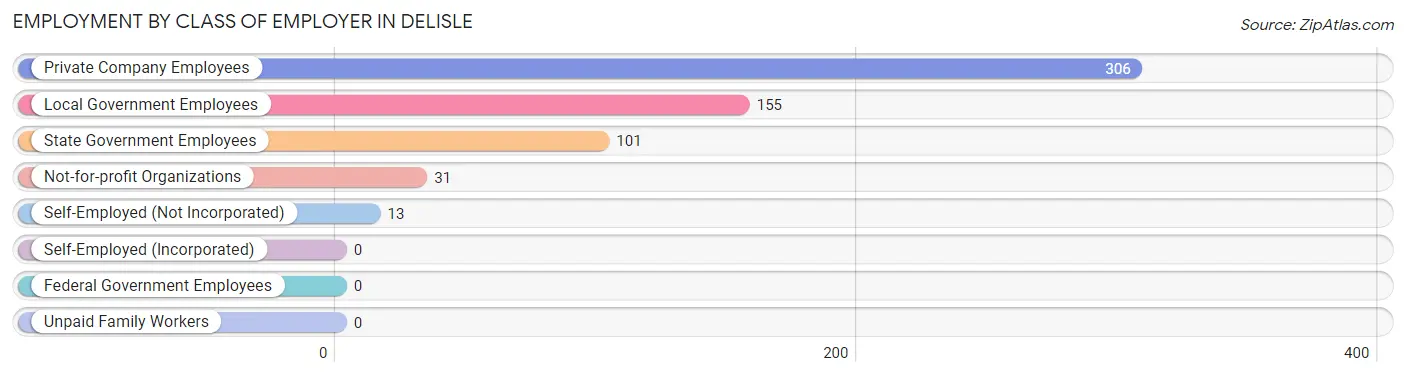
| Employer Class | # Employees | % Employees |
| Private Company Employees | 306 | 50.5% |
| Self-Employed (Incorporated) | 0 | 0.0% |
| Self-Employed (Not Incorporated) | 13 | 2.1% |
| Not-for-profit Organizations | 31 | 5.1% |
| Local Government Employees | 155 | 25.6% |
| State Government Employees | 101 | 16.7% |
| Federal Government Employees | 0 | 0.0% |
| Unpaid Family Workers | 0 | 0.0% |
| Total | 606 | 100.0% |
Employment Status by Age in DeLisle
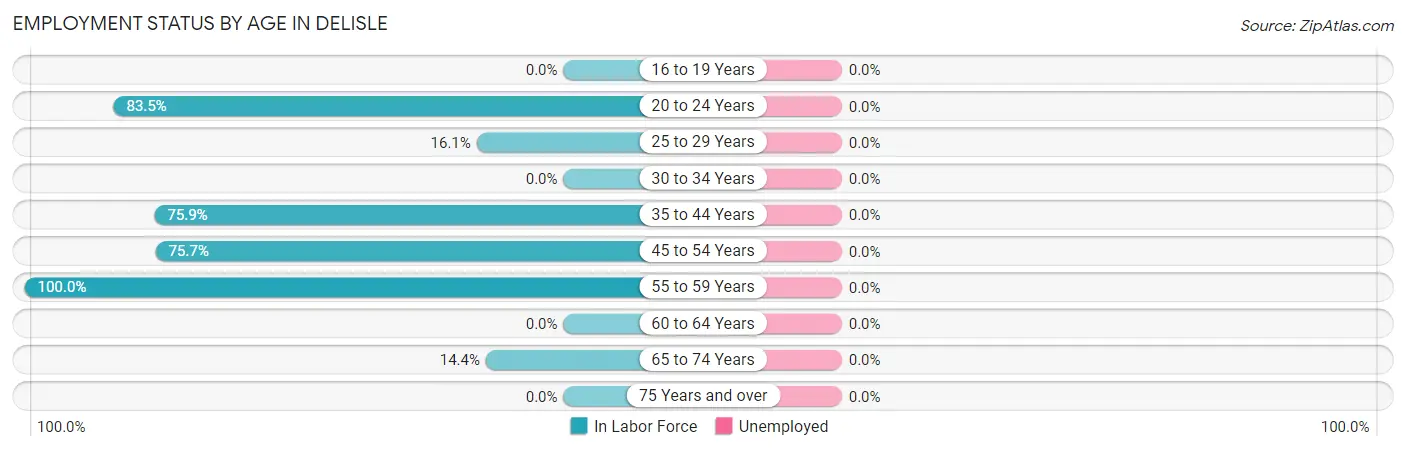
| Age Bracket | In Labor Force | Unemployed |
| 16 to 19 Years | 0 (0.0%) | 0 (0.0%) |
| 20 to 24 Years | 228 (83.5%) | 0 (0.0%) |
| 25 to 29 Years | 26 (16.1%) | 0 (0.0%) |
| 30 to 34 Years | 0 (0.0%) | 0 (0.0%) |
| 35 to 44 Years | 227 (75.9%) | 0 (0.0%) |
| 45 to 54 Years | 168 (75.7%) | 0 (0.0%) |
| 55 to 59 Years | 15 (100.0%) | 0 (0.0%) |
| 60 to 64 Years | 0 (0.0%) | 0 (0.0%) |
| 65 to 74 Years | 16 (14.4%) | 0 (0.0%) |
| 75 Years and over | 0 (0.0%) | 0 (0.0%) |
| Total | 680 (56.4%) | 0 (0.0%) |
Employment Status by Educational Attainment in DeLisle
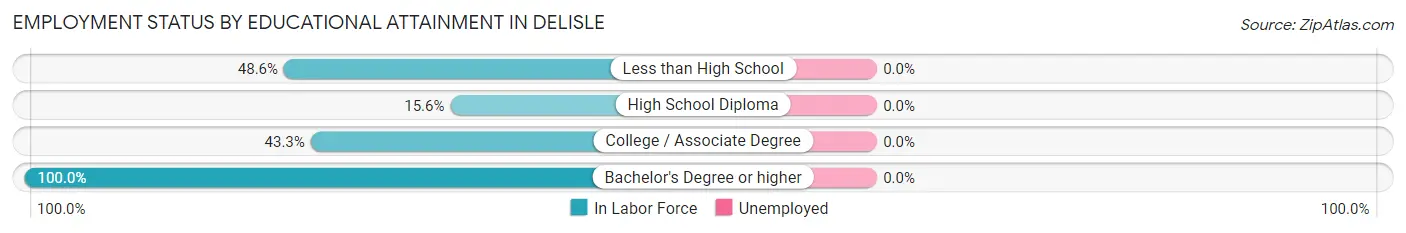
| Educational Attainment | In Labor Force | Unemployed |
| Less than High School | 18 (48.6%) | 0 (0.0%) |
| High School Diploma | 33 (15.6%) | 0 (0.0%) |
| College / Associate Degree | 94 (43.3%) | 0 (0.0%) |
| Bachelor's Degree or higher | 291 (100.0%) | 0 (0.0%) |
| Total | 436 (57.7%) | 0 (0.0%) |
Employment Occupations by Sex in DeLisle
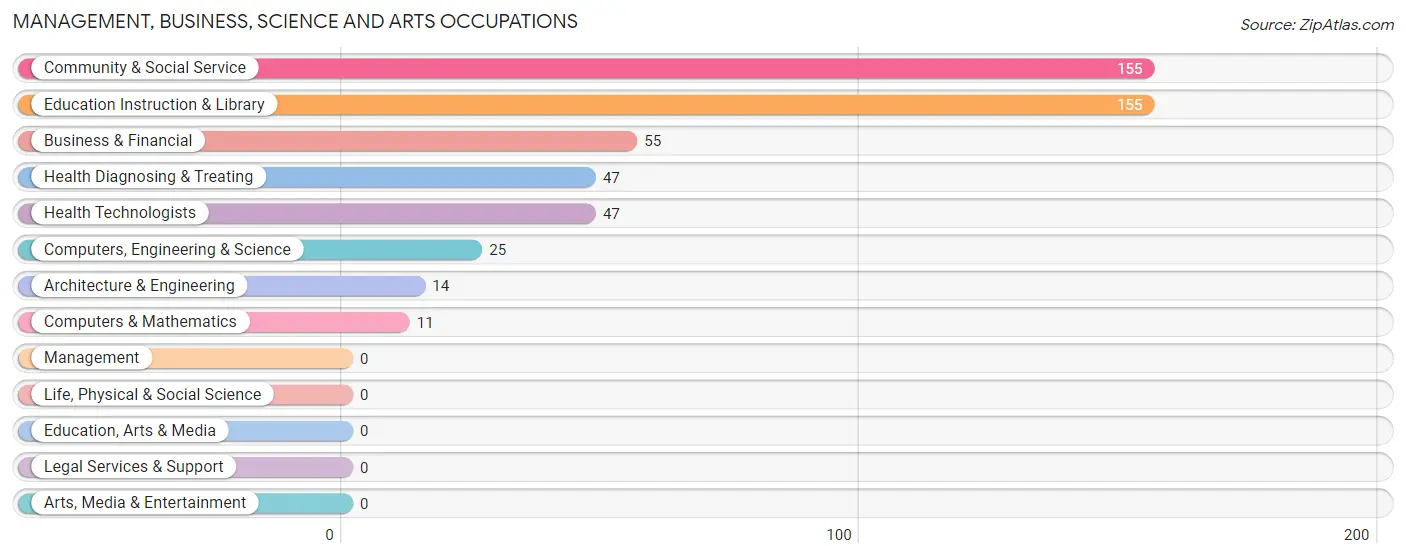
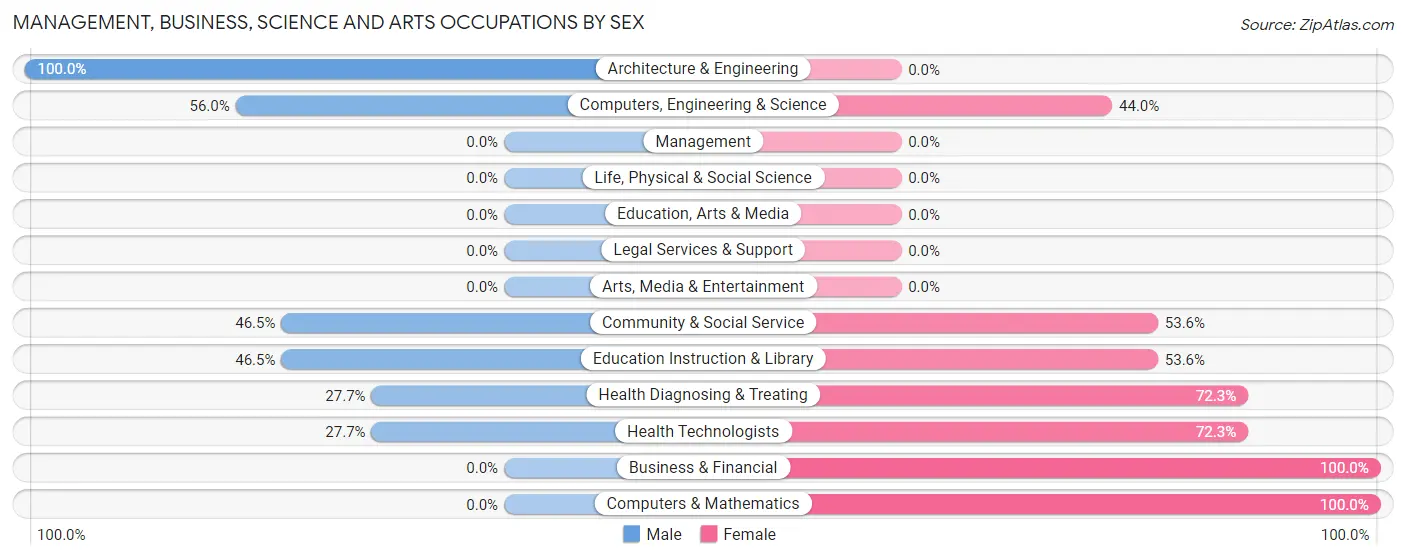
Management, Business, Science and Arts Occupations
The most common Management, Business, Science and Arts occupations in DeLisle are Community & Social Service (155 | 22.8%), Education Instruction & Library (155 | 22.8%), Business & Financial (55 | 8.1%), Health Diagnosing & Treating (47 | 6.9%), and Health Technologists (47 | 6.9%).
Management, Business, Science and Arts Occupations by Sex
Within the Management, Business, Science and Arts occupations in DeLisle, the most male-oriented occupations are Architecture & Engineering (100.0%), Computers, Engineering & Science (56.0%), and Community & Social Service (46.5%), while the most female-oriented occupations are Business & Financial (100.0%), Computers & Mathematics (100.0%), and Health Diagnosing & Treating (72.3%).
| Occupation | Male | Female |
| Management | 0 (0.0%) | 0 (0.0%) |
| Business & Financial | 0 (0.0%) | 55 (100.0%) |
| Computers, Engineering & Science | 14 (56.0%) | 11 (44.0%) |
| Computers & Mathematics | 0 (0.0%) | 11 (100.0%) |
| Architecture & Engineering | 14 (100.0%) | 0 (0.0%) |
| Life, Physical & Social Science | 0 (0.0%) | 0 (0.0%) |
| Community & Social Service | 72 (46.5%) | 83 (53.5%) |
| Education, Arts & Media | 0 (0.0%) | 0 (0.0%) |
| Legal Services & Support | 0 (0.0%) | 0 (0.0%) |
| Education Instruction & Library | 72 (46.5%) | 83 (53.5%) |
| Arts, Media & Entertainment | 0 (0.0%) | 0 (0.0%) |
| Health Diagnosing & Treating | 13 (27.7%) | 34 (72.3%) |
| Health Technologists | 13 (27.7%) | 34 (72.3%) |
| Total (Category) | 99 (35.1%) | 183 (64.9%) |
| Total (Overall) | 334 (49.1%) | 346 (50.9%) |
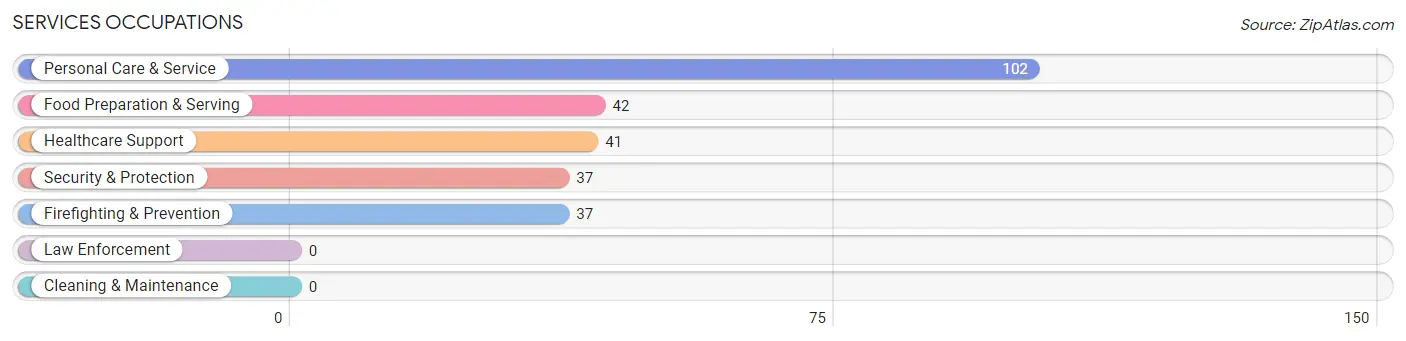
Services Occupations
The most common Services occupations in DeLisle are Personal Care & Service (102 | 15.0%), Food Preparation & Serving (42 | 6.2%), Healthcare Support (41 | 6.0%), Security & Protection (37 | 5.4%), and Firefighting & Prevention (37 | 5.4%).
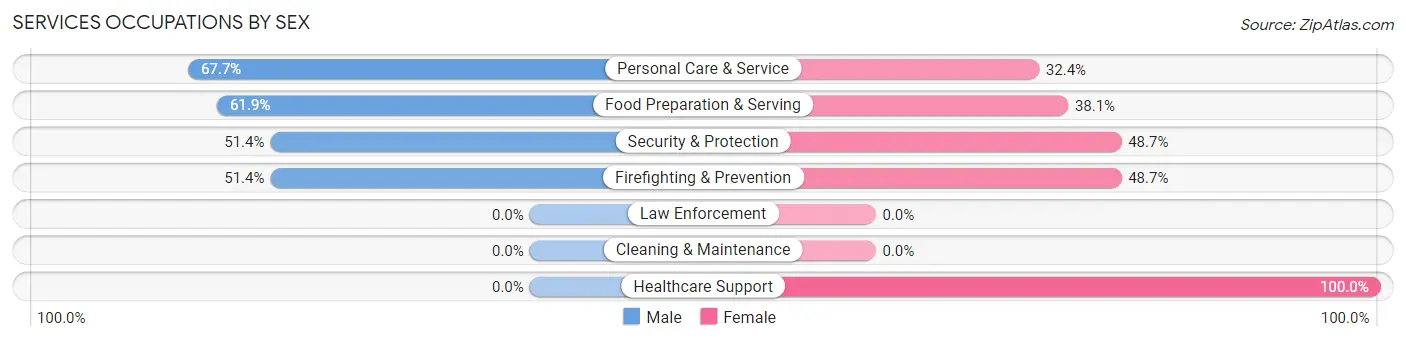
Services Occupations by Sex
Within the Services occupations in DeLisle, the most male-oriented occupations are Personal Care & Service (67.6%), Food Preparation & Serving (61.9%), and Security & Protection (51.3%), while the most female-oriented occupations are Healthcare Support (100.0%), Security & Protection (48.6%), and Firefighting & Prevention (48.6%).
| Occupation | Male | Female |
| Healthcare Support | 0 (0.0%) | 41 (100.0%) |
| Security & Protection | 19 (51.3%) | 18 (48.6%) |
| Firefighting & Prevention | 19 (51.3%) | 18 (48.6%) |
| Law Enforcement | 0 (0.0%) | 0 (0.0%) |
| Food Preparation & Serving | 26 (61.9%) | 16 (38.1%) |
| Cleaning & Maintenance | 0 (0.0%) | 0 (0.0%) |
| Personal Care & Service | 69 (67.6%) | 33 (32.4%) |
| Total (Category) | 114 (51.3%) | 108 (48.6%) |
| Total (Overall) | 334 (49.1%) | 346 (50.9%) |
Sales and Office Occupations
The most common Sales and Office occupations in DeLisle are Office & Administration (48 | 7.1%), and Sales & Related (7 | 1.0%).

Sales and Office Occupations by Sex

| Occupation | Male | Female |
| Sales & Related | 0 (0.0%) | 7 (100.0%) |
| Office & Administration | 0 (0.0%) | 48 (100.0%) |
| Total (Category) | 0 (0.0%) | 55 (100.0%) |
| Total (Overall) | 334 (49.1%) | 346 (50.9%) |
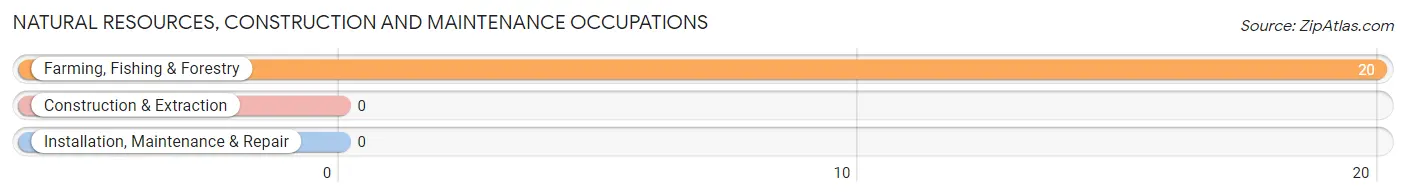
Natural Resources, Construction and Maintenance Occupations
The most common Natural Resources, Construction and Maintenance occupations in DeLisle are , and Farming, Fishing & Forestry (20 | 2.9%).
Natural Resources, Construction and Maintenance Occupations by Sex
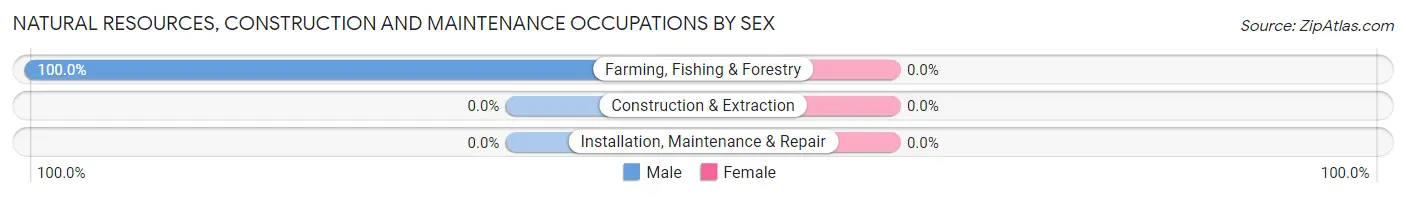
| Occupation | Male | Female |
| Farming, Fishing & Forestry | 20 (100.0%) | 0 (0.0%) |
| Construction & Extraction | 0 (0.0%) | 0 (0.0%) |
| Installation, Maintenance & Repair | 0 (0.0%) | 0 (0.0%) |
| Total (Category) | 20 (100.0%) | 0 (0.0%) |
| Total (Overall) | 334 (49.1%) | 346 (50.9%) |
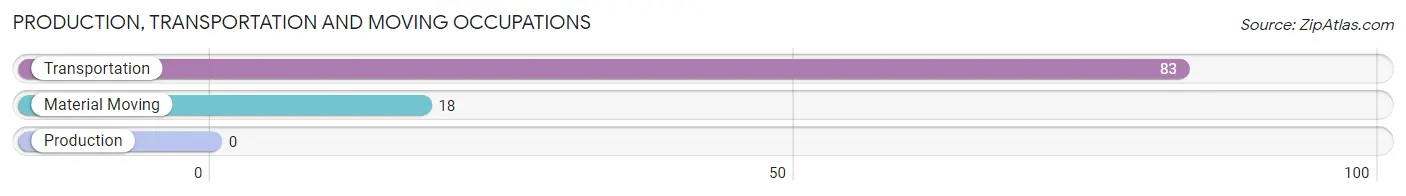
Production, Transportation and Moving Occupations
The most common Production, Transportation and Moving occupations in DeLisle are Transportation (83 | 12.2%), and Material Moving (18 | 2.6%).
Production, Transportation and Moving Occupations by Sex
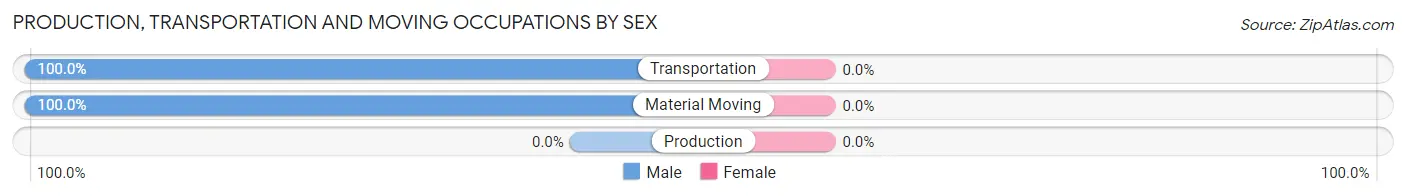
| Occupation | Male | Female |
| Production | 0 (0.0%) | 0 (0.0%) |
| Transportation | 83 (100.0%) | 0 (0.0%) |
| Material Moving | 18 (100.0%) | 0 (0.0%) |
| Total (Category) | 101 (100.0%) | 0 (0.0%) |
| Total (Overall) | 334 (49.1%) | 346 (50.9%) |
Employment Industries by Sex in DeLisle
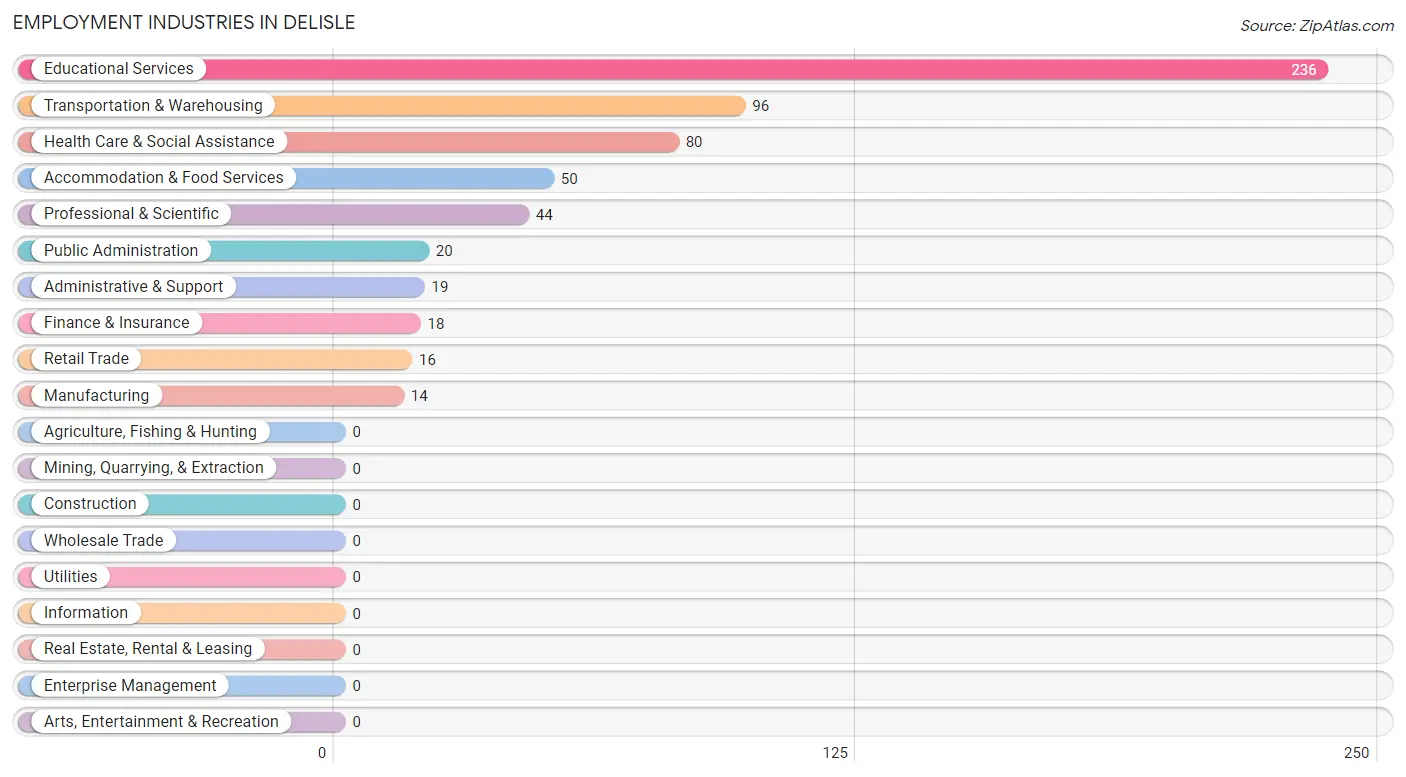
Employment Industries in DeLisle
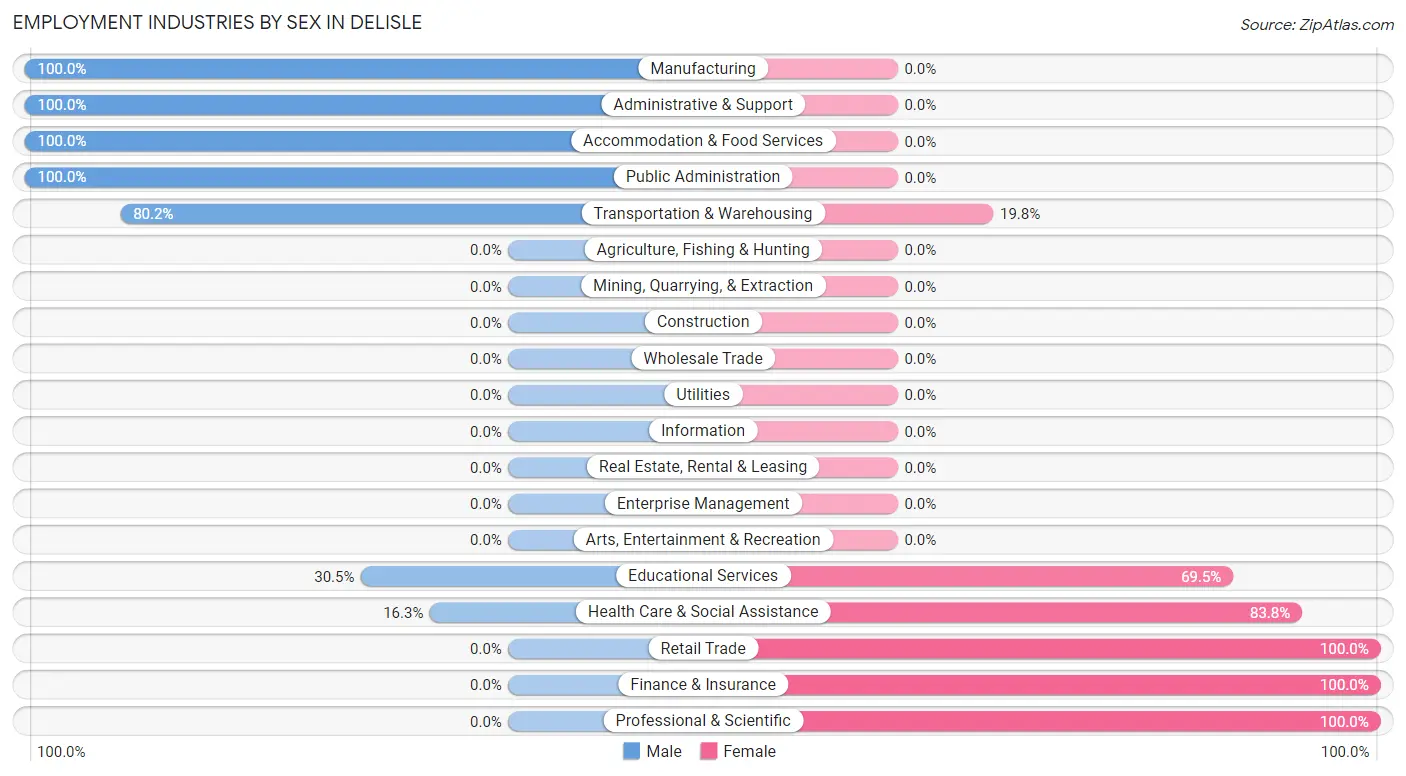
The major employment industries in DeLisle include Educational Services (236 | 34.7%), Transportation & Warehousing (96 | 14.1%), Health Care & Social Assistance (80 | 11.8%), Accommodation & Food Services (50 | 7.3%), and Professional & Scientific (44 | 6.5%).
Employment Industries by Sex in DeLisle
The DeLisle industries that see more men than women are Manufacturing (100.0%), Administrative & Support (100.0%), and Accommodation & Food Services (100.0%), whereas the industries that tend to have a higher number of women are Retail Trade (100.0%), Finance & Insurance (100.0%), and Professional & Scientific (100.0%).
| Industry | Male | Female |
| Agriculture, Fishing & Hunting | 0 (0.0%) | 0 (0.0%) |
| Mining, Quarrying, & Extraction | 0 (0.0%) | 0 (0.0%) |
| Construction | 0 (0.0%) | 0 (0.0%) |
| Manufacturing | 14 (100.0%) | 0 (0.0%) |
| Wholesale Trade | 0 (0.0%) | 0 (0.0%) |
| Retail Trade | 0 (0.0%) | 16 (100.0%) |
| Transportation & Warehousing | 77 (80.2%) | 19 (19.8%) |
| Utilities | 0 (0.0%) | 0 (0.0%) |
| Information | 0 (0.0%) | 0 (0.0%) |
| Finance & Insurance | 0 (0.0%) | 18 (100.0%) |
| Real Estate, Rental & Leasing | 0 (0.0%) | 0 (0.0%) |
| Professional & Scientific | 0 (0.0%) | 44 (100.0%) |
| Enterprise Management | 0 (0.0%) | 0 (0.0%) |
| Administrative & Support | 19 (100.0%) | 0 (0.0%) |
| Educational Services | 72 (30.5%) | 164 (69.5%) |
| Health Care & Social Assistance | 13 (16.3%) | 67 (83.8%) |
| Arts, Entertainment & Recreation | 0 (0.0%) | 0 (0.0%) |
| Accommodation & Food Services | 50 (100.0%) | 0 (0.0%) |
| Public Administration | 20 (100.0%) | 0 (0.0%) |
| Total | 334 (49.1%) | 346 (50.9%) |
Education in DeLisle
School Enrollment in DeLisle
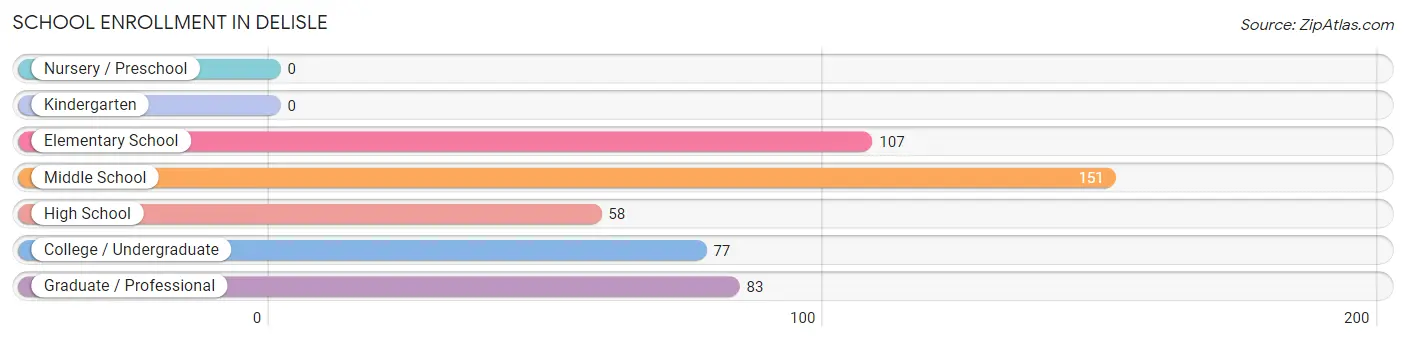
The most common levels of schooling among the 476 students in DeLisle are middle school (151 | 31.7%), elementary school (107 | 22.5%), and graduate / professional (83 | 17.4%).
| School Level | # Students | % Students |
| Nursery / Preschool | 0 | 0.0% |
| Kindergarten | 0 | 0.0% |
| Elementary School | 107 | 22.5% |
| Middle School | 151 | 31.7% |
| High School | 58 | 12.2% |
| College / Undergraduate | 77 | 16.2% |
| Graduate / Professional | 83 | 17.4% |
| Total | 476 | 100.0% |
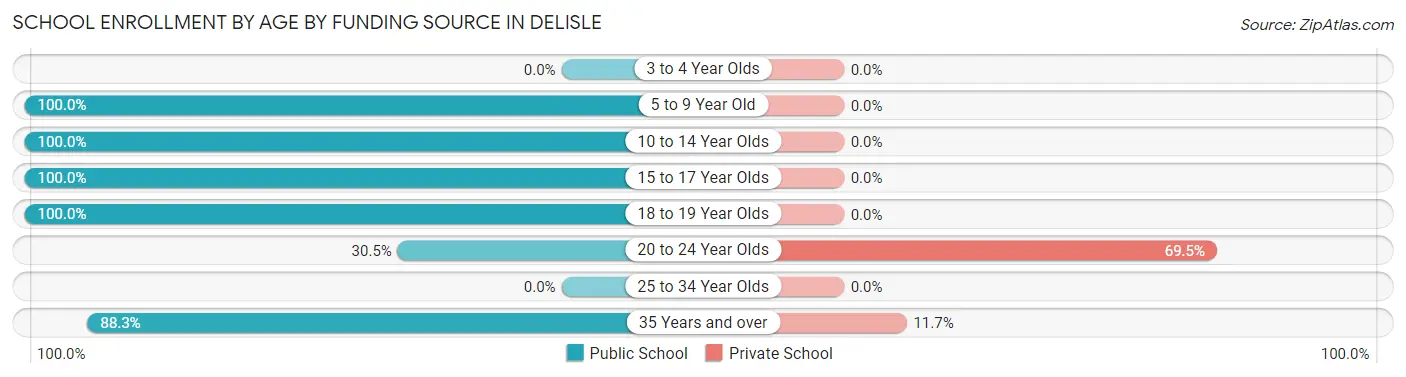
School Enrollment by Age by Funding Source in DeLisle
Out of a total of 476 students who are enrolled in schools in DeLisle, 52 (10.9%) attend a private institution, while the remaining 424 (89.1%) are enrolled in public schools. The age group of 20 to 24 year olds has the highest likelihood of being enrolled in private schools, with 41 (69.5% in the age bracket) enrolled. Conversely, the age group of 5 to 9 year old has the lowest likelihood of being enrolled in a private school, with 107 (100.0% in the age bracket) attending a public institution.
| Age Bracket | Public School | Private School |
| 3 to 4 Year Olds | 0 (0.0%) | 0 (0.0%) |
| 5 to 9 Year Old | 107 (100.0%) | 0 (0.0%) |
| 10 to 14 Year Olds | 151 (100.0%) | 0 (0.0%) |
| 15 to 17 Year Olds | 38 (100.0%) | 0 (0.0%) |
| 18 to 19 Year Olds | 27 (100.0%) | 0 (0.0%) |
| 20 to 24 Year Olds | 18 (30.5%) | 41 (69.5%) |
| 25 to 34 Year Olds | 0 (0.0%) | 0 (0.0%) |
| 35 Years and over | 83 (88.3%) | 11 (11.7%) |
| Total | 424 (89.1%) | 52 (10.9%) |
Educational Attainment by Field of Study in DeLisle
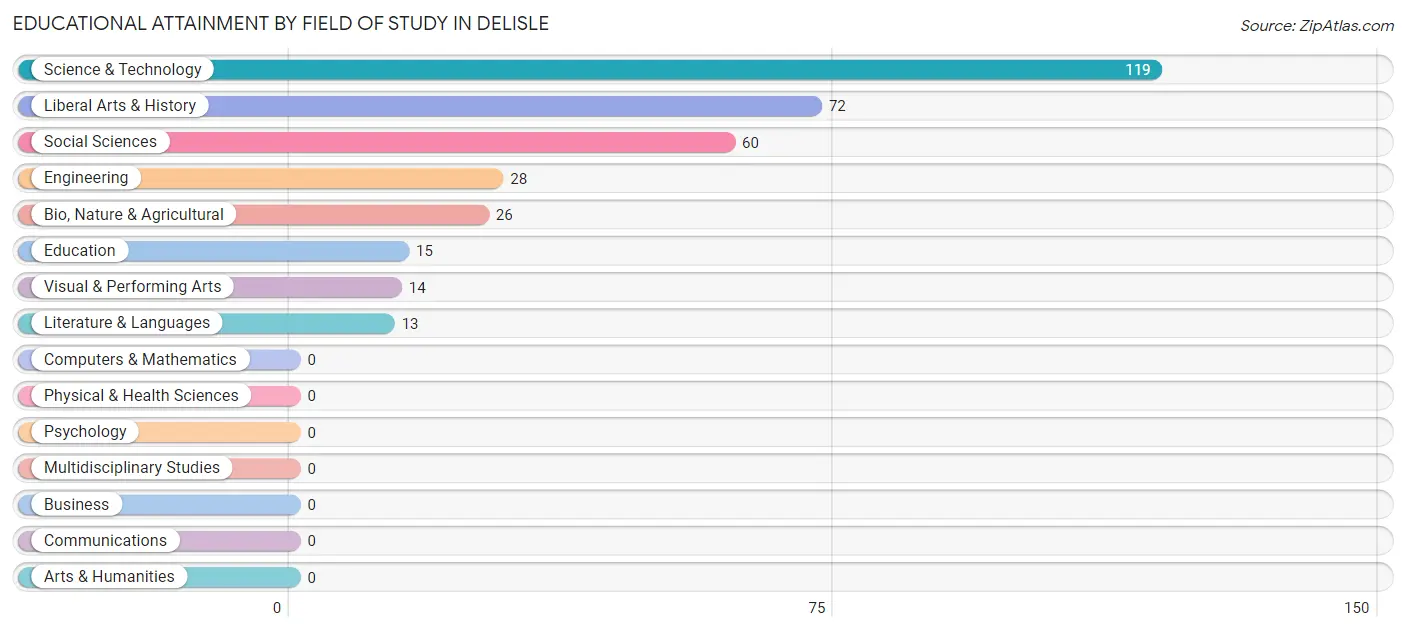
Science & technology (119 | 34.3%), liberal arts & history (72 | 20.7%), social sciences (60 | 17.3%), engineering (28 | 8.1%), and bio, nature & agricultural (26 | 7.5%) are the most common fields of study among 347 individuals in DeLisle who have obtained a bachelor's degree or higher.
| Field of Study | # Graduates | % Graduates |
| Computers & Mathematics | 0 | 0.0% |
| Bio, Nature & Agricultural | 26 | 7.5% |
| Physical & Health Sciences | 0 | 0.0% |
| Psychology | 0 | 0.0% |
| Social Sciences | 60 | 17.3% |
| Engineering | 28 | 8.1% |
| Multidisciplinary Studies | 0 | 0.0% |
| Science & Technology | 119 | 34.3% |
| Business | 0 | 0.0% |
| Education | 15 | 4.3% |
| Literature & Languages | 13 | 3.7% |
| Liberal Arts & History | 72 | 20.7% |
| Visual & Performing Arts | 14 | 4.0% |
| Communications | 0 | 0.0% |
| Arts & Humanities | 0 | 0.0% |
| Total | 347 | 100.0% |
Transportation & Commute in DeLisle
Vehicle Availability by Sex in DeLisle
The most prevalent vehicle ownership categories in DeLisle are males with 3 vehicles (275, accounting for 100.0%) and females with 3 vehicles (235, making up 83.1%).
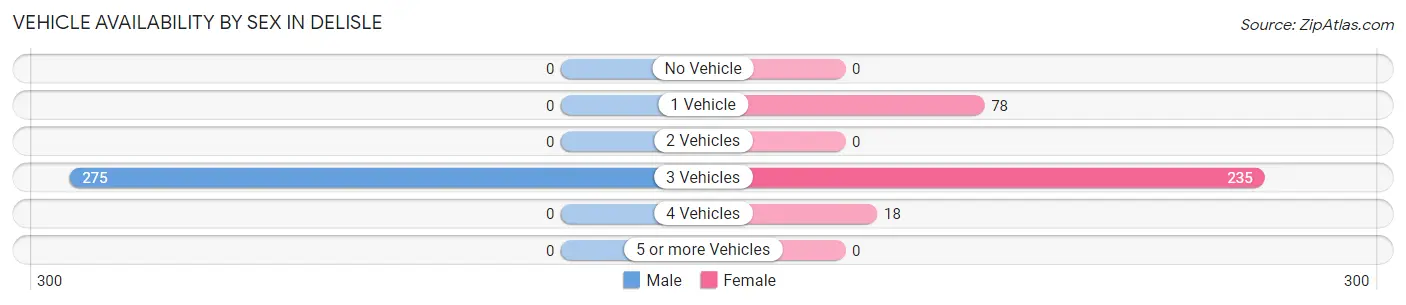
| Vehicles Available | Male | Female |
| No Vehicle | 0 (0.0%) | 0 (0.0%) |
| 1 Vehicle | 0 (0.0%) | 78 (23.6%) |
| 2 Vehicles | 0 (0.0%) | 0 (0.0%) |
| 3 Vehicles | 275 (100.0%) | 235 (71.0%) |
| 4 Vehicles | 0 (0.0%) | 18 (5.4%) |
| 5 or more Vehicles | 0 (0.0%) | 0 (0.0%) |
| Total | 275 (100.0%) | 331 (100.0%) |
Commute Time in DeLisle
The most frequently occuring commute durations in DeLisle are 10 to 14 minutes (230 commuters, 38.0%), 25 to 29 minutes (176 commuters, 29.0%), and 90 or more minutes (81 commuters, 13.4%).
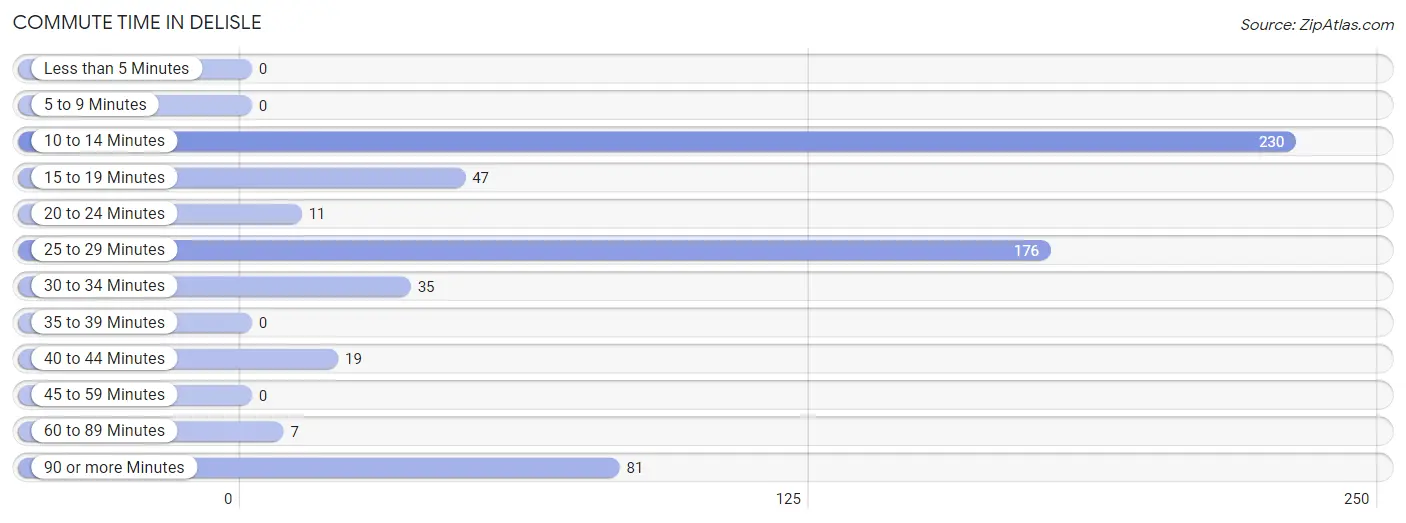
| Commute Time | # Commuters | % Commuters |
| Less than 5 Minutes | 0 | 0.0% |
| 5 to 9 Minutes | 0 | 0.0% |
| 10 to 14 Minutes | 230 | 38.0% |
| 15 to 19 Minutes | 47 | 7.8% |
| 20 to 24 Minutes | 11 | 1.8% |
| 25 to 29 Minutes | 176 | 29.0% |
| 30 to 34 Minutes | 35 | 5.8% |
| 35 to 39 Minutes | 0 | 0.0% |
| 40 to 44 Minutes | 19 | 3.1% |
| 45 to 59 Minutes | 0 | 0.0% |
| 60 to 89 Minutes | 7 | 1.2% |
| 90 or more Minutes | 81 | 13.4% |
Commute Time by Sex in DeLisle
The most common commute times in DeLisle are 25 to 29 minutes (144 commuters, 52.4%) for males and 10 to 14 minutes (132 commuters, 39.9%) for females.
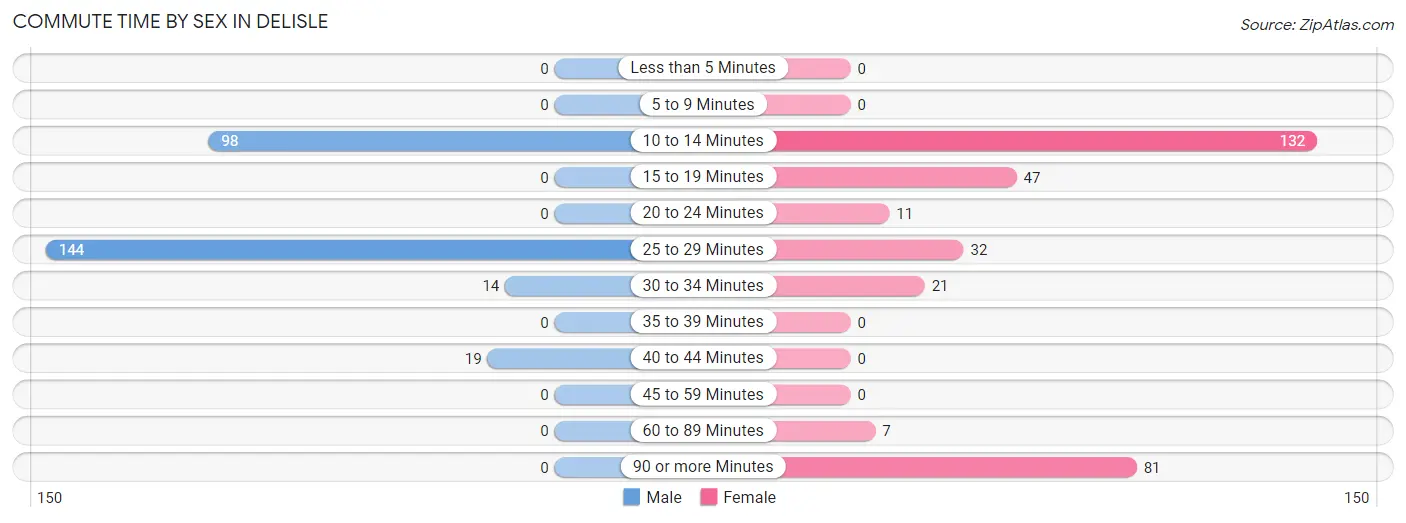
| Commute Time | Male | Female |
| Less than 5 Minutes | 0 (0.0%) | 0 (0.0%) |
| 5 to 9 Minutes | 0 (0.0%) | 0 (0.0%) |
| 10 to 14 Minutes | 98 (35.6%) | 132 (39.9%) |
| 15 to 19 Minutes | 0 (0.0%) | 47 (14.2%) |
| 20 to 24 Minutes | 0 (0.0%) | 11 (3.3%) |
| 25 to 29 Minutes | 144 (52.4%) | 32 (9.7%) |
| 30 to 34 Minutes | 14 (5.1%) | 21 (6.3%) |
| 35 to 39 Minutes | 0 (0.0%) | 0 (0.0%) |
| 40 to 44 Minutes | 19 (6.9%) | 0 (0.0%) |
| 45 to 59 Minutes | 0 (0.0%) | 0 (0.0%) |
| 60 to 89 Minutes | 0 (0.0%) | 7 (2.1%) |
| 90 or more Minutes | 0 (0.0%) | 81 (24.5%) |
Time of Departure to Work by Sex in DeLisle
The most frequent times of departure to work in DeLisle are 7:00 AM to 7:29 AM (99, 36.0%) for males and 6:30 AM to 6:59 AM (193, 58.3%) for females.
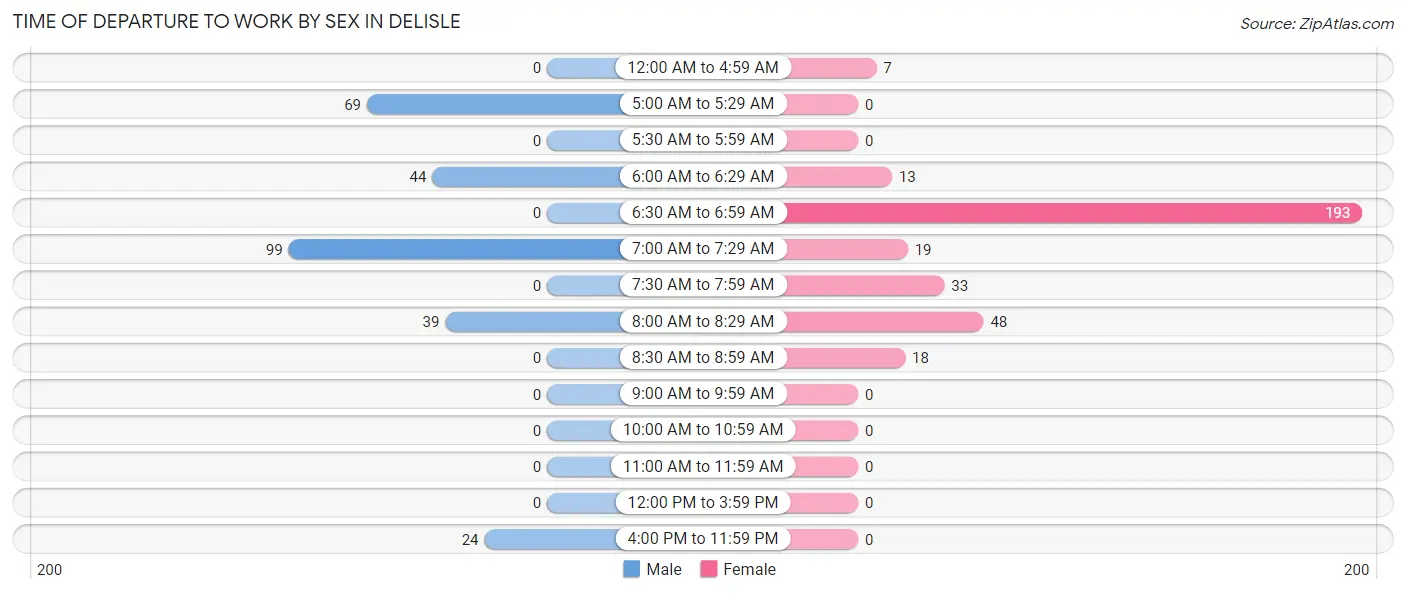
| Time of Departure | Male | Female |
| 12:00 AM to 4:59 AM | 0 (0.0%) | 7 (2.1%) |
| 5:00 AM to 5:29 AM | 69 (25.1%) | 0 (0.0%) |
| 5:30 AM to 5:59 AM | 0 (0.0%) | 0 (0.0%) |
| 6:00 AM to 6:29 AM | 44 (16.0%) | 13 (3.9%) |
| 6:30 AM to 6:59 AM | 0 (0.0%) | 193 (58.3%) |
| 7:00 AM to 7:29 AM | 99 (36.0%) | 19 (5.7%) |
| 7:30 AM to 7:59 AM | 0 (0.0%) | 33 (10.0%) |
| 8:00 AM to 8:29 AM | 39 (14.2%) | 48 (14.5%) |
| 8:30 AM to 8:59 AM | 0 (0.0%) | 18 (5.4%) |
| 9:00 AM to 9:59 AM | 0 (0.0%) | 0 (0.0%) |
| 10:00 AM to 10:59 AM | 0 (0.0%) | 0 (0.0%) |
| 11:00 AM to 11:59 AM | 0 (0.0%) | 0 (0.0%) |
| 12:00 PM to 3:59 PM | 0 (0.0%) | 0 (0.0%) |
| 4:00 PM to 11:59 PM | 24 (8.7%) | 0 (0.0%) |
| Total | 275 (100.0%) | 331 (100.0%) |
Housing Occupancy in DeLisle
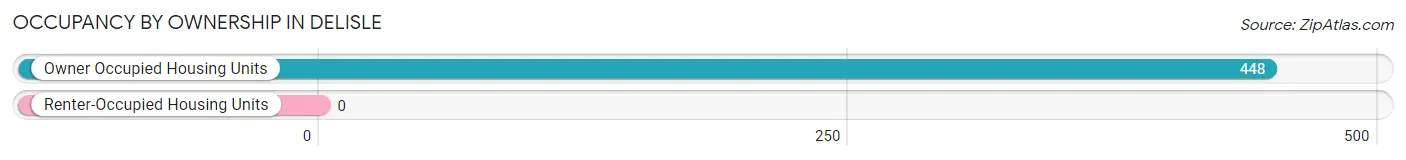
Occupancy by Ownership in DeLisle
Of the total 448 dwellings in DeLisle, owner-occupied units account for 448 (100.0%), while renter-occupied units make up 0 (0.0%).
| Occupancy | # Housing Units | % Housing Units |
| Owner Occupied Housing Units | 448 | 100.0% |
| Renter-Occupied Housing Units | 0 | 0.0% |
| Total Occupied Housing Units | 448 | 100.0% |
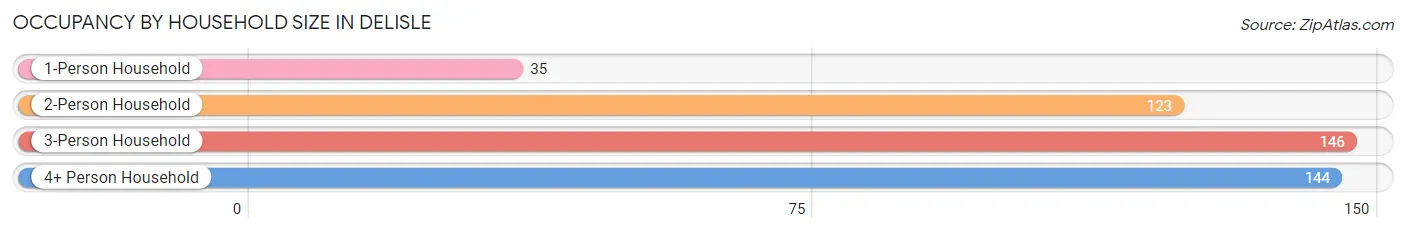
Occupancy by Household Size in DeLisle
| Household Size | # Housing Units | % Housing Units |
| 1-Person Household | 35 | 7.8% |
| 2-Person Household | 123 | 27.5% |
| 3-Person Household | 146 | 32.6% |
| 4+ Person Household | 144 | 32.1% |
| Total Housing Units | 448 | 100.0% |
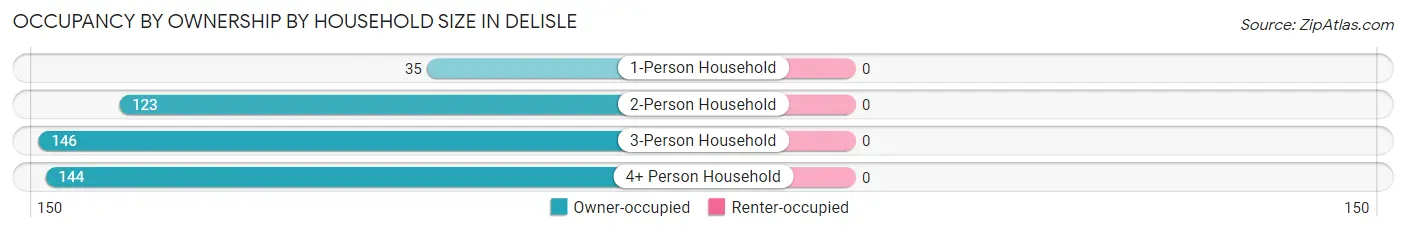
Occupancy by Ownership by Household Size in DeLisle
| Household Size | Owner-occupied | Renter-occupied |
| 1-Person Household | 35 (100.0%) | 0 (0.0%) |
| 2-Person Household | 123 (100.0%) | 0 (0.0%) |
| 3-Person Household | 146 (100.0%) | 0 (0.0%) |
| 4+ Person Household | 144 (100.0%) | 0 (0.0%) |
| Total Housing Units | 448 (100.0%) | 0 (0.0%) |
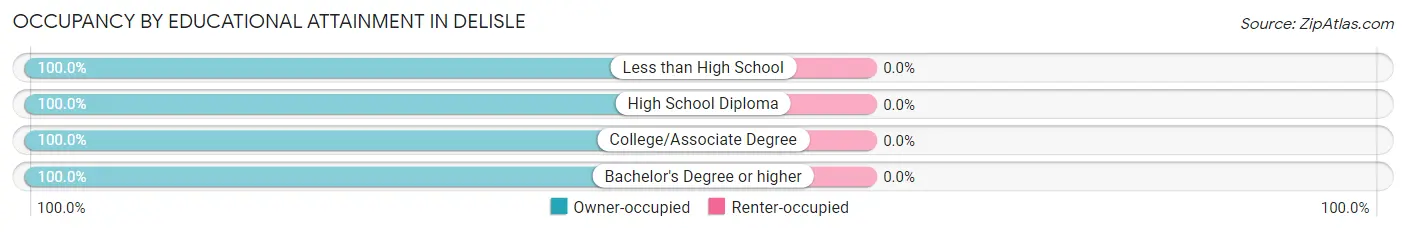
Occupancy by Educational Attainment in DeLisle
| Household Size | Owner-occupied | Renter-occupied |
| Less than High School | 9 (100.0%) | 0 (0.0%) |
| High School Diploma | 71 (100.0%) | 0 (0.0%) |
| College/Associate Degree | 202 (100.0%) | 0 (0.0%) |
| Bachelor's Degree or higher | 166 (100.0%) | 0 (0.0%) |
Occupancy by Age of Householder in DeLisle
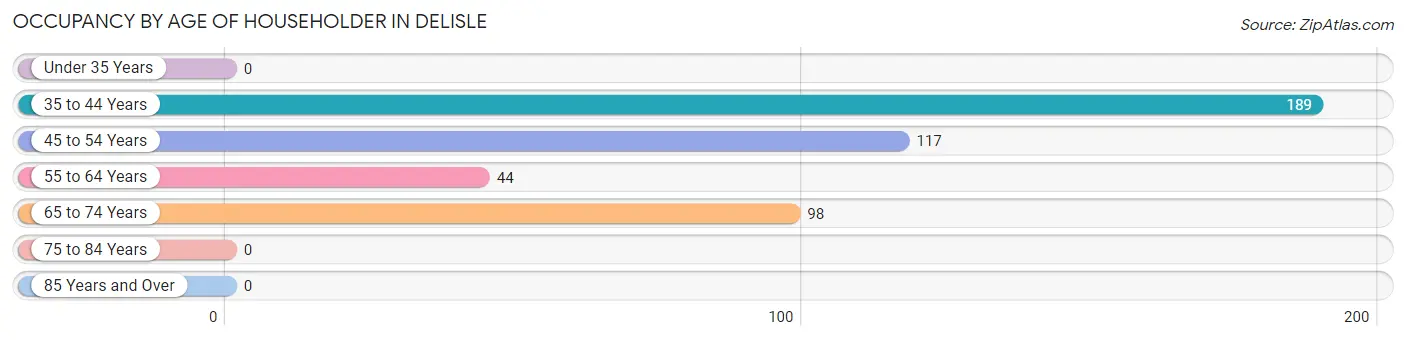
| Age Bracket | # Households | % Households |
| Under 35 Years | 0 | 0.0% |
| 35 to 44 Years | 189 | 42.2% |
| 45 to 54 Years | 117 | 26.1% |
| 55 to 64 Years | 44 | 9.8% |
| 65 to 74 Years | 98 | 21.9% |
| 75 to 84 Years | 0 | 0.0% |
| 85 Years and Over | 0 | 0.0% |
| Total | 448 | 100.0% |
Housing Finances in DeLisle
Median Income by Occupancy in DeLisle
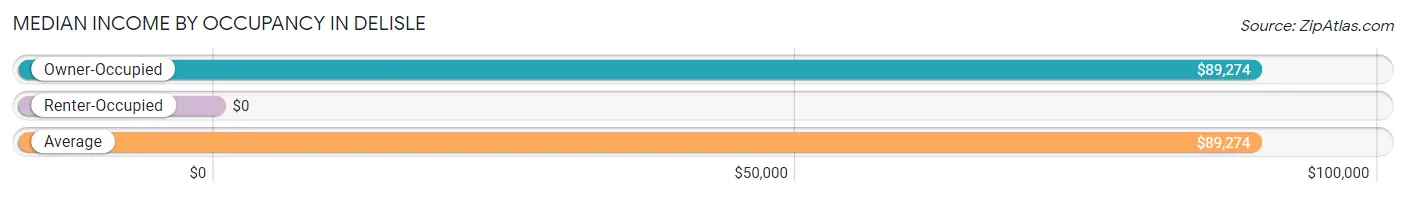
| Occupancy Type | # Households | Median Income |
| Owner-Occupied | 448 (100.0%) | $89,274 |
| Renter-Occupied | 0 (0.0%) | $0 |
| Average | 448 (100.0%) | $89,274 |
Occupancy by Householder Income Bracket in DeLisle
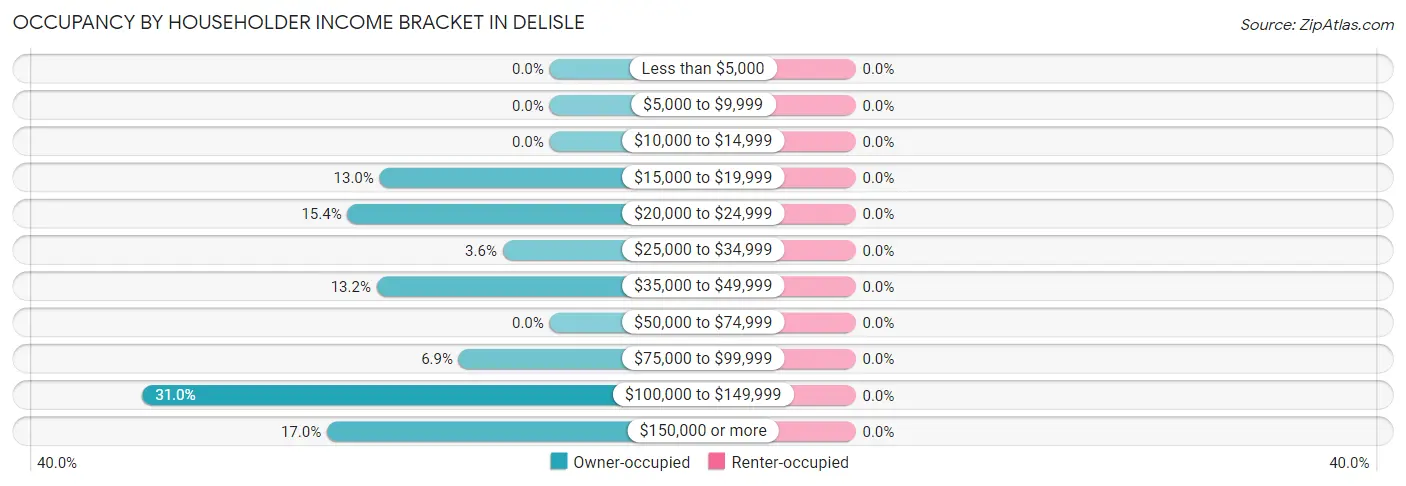
| Income Bracket | Owner-occupied | Renter-occupied |
| Less than $5,000 | 0 (0.0%) | 0 (0.0%) |
| $5,000 to $9,999 | 0 (0.0%) | 0 (0.0%) |
| $10,000 to $14,999 | 0 (0.0%) | 0 (0.0%) |
| $15,000 to $19,999 | 58 (13.0%) | 0 (0.0%) |
| $20,000 to $24,999 | 69 (15.4%) | 0 (0.0%) |
| $25,000 to $34,999 | 16 (3.6%) | 0 (0.0%) |
| $35,000 to $49,999 | 59 (13.2%) | 0 (0.0%) |
| $50,000 to $74,999 | 0 (0.0%) | 0 (0.0%) |
| $75,000 to $99,999 | 31 (6.9%) | 0 (0.0%) |
| $100,000 to $149,999 | 139 (31.0%) | 0 (0.0%) |
| $150,000 or more | 76 (17.0%) | 0 (0.0%) |
| Total | 448 (100.0%) | 0 (0.0%) |
Monthly Housing Cost Tiers in DeLisle
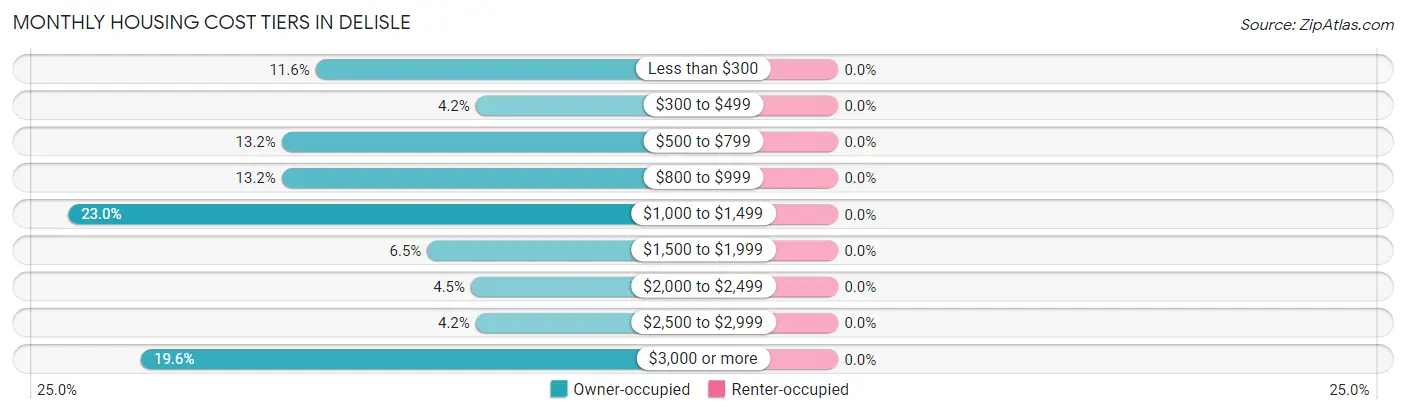
| Monthly Cost | Owner-occupied | Renter-occupied |
| Less than $300 | 52 (11.6%) | 0 (0.0%) |
| $300 to $499 | 19 (4.2%) | 0 (0.0%) |
| $500 to $799 | 59 (13.2%) | 0 (0.0%) |
| $800 to $999 | 59 (13.2%) | 0 (0.0%) |
| $1,000 to $1,499 | 103 (23.0%) | 0 (0.0%) |
| $1,500 to $1,999 | 29 (6.5%) | 0 (0.0%) |
| $2,000 to $2,499 | 20 (4.5%) | 0 (0.0%) |
| $2,500 to $2,999 | 19 (4.2%) | 0 (0.0%) |
| $3,000 or more | 88 (19.6%) | 0 (0.0%) |
| Total | 448 (100.0%) | 0 (0.0%) |
Physical Housing Characteristics in DeLisle
Housing Structures in DeLisle
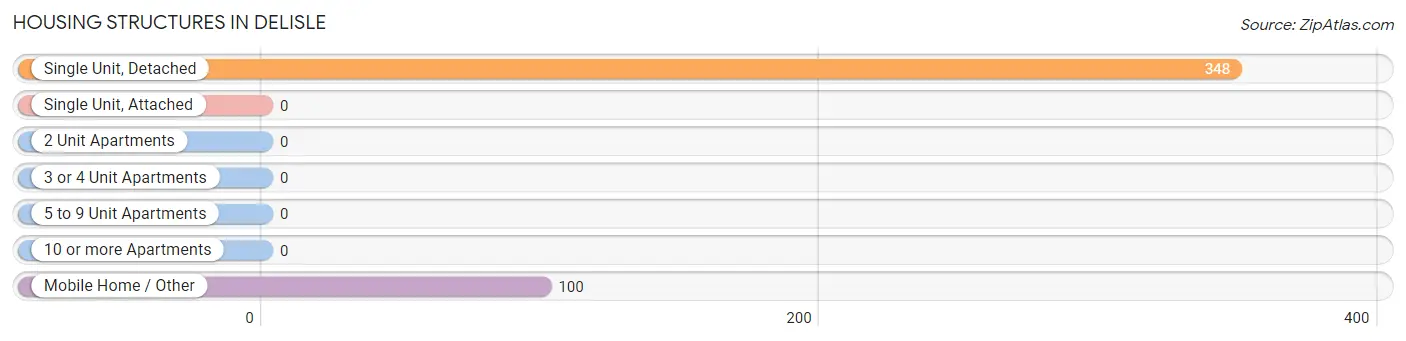
| Structure Type | # Housing Units | % Housing Units |
| Single Unit, Detached | 348 | 77.7% |
| Single Unit, Attached | 0 | 0.0% |
| 2 Unit Apartments | 0 | 0.0% |
| 3 or 4 Unit Apartments | 0 | 0.0% |
| 5 to 9 Unit Apartments | 0 | 0.0% |
| 10 or more Apartments | 0 | 0.0% |
| Mobile Home / Other | 100 | 22.3% |
| Total | 448 | 100.0% |
Housing Structures by Occupancy in DeLisle
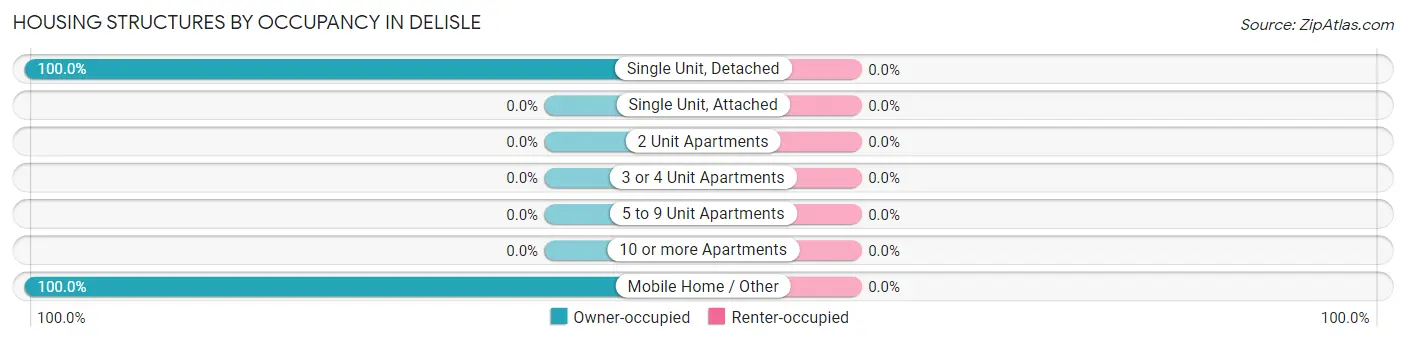
| Structure Type | Owner-occupied | Renter-occupied |
| Single Unit, Detached | 348 (100.0%) | 0 (0.0%) |
| Single Unit, Attached | 0 (0.0%) | 0 (0.0%) |
| 2 Unit Apartments | 0 (0.0%) | 0 (0.0%) |
| 3 or 4 Unit Apartments | 0 (0.0%) | 0 (0.0%) |
| 5 to 9 Unit Apartments | 0 (0.0%) | 0 (0.0%) |
| 10 or more Apartments | 0 (0.0%) | 0 (0.0%) |
| Mobile Home / Other | 100 (100.0%) | 0 (0.0%) |
| Total | 448 (100.0%) | 0 (0.0%) |
Housing Structures by Number of Rooms in DeLisle
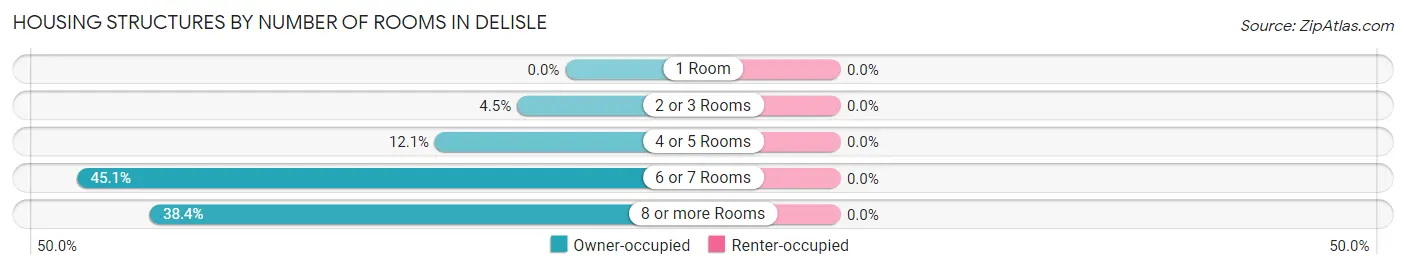
| Number of Rooms | Owner-occupied | Renter-occupied |
| 1 Room | 0 (0.0%) | 0 (0.0%) |
| 2 or 3 Rooms | 20 (4.5%) | 0 (0.0%) |
| 4 or 5 Rooms | 54 (12.0%) | 0 (0.0%) |
| 6 or 7 Rooms | 202 (45.1%) | 0 (0.0%) |
| 8 or more Rooms | 172 (38.4%) | 0 (0.0%) |
| Total | 448 (100.0%) | 0 (0.0%) |
Housing Structure by Heating Type in DeLisle
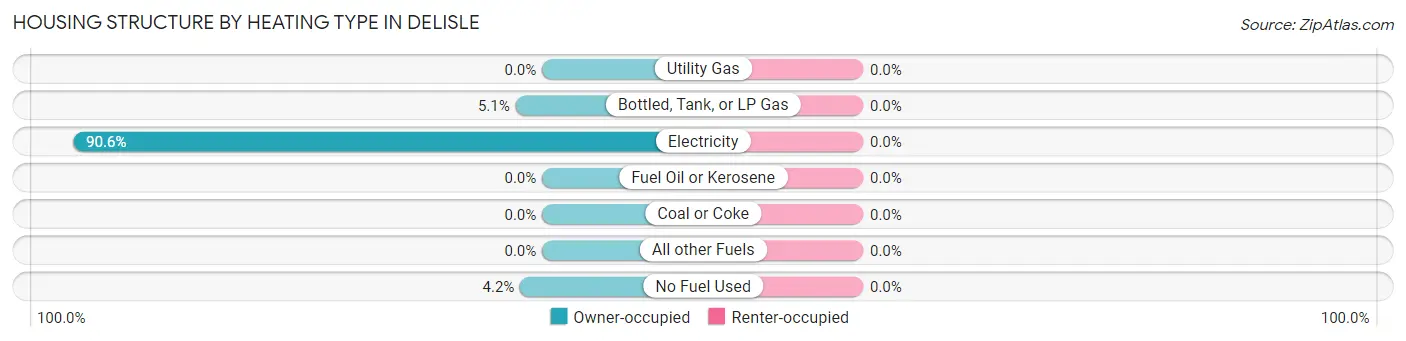
| Heating Type | Owner-occupied | Renter-occupied |
| Utility Gas | 0 (0.0%) | 0 (0.0%) |
| Bottled, Tank, or LP Gas | 23 (5.1%) | 0 (0.0%) |
| Electricity | 406 (90.6%) | 0 (0.0%) |
| Fuel Oil or Kerosene | 0 (0.0%) | 0 (0.0%) |
| Coal or Coke | 0 (0.0%) | 0 (0.0%) |
| All other Fuels | 0 (0.0%) | 0 (0.0%) |
| No Fuel Used | 19 (4.2%) | 0 (0.0%) |
| Total | 448 (100.0%) | 0 (0.0%) |
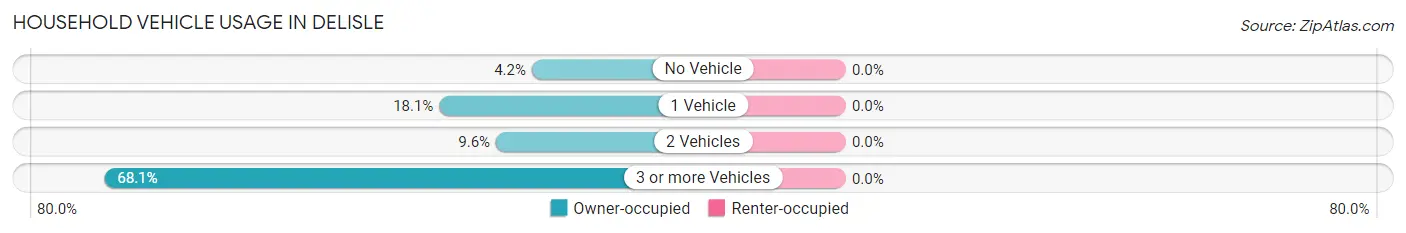
Household Vehicle Usage in DeLisle
| Vehicles per Household | Owner-occupied | Renter-occupied |
| No Vehicle | 19 (4.2%) | 0 (0.0%) |
| 1 Vehicle | 81 (18.1%) | 0 (0.0%) |
| 2 Vehicles | 43 (9.6%) | 0 (0.0%) |
| 3 or more Vehicles | 305 (68.1%) | 0 (0.0%) |
| Total | 448 (100.0%) | 0 (0.0%) |
Real Estate & Mortgages in DeLisle
Real Estate and Mortgage Overview in DeLisle
| Characteristic | Without Mortgage | With Mortgage |
| Housing Units | 135 | 313 |
| Median Property Value | - | - |
| Median Household Income | $21,188 | $76 |
| Monthly Housing Costs | $482 | $83 |
| Real Estate Taxes | $294 | $0 |
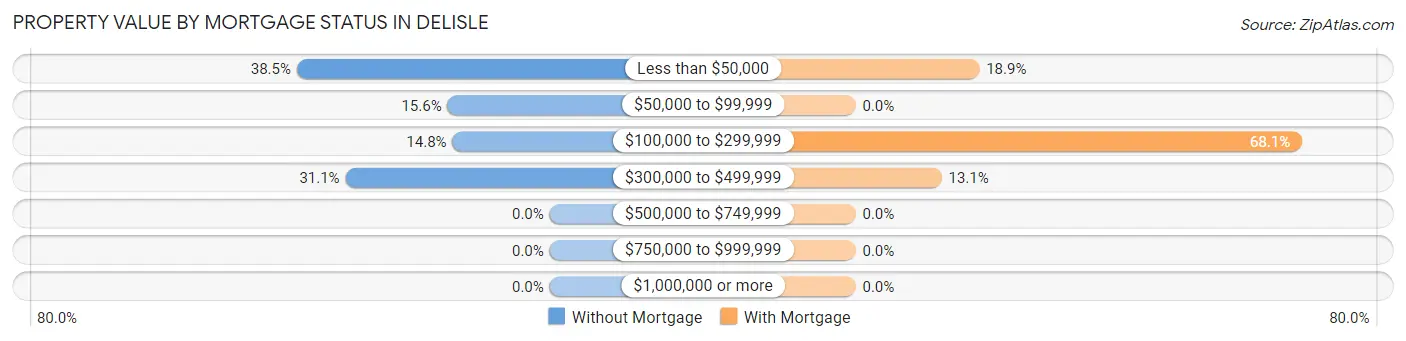
Property Value by Mortgage Status in DeLisle
| Property Value | Without Mortgage | With Mortgage |
| Less than $50,000 | 52 (38.5%) | 59 (18.9%) |
| $50,000 to $99,999 | 21 (15.6%) | 0 (0.0%) |
| $100,000 to $299,999 | 20 (14.8%) | 213 (68.0%) |
| $300,000 to $499,999 | 42 (31.1%) | 41 (13.1%) |
| $500,000 to $749,999 | 0 (0.0%) | 0 (0.0%) |
| $750,000 to $999,999 | 0 (0.0%) | 0 (0.0%) |
| $1,000,000 or more | 0 (0.0%) | 0 (0.0%) |
| Total | 135 (100.0%) | 313 (100.0%) |
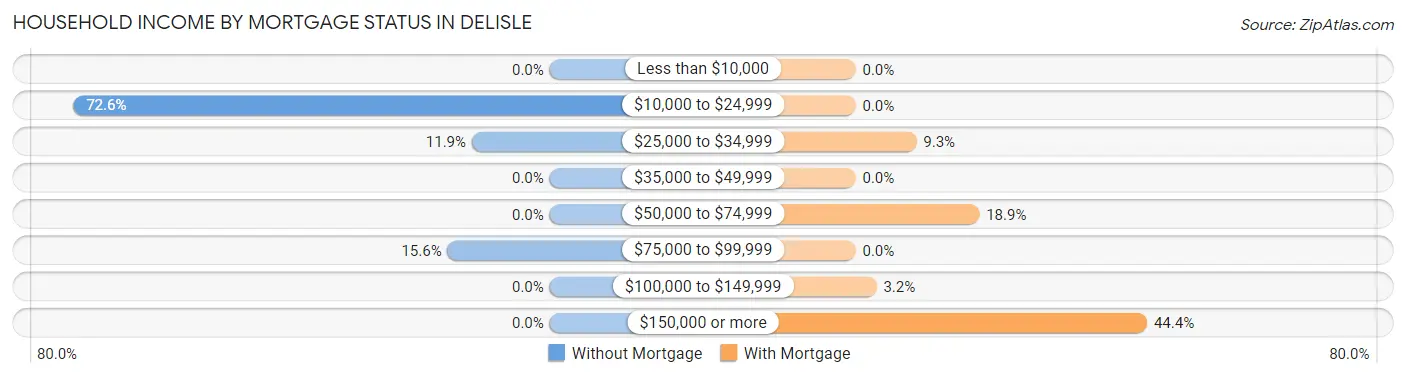
Household Income by Mortgage Status in DeLisle
| Household Income | Without Mortgage | With Mortgage |
| Less than $10,000 | 0 (0.0%) | 0 (0.0%) |
| $10,000 to $24,999 | 98 (72.6%) | 0 (0.0%) |
| $25,000 to $34,999 | 16 (11.8%) | 29 (9.3%) |
| $35,000 to $49,999 | 0 (0.0%) | 0 (0.0%) |
| $50,000 to $74,999 | 0 (0.0%) | 59 (18.9%) |
| $75,000 to $99,999 | 21 (15.6%) | 0 (0.0%) |
| $100,000 to $149,999 | 0 (0.0%) | 10 (3.2%) |
| $150,000 or more | 0 (0.0%) | 139 (44.4%) |
| Total | 135 (100.0%) | 313 (100.0%) |
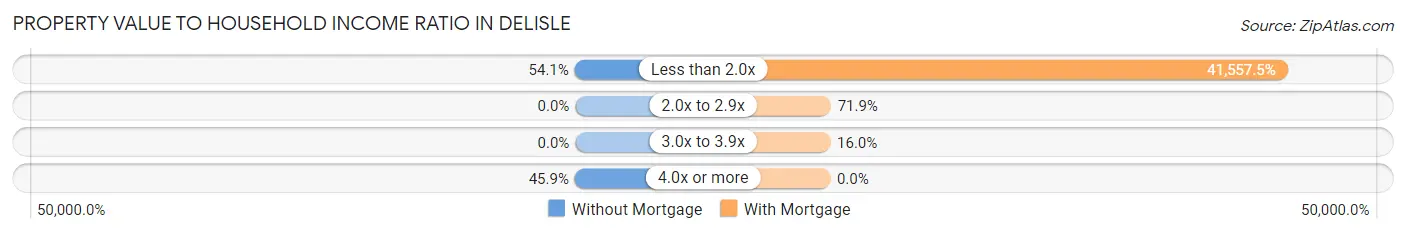
Property Value to Household Income Ratio in DeLisle
| Value-to-Income Ratio | Without Mortgage | With Mortgage |
| Less than 2.0x | 73 (54.1%) | 130,075 (41,557.5%) |
| 2.0x to 2.9x | 0 (0.0%) | 225 (71.9%) |
| 3.0x to 3.9x | 0 (0.0%) | 50 (16.0%) |
| 4.0x or more | 62 (45.9%) | 0 (0.0%) |
| Total | 135 (100.0%) | 313 (100.0%) |
Real Estate Taxes by Mortgage Status in DeLisle
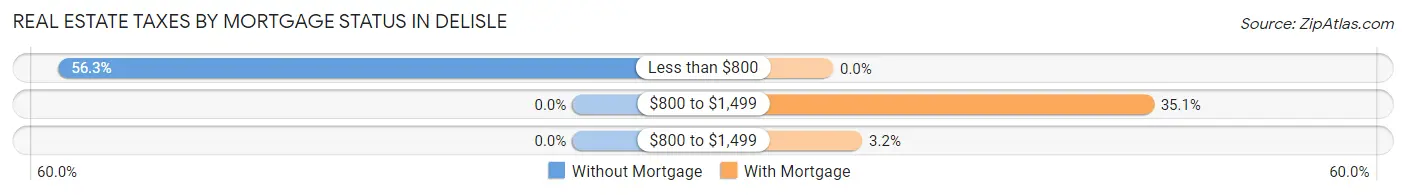
| Property Taxes | Without Mortgage | With Mortgage |
| Less than $800 | 76 (56.3%) | 0 (0.0%) |
| $800 to $1,499 | 0 (0.0%) | 110 (35.1%) |
| $800 to $1,499 | 0 (0.0%) | 10 (3.2%) |
| Total | 135 (100.0%) | 313 (100.0%) |
Health & Disability in DeLisle
Health Insurance Coverage by Age in DeLisle
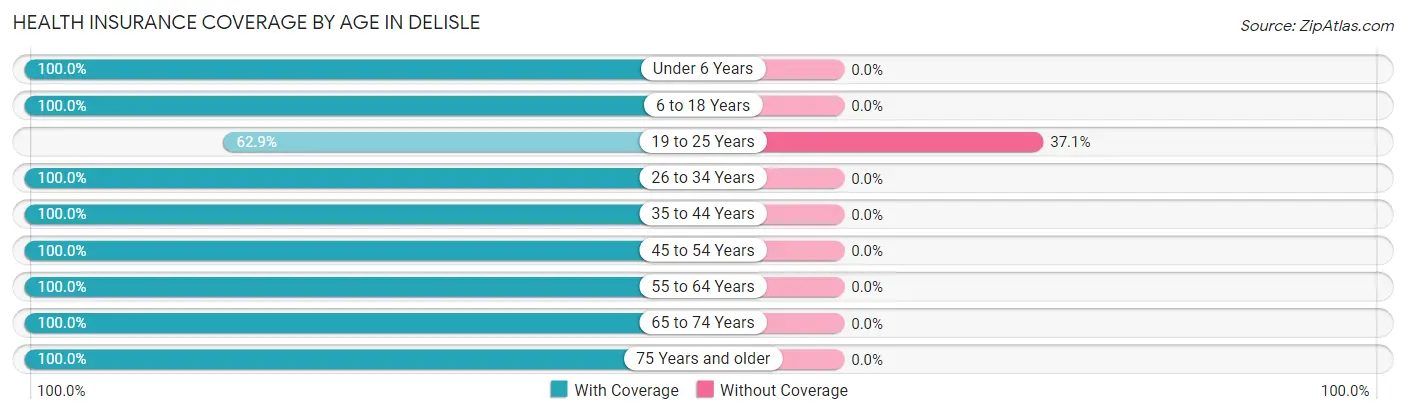
| Age Bracket | With Coverage | Without Coverage |
| Under 6 Years | 82 (100.0%) | 0 (0.0%) |
| 6 to 18 Years | 316 (100.0%) | 0 (0.0%) |
| 19 to 25 Years | 261 (62.9%) | 154 (37.1%) |
| 26 to 34 Years | 26 (100.0%) | 0 (0.0%) |
| 35 to 44 Years | 299 (100.0%) | 0 (0.0%) |
| 45 to 54 Years | 222 (100.0%) | 0 (0.0%) |
| 55 to 64 Years | 74 (100.0%) | 0 (0.0%) |
| 65 to 74 Years | 111 (100.0%) | 0 (0.0%) |
| 75 Years and older | 38 (100.0%) | 0 (0.0%) |
| Total | 1,429 (90.3%) | 154 (9.7%) |
Health Insurance Coverage by Citizenship Status in DeLisle
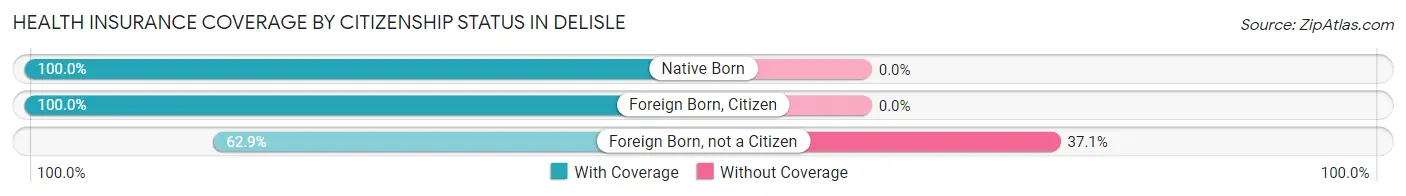
| Citizenship Status | With Coverage | Without Coverage |
| Native Born | 82 (100.0%) | 0 (0.0%) |
| Foreign Born, Citizen | 316 (100.0%) | 0 (0.0%) |
| Foreign Born, not a Citizen | 261 (62.9%) | 154 (37.1%) |
Health Insurance Coverage by Household Income in DeLisle
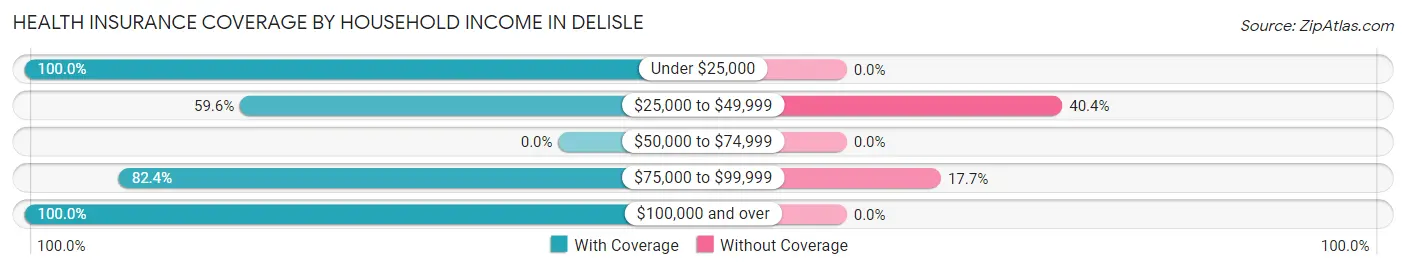
| Household Income | With Coverage | Without Coverage |
| Under $25,000 | 280 (100.0%) | 0 (0.0%) |
| $25,000 to $49,999 | 161 (59.6%) | 109 (40.4%) |
| $50,000 to $74,999 | 0 (0.0%) | 0 (0.0%) |
| $75,000 to $99,999 | 210 (82.4%) | 45 (17.6%) |
| $100,000 and over | 778 (100.0%) | 0 (0.0%) |
Public vs Private Health Insurance Coverage by Age in DeLisle
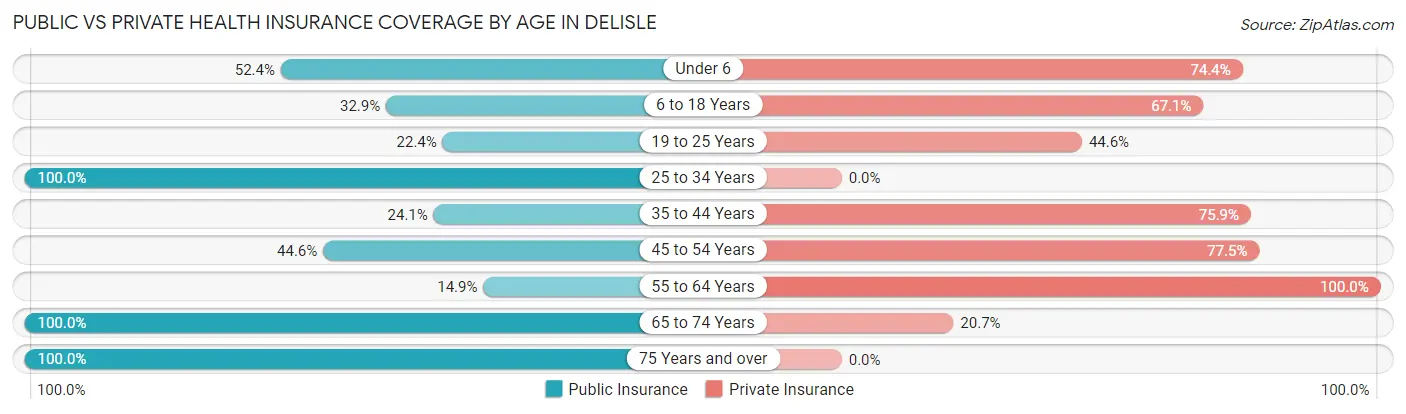
| Age Bracket | Public Insurance | Private Insurance |
| Under 6 | 43 (52.4%) | 61 (74.4%) |
| 6 to 18 Years | 104 (32.9%) | 212 (67.1%) |
| 19 to 25 Years | 93 (22.4%) | 185 (44.6%) |
| 25 to 34 Years | 26 (100.0%) | 0 (0.0%) |
| 35 to 44 Years | 72 (24.1%) | 227 (75.9%) |
| 45 to 54 Years | 99 (44.6%) | 172 (77.5%) |
| 55 to 64 Years | 11 (14.9%) | 74 (100.0%) |
| 65 to 74 Years | 111 (100.0%) | 23 (20.7%) |
| 75 Years and over | 38 (100.0%) | 0 (0.0%) |
| Total | 597 (37.7%) | 954 (60.3%) |
Disability Status by Sex by Age in DeLisle
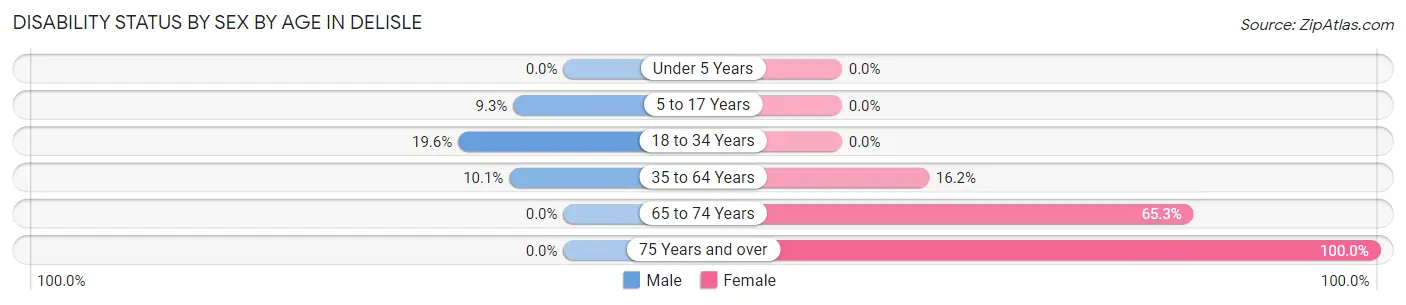
| Age Bracket | Male | Female |
| Under 5 Years | 0 (0.0%) | 0 (0.0%) |
| 5 to 17 Years | 19 (9.3%) | 0 (0.0%) |
| 18 to 34 Years | 70 (19.6%) | 0 (0.0%) |
| 35 to 64 Years | 20 (10.1%) | 64 (16.2%) |
| 65 to 74 Years | 0 (0.0%) | 64 (65.3%) |
| 75 Years and over | 0 (0.0%) | 24 (100.0%) |
Disability Class by Sex by Age in DeLisle
Disability Class: Hearing Difficulty
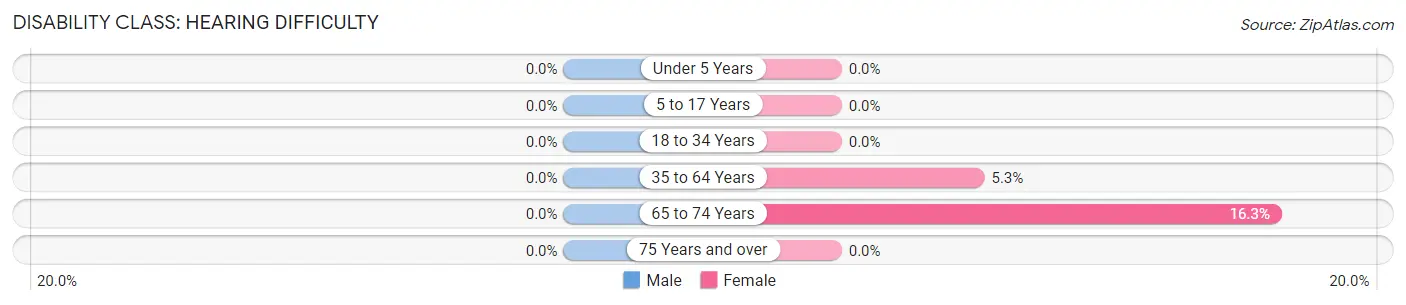
| Age Bracket | Male | Female |
| Under 5 Years | 0 (0.0%) | 0 (0.0%) |
| 5 to 17 Years | 0 (0.0%) | 0 (0.0%) |
| 18 to 34 Years | 0 (0.0%) | 0 (0.0%) |
| 35 to 64 Years | 0 (0.0%) | 21 (5.3%) |
| 65 to 74 Years | 0 (0.0%) | 16 (16.3%) |
| 75 Years and over | 0 (0.0%) | 0 (0.0%) |
Disability Class: Vision Difficulty
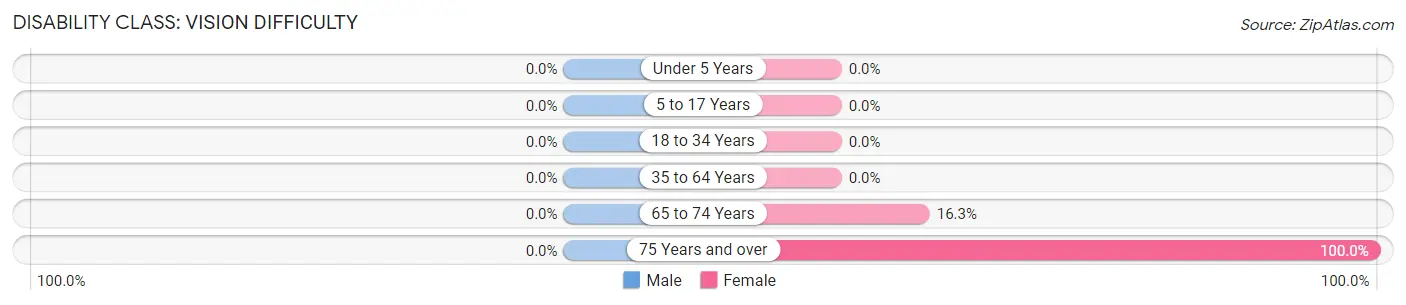
| Age Bracket | Male | Female |
| Under 5 Years | 0 (0.0%) | 0 (0.0%) |
| 5 to 17 Years | 0 (0.0%) | 0 (0.0%) |
| 18 to 34 Years | 0 (0.0%) | 0 (0.0%) |
| 35 to 64 Years | 0 (0.0%) | 0 (0.0%) |
| 65 to 74 Years | 0 (0.0%) | 16 (16.3%) |
| 75 Years and over | 0 (0.0%) | 24 (100.0%) |
Disability Class: Cognitive Difficulty
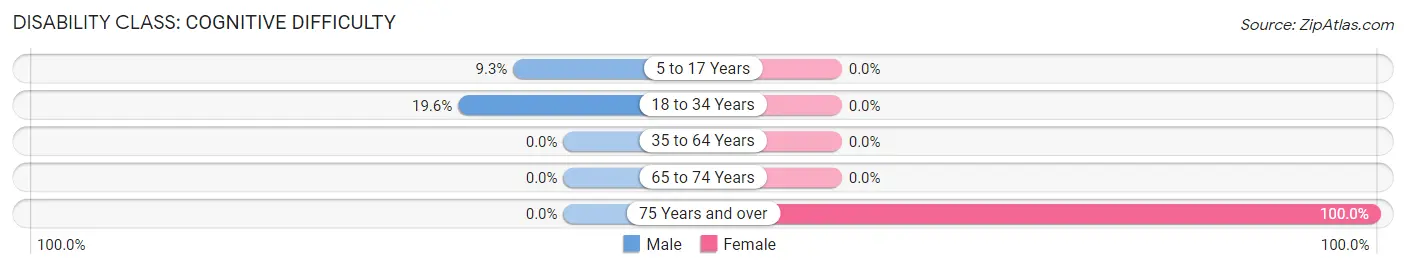
| Age Bracket | Male | Female |
| 5 to 17 Years | 19 (9.3%) | 0 (0.0%) |
| 18 to 34 Years | 70 (19.6%) | 0 (0.0%) |
| 35 to 64 Years | 0 (0.0%) | 0 (0.0%) |
| 65 to 74 Years | 0 (0.0%) | 0 (0.0%) |
| 75 Years and over | 0 (0.0%) | 24 (100.0%) |
Disability Class: Ambulatory Difficulty
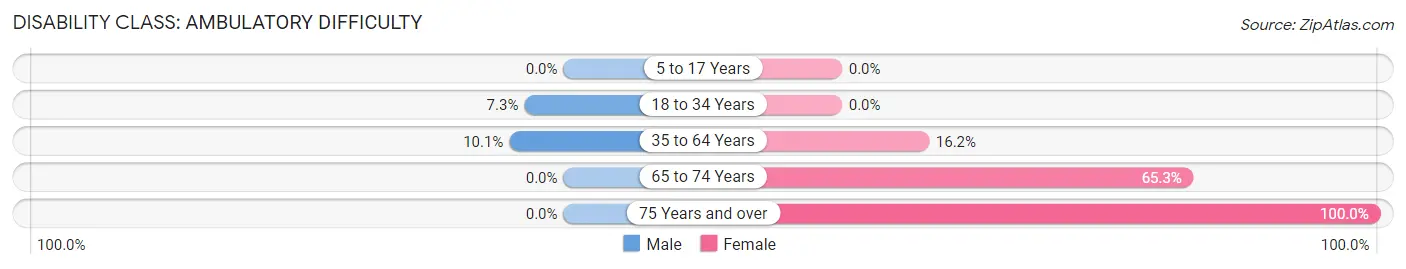
| Age Bracket | Male | Female |
| 5 to 17 Years | 0 (0.0%) | 0 (0.0%) |
| 18 to 34 Years | 26 (7.3%) | 0 (0.0%) |
| 35 to 64 Years | 20 (10.1%) | 64 (16.2%) |
| 65 to 74 Years | 0 (0.0%) | 64 (65.3%) |
| 75 Years and over | 0 (0.0%) | 24 (100.0%) |
Disability Class: Self-Care Difficulty
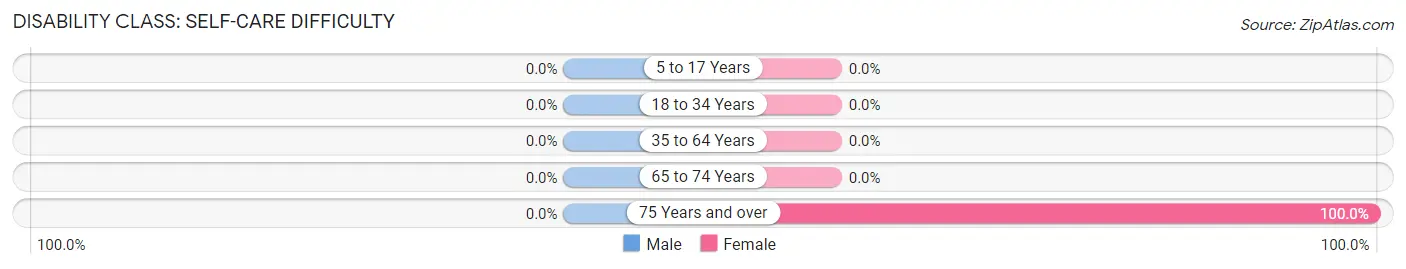
| Age Bracket | Male | Female |
| 5 to 17 Years | 0 (0.0%) | 0 (0.0%) |
| 18 to 34 Years | 0 (0.0%) | 0 (0.0%) |
| 35 to 64 Years | 0 (0.0%) | 0 (0.0%) |
| 65 to 74 Years | 0 (0.0%) | 0 (0.0%) |
| 75 Years and over | 0 (0.0%) | 24 (100.0%) |
Technology Access in DeLisle
Computing Device Access in DeLisle
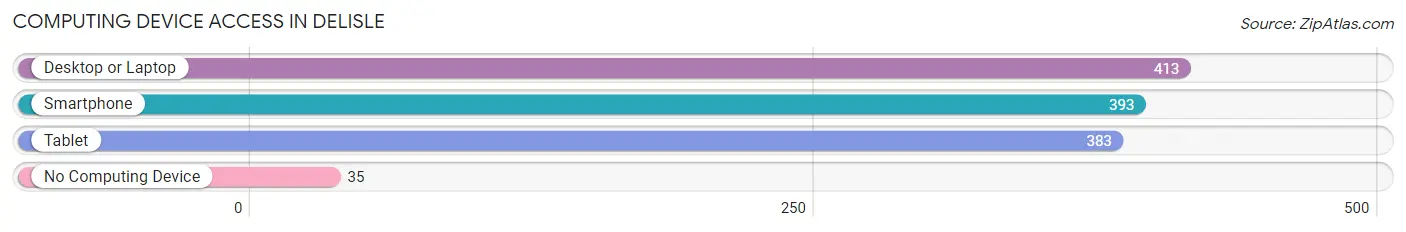
| Device Type | # Households | % Households |
| Desktop or Laptop | 413 | 92.2% |
| Smartphone | 393 | 87.7% |
| Tablet | 383 | 85.5% |
| No Computing Device | 35 | 7.8% |
| Total | 448 | 100.0% |
Internet Access in DeLisle
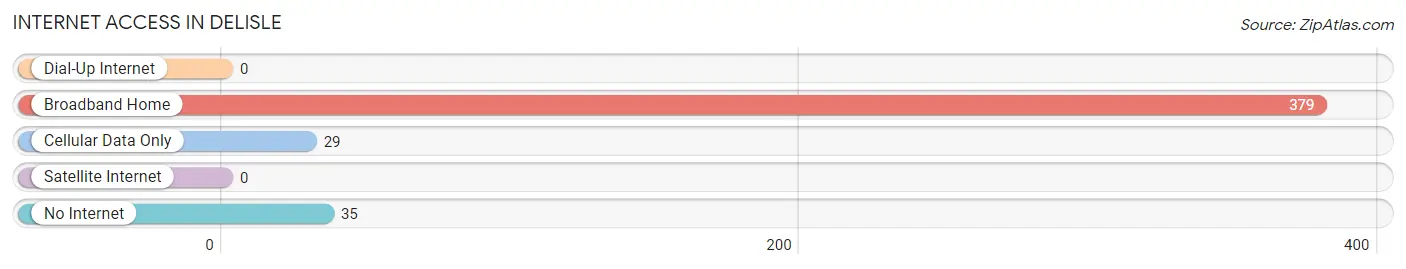
| Internet Type | # Households | % Households |
| Dial-Up Internet | 0 | 0.0% |
| Broadband Home | 379 | 84.6% |
| Cellular Data Only | 29 | 6.5% |
| Satellite Internet | 0 | 0.0% |
| No Internet | 35 | 7.8% |
| Total | 448 | 100.0% |
DeLisle Summary
Delisle, Mississippi is a small town located in Stone County, Mississippi. It is situated on the banks of the Leaf River, approximately 20 miles south of Hattiesburg. The town was founded in 1883 and was named after the French explorer, Pierre Delisle. The population of Delisle was estimated to be 1,072 in 2019.
Geography
Delisle is located in the southeastern part of Stone County, Mississippi. It is situated on the banks of the Leaf River, approximately 20 miles south of Hattiesburg. The town is surrounded by rolling hills and forests, and is located in the Piney Woods region of Mississippi. The climate in Delisle is humid subtropical, with hot, humid summers and mild winters.
Economy
The economy of Delisle is largely based on agriculture and forestry. The town is home to several small businesses, including a grocery store, a hardware store, and a few restaurants. The town also has a few small manufacturing plants, which produce furniture and other wood products.
Demographics
As of 2019, the population of Delisle was estimated to be 1,072. The racial makeup of the town was 94.2% White, 4.2% African American, 0.3% Native American, 0.2% Asian, and 0.9% from other races. The median household income in Delisle was $31,250, and the median family income was $37,500.
History
Delisle was founded in 1883 and was named after the French explorer, Pierre Delisle. The town was originally a small farming community, and the main crops grown were cotton, corn, and sweet potatoes. In the early 1900s, the town began to grow and develop, and several businesses were established. In the 1950s, the town began to decline, and many of the businesses closed. In the late 1970s, the town began to experience a resurgence, and several new businesses opened. Today, Delisle is a small, rural town with a strong sense of community.
Common Questions
What is Per Capita Income in DeLisle?
Per Capita income in DeLisle is $27,172.
What is the Median Family Income in DeLisle?
Median Family Income in DeLisle is $107,917.
What is the Median Household income in DeLisle?
Median Household Income in DeLisle is $89,274.
What is Inequality or Gini Index in DeLisle?
Inequality or Gini Index in DeLisle is 0.40.
What is the Total Population of DeLisle?
Total Population of DeLisle is 1,583.
What is the Total Male Population of DeLisle?
Total Male Population of DeLisle is 848.
What is the Total Female Population of DeLisle?
Total Female Population of DeLisle is 735.
What is the Ratio of Males per 100 Females in DeLisle?
There are 115.37 Males per 100 Females in DeLisle.
What is the Ratio of Females per 100 Males in DeLisle?
There are 86.67 Females per 100 Males in DeLisle.
What is the Median Population Age in DeLisle?
Median Population Age in DeLisle is 25.8 Years.
What is the Average Family Size in DeLisle
Average Family Size in DeLisle is 3.8 People.
What is the Average Household Size in DeLisle
Average Household Size in DeLisle is 3.5 People.
How Large is the Labor Force in DeLisle?
There are 680 People in the Labor Forcein in DeLisle.
What is the Percentage of People in the Labor Force in DeLisle?
56.4% of People are in the Labor Force in DeLisle.