Zip Codes with the Highest Percentage of Population Employed in Security & Protection in Vicksburg, MS
RELATED REPORTS & OPTIONS
Security & Protection
Vicksburg
Compare Zip Codes
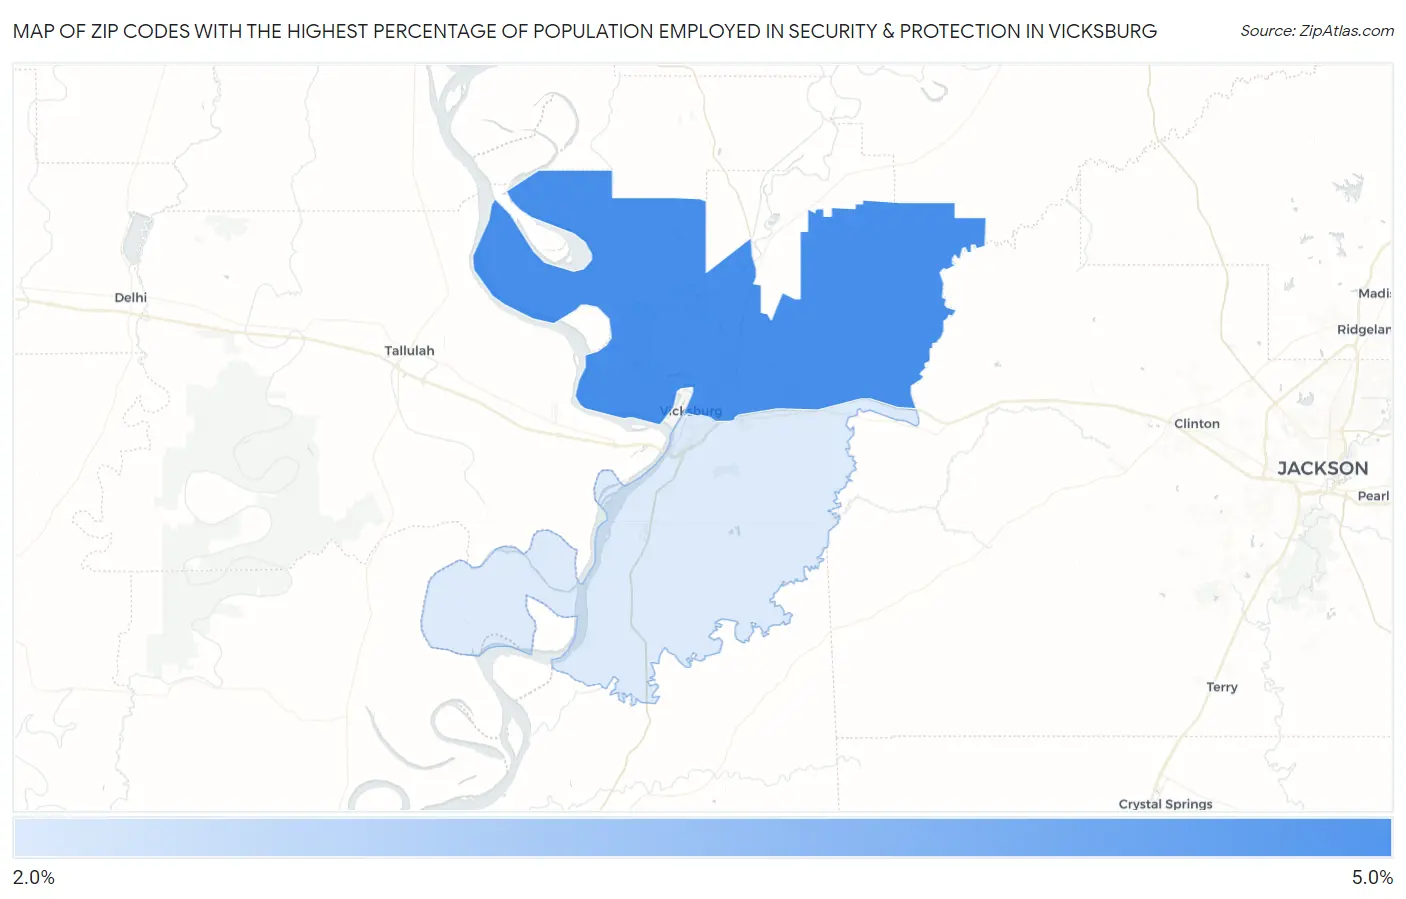
Map of Zip Codes with the Highest Percentage of Population Employed in Security & Protection in Vicksburg
2.8%
5.0%
Zip Codes with the Highest Percentage of Population Employed in Security & Protection in Vicksburg, MS
| Zip Code | % Employed | vs State | vs National | |
| 1. | 39183 | 5.0% | 2.4%(+2.59)#56 | 2.1%(+2.82)#2,957 |
| 2. | 39180 | 2.8% | 2.4%(+0.435)#126 | 2.1%(+0.664)#8,058 |
1
Common Questions
What are the Top Zip Codes with the Highest Percentage of Population Employed in Security & Protection in Vicksburg, MS?
Top Zip Codes with the Highest Percentage of Population Employed in Security & Protection in Vicksburg, MS are:
What zip code has the Highest Percentage of Population Employed in Security & Protection in Vicksburg, MS?
39183 has the Highest Percentage of Population Employed in Security & Protection in Vicksburg, MS with 5.0%.
What is the Percentage of Population Employed in Security & Protection in Vicksburg, MS?
Percentage of Population Employed in Security & Protection in Vicksburg is 2.9%.
What is the Percentage of Population Employed in Security & Protection in Mississippi?
Percentage of Population Employed in Security & Protection in Mississippi is 2.4%.
What is the Percentage of Population Employed in Security & Protection in the United States?
Percentage of Population Employed in Security & Protection in the United States is 2.1%.