Lynchburg, MS Map & Demographics
Lynchburg Map
Lynchburg Overview
$42,199
PER CAPITA INCOME
$102,438
AVG FAMILY INCOME
$94,688
AVG HOUSEHOLD INCOME
8.5%
WAGE / INCOME GAP [ % ]
91.5¢/ $1
WAGE / INCOME GAP [ $ ]
0.38
INEQUALITY / GINI INDEX
1,950
TOTAL POPULATION
1,019
MALE POPULATION
931
FEMALE POPULATION
109.45
MALES / 100 FEMALES
91.36
FEMALES / 100 MALES
46.5
MEDIAN AGE
2.6
AVG FAMILY SIZE
2.3
AVG HOUSEHOLD SIZE
1,374
LABOR FORCE [ PEOPLE ]
80.2%
PERCENT IN LABOR FORCE
13.8%
UNEMPLOYMENT RATE
Income in Lynchburg
Income Overview in Lynchburg
Per Capita Income in Lynchburg is $42,199, while median incomes of families and households are $102,438 and $94,688 respectively.
| Characteristic | Number | Measure |
| Per Capita Income | 1,950 | $42,199 |
| Median Family Income | 657 | $102,438 |
| Mean Family Income | 657 | $113,224 |
| Median Household Income | 835 | $94,688 |
| Mean Household Income | 835 | $100,909 |
| Income Deficit | 657 | $0 |
| Wage / Income Gap (%) | 1,950 | 8.48% |
| Wage / Income Gap ($) | 1,950 | 91.52¢ per $1 |
| Gini / Inequality Index | 1,950 | 0.38 |
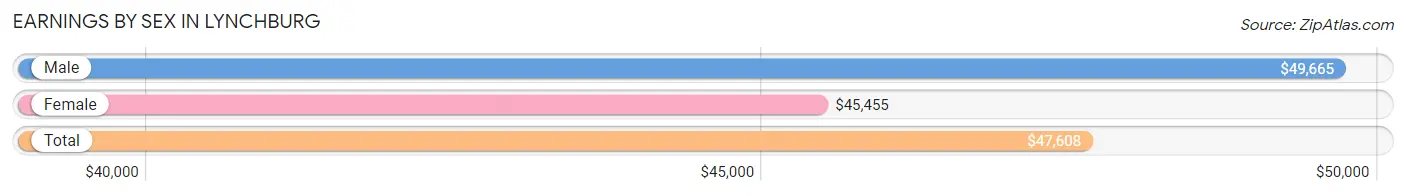
Earnings by Sex in Lynchburg
Average Earnings in Lynchburg are $47,608, $49,665 for men and $45,455 for women, a difference of 8.5%.
| Sex | Number | Average Earnings |
| Male | 575 (46.2%) | $49,665 |
| Female | 670 (53.8%) | $45,455 |
| Total | 1,245 (100.0%) | $47,608 |
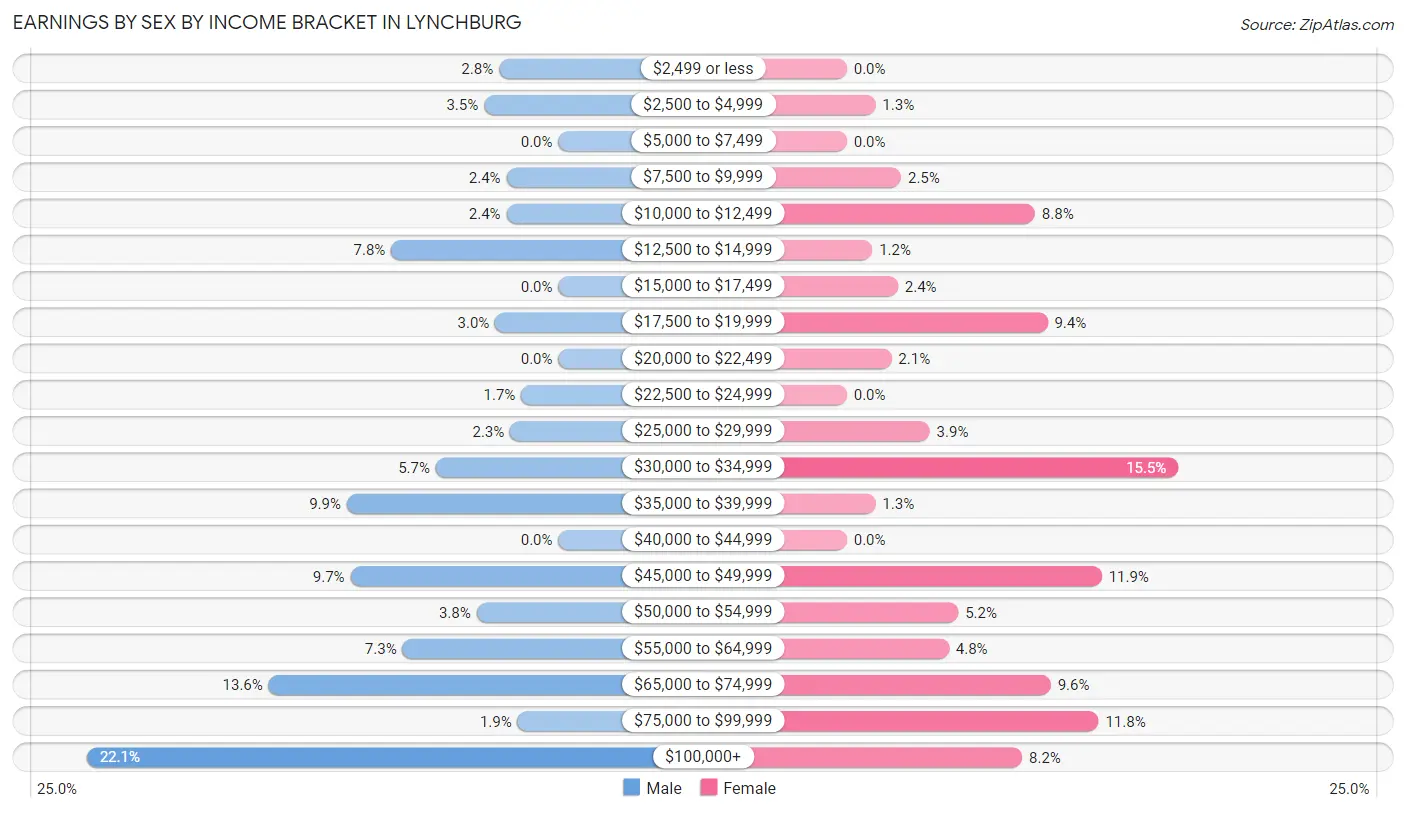
Earnings by Sex by Income Bracket in Lynchburg
The most common earnings brackets in Lynchburg are $100,000+ for men (127 | 22.1%) and $30,000 to $34,999 for women (104 | 15.5%).
| Income | Male | Female |
| $2,499 or less | 16 (2.8%) | 0 (0.0%) |
| $2,500 to $4,999 | 20 (3.5%) | 9 (1.3%) |
| $5,000 to $7,499 | 0 (0.0%) | 0 (0.0%) |
| $7,500 to $9,999 | 14 (2.4%) | 17 (2.5%) |
| $10,000 to $12,499 | 14 (2.4%) | 59 (8.8%) |
| $12,500 to $14,999 | 45 (7.8%) | 8 (1.2%) |
| $15,000 to $17,499 | 0 (0.0%) | 16 (2.4%) |
| $17,500 to $19,999 | 17 (3.0%) | 63 (9.4%) |
| $20,000 to $22,499 | 0 (0.0%) | 14 (2.1%) |
| $22,500 to $24,999 | 10 (1.7%) | 0 (0.0%) |
| $25,000 to $29,999 | 13 (2.3%) | 26 (3.9%) |
| $30,000 to $34,999 | 33 (5.7%) | 104 (15.5%) |
| $35,000 to $39,999 | 57 (9.9%) | 9 (1.3%) |
| $40,000 to $44,999 | 0 (0.0%) | 0 (0.0%) |
| $45,000 to $49,999 | 56 (9.7%) | 80 (11.9%) |
| $50,000 to $54,999 | 22 (3.8%) | 35 (5.2%) |
| $55,000 to $64,999 | 42 (7.3%) | 32 (4.8%) |
| $65,000 to $74,999 | 78 (13.6%) | 64 (9.6%) |
| $75,000 to $99,999 | 11 (1.9%) | 79 (11.8%) |
| $100,000+ | 127 (22.1%) | 55 (8.2%) |
| Total | 575 (100.0%) | 670 (100.0%) |
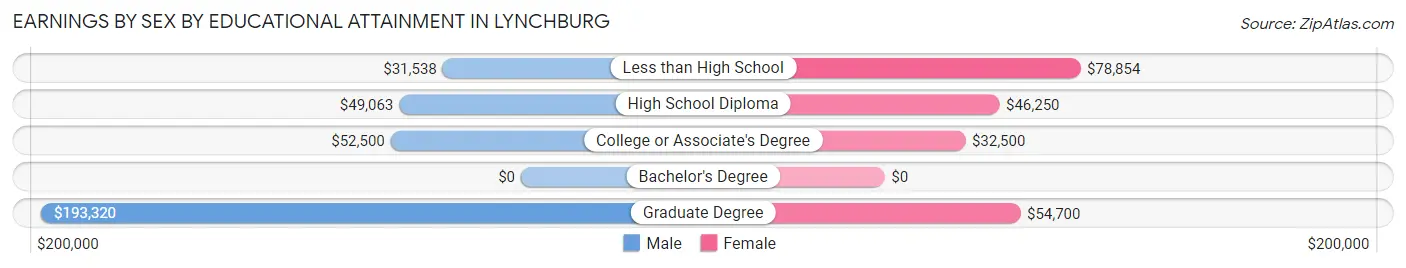
Earnings by Sex by Educational Attainment in Lynchburg
Average earnings in Lynchburg are $56,607 for men and $47,068 for women, a difference of 16.9%. Men with an educational attainment of graduate degree enjoy the highest average annual earnings of $193,320, while those with less than high school education earn the least with $31,538. Women with an educational attainment of less than high school earn the most with the average annual earnings of $78,854, while those with college or associate's degree education have the smallest earnings of $32,500.
| Educational Attainment | Male Income | Female Income |
| Less than High School | $31,538 | $78,854 |
| High School Diploma | $49,063 | $46,250 |
| College or Associate's Degree | $52,500 | $32,500 |
| Bachelor's Degree | - | - |
| Graduate Degree | $193,320 | $54,700 |
| Total | $56,607 | $47,068 |
Family Income in Lynchburg
Family Income Brackets in Lynchburg
According to the Lynchburg family income data, there are 189 families falling into the $100,000 to $149,999 income range, which is the most common income bracket and makes up 28.8% of all families.
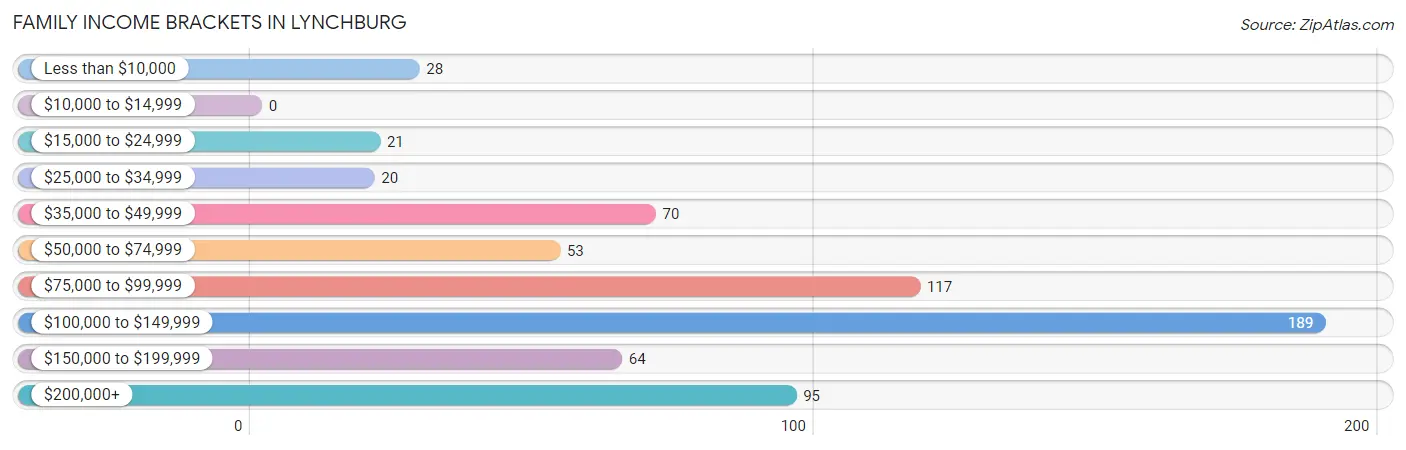
| Income Bracket | # Families | % Families |
| Less than $10,000 | 28 | 4.3% |
| $10,000 to $14,999 | 0 | 0.0% |
| $15,000 to $24,999 | 21 | 3.2% |
| $25,000 to $34,999 | 20 | 3.0% |
| $35,000 to $49,999 | 70 | 10.7% |
| $50,000 to $74,999 | 53 | 8.1% |
| $75,000 to $99,999 | 117 | 17.8% |
| $100,000 to $149,999 | 189 | 28.8% |
| $150,000 to $199,999 | 64 | 9.7% |
| $200,000+ | 95 | 14.5% |
Family Income by Famaliy Size in Lynchburg
3-person families (63 | 9.6%) account for the highest median family income in Lynchburg with $129,191 per family, while 2-person families (428 | 65.1%) have the highest median income of $49,776 per family member.
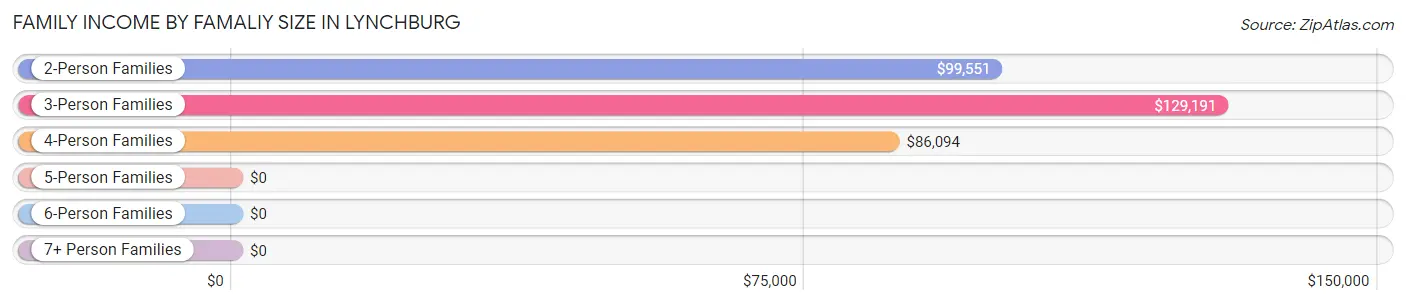
| Income Bracket | # Families | Median Income |
| 2-Person Families | 428 (65.1%) | $99,551 |
| 3-Person Families | 63 (9.6%) | $129,191 |
| 4-Person Families | 137 (20.8%) | $86,094 |
| 5-Person Families | 12 (1.8%) | $0 |
| 6-Person Families | 17 (2.6%) | $0 |
| 7+ Person Families | 0 (0.0%) | $0 |
| Total | 657 (100.0%) | $102,438 |
Family Income by Number of Earners in Lynchburg
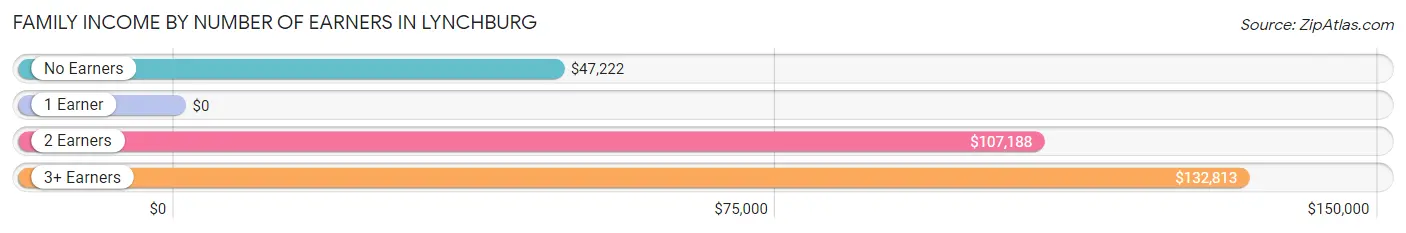
| Number of Earners | # Families | Median Income |
| No Earners | 106 (16.1%) | $47,222 |
| 1 Earner | 151 (23.0%) | $0 |
| 2 Earners | 317 (48.2%) | $107,188 |
| 3+ Earners | 83 (12.6%) | $132,813 |
| Total | 657 (100.0%) | $102,438 |
Household Income in Lynchburg
Household Income Brackets in Lynchburg
With 218 households falling in the category, the $100,000 to $149,999 income range is the most frequent in Lynchburg, accounting for 26.1% of all households.
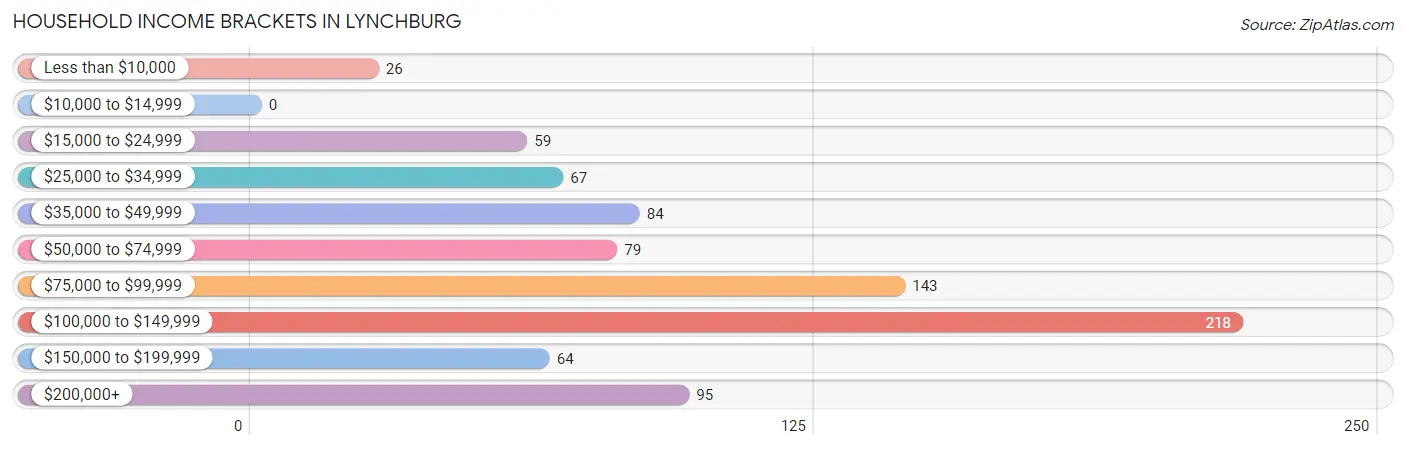
| Income Bracket | # Households | % Households |
| Less than $10,000 | 26 | 3.1% |
| $10,000 to $14,999 | 0 | 0.0% |
| $15,000 to $24,999 | 59 | 7.1% |
| $25,000 to $34,999 | 67 | 8.0% |
| $35,000 to $49,999 | 84 | 10.1% |
| $50,000 to $74,999 | 79 | 9.5% |
| $75,000 to $99,999 | 143 | 17.1% |
| $100,000 to $149,999 | 218 | 26.1% |
| $150,000 to $199,999 | 64 | 7.7% |
| $200,000+ | 95 | 11.4% |
Household Income by Householder Age in Lynchburg
The median household income in Lynchburg is $94,688, with the highest median household income of $108,100 found in the 45 to 64 years age bracket for the primary householder. A total of 564 households (67.5%) fall into this category.
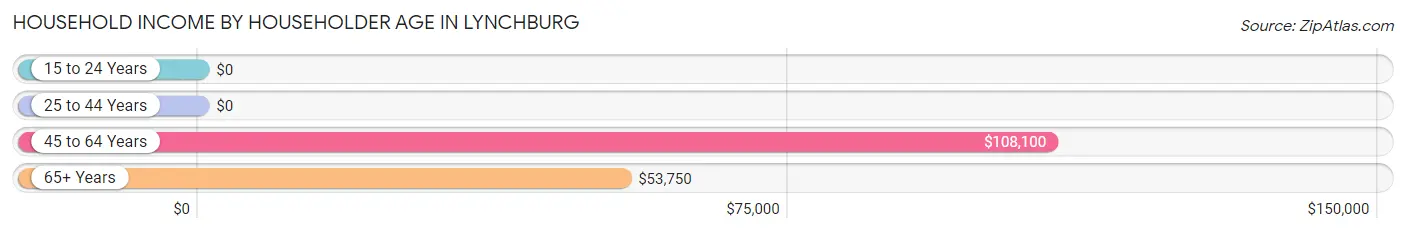
| Income Bracket | # Households | Median Income |
| 15 to 24 Years | 0 (0.0%) | $0 |
| 25 to 44 Years | 167 (20.0%) | $0 |
| 45 to 64 Years | 564 (67.5%) | $108,100 |
| 65+ Years | 104 (12.5%) | $53,750 |
| Total | 835 (100.0%) | $94,688 |
Poverty in Lynchburg
Income Below Poverty by Sex and Age in Lynchburg
With 8.5% poverty level for males and 4.5% for females among the residents of Lynchburg, 6 to 11 year old males and 6 to 11 year old females are the most vulnerable to poverty, with 9 males (28.1%) and 33 females (78.6%) in their respective age groups living below the poverty level.
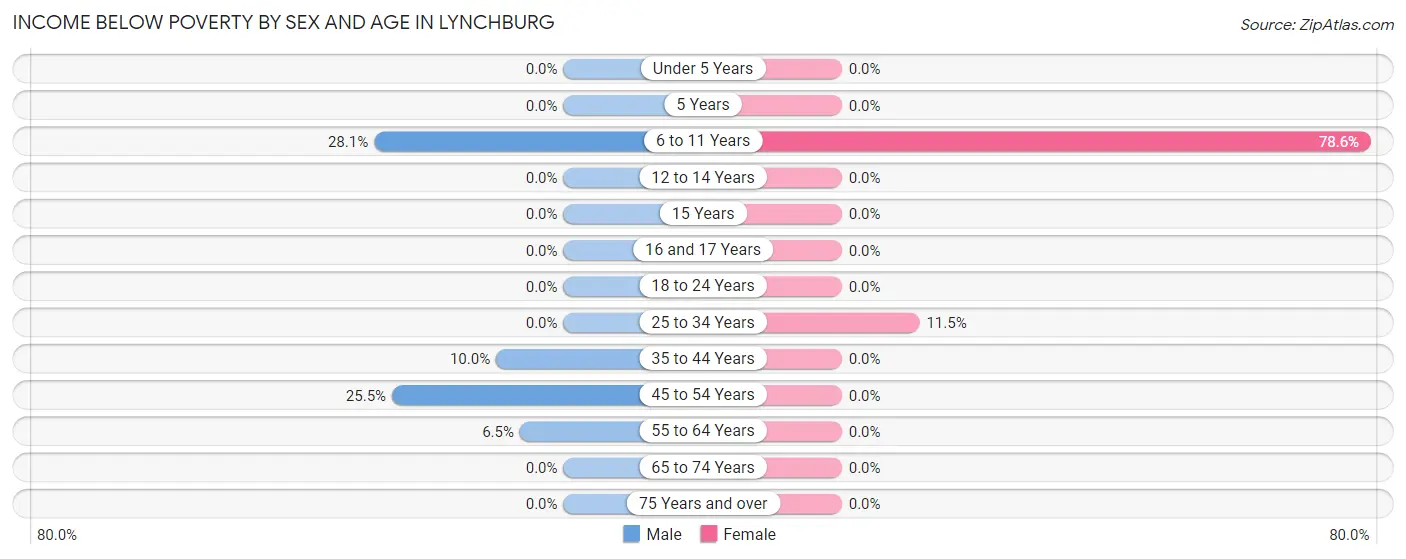
| Age Bracket | Male | Female |
| Under 5 Years | 0 (0.0%) | 0 (0.0%) |
| 5 Years | 0 (0.0%) | 0 (0.0%) |
| 6 to 11 Years | 9 (28.1%) | 33 (78.6%) |
| 12 to 14 Years | 0 (0.0%) | 0 (0.0%) |
| 15 Years | 0 (0.0%) | 0 (0.0%) |
| 16 and 17 Years | 0 (0.0%) | 0 (0.0%) |
| 18 to 24 Years | 0 (0.0%) | 0 (0.0%) |
| 25 to 34 Years | 0 (0.0%) | 9 (11.5%) |
| 35 to 44 Years | 10 (10.0%) | 0 (0.0%) |
| 45 to 54 Years | 55 (25.5%) | 0 (0.0%) |
| 55 to 64 Years | 13 (6.5%) | 0 (0.0%) |
| 65 to 74 Years | 0 (0.0%) | 0 (0.0%) |
| 75 Years and over | 0 (0.0%) | 0 (0.0%) |
| Total | 87 (8.5%) | 42 (4.5%) |
Income Above Poverty by Sex and Age in Lynchburg
According to the poverty statistics in Lynchburg, males aged under 5 years and females aged under 5 years are the age groups that are most secure financially, with 100.0% of males and 100.0% of females in these age groups living above the poverty line.
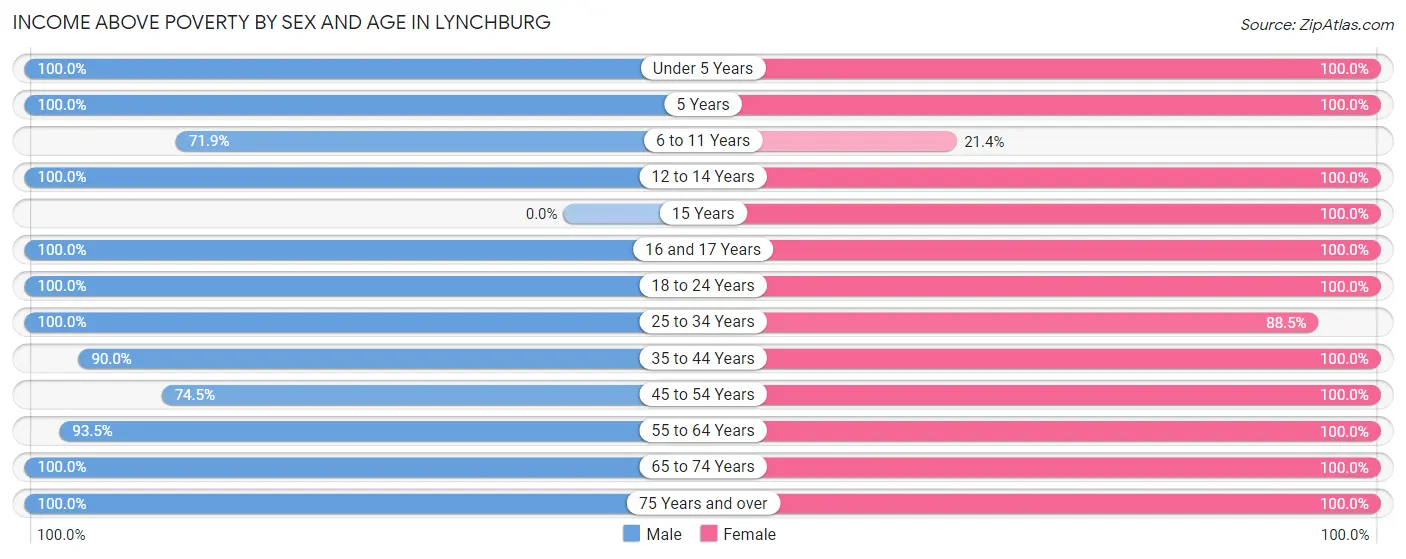
| Age Bracket | Male | Female |
| Under 5 Years | 51 (100.0%) | 12 (100.0%) |
| 5 Years | 38 (100.0%) | 12 (100.0%) |
| 6 to 11 Years | 23 (71.9%) | 9 (21.4%) |
| 12 to 14 Years | 26 (100.0%) | 18 (100.0%) |
| 15 Years | 0 (0.0%) | 6 (100.0%) |
| 16 and 17 Years | 16 (100.0%) | 13 (100.0%) |
| 18 to 24 Years | 70 (100.0%) | 71 (100.0%) |
| 25 to 34 Years | 185 (100.0%) | 69 (88.5%) |
| 35 to 44 Years | 90 (90.0%) | 118 (100.0%) |
| 45 to 54 Years | 161 (74.5%) | 211 (100.0%) |
| 55 to 64 Years | 188 (93.5%) | 226 (100.0%) |
| 65 to 74 Years | 37 (100.0%) | 69 (100.0%) |
| 75 Years and over | 47 (100.0%) | 55 (100.0%) |
| Total | 932 (91.5%) | 889 (95.5%) |
Income Below Poverty Among Married-Couple Families in Lynchburg
The poverty statistics for married-couple families in Lynchburg show that 2.0% or 10 of the total 510 families live below the poverty line. Families with 1 or 2 children have the highest poverty rate of 9.7%, comprising of 10 families. On the other hand, families with no children have the lowest poverty rate of 0.0%, which includes 0 families.
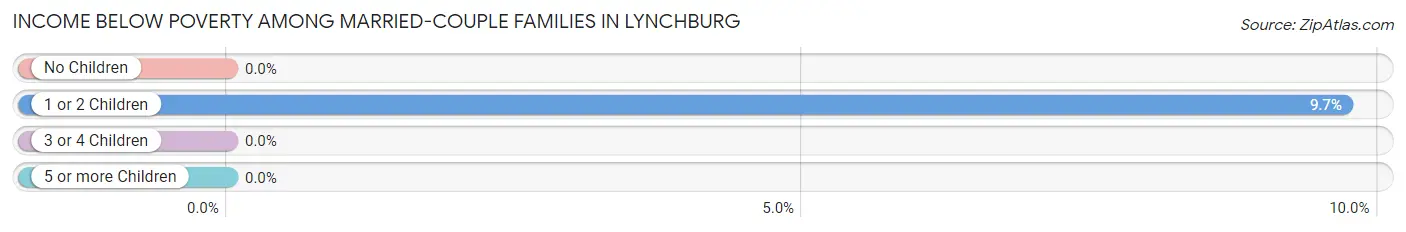
| Children | Above Poverty | Below Poverty |
| No Children | 390 (100.0%) | 0 (0.0%) |
| 1 or 2 Children | 93 (90.3%) | 10 (9.7%) |
| 3 or 4 Children | 17 (100.0%) | 0 (0.0%) |
| 5 or more Children | 0 (0.0%) | 0 (0.0%) |
| Total | 500 (98.0%) | 10 (2.0%) |
Income Below Poverty Among Single-Parent Households in Lynchburg
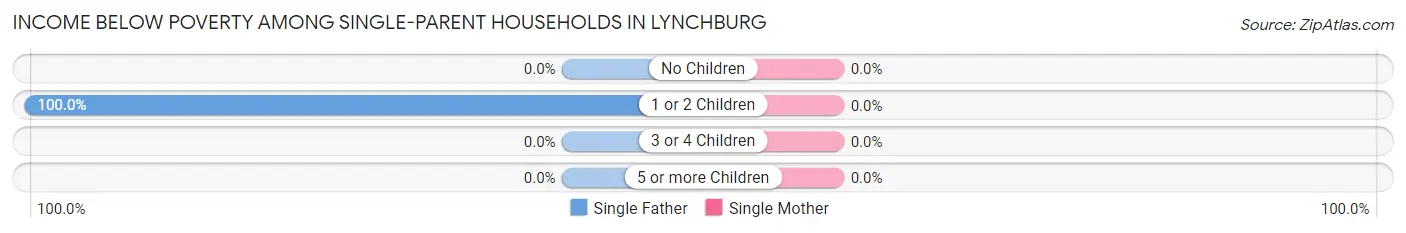
| Children | Single Father | Single Mother |
| No Children | 0 (0.0%) | 0 (0.0%) |
| 1 or 2 Children | 28 (100.0%) | 0 (0.0%) |
| 3 or 4 Children | 0 (0.0%) | 0 (0.0%) |
| 5 or more Children | 0 (0.0%) | 0 (0.0%) |
| Total | 28 (100.0%) | 0 (0.0%) |
Income Below Poverty Among Married-Couple vs Single-Parent Households in Lynchburg
The poverty data for Lynchburg shows that 10 of the married-couple family households (2.0%) and 28 of the single-parent households (19.1%) are living below the poverty level. Within the married-couple family households, those with 1 or 2 children have the highest poverty rate, with 10 households (9.7%) falling below the poverty line. Among the single-parent households, those with 1 or 2 children have the highest poverty rate, with 28 household (41.8%) living below poverty.
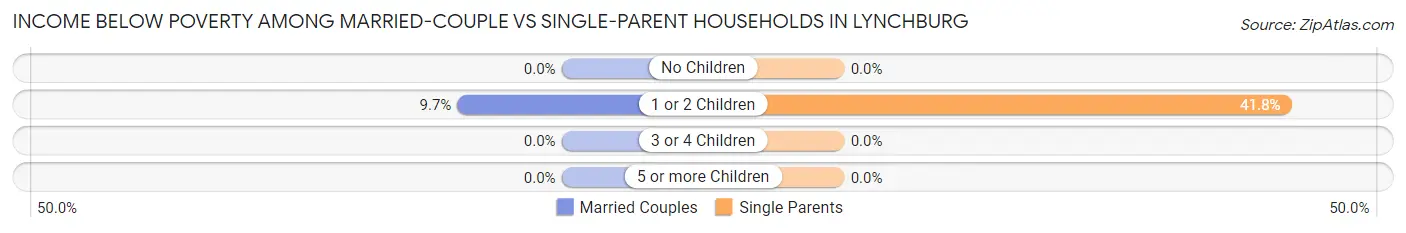
| Children | Married-Couple Families | Single-Parent Households |
| No Children | 0 (0.0%) | 0 (0.0%) |
| 1 or 2 Children | 10 (9.7%) | 28 (41.8%) |
| 3 or 4 Children | 0 (0.0%) | 0 (0.0%) |
| 5 or more Children | 0 (0.0%) | 0 (0.0%) |
| Total | 10 (2.0%) | 28 (19.1%) |
Race in Lynchburg
The most populous races in Lynchburg are White / Caucasian (1,086 | 55.7%), Black / African American (663 | 34.0%), and Two or more Races (101 | 5.2%).
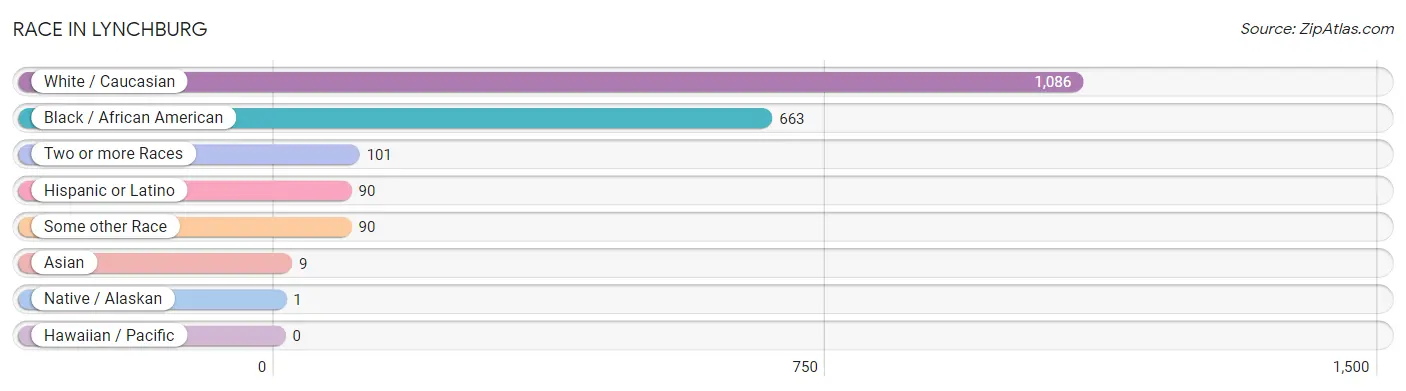
| Race | # Population | % Population |
| Asian | 9 | 0.5% |
| Black / African American | 663 | 34.0% |
| Hawaiian / Pacific | 0 | 0.0% |
| Hispanic or Latino | 90 | 4.6% |
| Native / Alaskan | 1 | 0.1% |
| White / Caucasian | 1,086 | 55.7% |
| Two or more Races | 101 | 5.2% |
| Some other Race | 90 | 4.6% |
| Total | 1,950 | 100.0% |
Ancestry in Lynchburg
The most populous ancestries reported in Lynchburg are Irish (223 | 11.4%), English (185 | 9.5%), American (116 | 5.9%), Italian (102 | 5.2%), and German (90 | 4.6%), together accounting for 36.7% of all Lynchburg residents.
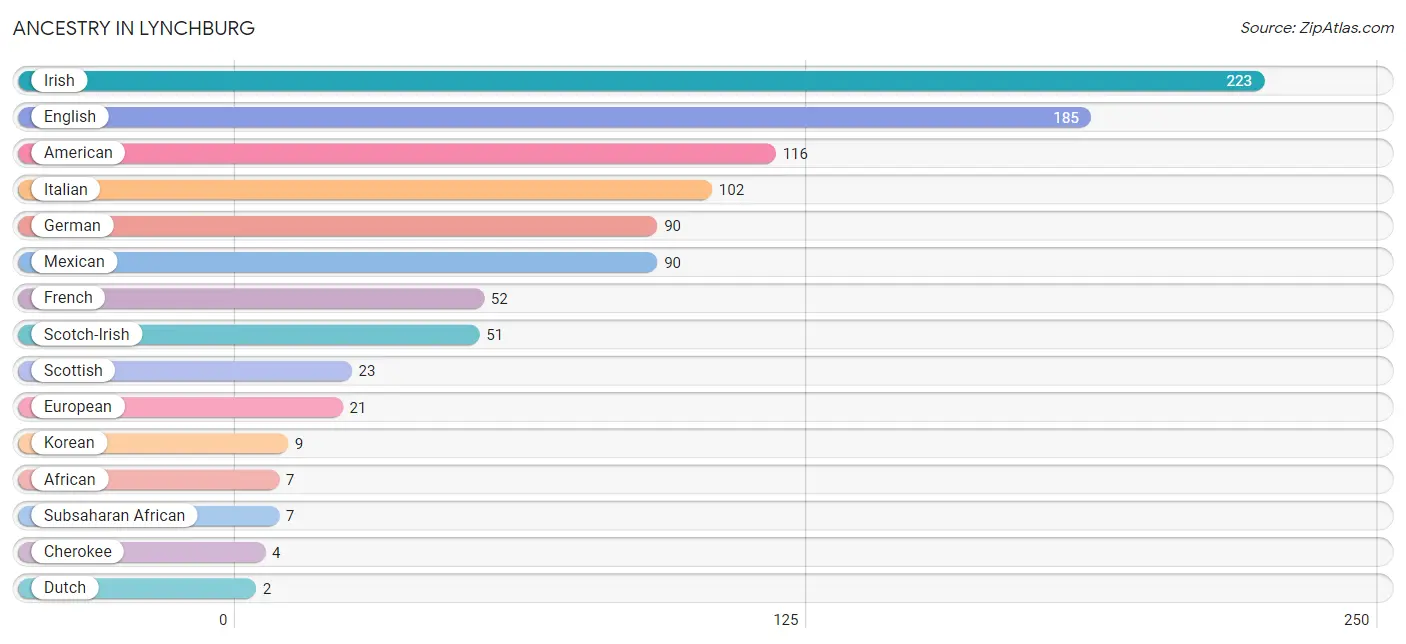
| Ancestry | # Population | % Population |
| African | 7 | 0.4% |
| American | 116 | 5.9% |
| Cherokee | 4 | 0.2% |
| Dutch | 2 | 0.1% |
| English | 185 | 9.5% |
| European | 21 | 1.1% |
| French | 52 | 2.7% |
| German | 90 | 4.6% |
| Irish | 223 | 11.4% |
| Italian | 102 | 5.2% |
| Korean | 9 | 0.5% |
| Mexican | 90 | 4.6% |
| Scotch-Irish | 51 | 2.6% |
| Scottish | 23 | 1.2% |
| Subsaharan African | 7 | 0.4% | View All 15 Rows |
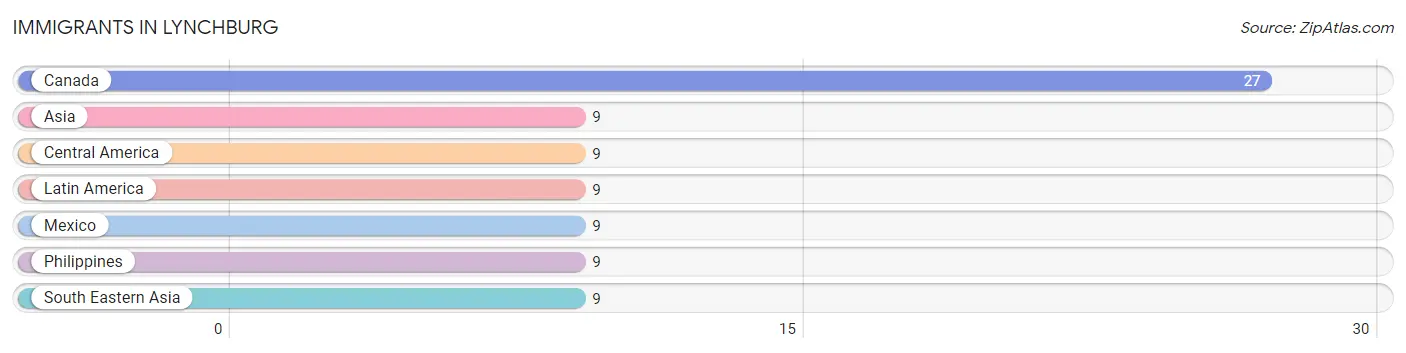
Immigrants in Lynchburg
The most numerous immigrant groups reported in Lynchburg came from Canada (27 | 1.4%), Asia (9 | 0.5%), Central America (9 | 0.5%), Latin America (9 | 0.5%), and Mexico (9 | 0.5%), together accounting for 3.2% of all Lynchburg residents.
| Immigration Origin | # Population | % Population |
| Asia | 9 | 0.5% |
| Canada | 27 | 1.4% |
| Central America | 9 | 0.5% |
| Latin America | 9 | 0.5% |
| Mexico | 9 | 0.5% |
| Philippines | 9 | 0.5% |
| South Eastern Asia | 9 | 0.5% | View All 7 Rows |
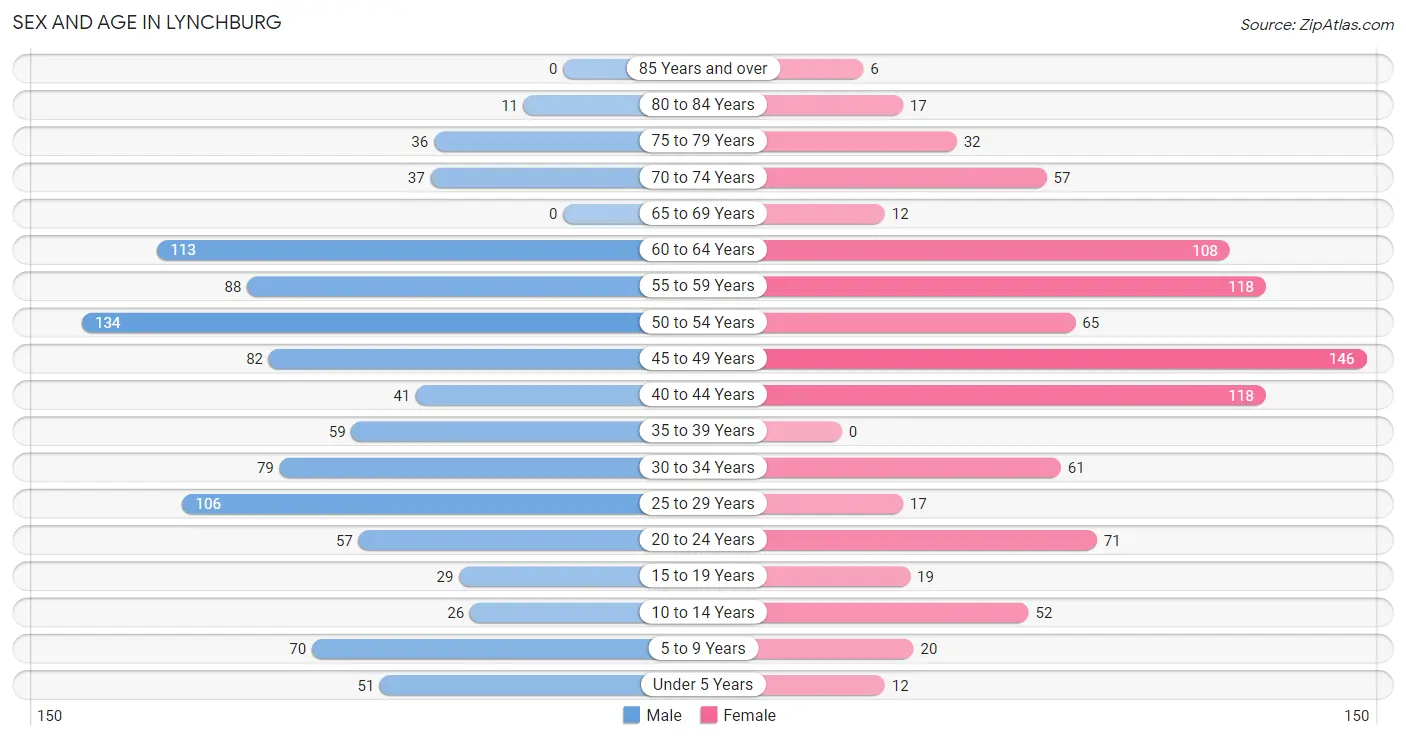
Sex and Age in Lynchburg
Sex and Age in Lynchburg
The most populous age groups in Lynchburg are 50 to 54 Years (134 | 13.2%) for men and 45 to 49 Years (146 | 15.7%) for women.
| Age Bracket | Male | Female |
| Under 5 Years | 51 (5.0%) | 12 (1.3%) |
| 5 to 9 Years | 70 (6.9%) | 20 (2.1%) |
| 10 to 14 Years | 26 (2.5%) | 52 (5.6%) |
| 15 to 19 Years | 29 (2.9%) | 19 (2.0%) |
| 20 to 24 Years | 57 (5.6%) | 71 (7.6%) |
| 25 to 29 Years | 106 (10.4%) | 17 (1.8%) |
| 30 to 34 Years | 79 (7.7%) | 61 (6.6%) |
| 35 to 39 Years | 59 (5.8%) | 0 (0.0%) |
| 40 to 44 Years | 41 (4.0%) | 118 (12.7%) |
| 45 to 49 Years | 82 (8.1%) | 146 (15.7%) |
| 50 to 54 Years | 134 (13.2%) | 65 (7.0%) |
| 55 to 59 Years | 88 (8.6%) | 118 (12.7%) |
| 60 to 64 Years | 113 (11.1%) | 108 (11.6%) |
| 65 to 69 Years | 0 (0.0%) | 12 (1.3%) |
| 70 to 74 Years | 37 (3.6%) | 57 (6.1%) |
| 75 to 79 Years | 36 (3.5%) | 32 (3.4%) |
| 80 to 84 Years | 11 (1.1%) | 17 (1.8%) |
| 85 Years and over | 0 (0.0%) | 6 (0.6%) |
| Total | 1,019 (100.0%) | 931 (100.0%) |
Families and Households in Lynchburg
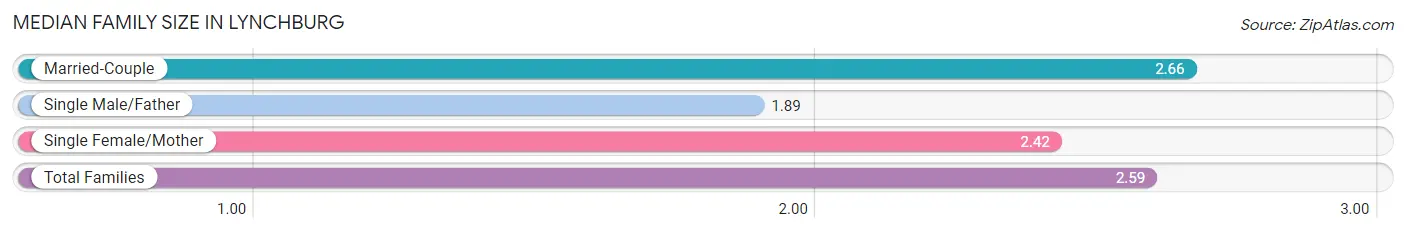
Median Family Size in Lynchburg
The median family size in Lynchburg is 2.59 persons per family, with married-couple families (510 | 77.6%) accounting for the largest median family size of 2.66 persons per family. On the other hand, single male/father families (28 | 4.3%) represent the smallest median family size with 1.89 persons per family.
| Family Type | # Families | Family Size |
| Married-Couple | 510 (77.6%) | 2.66 |
| Single Male/Father | 28 (4.3%) | 1.89 |
| Single Female/Mother | 119 (18.1%) | 2.42 |
| Total Families | 657 (100.0%) | 2.59 |
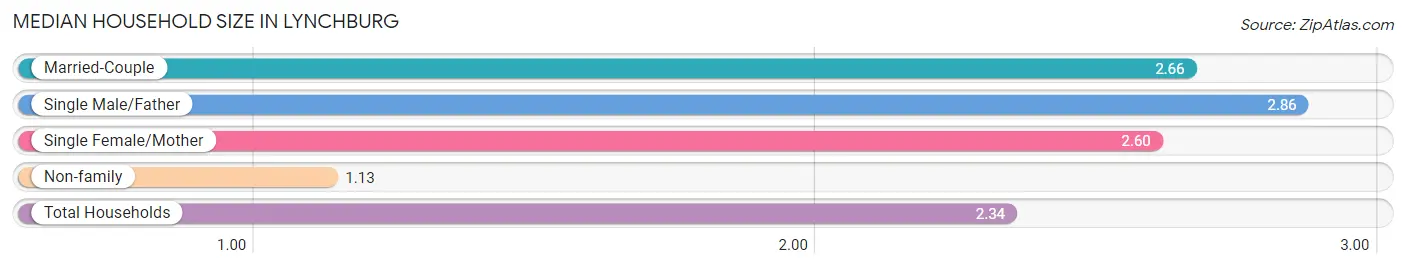
Median Household Size in Lynchburg
The median household size in Lynchburg is 2.34 persons per household, with single male/father households (28 | 3.4%) accounting for the largest median household size of 2.86 persons per household. non-family households (178 | 21.3%) represent the smallest median household size with 1.13 persons per household.
| Household Type | # Households | Household Size |
| Married-Couple | 510 (61.1%) | 2.66 |
| Single Male/Father | 28 (3.4%) | 2.86 |
| Single Female/Mother | 119 (14.2%) | 2.60 |
| Non-family | 178 (21.3%) | 1.13 |
| Total Households | 835 (100.0%) | 2.34 |
Household Size by Marriage Status in Lynchburg
Out of a total of 835 households in Lynchburg, 657 (78.7%) are family households, while 178 (21.3%) are nonfamily households. The most numerous type of family households are 2-person households, comprising 400, and the most common type of nonfamily households are 1-person households, comprising 157.
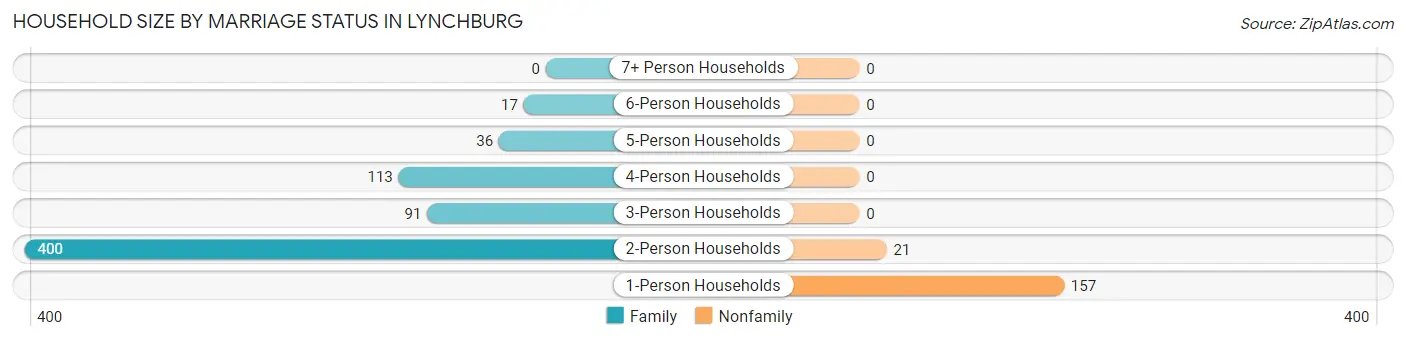
| Household Size | Family Households | Nonfamily Households |
| 1-Person Households | - | 157 (18.8%) |
| 2-Person Households | 400 (47.9%) | 21 (2.5%) |
| 3-Person Households | 91 (10.9%) | 0 (0.0%) |
| 4-Person Households | 113 (13.5%) | 0 (0.0%) |
| 5-Person Households | 36 (4.3%) | 0 (0.0%) |
| 6-Person Households | 17 (2.0%) | 0 (0.0%) |
| 7+ Person Households | 0 (0.0%) | 0 (0.0%) |
| Total | 657 (78.7%) | 178 (21.3%) |
Female Fertility in Lynchburg
Fertility by Age in Lynchburg
Average fertility rate in Lynchburg is 46.0 births per 1,000 women. Women in the age bracket of 20 to 34 years have the highest fertility rate with 134.0 births per 1,000 women. Women in the age bracket of 20 to 34 years acount for 100.0% of all women with births.
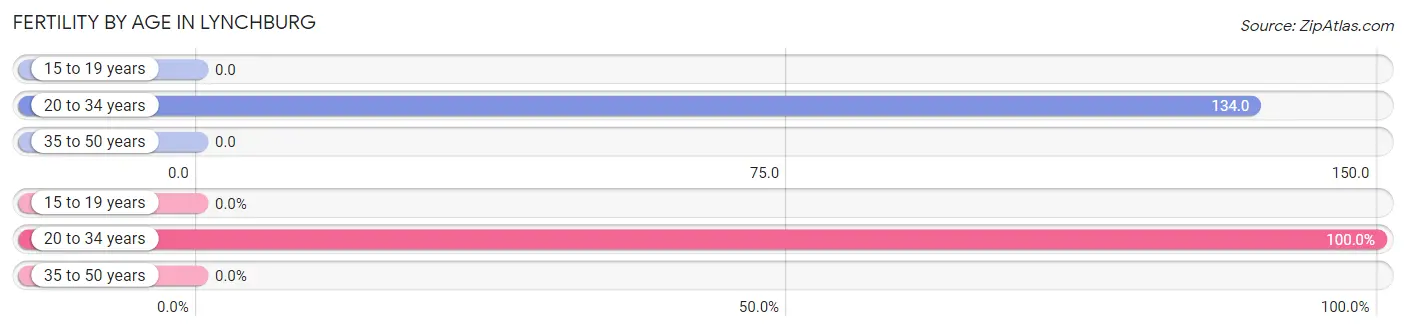
| Age Bracket | Women with Births | Births / 1,000 Women |
| 15 to 19 years | 0 (0.0%) | 0.0 |
| 20 to 34 years | 20 (100.0%) | 134.0 |
| 35 to 50 years | 0 (0.0%) | 0.0 |
| Total | 20 (100.0%) | 46.0 |
Fertility by Age by Marriage Status in Lynchburg
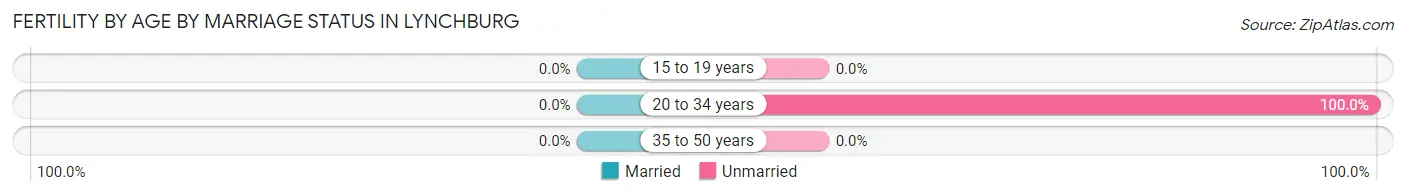
| Age Bracket | Married | Unmarried |
| 15 to 19 years | 0 (0.0%) | 0 (0.0%) |
| 20 to 34 years | 0 (0.0%) | 20 (100.0%) |
| 35 to 50 years | 0 (0.0%) | 0 (0.0%) |
| Total | 0 (0.0%) | 20 (100.0%) |
Fertility by Education in Lynchburg
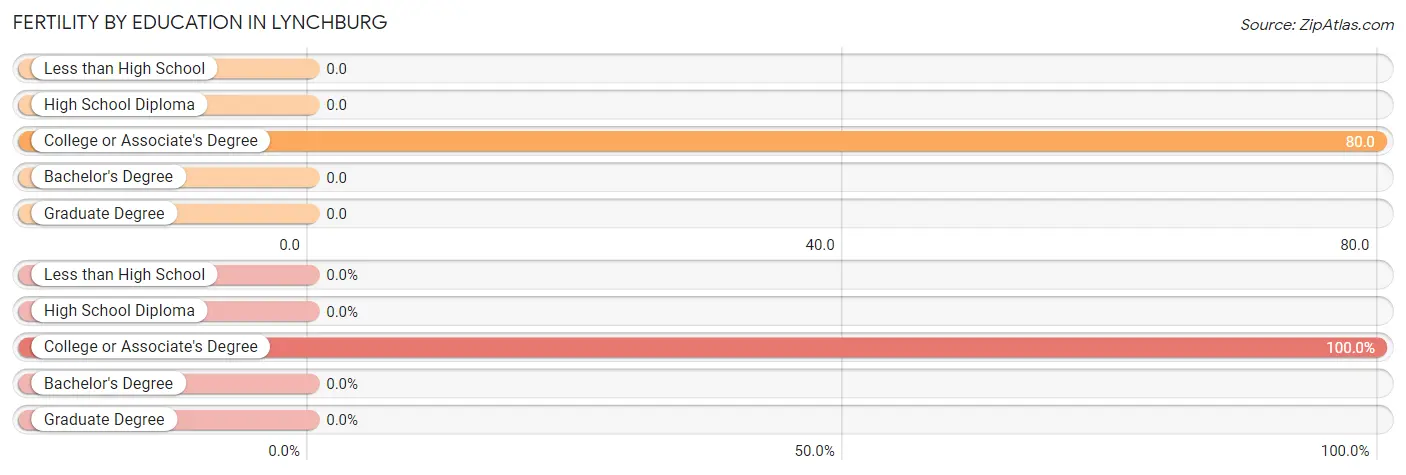
| Educational Attainment | Women with Births | Births / 1,000 Women |
| Less than High School | 0 (0.0%) | 0.0 |
| High School Diploma | 0 (0.0%) | 0.0 |
| College or Associate's Degree | 20 (100.0%) | 80.0 |
| Bachelor's Degree | 0 (0.0%) | 0.0 |
| Graduate Degree | 0 (0.0%) | 0.0 |
| Total | 20 (100.0%) | 46.0 |
Fertility by Education by Marriage Status in Lynchburg
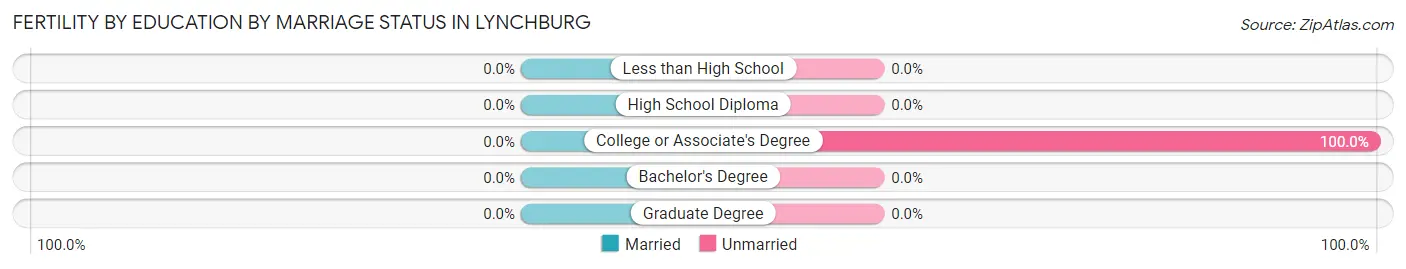
| Educational Attainment | Married | Unmarried |
| Less than High School | 0 (0.0%) | 0 (0.0%) |
| High School Diploma | 0 (0.0%) | 0 (0.0%) |
| College or Associate's Degree | 0 (0.0%) | 20 (100.0%) |
| Bachelor's Degree | 0 (0.0%) | 0 (0.0%) |
| Graduate Degree | 0 (0.0%) | 0 (0.0%) |
| Total | 0 (0.0%) | 20 (100.0%) |
Employment Characteristics in Lynchburg
Employment by Class of Employer in Lynchburg
Among the 1,184 employed individuals in Lynchburg, private company employees (678 | 57.3%), not-for-profit organizations (145 | 12.2%), and local government employees (124 | 10.5%) make up the most common classes of employment.
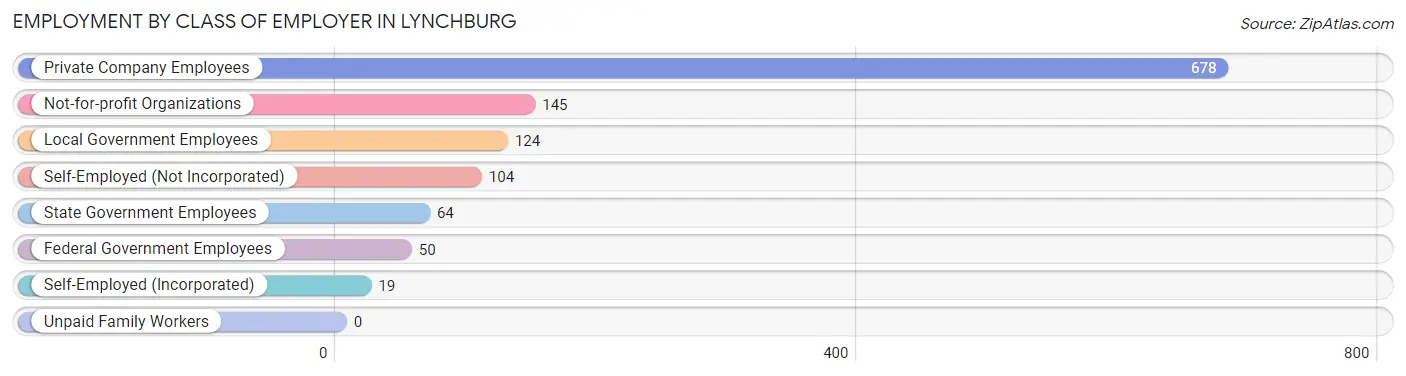
| Employer Class | # Employees | % Employees |
| Private Company Employees | 678 | 57.3% |
| Self-Employed (Incorporated) | 19 | 1.6% |
| Self-Employed (Not Incorporated) | 104 | 8.8% |
| Not-for-profit Organizations | 145 | 12.2% |
| Local Government Employees | 124 | 10.5% |
| State Government Employees | 64 | 5.4% |
| Federal Government Employees | 50 | 4.2% |
| Unpaid Family Workers | 0 | 0.0% |
| Total | 1,184 | 100.0% |
Employment Status by Age in Lynchburg
According to the labor force statistics for Lynchburg, out of the total population over 16 years of age (1,713), 80.2% or 1,374 individuals are in the labor force, with 13.8% or 190 of them unemployed. The age group with the highest labor force participation rate is 20 to 24 years, with 100.0% or 128 individuals in the labor force. Within the labor force, the 25 to 29 years age range has the highest percentage of unemployed individuals, with 69.0% or 69 of them being unemployed.
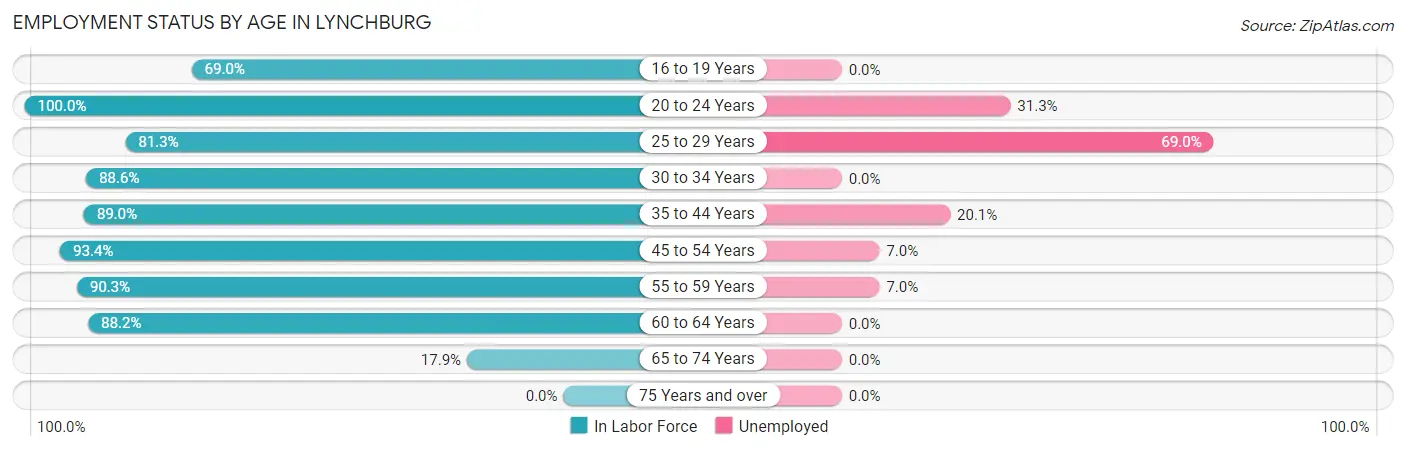
| Age Bracket | In Labor Force | Unemployed |
| 16 to 19 Years | 29 (69.0%) | 0 (0.0%) |
| 20 to 24 Years | 128 (100.0%) | 40 (31.3%) |
| 25 to 29 Years | 100 (81.3%) | 69 (69.0%) |
| 30 to 34 Years | 124 (88.6%) | 0 (0.0%) |
| 35 to 44 Years | 194 (89.0%) | 39 (20.1%) |
| 45 to 54 Years | 399 (93.4%) | 28 (7.0%) |
| 55 to 59 Years | 186 (90.3%) | 13 (7.0%) |
| 60 to 64 Years | 195 (88.2%) | 0 (0.0%) |
| 65 to 74 Years | 19 (17.9%) | 0 (0.0%) |
| 75 Years and over | 0 (0.0%) | 0 (0.0%) |
| Total | 1,374 (80.2%) | 190 (13.8%) |
Employment Status by Educational Attainment in Lynchburg
According to labor force statistics for Lynchburg, 89.7% of individuals (1,197) out of the total population between 25 and 64 years of age (1,335) are in the labor force, with 12.4% or 148 of them being unemployed. The group with the highest labor force participation rate are those with the educational attainment of bachelor's degree or higher, with 100.0% or 330 individuals in the labor force. Within the labor force, individuals with less than high school education have the highest percentage of unemployment, with 53.1% or 69 of them being unemployed.
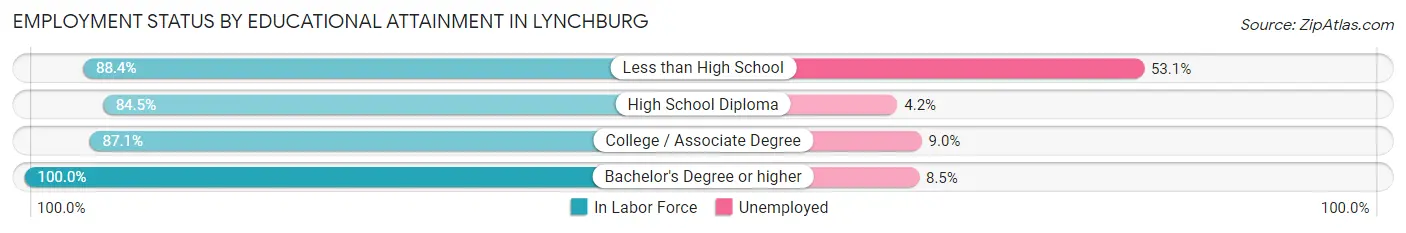
| Educational Attainment | In Labor Force | Unemployed |
| Less than High School | 130 (88.4%) | 78 (53.1%) |
| High School Diploma | 306 (84.5%) | 15 (4.2%) |
| College / Associate Degree | 432 (87.1%) | 45 (9.0%) |
| Bachelor's Degree or higher | 330 (100.0%) | 28 (8.5%) |
| Total | 1,197 (89.7%) | 166 (12.4%) |
Employment Occupations by Sex in Lynchburg
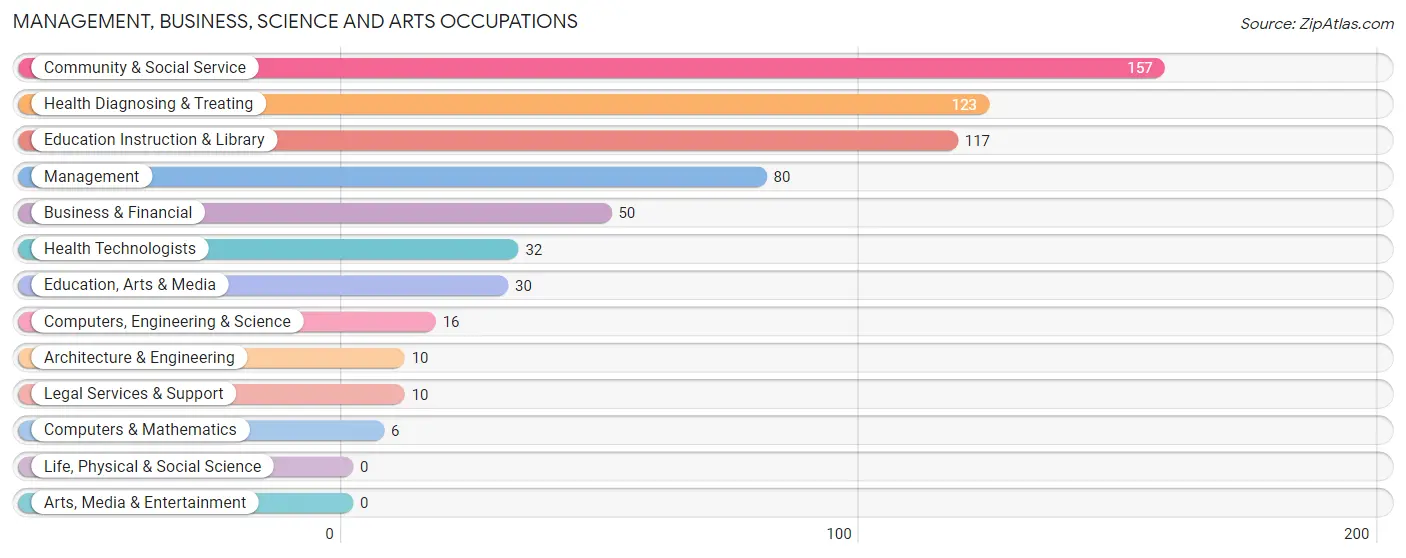
Management, Business, Science and Arts Occupations
The most common Management, Business, Science and Arts occupations in Lynchburg are Community & Social Service (157 | 13.3%), Health Diagnosing & Treating (123 | 10.4%), Education Instruction & Library (117 | 9.9%), Management (80 | 6.8%), and Business & Financial (50 | 4.2%).
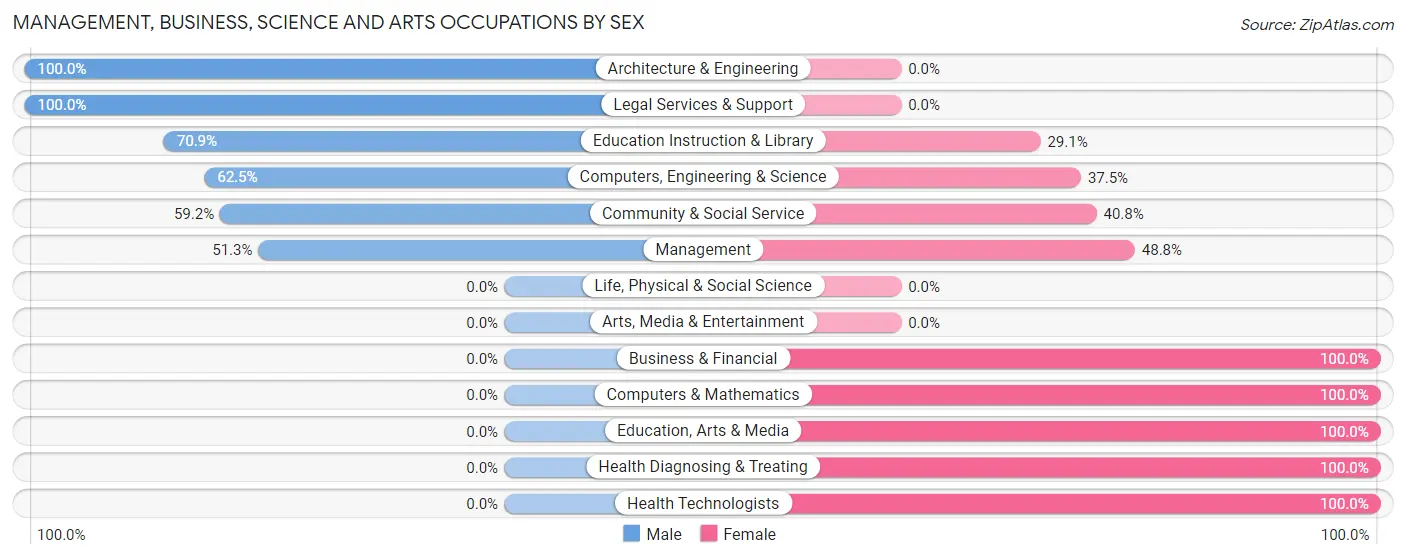
Management, Business, Science and Arts Occupations by Sex
Within the Management, Business, Science and Arts occupations in Lynchburg, the most male-oriented occupations are Architecture & Engineering (100.0%), Legal Services & Support (100.0%), and Education Instruction & Library (70.9%), while the most female-oriented occupations are Business & Financial (100.0%), Computers & Mathematics (100.0%), and Education, Arts & Media (100.0%).
| Occupation | Male | Female |
| Management | 41 (51.2%) | 39 (48.7%) |
| Business & Financial | 0 (0.0%) | 50 (100.0%) |
| Computers, Engineering & Science | 10 (62.5%) | 6 (37.5%) |
| Computers & Mathematics | 0 (0.0%) | 6 (100.0%) |
| Architecture & Engineering | 10 (100.0%) | 0 (0.0%) |
| Life, Physical & Social Science | 0 (0.0%) | 0 (0.0%) |
| Community & Social Service | 93 (59.2%) | 64 (40.8%) |
| Education, Arts & Media | 0 (0.0%) | 30 (100.0%) |
| Legal Services & Support | 10 (100.0%) | 0 (0.0%) |
| Education Instruction & Library | 83 (70.9%) | 34 (29.1%) |
| Arts, Media & Entertainment | 0 (0.0%) | 0 (0.0%) |
| Health Diagnosing & Treating | 0 (0.0%) | 123 (100.0%) |
| Health Technologists | 0 (0.0%) | 32 (100.0%) |
| Total (Category) | 144 (33.8%) | 282 (66.2%) |
| Total (Overall) | 555 (46.8%) | 630 (53.2%) |
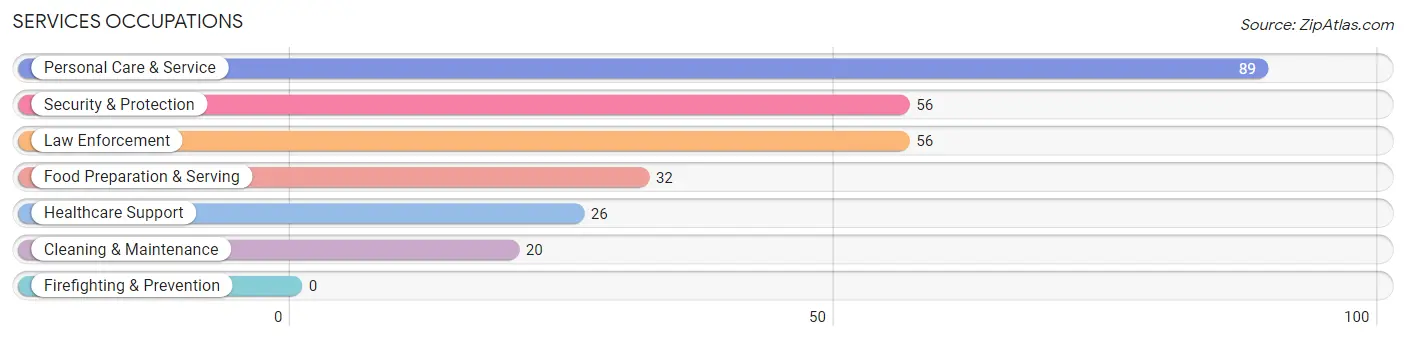
Services Occupations
The most common Services occupations in Lynchburg are Personal Care & Service (89 | 7.5%), Security & Protection (56 | 4.7%), Law Enforcement (56 | 4.7%), Food Preparation & Serving (32 | 2.7%), and Healthcare Support (26 | 2.2%).
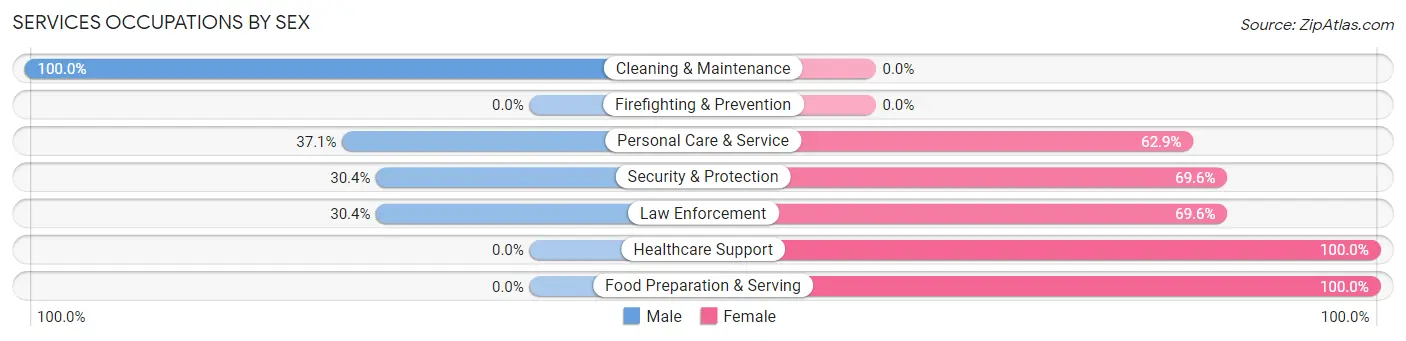
Services Occupations by Sex
Within the Services occupations in Lynchburg, the most male-oriented occupations are Cleaning & Maintenance (100.0%), Personal Care & Service (37.1%), and Security & Protection (30.4%), while the most female-oriented occupations are Healthcare Support (100.0%), Food Preparation & Serving (100.0%), and Security & Protection (69.6%).
| Occupation | Male | Female |
| Healthcare Support | 0 (0.0%) | 26 (100.0%) |
| Security & Protection | 17 (30.4%) | 39 (69.6%) |
| Firefighting & Prevention | 0 (0.0%) | 0 (0.0%) |
| Law Enforcement | 17 (30.4%) | 39 (69.6%) |
| Food Preparation & Serving | 0 (0.0%) | 32 (100.0%) |
| Cleaning & Maintenance | 20 (100.0%) | 0 (0.0%) |
| Personal Care & Service | 33 (37.1%) | 56 (62.9%) |
| Total (Category) | 70 (31.4%) | 153 (68.6%) |
| Total (Overall) | 555 (46.8%) | 630 (53.2%) |
Sales and Office Occupations
The most common Sales and Office occupations in Lynchburg are Office & Administration (223 | 18.8%), and Sales & Related (27 | 2.3%).

Sales and Office Occupations by Sex

| Occupation | Male | Female |
| Sales & Related | 0 (0.0%) | 27 (100.0%) |
| Office & Administration | 97 (43.5%) | 126 (56.5%) |
| Total (Category) | 97 (38.8%) | 153 (61.2%) |
| Total (Overall) | 555 (46.8%) | 630 (53.2%) |
Natural Resources, Construction and Maintenance Occupations
The most common Natural Resources, Construction and Maintenance occupations in Lynchburg are Construction & Extraction (76 | 6.4%), and Installation, Maintenance & Repair (23 | 1.9%).
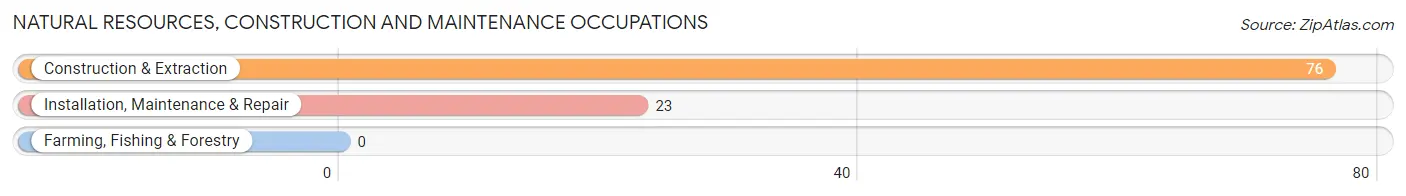
Natural Resources, Construction and Maintenance Occupations by Sex
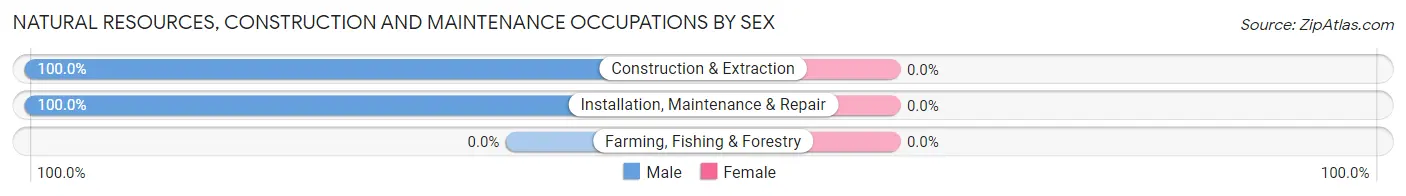
| Occupation | Male | Female |
| Farming, Fishing & Forestry | 0 (0.0%) | 0 (0.0%) |
| Construction & Extraction | 76 (100.0%) | 0 (0.0%) |
| Installation, Maintenance & Repair | 23 (100.0%) | 0 (0.0%) |
| Total (Category) | 99 (100.0%) | 0 (0.0%) |
| Total (Overall) | 555 (46.8%) | 630 (53.2%) |
Production, Transportation and Moving Occupations
The most common Production, Transportation and Moving occupations in Lynchburg are Transportation (111 | 9.4%), Material Moving (67 | 5.7%), and Production (9 | 0.8%).
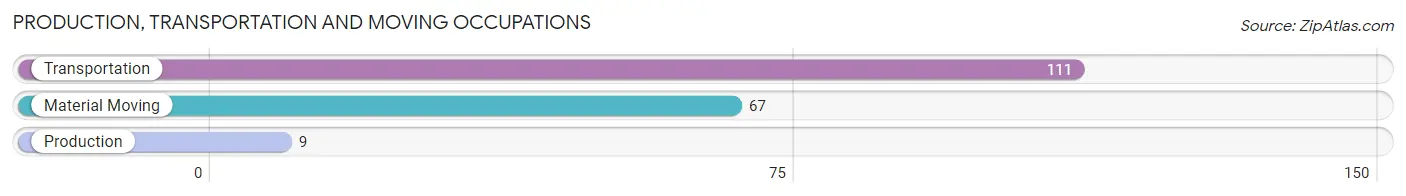
Production, Transportation and Moving Occupations by Sex
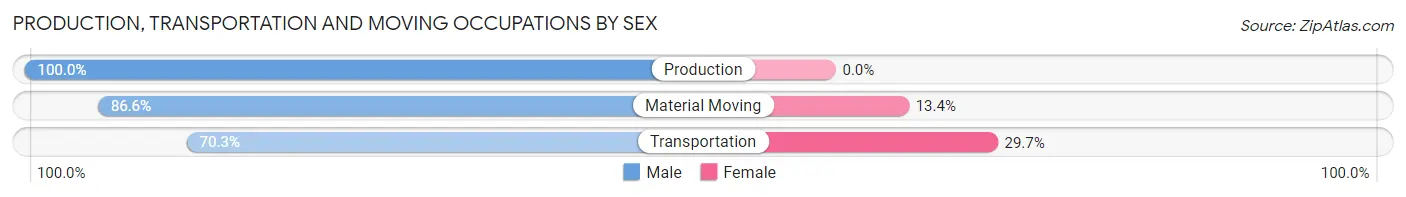
| Occupation | Male | Female |
| Production | 9 (100.0%) | 0 (0.0%) |
| Transportation | 78 (70.3%) | 33 (29.7%) |
| Material Moving | 58 (86.6%) | 9 (13.4%) |
| Total (Category) | 145 (77.5%) | 42 (22.5%) |
| Total (Overall) | 555 (46.8%) | 630 (53.2%) |
Employment Industries by Sex in Lynchburg
Employment Industries in Lynchburg
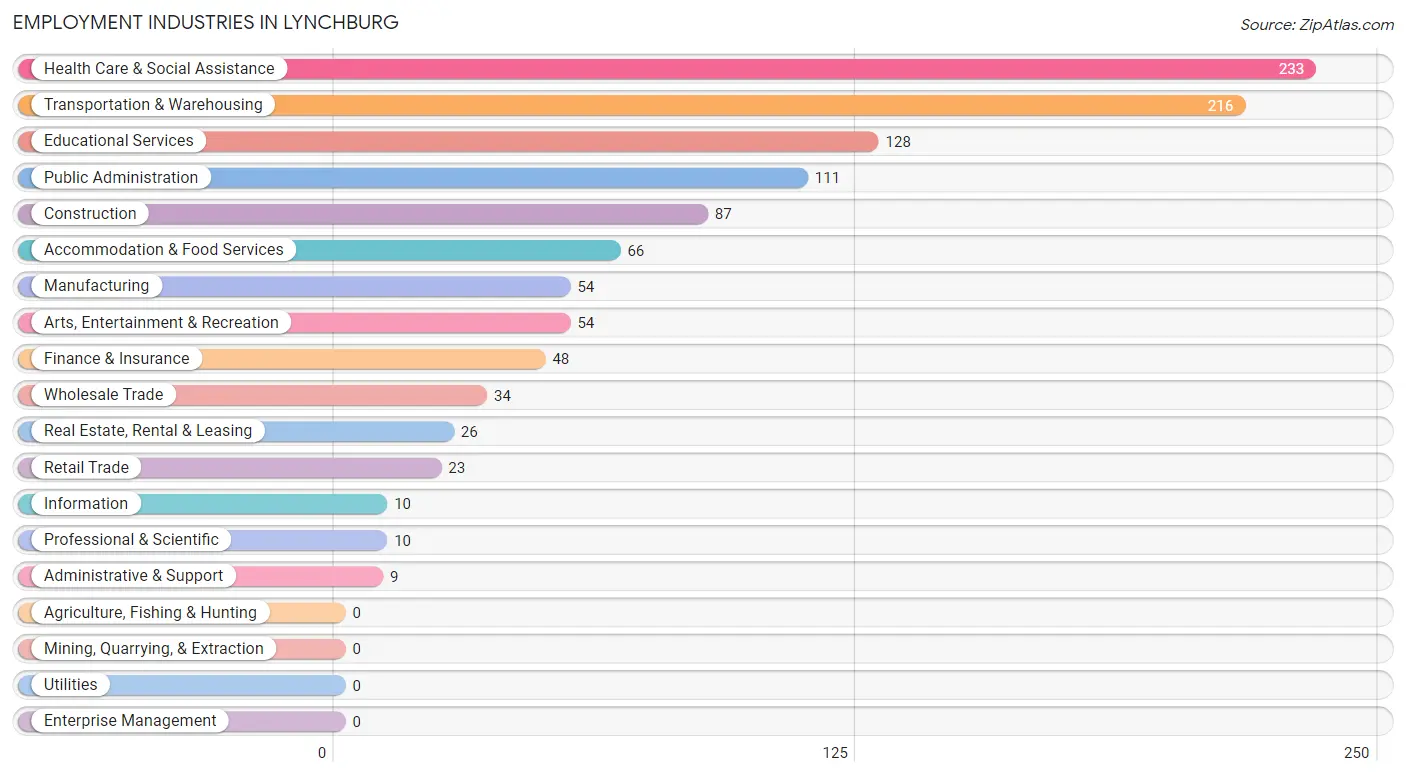
The major employment industries in Lynchburg include Health Care & Social Assistance (233 | 19.7%), Transportation & Warehousing (216 | 18.2%), Educational Services (128 | 10.8%), Public Administration (111 | 9.4%), and Construction (87 | 7.3%).
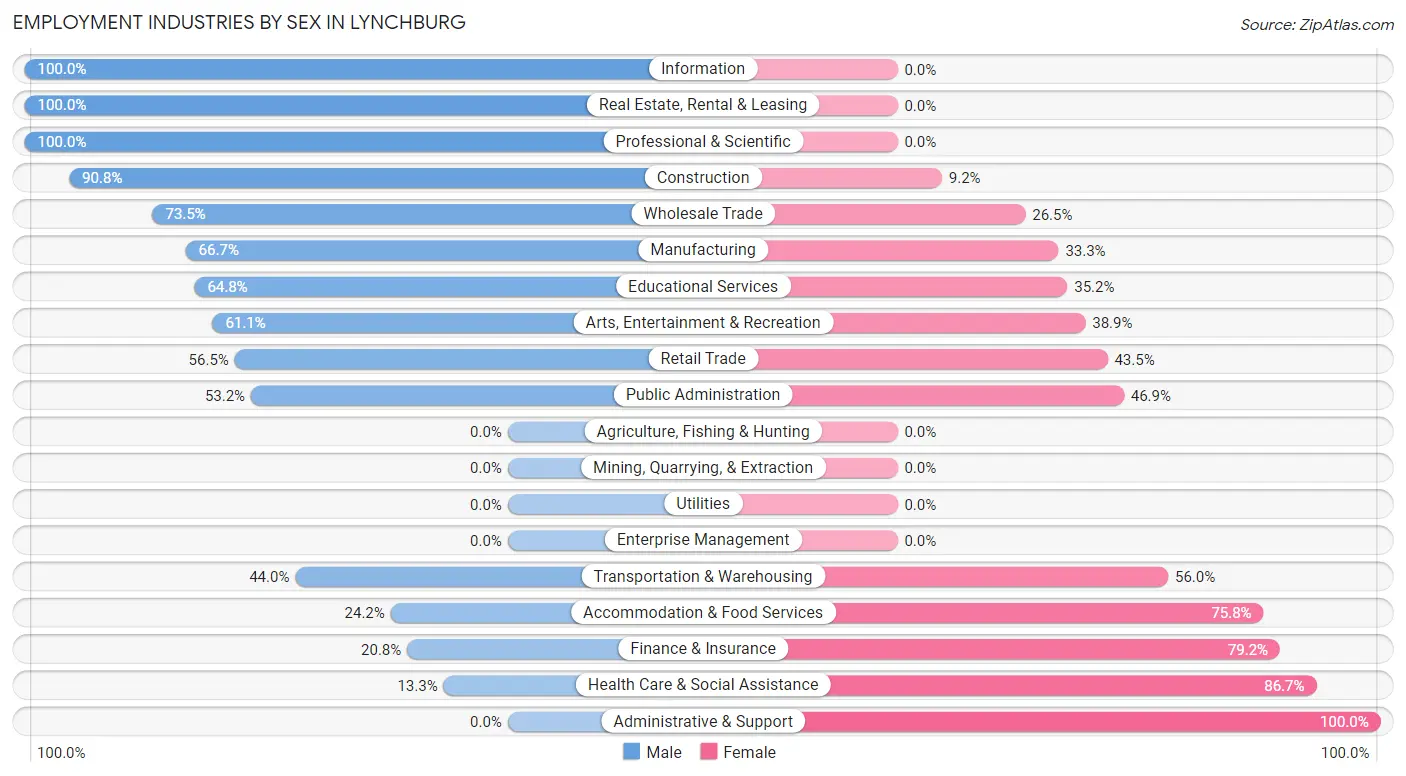
Employment Industries by Sex in Lynchburg
The Lynchburg industries that see more men than women are Information (100.0%), Real Estate, Rental & Leasing (100.0%), and Professional & Scientific (100.0%), whereas the industries that tend to have a higher number of women are Administrative & Support (100.0%), Health Care & Social Assistance (86.7%), and Finance & Insurance (79.2%).
| Industry | Male | Female |
| Agriculture, Fishing & Hunting | 0 (0.0%) | 0 (0.0%) |
| Mining, Quarrying, & Extraction | 0 (0.0%) | 0 (0.0%) |
| Construction | 79 (90.8%) | 8 (9.2%) |
| Manufacturing | 36 (66.7%) | 18 (33.3%) |
| Wholesale Trade | 25 (73.5%) | 9 (26.5%) |
| Retail Trade | 13 (56.5%) | 10 (43.5%) |
| Transportation & Warehousing | 95 (44.0%) | 121 (56.0%) |
| Utilities | 0 (0.0%) | 0 (0.0%) |
| Information | 10 (100.0%) | 0 (0.0%) |
| Finance & Insurance | 10 (20.8%) | 38 (79.2%) |
| Real Estate, Rental & Leasing | 26 (100.0%) | 0 (0.0%) |
| Professional & Scientific | 10 (100.0%) | 0 (0.0%) |
| Enterprise Management | 0 (0.0%) | 0 (0.0%) |
| Administrative & Support | 0 (0.0%) | 9 (100.0%) |
| Educational Services | 83 (64.8%) | 45 (35.2%) |
| Health Care & Social Assistance | 31 (13.3%) | 202 (86.7%) |
| Arts, Entertainment & Recreation | 33 (61.1%) | 21 (38.9%) |
| Accommodation & Food Services | 16 (24.2%) | 50 (75.8%) |
| Public Administration | 59 (53.1%) | 52 (46.9%) |
| Total | 555 (46.8%) | 630 (53.2%) |
Education in Lynchburg
School Enrollment in Lynchburg
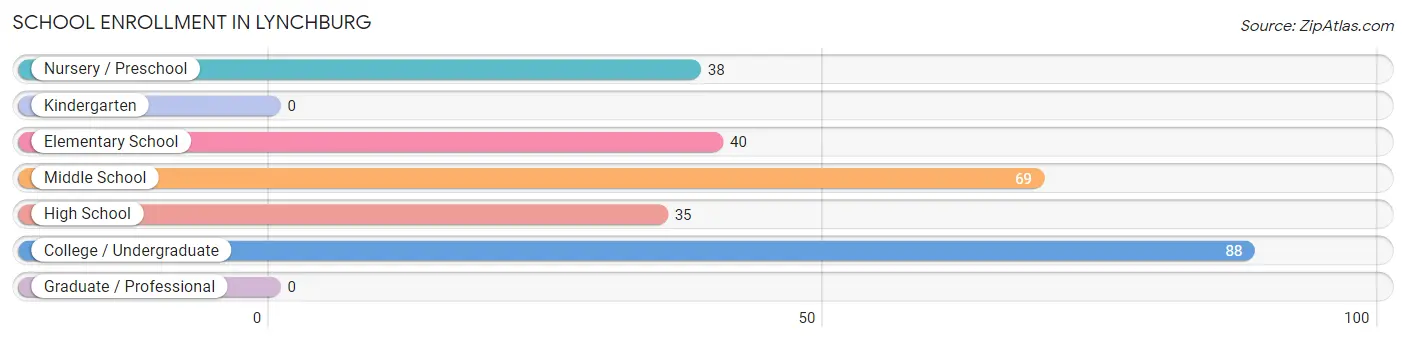
The most common levels of schooling among the 270 students in Lynchburg are college / undergraduate (88 | 32.6%), middle school (69 | 25.6%), and elementary school (40 | 14.8%).
| School Level | # Students | % Students |
| Nursery / Preschool | 38 | 14.1% |
| Kindergarten | 0 | 0.0% |
| Elementary School | 40 | 14.8% |
| Middle School | 69 | 25.6% |
| High School | 35 | 13.0% |
| College / Undergraduate | 88 | 32.6% |
| Graduate / Professional | 0 | 0.0% |
| Total | 270 | 100.0% |
School Enrollment by Age by Funding Source in Lynchburg
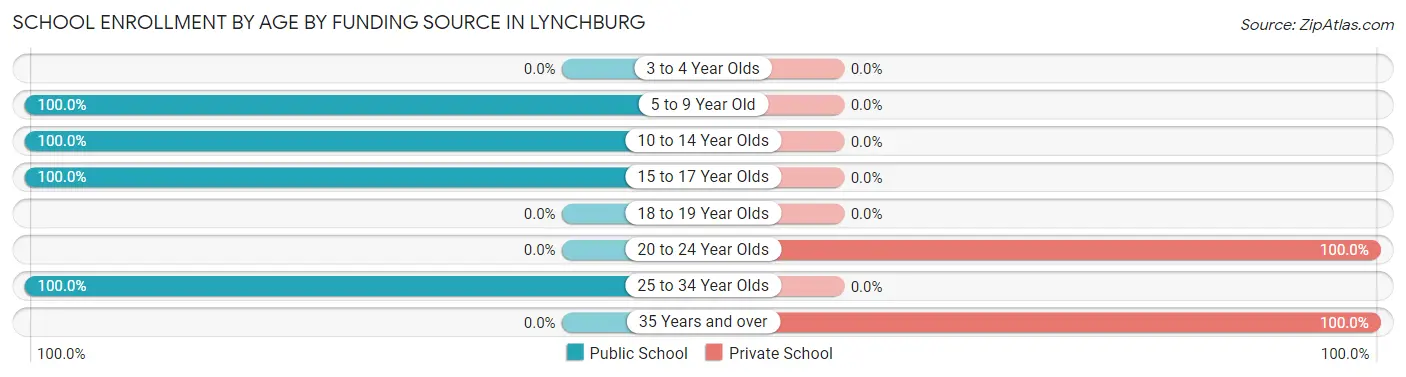
Out of a total of 270 students who are enrolled in schools in Lynchburg, 65 (24.1%) attend a private institution, while the remaining 205 (75.9%) are enrolled in public schools. The age group of 20 to 24 year olds has the highest likelihood of being enrolled in private schools, with 55 (100.0% in the age bracket) enrolled. Conversely, the age group of 5 to 9 year old has the lowest likelihood of being enrolled in a private school, with 78 (100.0% in the age bracket) attending a public institution.
| Age Bracket | Public School | Private School |
| 3 to 4 Year Olds | 0 (0.0%) | 0 (0.0%) |
| 5 to 9 Year Old | 78 (100.0%) | 0 (0.0%) |
| 10 to 14 Year Olds | 69 (100.0%) | 0 (0.0%) |
| 15 to 17 Year Olds | 35 (100.0%) | 0 (0.0%) |
| 18 to 19 Year Olds | 0 (0.0%) | 0 (0.0%) |
| 20 to 24 Year Olds | 0 (0.0%) | 55 (100.0%) |
| 25 to 34 Year Olds | 23 (100.0%) | 0 (0.0%) |
| 35 Years and over | 0 (0.0%) | 10 (100.0%) |
| Total | 205 (75.9%) | 65 (24.1%) |
Educational Attainment by Field of Study in Lynchburg
Education (128 | 28.2%), business (61 | 13.4%), arts & humanities (42 | 9.2%), social sciences (40 | 8.8%), and literature & languages (38 | 8.4%) are the most common fields of study among 454 individuals in Lynchburg who have obtained a bachelor's degree or higher.
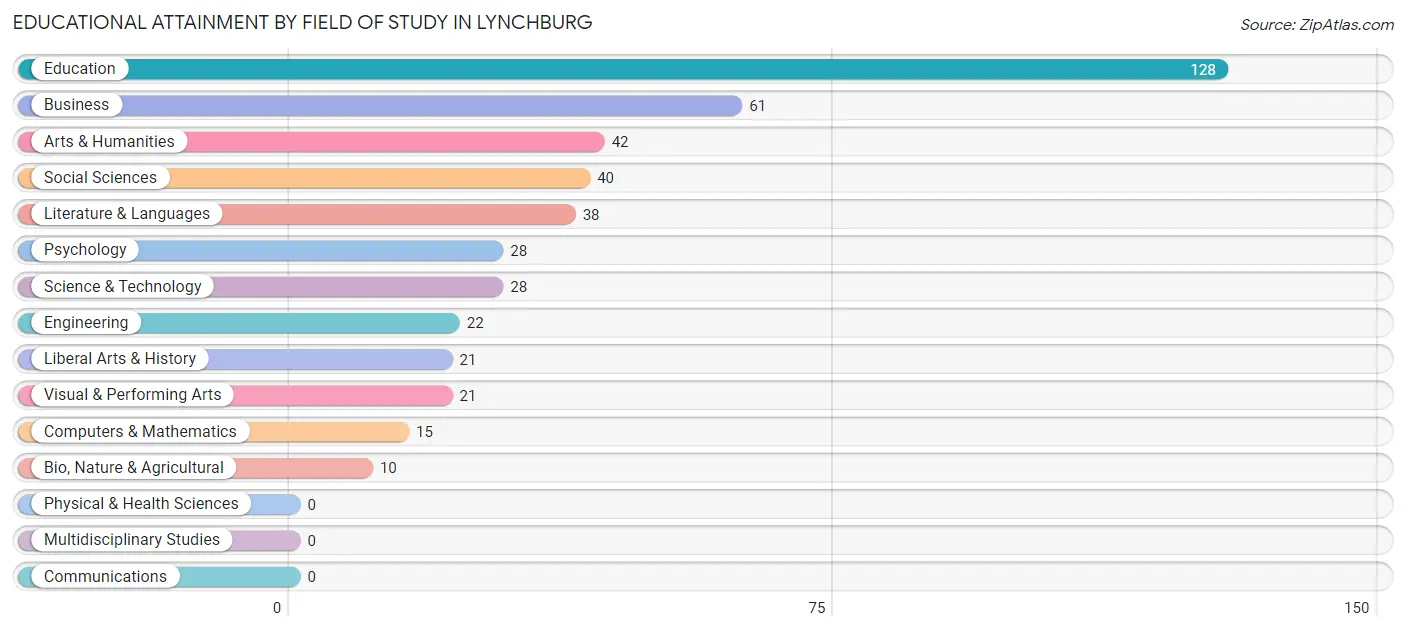
| Field of Study | # Graduates | % Graduates |
| Computers & Mathematics | 15 | 3.3% |
| Bio, Nature & Agricultural | 10 | 2.2% |
| Physical & Health Sciences | 0 | 0.0% |
| Psychology | 28 | 6.2% |
| Social Sciences | 40 | 8.8% |
| Engineering | 22 | 4.9% |
| Multidisciplinary Studies | 0 | 0.0% |
| Science & Technology | 28 | 6.2% |
| Business | 61 | 13.4% |
| Education | 128 | 28.2% |
| Literature & Languages | 38 | 8.4% |
| Liberal Arts & History | 21 | 4.6% |
| Visual & Performing Arts | 21 | 4.6% |
| Communications | 0 | 0.0% |
| Arts & Humanities | 42 | 9.2% |
| Total | 454 | 100.0% |
Transportation & Commute in Lynchburg
Vehicle Availability by Sex in Lynchburg
The most prevalent vehicle ownership categories in Lynchburg are males with 3 vehicles (249, accounting for 44.9%) and females with 3 vehicles (233, making up 39.6%).
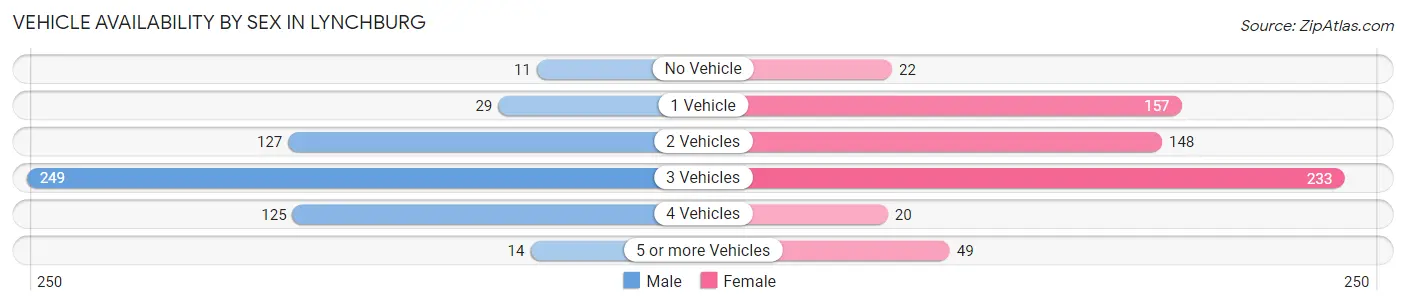
| Vehicles Available | Male | Female |
| No Vehicle | 11 (2.0%) | 22 (3.5%) |
| 1 Vehicle | 29 (5.2%) | 157 (25.0%) |
| 2 Vehicles | 127 (22.9%) | 148 (23.5%) |
| 3 Vehicles | 249 (44.9%) | 233 (37.0%) |
| 4 Vehicles | 125 (22.5%) | 20 (3.2%) |
| 5 or more Vehicles | 14 (2.5%) | 49 (7.8%) |
| Total | 555 (100.0%) | 629 (100.0%) |
Commute Time in Lynchburg
The most frequently occuring commute durations in Lynchburg are 20 to 24 minutes (293 commuters, 24.7%), 30 to 34 minutes (225 commuters, 19.0%), and 45 to 59 minutes (147 commuters, 12.4%).
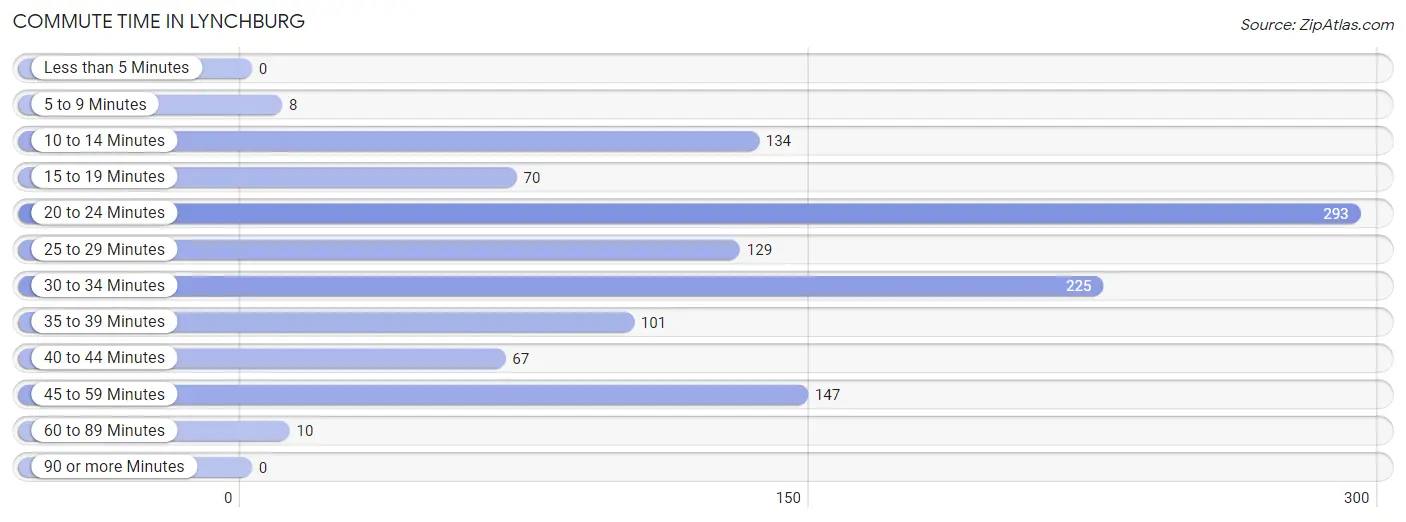
| Commute Time | # Commuters | % Commuters |
| Less than 5 Minutes | 0 | 0.0% |
| 5 to 9 Minutes | 8 | 0.7% |
| 10 to 14 Minutes | 134 | 11.3% |
| 15 to 19 Minutes | 70 | 5.9% |
| 20 to 24 Minutes | 293 | 24.7% |
| 25 to 29 Minutes | 129 | 10.9% |
| 30 to 34 Minutes | 225 | 19.0% |
| 35 to 39 Minutes | 101 | 8.5% |
| 40 to 44 Minutes | 67 | 5.7% |
| 45 to 59 Minutes | 147 | 12.4% |
| 60 to 89 Minutes | 10 | 0.8% |
| 90 or more Minutes | 0 | 0.0% |
Commute Time by Sex in Lynchburg
The most common commute times in Lynchburg are 20 to 24 minutes (127 commuters, 22.9%) for males and 20 to 24 minutes (166 commuters, 26.4%) for females.
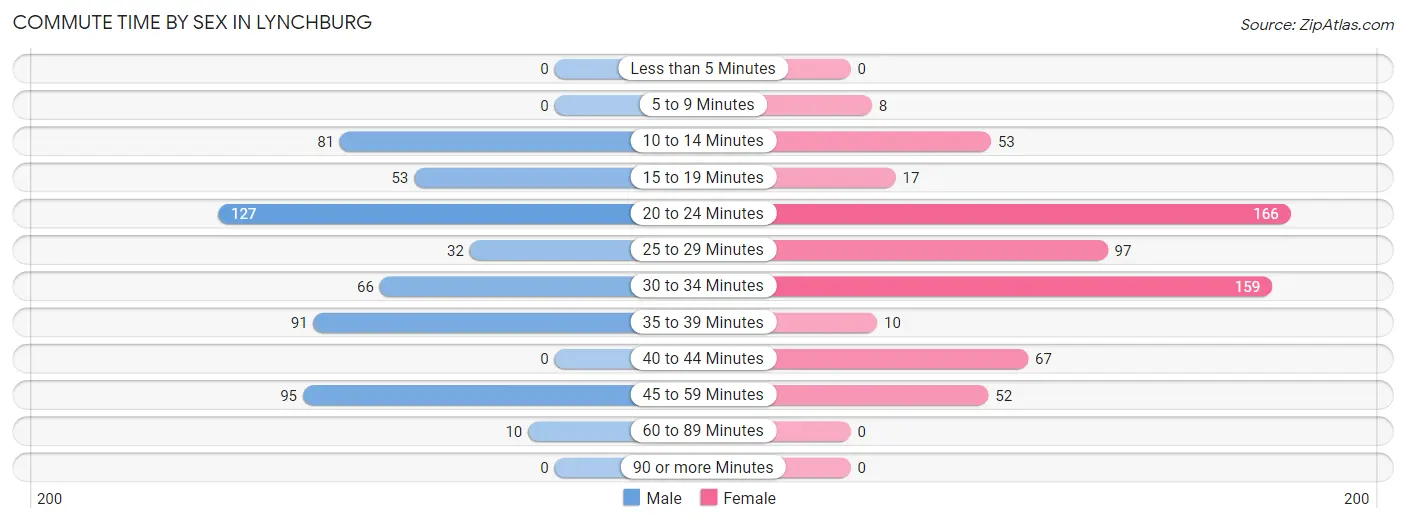
| Commute Time | Male | Female |
| Less than 5 Minutes | 0 (0.0%) | 0 (0.0%) |
| 5 to 9 Minutes | 0 (0.0%) | 8 (1.3%) |
| 10 to 14 Minutes | 81 (14.6%) | 53 (8.4%) |
| 15 to 19 Minutes | 53 (9.6%) | 17 (2.7%) |
| 20 to 24 Minutes | 127 (22.9%) | 166 (26.4%) |
| 25 to 29 Minutes | 32 (5.8%) | 97 (15.4%) |
| 30 to 34 Minutes | 66 (11.9%) | 159 (25.3%) |
| 35 to 39 Minutes | 91 (16.4%) | 10 (1.6%) |
| 40 to 44 Minutes | 0 (0.0%) | 67 (10.6%) |
| 45 to 59 Minutes | 95 (17.1%) | 52 (8.3%) |
| 60 to 89 Minutes | 10 (1.8%) | 0 (0.0%) |
| 90 or more Minutes | 0 (0.0%) | 0 (0.0%) |
Time of Departure to Work by Sex in Lynchburg
The most frequent times of departure to work in Lynchburg are 6:00 AM to 6:29 AM (153, 27.6%) for males and 7:00 AM to 7:29 AM (123, 19.6%) for females.
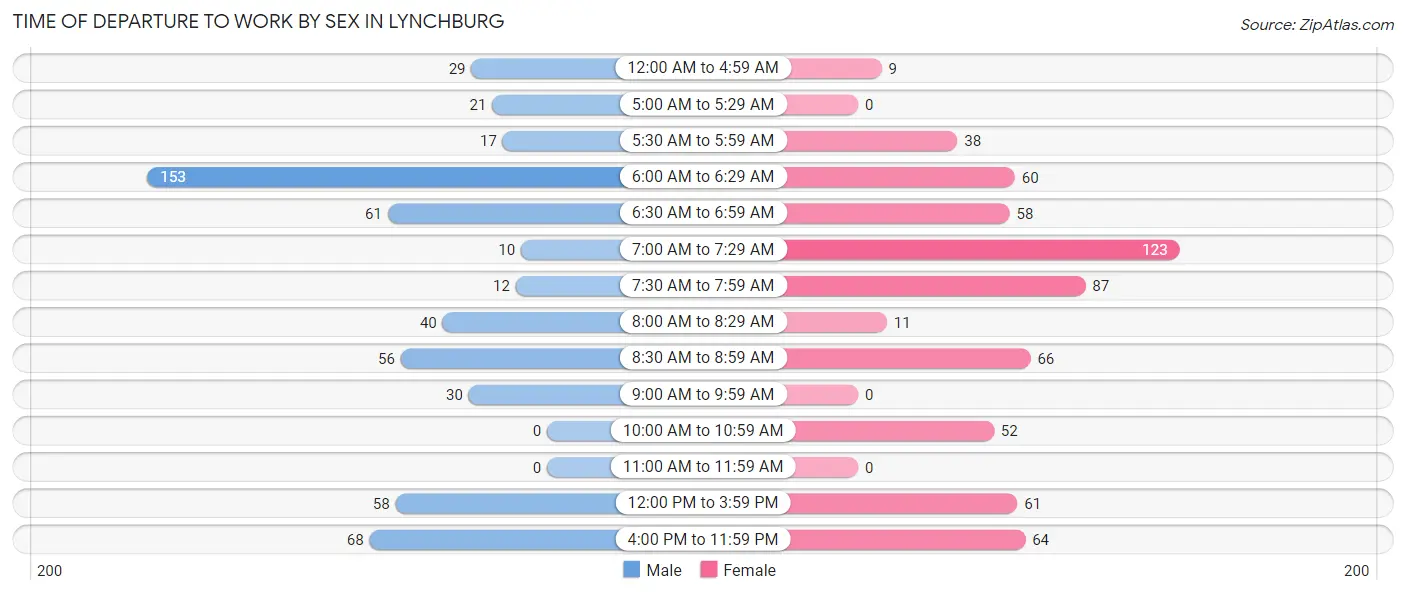
| Time of Departure | Male | Female |
| 12:00 AM to 4:59 AM | 29 (5.2%) | 9 (1.4%) |
| 5:00 AM to 5:29 AM | 21 (3.8%) | 0 (0.0%) |
| 5:30 AM to 5:59 AM | 17 (3.1%) | 38 (6.0%) |
| 6:00 AM to 6:29 AM | 153 (27.6%) | 60 (9.5%) |
| 6:30 AM to 6:59 AM | 61 (11.0%) | 58 (9.2%) |
| 7:00 AM to 7:29 AM | 10 (1.8%) | 123 (19.6%) |
| 7:30 AM to 7:59 AM | 12 (2.2%) | 87 (13.8%) |
| 8:00 AM to 8:29 AM | 40 (7.2%) | 11 (1.8%) |
| 8:30 AM to 8:59 AM | 56 (10.1%) | 66 (10.5%) |
| 9:00 AM to 9:59 AM | 30 (5.4%) | 0 (0.0%) |
| 10:00 AM to 10:59 AM | 0 (0.0%) | 52 (8.3%) |
| 11:00 AM to 11:59 AM | 0 (0.0%) | 0 (0.0%) |
| 12:00 PM to 3:59 PM | 58 (10.4%) | 61 (9.7%) |
| 4:00 PM to 11:59 PM | 68 (12.2%) | 64 (10.2%) |
| Total | 555 (100.0%) | 629 (100.0%) |
Housing Occupancy in Lynchburg
Occupancy by Ownership in Lynchburg
Of the total 835 dwellings in Lynchburg, owner-occupied units account for 722 (86.5%), while renter-occupied units make up 113 (13.5%).
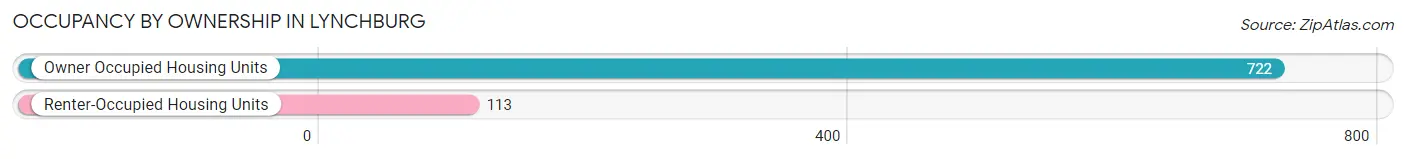
| Occupancy | # Housing Units | % Housing Units |
| Owner Occupied Housing Units | 722 | 86.5% |
| Renter-Occupied Housing Units | 113 | 13.5% |
| Total Occupied Housing Units | 835 | 100.0% |
Occupancy by Household Size in Lynchburg
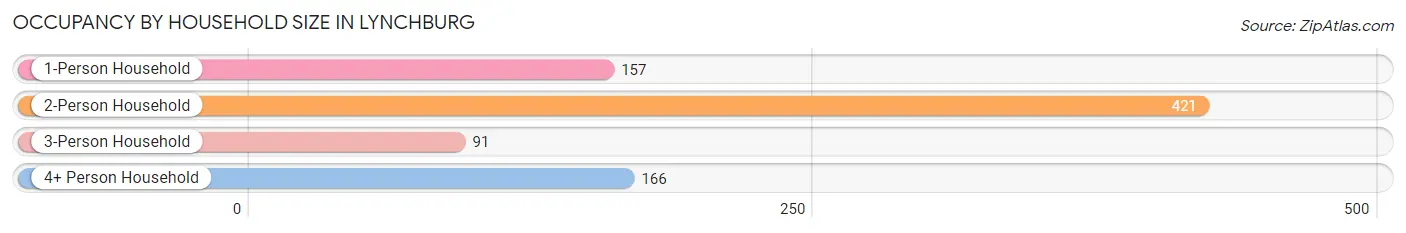
| Household Size | # Housing Units | % Housing Units |
| 1-Person Household | 157 | 18.8% |
| 2-Person Household | 421 | 50.4% |
| 3-Person Household | 91 | 10.9% |
| 4+ Person Household | 166 | 19.9% |
| Total Housing Units | 835 | 100.0% |
Occupancy by Ownership by Household Size in Lynchburg
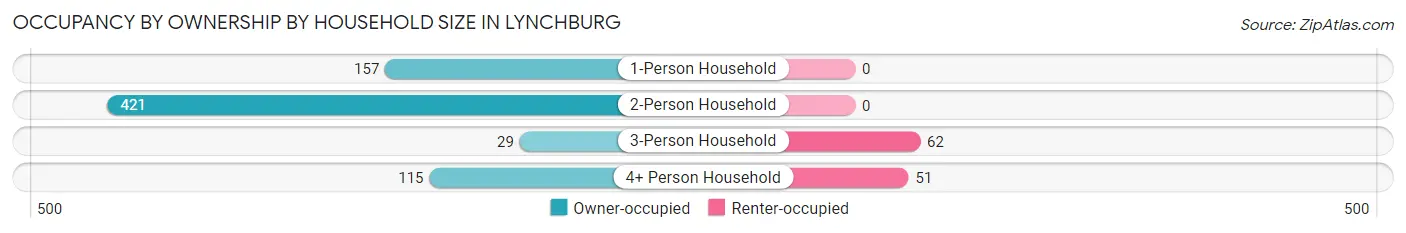
| Household Size | Owner-occupied | Renter-occupied |
| 1-Person Household | 157 (100.0%) | 0 (0.0%) |
| 2-Person Household | 421 (100.0%) | 0 (0.0%) |
| 3-Person Household | 29 (31.9%) | 62 (68.1%) |
| 4+ Person Household | 115 (69.3%) | 51 (30.7%) |
| Total Housing Units | 722 (86.5%) | 113 (13.5%) |
Occupancy by Educational Attainment in Lynchburg
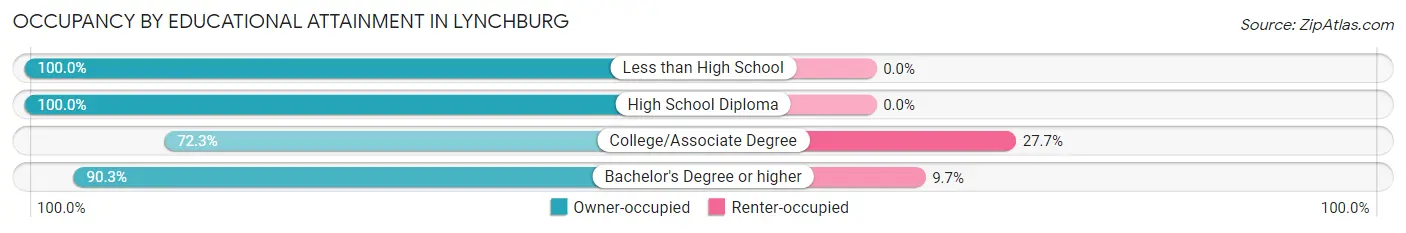
| Household Size | Owner-occupied | Renter-occupied |
| Less than High School | 38 (100.0%) | 0 (0.0%) |
| High School Diploma | 202 (100.0%) | 0 (0.0%) |
| College/Associate Degree | 222 (72.3%) | 85 (27.7%) |
| Bachelor's Degree or higher | 260 (90.3%) | 28 (9.7%) |
Occupancy by Age of Householder in Lynchburg
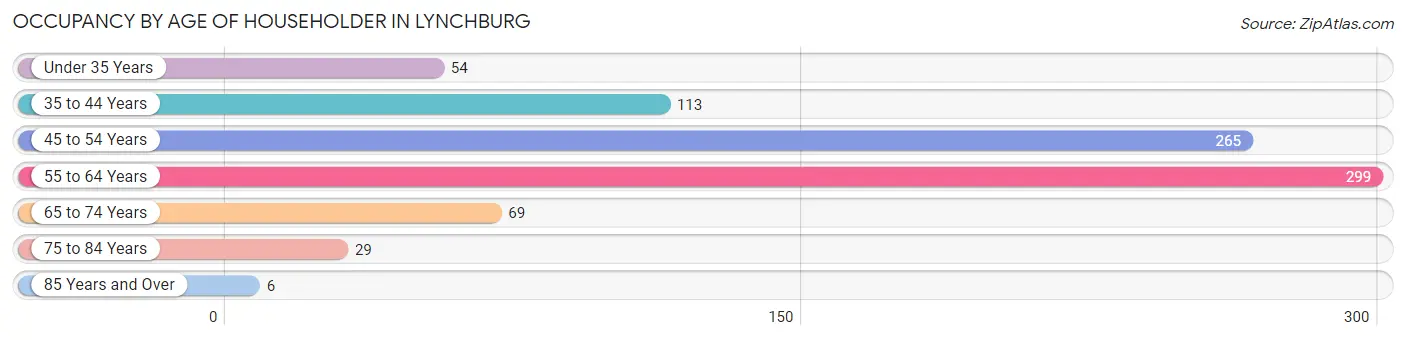
| Age Bracket | # Households | % Households |
| Under 35 Years | 54 | 6.5% |
| 35 to 44 Years | 113 | 13.5% |
| 45 to 54 Years | 265 | 31.7% |
| 55 to 64 Years | 299 | 35.8% |
| 65 to 74 Years | 69 | 8.3% |
| 75 to 84 Years | 29 | 3.5% |
| 85 Years and Over | 6 | 0.7% |
| Total | 835 | 100.0% |
Housing Finances in Lynchburg
Median Income by Occupancy in Lynchburg
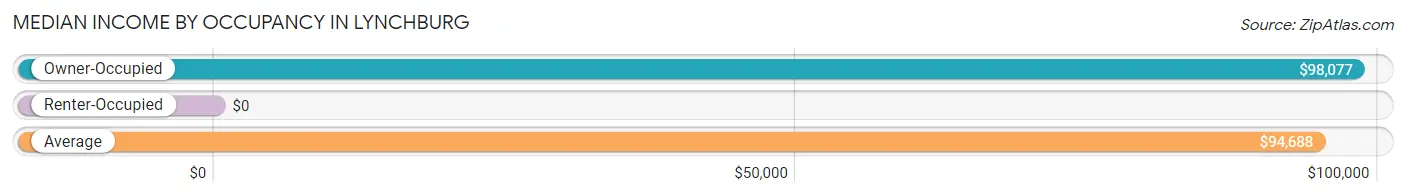
| Occupancy Type | # Households | Median Income |
| Owner-Occupied | 722 (86.5%) | $98,077 |
| Renter-Occupied | 113 (13.5%) | $0 |
| Average | 835 (100.0%) | $94,688 |
Occupancy by Householder Income Bracket in Lynchburg
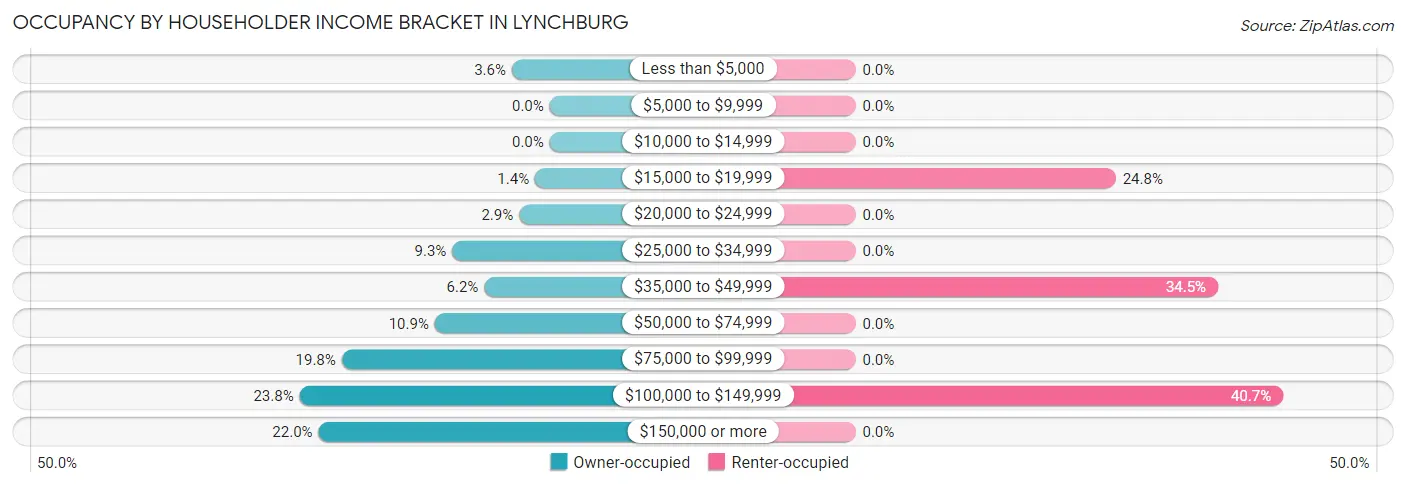
| Income Bracket | Owner-occupied | Renter-occupied |
| Less than $5,000 | 26 (3.6%) | 0 (0.0%) |
| $5,000 to $9,999 | 0 (0.0%) | 0 (0.0%) |
| $10,000 to $14,999 | 0 (0.0%) | 0 (0.0%) |
| $15,000 to $19,999 | 10 (1.4%) | 28 (24.8%) |
| $20,000 to $24,999 | 21 (2.9%) | 0 (0.0%) |
| $25,000 to $34,999 | 67 (9.3%) | 0 (0.0%) |
| $35,000 to $49,999 | 45 (6.2%) | 39 (34.5%) |
| $50,000 to $74,999 | 79 (10.9%) | 0 (0.0%) |
| $75,000 to $99,999 | 143 (19.8%) | 0 (0.0%) |
| $100,000 to $149,999 | 172 (23.8%) | 46 (40.7%) |
| $150,000 or more | 159 (22.0%) | 0 (0.0%) |
| Total | 722 (100.0%) | 113 (100.0%) |
Monthly Housing Cost Tiers in Lynchburg
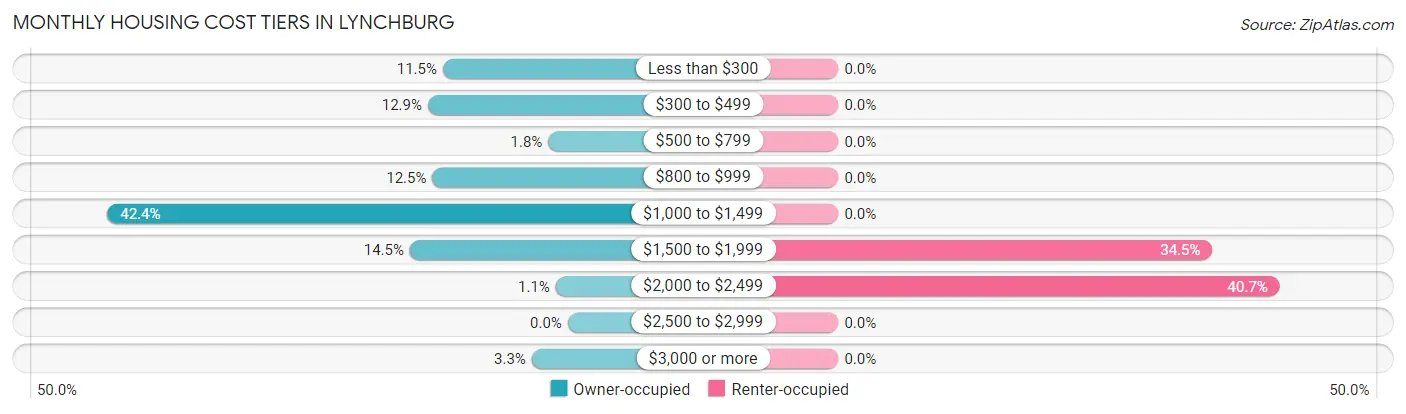
| Monthly Cost | Owner-occupied | Renter-occupied |
| Less than $300 | 83 (11.5%) | 0 (0.0%) |
| $300 to $499 | 93 (12.9%) | 0 (0.0%) |
| $500 to $799 | 13 (1.8%) | 0 (0.0%) |
| $800 to $999 | 90 (12.5%) | 0 (0.0%) |
| $1,000 to $1,499 | 306 (42.4%) | 0 (0.0%) |
| $1,500 to $1,999 | 105 (14.5%) | 39 (34.5%) |
| $2,000 to $2,499 | 8 (1.1%) | 46 (40.7%) |
| $2,500 to $2,999 | 0 (0.0%) | 0 (0.0%) |
| $3,000 or more | 24 (3.3%) | 0 (0.0%) |
| Total | 722 (100.0%) | 113 (100.0%) |
Physical Housing Characteristics in Lynchburg
Housing Structures in Lynchburg
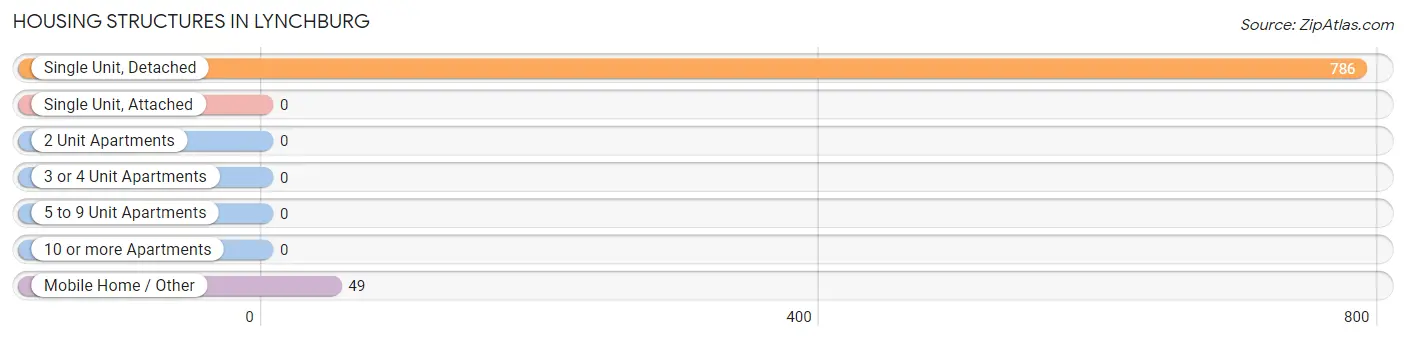
| Structure Type | # Housing Units | % Housing Units |
| Single Unit, Detached | 786 | 94.1% |
| Single Unit, Attached | 0 | 0.0% |
| 2 Unit Apartments | 0 | 0.0% |
| 3 or 4 Unit Apartments | 0 | 0.0% |
| 5 to 9 Unit Apartments | 0 | 0.0% |
| 10 or more Apartments | 0 | 0.0% |
| Mobile Home / Other | 49 | 5.9% |
| Total | 835 | 100.0% |
Housing Structures by Occupancy in Lynchburg
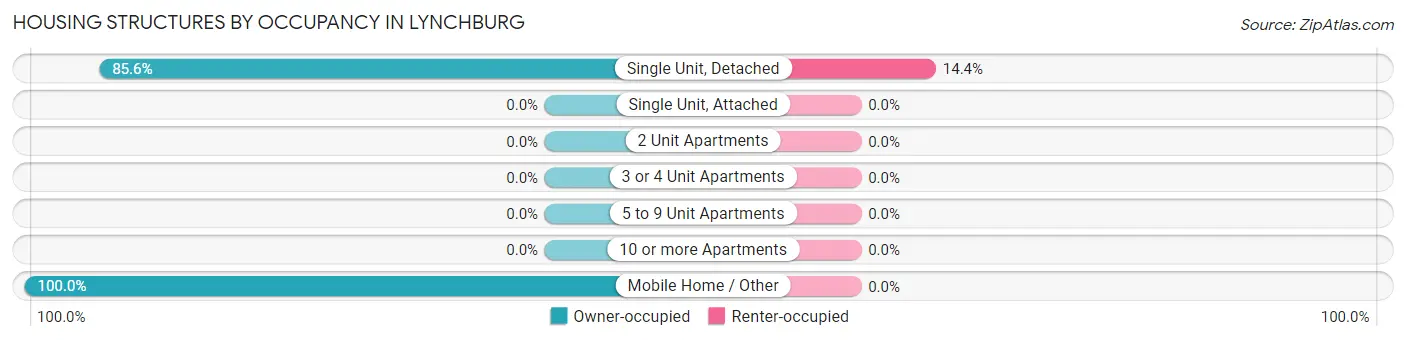
| Structure Type | Owner-occupied | Renter-occupied |
| Single Unit, Detached | 673 (85.6%) | 113 (14.4%) |
| Single Unit, Attached | 0 (0.0%) | 0 (0.0%) |
| 2 Unit Apartments | 0 (0.0%) | 0 (0.0%) |
| 3 or 4 Unit Apartments | 0 (0.0%) | 0 (0.0%) |
| 5 to 9 Unit Apartments | 0 (0.0%) | 0 (0.0%) |
| 10 or more Apartments | 0 (0.0%) | 0 (0.0%) |
| Mobile Home / Other | 49 (100.0%) | 0 (0.0%) |
| Total | 722 (86.5%) | 113 (13.5%) |
Housing Structures by Number of Rooms in Lynchburg
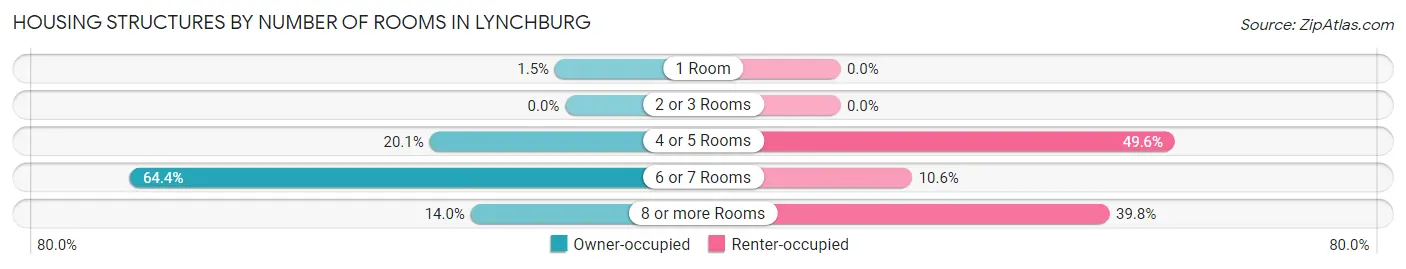
| Number of Rooms | Owner-occupied | Renter-occupied |
| 1 Room | 11 (1.5%) | 0 (0.0%) |
| 2 or 3 Rooms | 0 (0.0%) | 0 (0.0%) |
| 4 or 5 Rooms | 145 (20.1%) | 56 (49.6%) |
| 6 or 7 Rooms | 465 (64.4%) | 12 (10.6%) |
| 8 or more Rooms | 101 (14.0%) | 45 (39.8%) |
| Total | 722 (100.0%) | 113 (100.0%) |
Housing Structure by Heating Type in Lynchburg
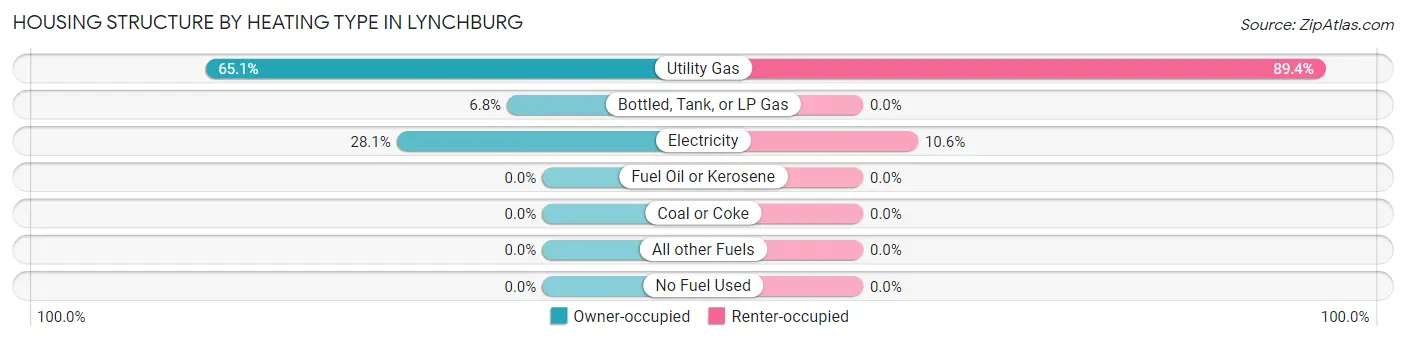
| Heating Type | Owner-occupied | Renter-occupied |
| Utility Gas | 470 (65.1%) | 101 (89.4%) |
| Bottled, Tank, or LP Gas | 49 (6.8%) | 0 (0.0%) |
| Electricity | 203 (28.1%) | 12 (10.6%) |
| Fuel Oil or Kerosene | 0 (0.0%) | 0 (0.0%) |
| Coal or Coke | 0 (0.0%) | 0 (0.0%) |
| All other Fuels | 0 (0.0%) | 0 (0.0%) |
| No Fuel Used | 0 (0.0%) | 0 (0.0%) |
| Total | 722 (100.0%) | 113 (100.0%) |
Household Vehicle Usage in Lynchburg
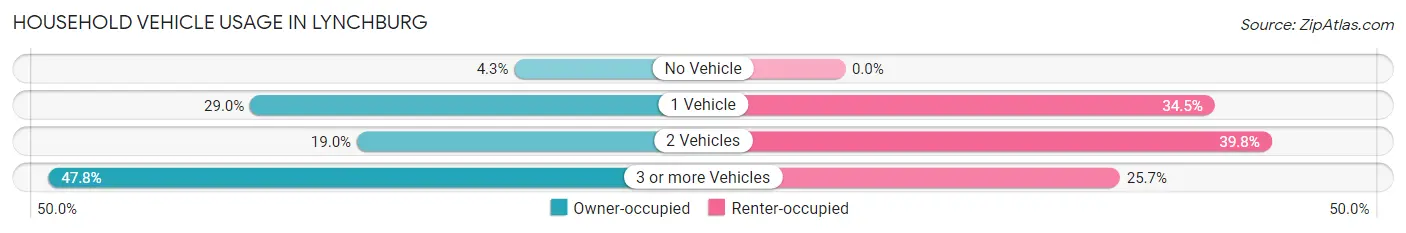
| Vehicles per Household | Owner-occupied | Renter-occupied |
| No Vehicle | 31 (4.3%) | 0 (0.0%) |
| 1 Vehicle | 209 (28.9%) | 39 (34.5%) |
| 2 Vehicles | 137 (19.0%) | 45 (39.8%) |
| 3 or more Vehicles | 345 (47.8%) | 29 (25.7%) |
| Total | 722 (100.0%) | 113 (100.0%) |
Real Estate & Mortgages in Lynchburg
Real Estate and Mortgage Overview in Lynchburg
| Characteristic | Without Mortgage | With Mortgage |
| Housing Units | 163 | 559 |
| Median Property Value | $161,400 | $197,600 |
| Median Household Income | $65,625 | $150 |
| Monthly Housing Costs | $334 | $24 |
| Real Estate Taxes | $684 | $17 |
Property Value by Mortgage Status in Lynchburg
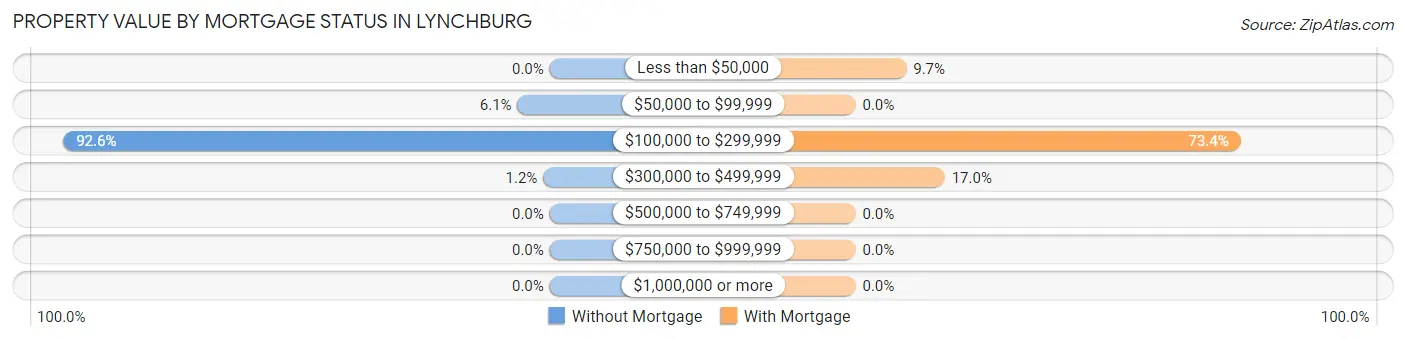
| Property Value | Without Mortgage | With Mortgage |
| Less than $50,000 | 0 (0.0%) | 54 (9.7%) |
| $50,000 to $99,999 | 10 (6.1%) | 0 (0.0%) |
| $100,000 to $299,999 | 151 (92.6%) | 410 (73.4%) |
| $300,000 to $499,999 | 2 (1.2%) | 95 (17.0%) |
| $500,000 to $749,999 | 0 (0.0%) | 0 (0.0%) |
| $750,000 to $999,999 | 0 (0.0%) | 0 (0.0%) |
| $1,000,000 or more | 0 (0.0%) | 0 (0.0%) |
| Total | 163 (100.0%) | 559 (100.0%) |
Household Income by Mortgage Status in Lynchburg
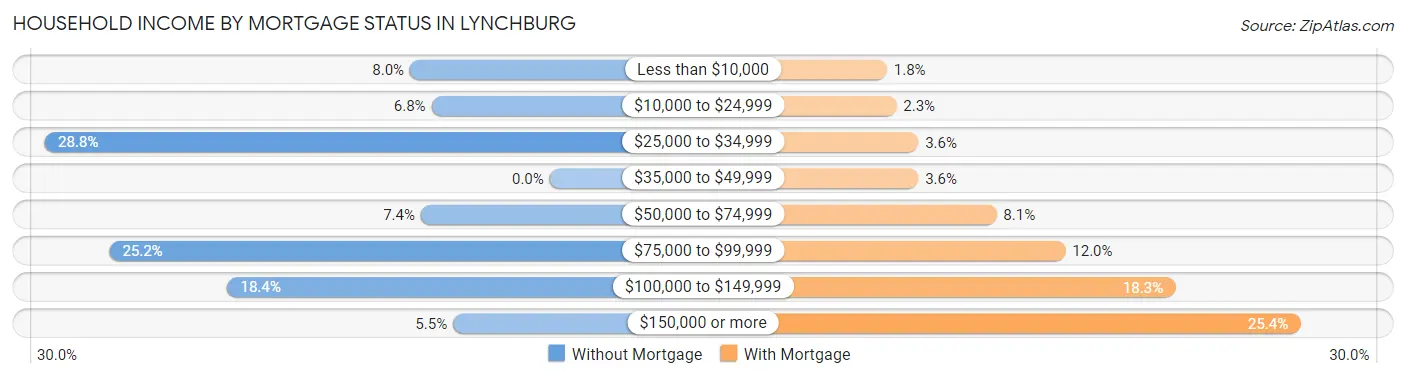
| Household Income | Without Mortgage | With Mortgage |
| Less than $10,000 | 13 (8.0%) | 10 (1.8%) |
| $10,000 to $24,999 | 11 (6.8%) | 13 (2.3%) |
| $25,000 to $34,999 | 47 (28.8%) | 20 (3.6%) |
| $35,000 to $49,999 | 0 (0.0%) | 20 (3.6%) |
| $50,000 to $74,999 | 12 (7.4%) | 45 (8.1%) |
| $75,000 to $99,999 | 41 (25.2%) | 67 (12.0%) |
| $100,000 to $149,999 | 30 (18.4%) | 102 (18.2%) |
| $150,000 or more | 9 (5.5%) | 142 (25.4%) |
| Total | 163 (100.0%) | 559 (100.0%) |
Property Value to Household Income Ratio in Lynchburg
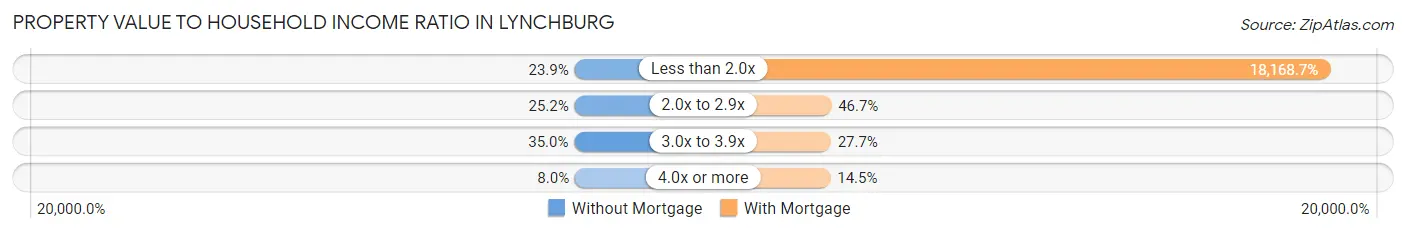
| Value-to-Income Ratio | Without Mortgage | With Mortgage |
| Less than 2.0x | 39 (23.9%) | 101,563 (18,168.7%) |
| 2.0x to 2.9x | 41 (25.2%) | 261 (46.7%) |
| 3.0x to 3.9x | 57 (35.0%) | 155 (27.7%) |
| 4.0x or more | 13 (8.0%) | 81 (14.5%) |
| Total | 163 (100.0%) | 559 (100.0%) |
Real Estate Taxes by Mortgage Status in Lynchburg
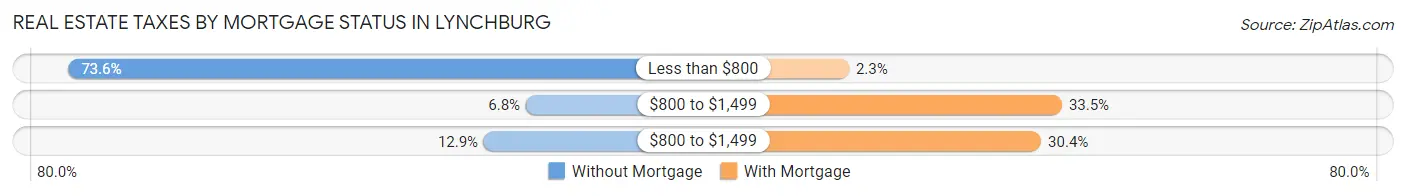
| Property Taxes | Without Mortgage | With Mortgage |
| Less than $800 | 120 (73.6%) | 13 (2.3%) |
| $800 to $1,499 | 11 (6.8%) | 187 (33.5%) |
| $800 to $1,499 | 21 (12.9%) | 170 (30.4%) |
| Total | 163 (100.0%) | 559 (100.0%) |
Health & Disability in Lynchburg
Health Insurance Coverage by Age in Lynchburg
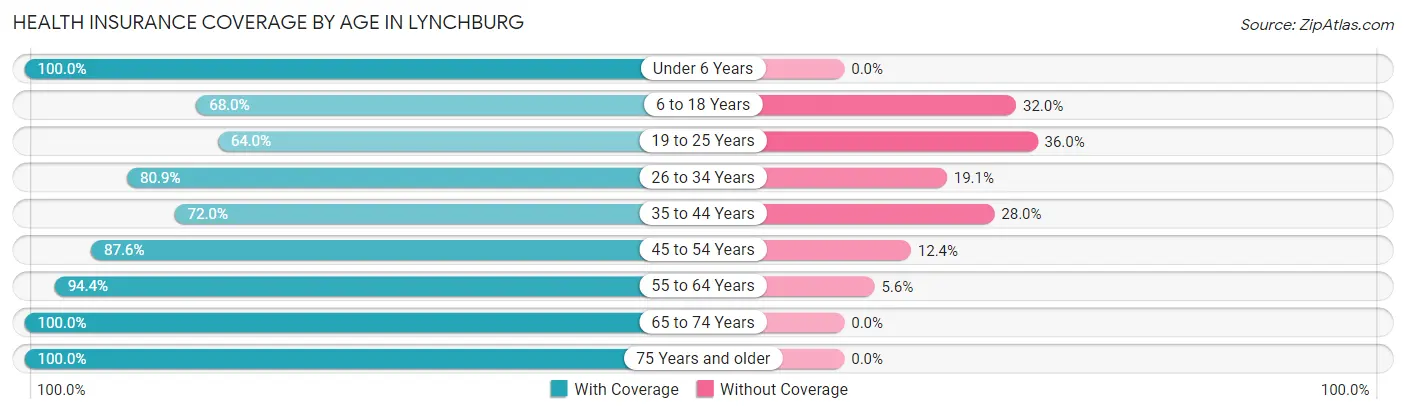
| Age Bracket | With Coverage | Without Coverage |
| Under 6 Years | 113 (100.0%) | 0 (0.0%) |
| 6 to 18 Years | 104 (68.0%) | 49 (32.0%) |
| 19 to 25 Years | 158 (64.0%) | 89 (36.0%) |
| 26 to 34 Years | 127 (80.9%) | 30 (19.1%) |
| 35 to 44 Years | 157 (72.0%) | 61 (28.0%) |
| 45 to 54 Years | 374 (87.6%) | 53 (12.4%) |
| 55 to 64 Years | 403 (94.4%) | 24 (5.6%) |
| 65 to 74 Years | 106 (100.0%) | 0 (0.0%) |
| 75 Years and older | 102 (100.0%) | 0 (0.0%) |
| Total | 1,644 (84.3%) | 306 (15.7%) |
Health Insurance Coverage by Citizenship Status in Lynchburg

| Citizenship Status | With Coverage | Without Coverage |
| Native Born | 113 (100.0%) | 0 (0.0%) |
| Foreign Born, Citizen | 104 (68.0%) | 49 (32.0%) |
| Foreign Born, not a Citizen | 158 (64.0%) | 89 (36.0%) |
Health Insurance Coverage by Household Income in Lynchburg
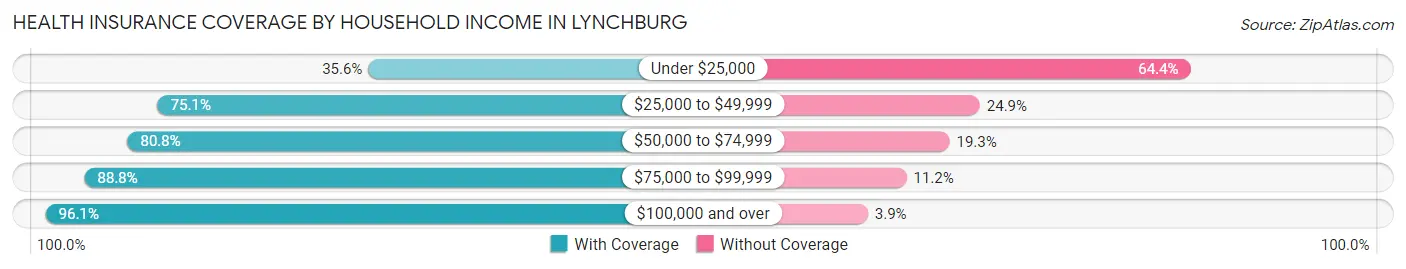
| Household Income | With Coverage | Without Coverage |
| Under $25,000 | 62 (35.6%) | 112 (64.4%) |
| $25,000 to $49,999 | 274 (75.1%) | 91 (24.9%) |
| $50,000 to $74,999 | 151 (80.7%) | 36 (19.3%) |
| $75,000 to $99,999 | 230 (88.8%) | 29 (11.2%) |
| $100,000 and over | 927 (96.1%) | 38 (3.9%) |
Public vs Private Health Insurance Coverage by Age in Lynchburg
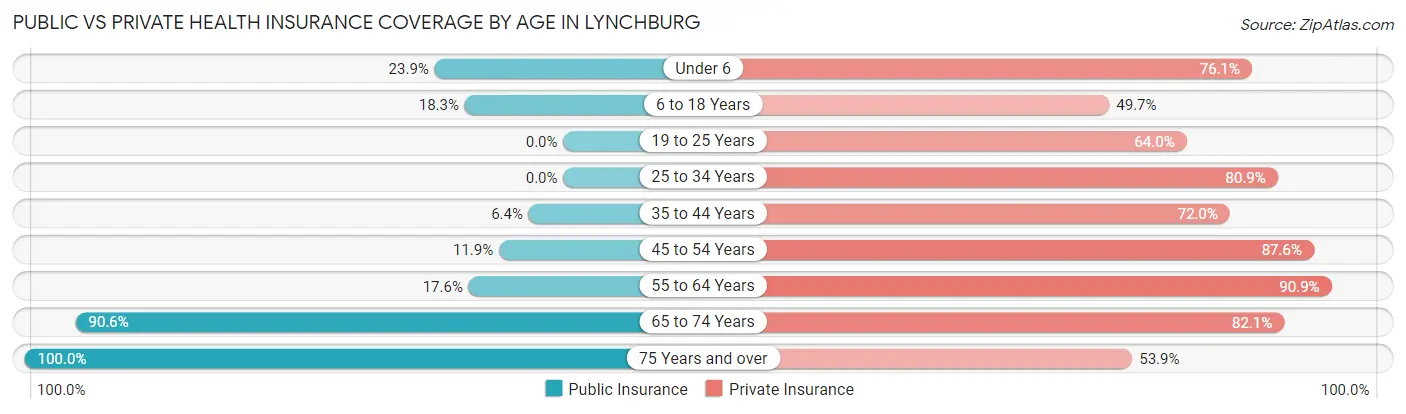
| Age Bracket | Public Insurance | Private Insurance |
| Under 6 | 27 (23.9%) | 86 (76.1%) |
| 6 to 18 Years | 28 (18.3%) | 76 (49.7%) |
| 19 to 25 Years | 0 (0.0%) | 158 (64.0%) |
| 25 to 34 Years | 0 (0.0%) | 127 (80.9%) |
| 35 to 44 Years | 14 (6.4%) | 157 (72.0%) |
| 45 to 54 Years | 51 (11.9%) | 374 (87.6%) |
| 55 to 64 Years | 75 (17.6%) | 388 (90.9%) |
| 65 to 74 Years | 96 (90.6%) | 87 (82.1%) |
| 75 Years and over | 102 (100.0%) | 55 (53.9%) |
| Total | 393 (20.2%) | 1,508 (77.3%) |
Disability Status by Sex by Age in Lynchburg
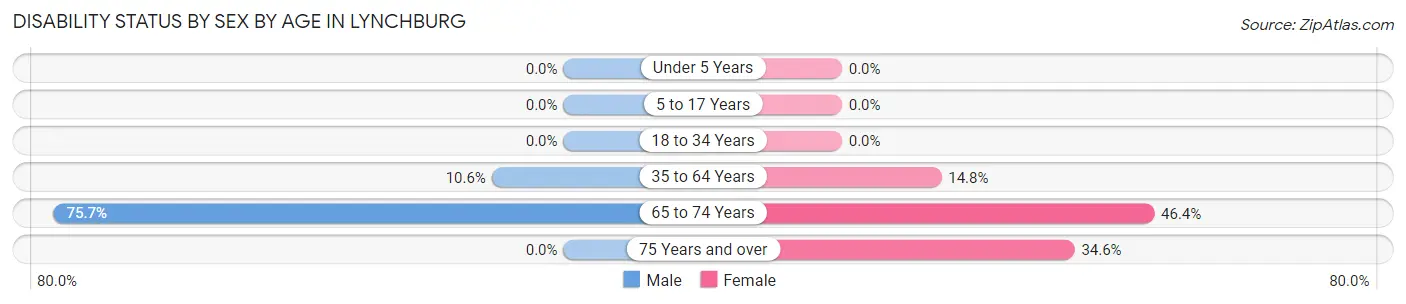
| Age Bracket | Male | Female |
| Under 5 Years | 0 (0.0%) | 0 (0.0%) |
| 5 to 17 Years | 0 (0.0%) | 0 (0.0%) |
| 18 to 34 Years | 0 (0.0%) | 0 (0.0%) |
| 35 to 64 Years | 55 (10.6%) | 82 (14.8%) |
| 65 to 74 Years | 28 (75.7%) | 32 (46.4%) |
| 75 Years and over | 0 (0.0%) | 19 (34.5%) |
Disability Class by Sex by Age in Lynchburg
Disability Class: Hearing Difficulty
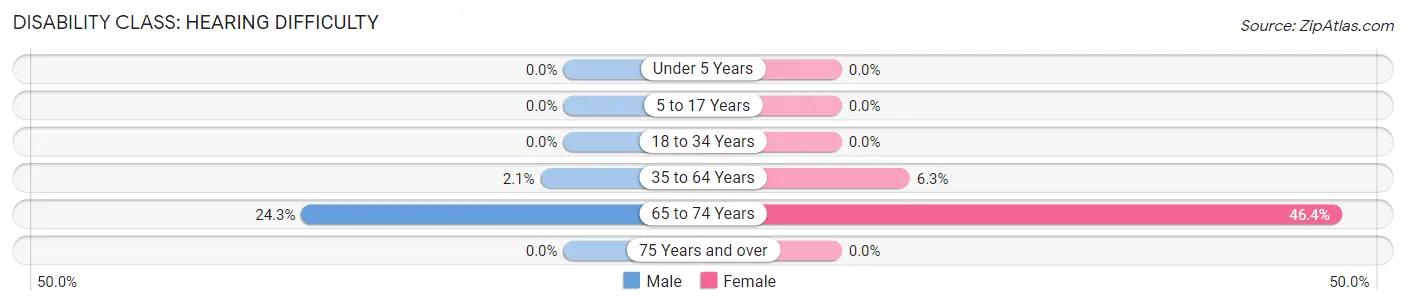
| Age Bracket | Male | Female |
| Under 5 Years | 0 (0.0%) | 0 (0.0%) |
| 5 to 17 Years | 0 (0.0%) | 0 (0.0%) |
| 18 to 34 Years | 0 (0.0%) | 0 (0.0%) |
| 35 to 64 Years | 11 (2.1%) | 35 (6.3%) |
| 65 to 74 Years | 9 (24.3%) | 32 (46.4%) |
| 75 Years and over | 0 (0.0%) | 0 (0.0%) |
Disability Class: Vision Difficulty
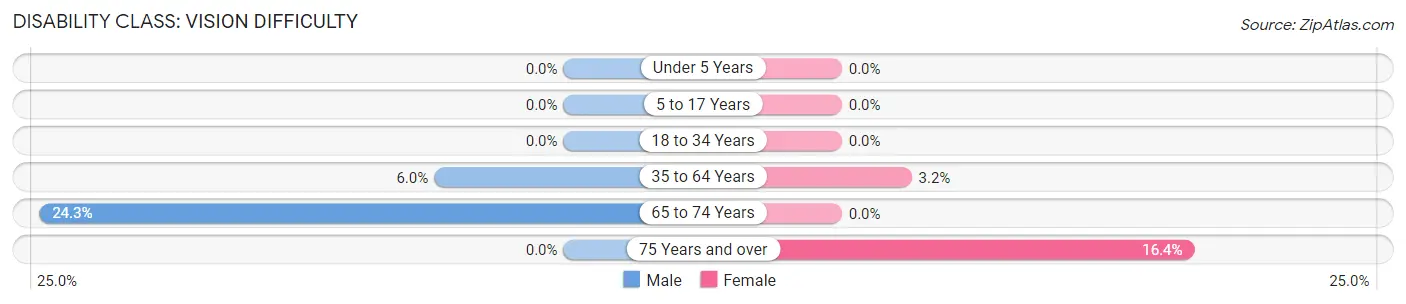
| Age Bracket | Male | Female |
| Under 5 Years | 0 (0.0%) | 0 (0.0%) |
| 5 to 17 Years | 0 (0.0%) | 0 (0.0%) |
| 18 to 34 Years | 0 (0.0%) | 0 (0.0%) |
| 35 to 64 Years | 31 (6.0%) | 18 (3.2%) |
| 65 to 74 Years | 9 (24.3%) | 0 (0.0%) |
| 75 Years and over | 0 (0.0%) | 9 (16.4%) |
Disability Class: Cognitive Difficulty
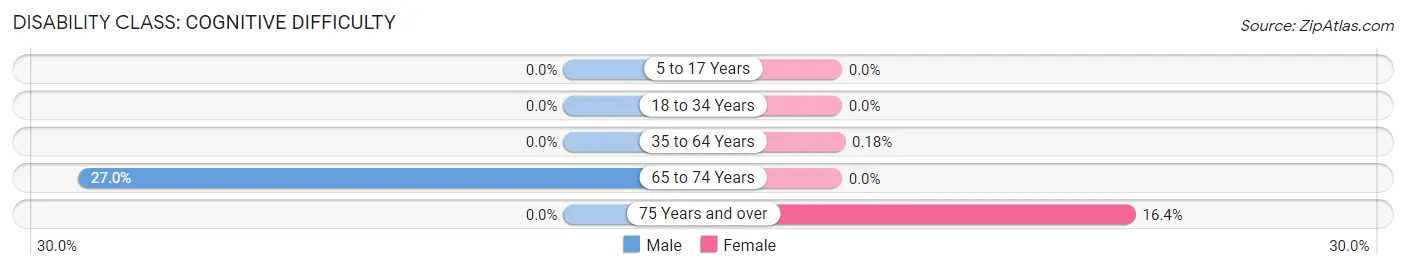
| Age Bracket | Male | Female |
| 5 to 17 Years | 0 (0.0%) | 0 (0.0%) |
| 18 to 34 Years | 0 (0.0%) | 0 (0.0%) |
| 35 to 64 Years | 0 (0.0%) | 1 (0.2%) |
| 65 to 74 Years | 10 (27.0%) | 0 (0.0%) |
| 75 Years and over | 0 (0.0%) | 9 (16.4%) |
Disability Class: Ambulatory Difficulty
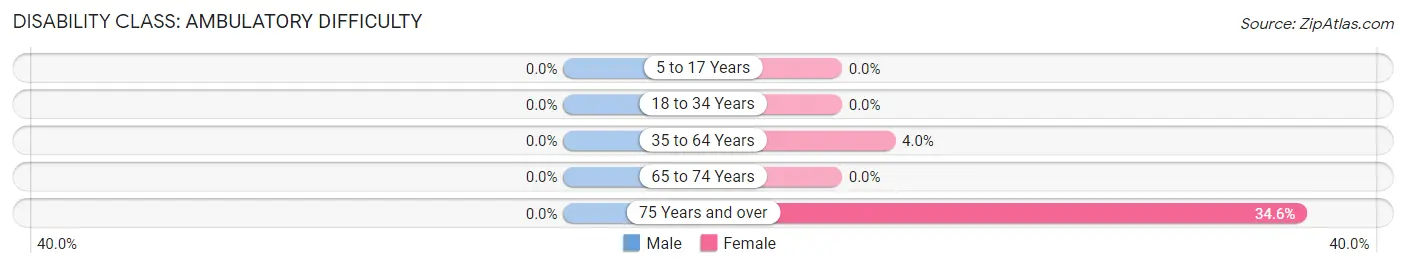
| Age Bracket | Male | Female |
| 5 to 17 Years | 0 (0.0%) | 0 (0.0%) |
| 18 to 34 Years | 0 (0.0%) | 0 (0.0%) |
| 35 to 64 Years | 0 (0.0%) | 22 (4.0%) |
| 65 to 74 Years | 0 (0.0%) | 0 (0.0%) |
| 75 Years and over | 0 (0.0%) | 19 (34.5%) |
Disability Class: Self-Care Difficulty
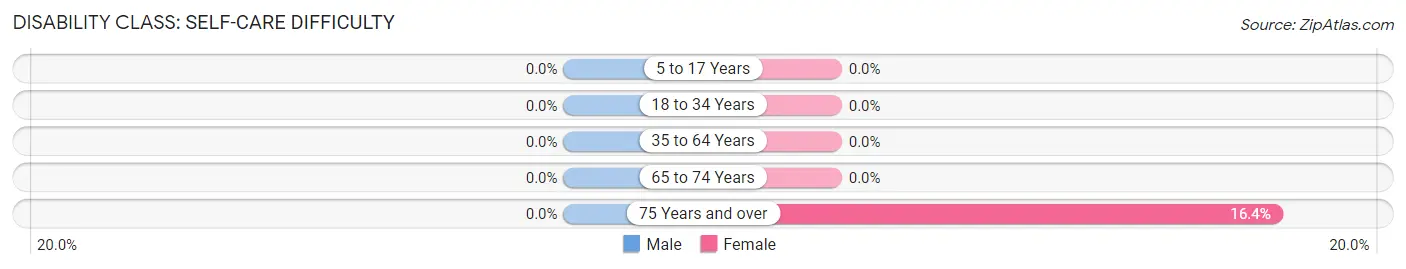
| Age Bracket | Male | Female |
| 5 to 17 Years | 0 (0.0%) | 0 (0.0%) |
| 18 to 34 Years | 0 (0.0%) | 0 (0.0%) |
| 35 to 64 Years | 0 (0.0%) | 0 (0.0%) |
| 65 to 74 Years | 0 (0.0%) | 0 (0.0%) |
| 75 Years and over | 0 (0.0%) | 9 (16.4%) |
Technology Access in Lynchburg
Computing Device Access in Lynchburg
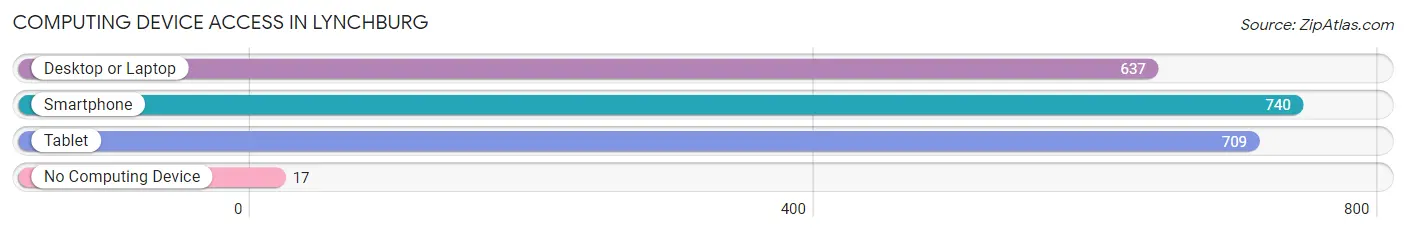
| Device Type | # Households | % Households |
| Desktop or Laptop | 637 | 76.3% |
| Smartphone | 740 | 88.6% |
| Tablet | 709 | 84.9% |
| No Computing Device | 17 | 2.0% |
| Total | 835 | 100.0% |
Internet Access in Lynchburg
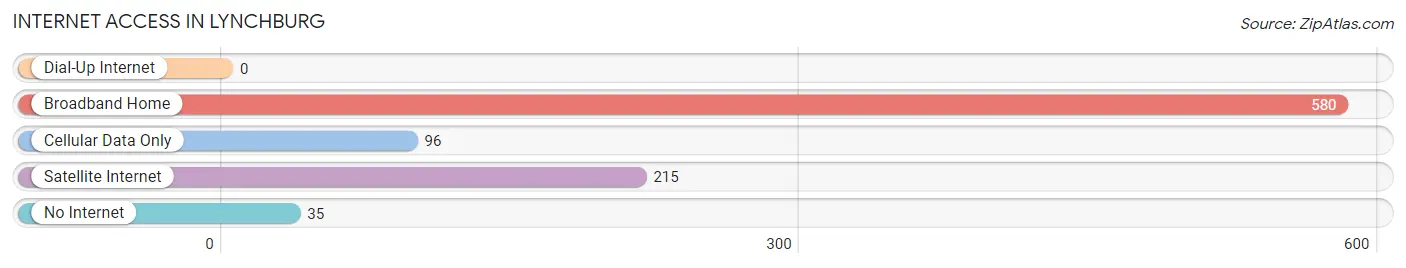
| Internet Type | # Households | % Households |
| Dial-Up Internet | 0 | 0.0% |
| Broadband Home | 580 | 69.5% |
| Cellular Data Only | 96 | 11.5% |
| Satellite Internet | 215 | 25.8% |
| No Internet | 35 | 4.2% |
| Total | 835 | 100.0% |
Lynchburg Summary
Lynchburg, Mississippi is a small town located in the northeastern corner of the state, in Tishomingo County. It is situated on the banks of the Tennessee River, and is part of the larger Tupelo-Corinth-Fulton Metropolitan Statistical Area. The town has a population of just over 1,000 people, and is known for its rural charm and friendly atmosphere.
History
The area that is now Lynchburg was first settled in the early 1800s by a group of settlers from North Carolina. The town was originally known as “Lynch’s Ford”, named after the first settler, John Lynch. The town was officially incorporated in 1837, and the name was changed to Lynchburg.
During the Civil War, Lynchburg was the site of a major battle between Union and Confederate forces. The Battle of Lynchburg was fought on April 12, 1862, and resulted in a Confederate victory.
Geography
Lynchburg is located in the northeastern corner of Mississippi, in Tishomingo County. It is situated on the banks of the Tennessee River, and is part of the larger Tupelo-Corinth-Fulton Metropolitan Statistical Area. The town is located about 30 miles south of the state capital, Jackson.
The town is surrounded by rolling hills and forests, and is home to several small lakes and streams. The climate in Lynchburg is humid subtropical, with hot summers and mild winters.
Economy
The economy of Lynchburg is largely based on agriculture and tourism. The town is home to several small farms, which produce a variety of crops, including corn, soybeans, cotton, and hay. The town is also home to several small businesses, including restaurants, shops, and a few small manufacturing plants.
Tourism is an important part of the local economy, as the town is home to several historic sites, including the Battle of Lynchburg site, the Lynchburg Museum, and the Lynchburg Historic District. The town is also home to several outdoor recreation areas, including the Tishomingo State Park and the Natchez Trace Parkway.
Demographics
As of the 2010 census, Lynchburg had a population of 1,072 people. The racial makeup of the town was 95.3% White, 2.7% African American, 0.3% Native American, 0.2% Asian, and 1.5% from other races. The median household income was $30,938, and the median family income was $37,813.
The town is home to several churches, including the First Baptist Church of Lynchburg, the Lynchburg United Methodist Church, and the Lynchburg Presbyterian Church. The town is also home to several schools, including the Lynchburg Elementary School, the Lynchburg Middle School, and the Lynchburg High School.
Common Questions
What is Per Capita Income in Lynchburg?
Per Capita income in Lynchburg is $42,199.
What is the Median Family Income in Lynchburg?
Median Family Income in Lynchburg is $102,438.
What is the Median Household income in Lynchburg?
Median Household Income in Lynchburg is $94,688.
What is Income or Wage Gap in Lynchburg?
Income or Wage Gap in Lynchburg is 8.5%.
Women in Lynchburg earn 91.5 cents for every dollar earned by a man.
What is Inequality or Gini Index in Lynchburg?
Inequality or Gini Index in Lynchburg is 0.38.
What is the Total Population of Lynchburg?
Total Population of Lynchburg is 1,950.
What is the Total Male Population of Lynchburg?
Total Male Population of Lynchburg is 1,019.
What is the Total Female Population of Lynchburg?
Total Female Population of Lynchburg is 931.
What is the Ratio of Males per 100 Females in Lynchburg?
There are 109.45 Males per 100 Females in Lynchburg.
What is the Ratio of Females per 100 Males in Lynchburg?
There are 91.36 Females per 100 Males in Lynchburg.
What is the Median Population Age in Lynchburg?
Median Population Age in Lynchburg is 46.5 Years.
What is the Average Family Size in Lynchburg
Average Family Size in Lynchburg is 2.6 People.
What is the Average Household Size in Lynchburg
Average Household Size in Lynchburg is 2.3 People.
How Large is the Labor Force in Lynchburg?
There are 1,374 People in the Labor Forcein in Lynchburg.
What is the Percentage of People in the Labor Force in Lynchburg?
80.2% of People are in the Labor Force in Lynchburg.
What is the Unemployment Rate in Lynchburg?
Unemployment Rate in Lynchburg is 13.8%.