Wade, MS Map & Demographics
Wade Map
Wade Overview
$16,734
PER CAPITA INCOME
12.4%
WAGE / INCOME GAP [ % ]
87.6¢/ $1
WAGE / INCOME GAP [ $ ]
0.61
INEQUALITY / GINI INDEX
1,349
TOTAL POPULATION
607
MALE POPULATION
742
FEMALE POPULATION
81.81
MALES / 100 FEMALES
122.24
FEMALES / 100 MALES
28.1
MEDIAN AGE
3.6
AVG FAMILY SIZE
3.0
AVG HOUSEHOLD SIZE
502
LABOR FORCE [ PEOPLE ]
46.8%
PERCENT IN LABOR FORCE
48.0%
UNEMPLOYMENT RATE
Income in Wade
Income Overview in Wade
| Characteristic | Number | Measure |
| Per Capita Income | 1,349 | $16,734 |
| Median Family Income | 346 | $0 |
| Mean Family Income | 346 | $50,367 |
| Median Household Income | 456 | $0 |
| Mean Household Income | 456 | $45,467 |
| Income Deficit | 346 | $0 |
| Wage / Income Gap (%) | 1,349 | 12.44% |
| Wage / Income Gap ($) | 1,349 | 87.56¢ per $1 |
| Gini / Inequality Index | 1,349 | 0.61 |
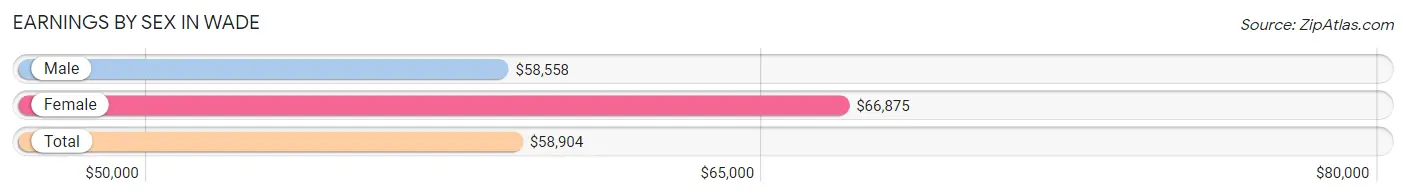
Earnings by Sex in Wade
Average Earnings in Wade are $58,904, $58,558 for men and $66,875 for women, a difference of 12.4%.
| Sex | Number | Average Earnings |
| Male | 213 (81.6%) | $58,558 |
| Female | 48 (18.4%) | $66,875 |
| Total | 261 (100.0%) | $58,904 |
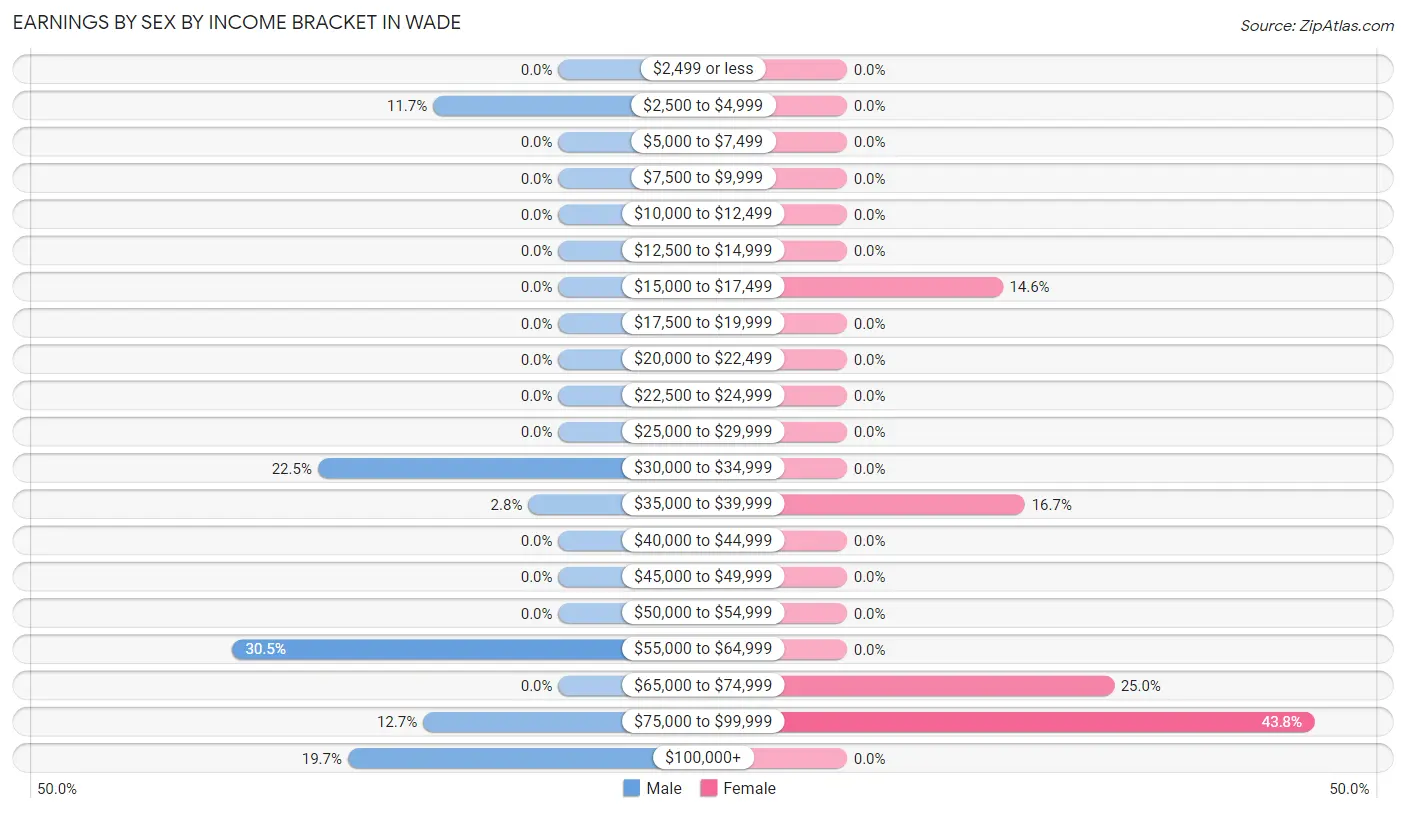
Earnings by Sex by Income Bracket in Wade
The most common earnings brackets in Wade are $55,000 to $64,999 for men (65 | 30.5%) and $75,000 to $99,999 for women (21 | 43.8%).
| Income | Male | Female |
| $2,499 or less | 0 (0.0%) | 0 (0.0%) |
| $2,500 to $4,999 | 25 (11.7%) | 0 (0.0%) |
| $5,000 to $7,499 | 0 (0.0%) | 0 (0.0%) |
| $7,500 to $9,999 | 0 (0.0%) | 0 (0.0%) |
| $10,000 to $12,499 | 0 (0.0%) | 0 (0.0%) |
| $12,500 to $14,999 | 0 (0.0%) | 0 (0.0%) |
| $15,000 to $17,499 | 0 (0.0%) | 7 (14.6%) |
| $17,500 to $19,999 | 0 (0.0%) | 0 (0.0%) |
| $20,000 to $22,499 | 0 (0.0%) | 0 (0.0%) |
| $22,500 to $24,999 | 0 (0.0%) | 0 (0.0%) |
| $25,000 to $29,999 | 0 (0.0%) | 0 (0.0%) |
| $30,000 to $34,999 | 48 (22.5%) | 0 (0.0%) |
| $35,000 to $39,999 | 6 (2.8%) | 8 (16.7%) |
| $40,000 to $44,999 | 0 (0.0%) | 0 (0.0%) |
| $45,000 to $49,999 | 0 (0.0%) | 0 (0.0%) |
| $50,000 to $54,999 | 0 (0.0%) | 0 (0.0%) |
| $55,000 to $64,999 | 65 (30.5%) | 0 (0.0%) |
| $65,000 to $74,999 | 0 (0.0%) | 12 (25.0%) |
| $75,000 to $99,999 | 27 (12.7%) | 21 (43.8%) |
| $100,000+ | 42 (19.7%) | 0 (0.0%) |
| Total | 213 (100.0%) | 48 (100.0%) |
Earnings by Sex by Educational Attainment in Wade
| Educational Attainment | Male Income | Female Income |
| Less than High School | - | - |
| High School Diploma | - | - |
| College or Associate's Degree | - | - |
| Bachelor's Degree | - | - |
| Graduate Degree | - | - |
| Total | $59,154 | $82,560 |
Family Income in Wade
Family Income Brackets in Wade
According to the Wade family income data, there are 130 families falling into the less than $10,000 income range, which is the most common income bracket and makes up 37.6% of all families.
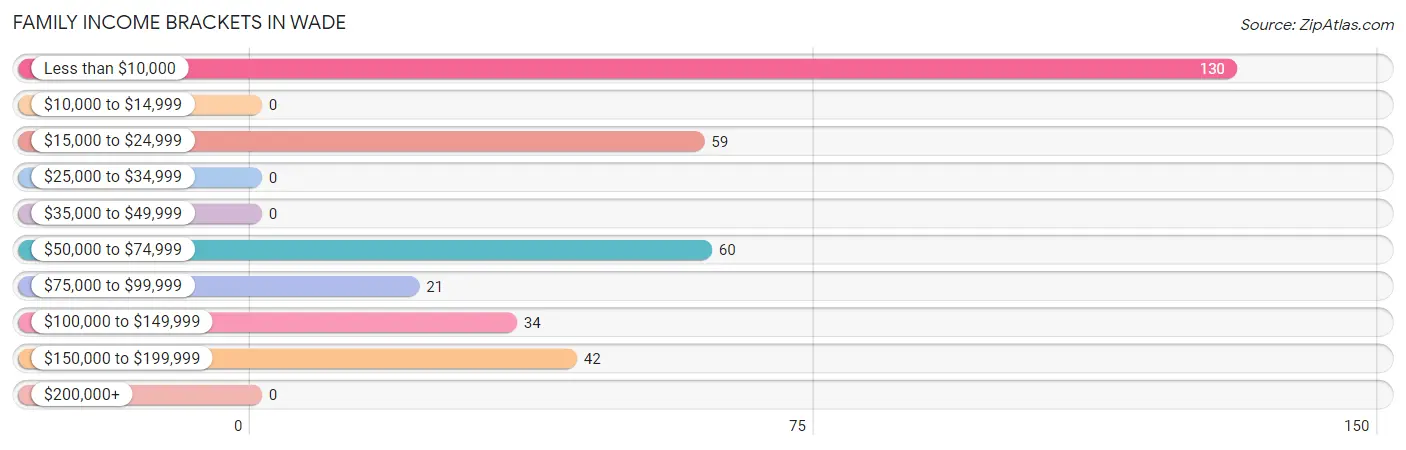
| Income Bracket | # Families | % Families |
| Less than $10,000 | 130 | 37.6% |
| $10,000 to $14,999 | 0 | 0.0% |
| $15,000 to $24,999 | 59 | 17.1% |
| $25,000 to $34,999 | 0 | 0.0% |
| $35,000 to $49,999 | 0 | 0.0% |
| $50,000 to $74,999 | 60 | 17.3% |
| $75,000 to $99,999 | 21 | 6.1% |
| $100,000 to $149,999 | 34 | 9.8% |
| $150,000 to $199,999 | 42 | 12.1% |
| $200,000+ | 0 | 0.0% |
Family Income by Famaliy Size in Wade
| Income Bracket | # Families | Median Income |
| 2-Person Families | 102 (29.5%) | $0 |
| 3-Person Families | 6 (1.7%) | $0 |
| 4-Person Families | 142 (41.0%) | $0 |
| 5-Person Families | 96 (27.8%) | $0 |
| 6-Person Families | 0 (0.0%) | $0 |
| 7+ Person Families | 0 (0.0%) | $0 |
| Total | 346 (100.0%) | $0 |
Family Income by Number of Earners in Wade
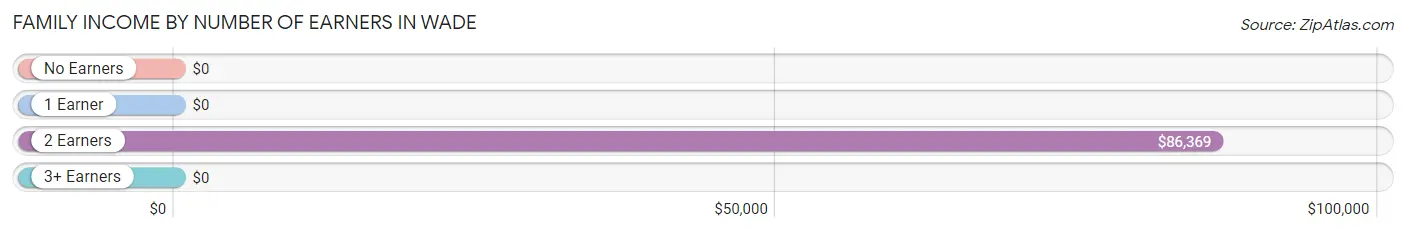
| Number of Earners | # Families | Median Income |
| No Earners | 189 (54.6%) | $0 |
| 1 Earner | 110 (31.8%) | $0 |
| 2 Earners | 35 (10.1%) | $86,369 |
| 3+ Earners | 12 (3.5%) | $0 |
| Total | 346 (100.0%) | $0 |
Household Income in Wade
Household Income Brackets in Wade
With 156 households falling in the category, the less than $10,000 income range is the most frequent in Wade, accounting for 34.2% of all households.
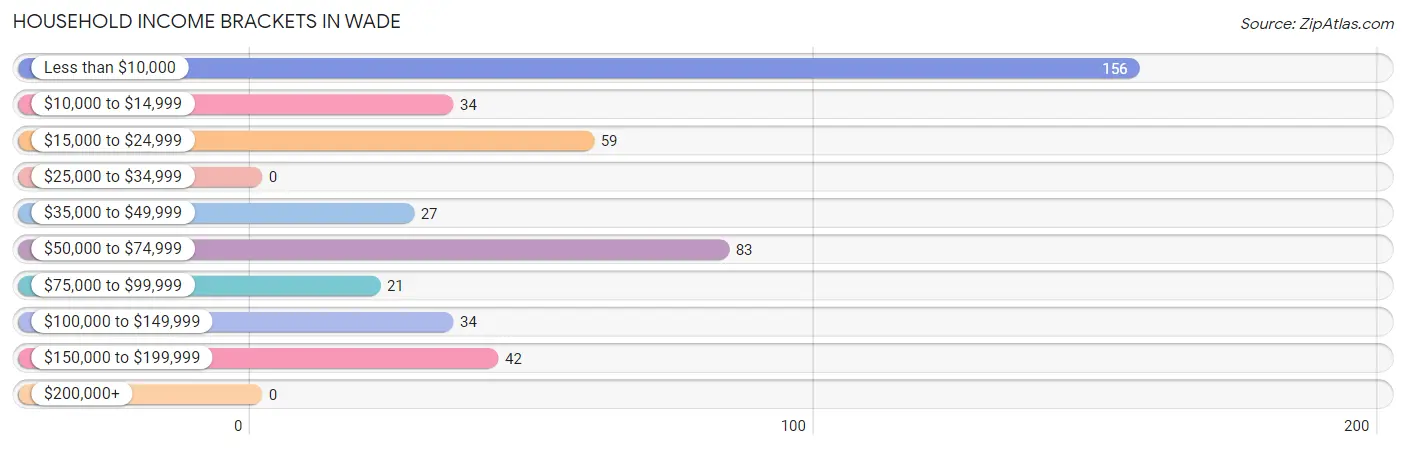
| Income Bracket | # Households | % Households |
| Less than $10,000 | 156 | 34.2% |
| $10,000 to $14,999 | 34 | 7.5% |
| $15,000 to $24,999 | 59 | 12.9% |
| $25,000 to $34,999 | 0 | 0.0% |
| $35,000 to $49,999 | 27 | 5.9% |
| $50,000 to $74,999 | 83 | 18.2% |
| $75,000 to $99,999 | 21 | 4.6% |
| $100,000 to $149,999 | 34 | 7.5% |
| $150,000 to $199,999 | 42 | 9.2% |
| $200,000+ | 0 | 0.0% |
Household Income by Householder Age in Wade
The median household income in Wade is $0, with the highest median household income of $68,043 found in the 65+ years age bracket for the primary householder. A total of 64 households (14.0%) fall into this category. Meanwhile, the 15 to 24 years age bracket for the primary householder has the lowest median household income of $0, with 6 households (1.3%) in this group.
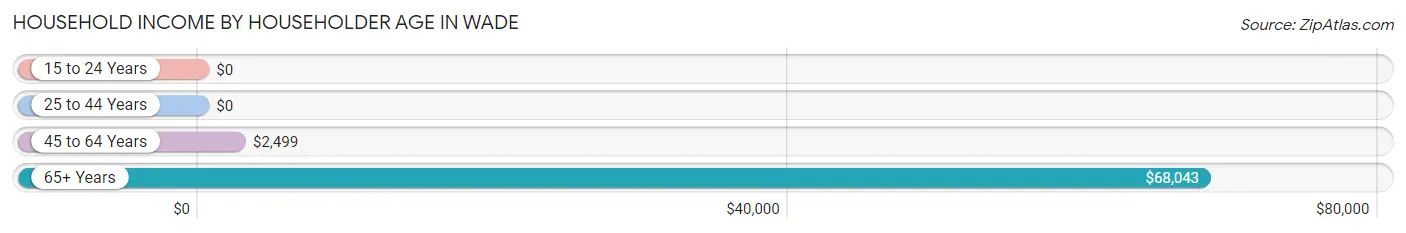
| Income Bracket | # Households | Median Income |
| 15 to 24 Years | 6 (1.3%) | $0 |
| 25 to 44 Years | 76 (16.7%) | $0 |
| 45 to 64 Years | 310 (68.0%) | $2,499 |
| 65+ Years | 64 (14.0%) | $68,043 |
| Total | 456 (100.0%) | $0 |
Poverty in Wade
Income Below Poverty by Sex and Age in Wade
With 33.0% poverty level for males and 64.1% for females among the residents of Wade, 55 to 64 year old males and 55 to 64 year old females are the most vulnerable to poverty, with 85 males (100.0%) and 228 females (80.8%) in their respective age groups living below the poverty level.
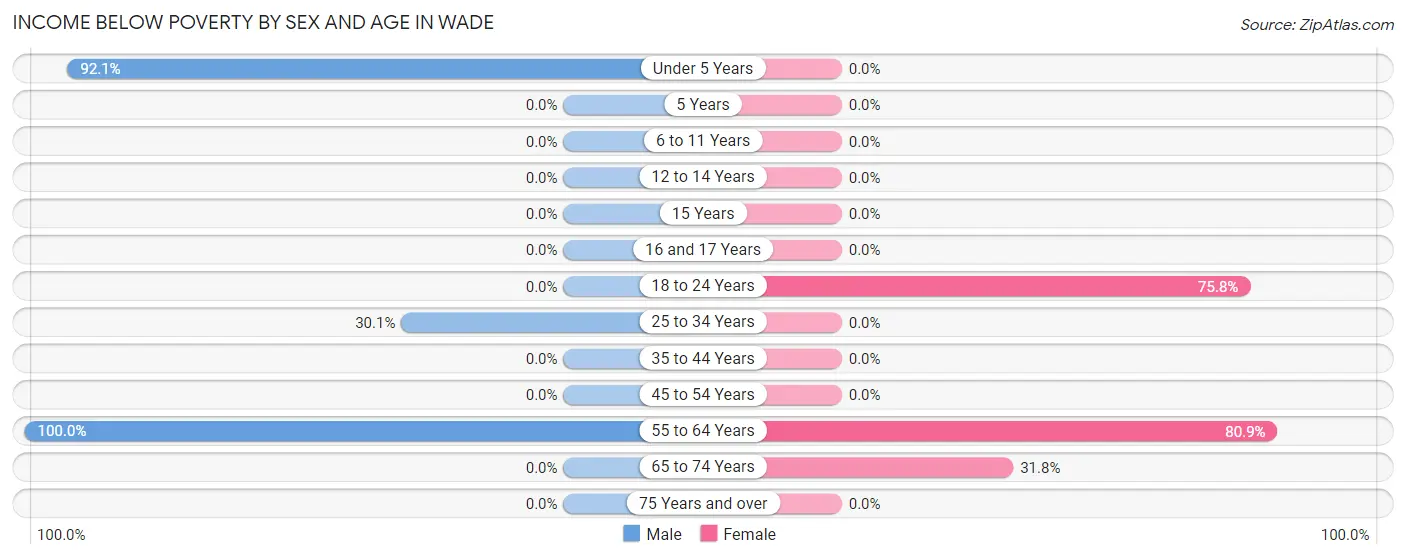
| Age Bracket | Male | Female |
| Under 5 Years | 81 (92.0%) | 0 (0.0%) |
| 5 Years | 0 (0.0%) | 0 (0.0%) |
| 6 to 11 Years | 0 (0.0%) | 0 (0.0%) |
| 12 to 14 Years | 0 (0.0%) | 0 (0.0%) |
| 15 Years | 0 (0.0%) | 0 (0.0%) |
| 16 and 17 Years | 0 (0.0%) | 0 (0.0%) |
| 18 to 24 Years | 0 (0.0%) | 241 (75.8%) |
| 25 to 34 Years | 34 (30.1%) | 0 (0.0%) |
| 35 to 44 Years | 0 (0.0%) | 0 (0.0%) |
| 45 to 54 Years | 0 (0.0%) | 0 (0.0%) |
| 55 to 64 Years | 85 (100.0%) | 228 (80.8%) |
| 65 to 74 Years | 0 (0.0%) | 7 (31.8%) |
| 75 Years and over | 0 (0.0%) | 0 (0.0%) |
| Total | 200 (33.0%) | 476 (64.1%) |
Income Above Poverty by Sex and Age in Wade
According to the poverty statistics in Wade, males aged 6 to 11 years and females aged under 5 years are the age groups that are most secure financially, with 100.0% of males and 100.0% of females in these age groups living above the poverty line.
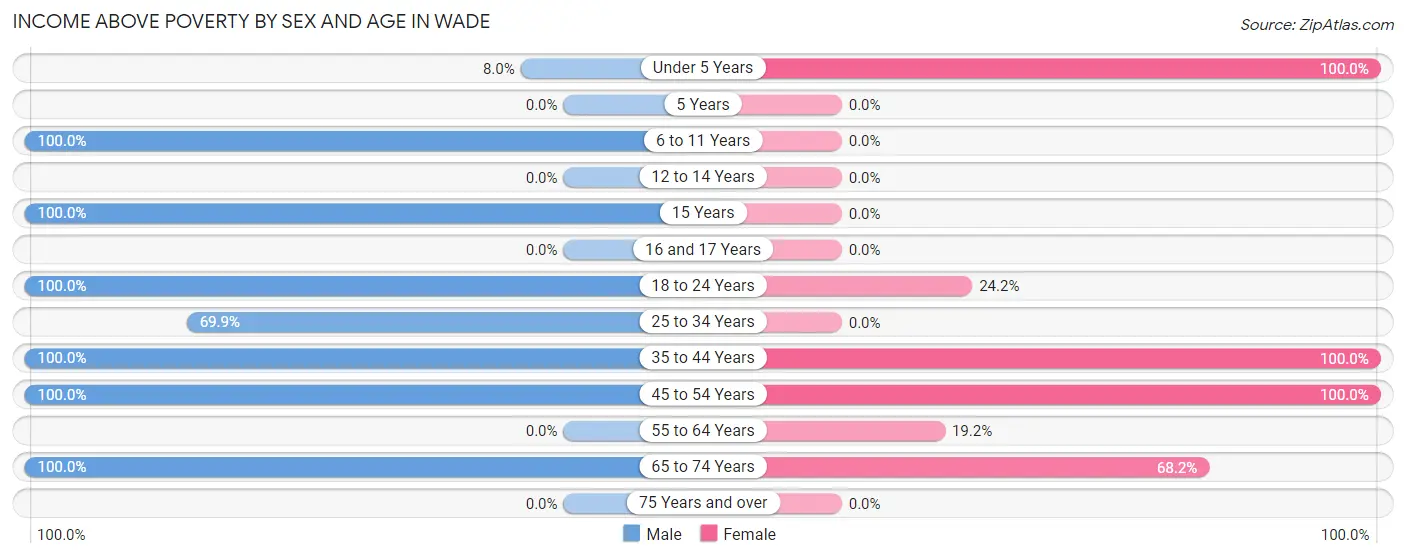
| Age Bracket | Male | Female |
| Under 5 Years | 7 (8.0%) | 55 (100.0%) |
| 5 Years | 0 (0.0%) | 0 (0.0%) |
| 6 to 11 Years | 111 (100.0%) | 0 (0.0%) |
| 12 to 14 Years | 0 (0.0%) | 0 (0.0%) |
| 15 Years | 23 (100.0%) | 0 (0.0%) |
| 16 and 17 Years | 0 (0.0%) | 0 (0.0%) |
| 18 to 24 Years | 57 (100.0%) | 77 (24.2%) |
| 25 to 34 Years | 79 (69.9%) | 0 (0.0%) |
| 35 to 44 Years | 42 (100.0%) | 24 (100.0%) |
| 45 to 54 Years | 24 (100.0%) | 41 (100.0%) |
| 55 to 64 Years | 0 (0.0%) | 54 (19.2%) |
| 65 to 74 Years | 64 (100.0%) | 15 (68.2%) |
| 75 Years and over | 0 (0.0%) | 0 (0.0%) |
| Total | 407 (67.0%) | 266 (35.8%) |
Income Below Poverty Among Married-Couple Families in Wade
The poverty statistics for married-couple families in Wade show that 41.8% or 59 of the total 141 families live below the poverty line. Families with no children have the highest poverty rate of 72.8%, comprising of 59 families. On the other hand, families with 1 or 2 children have the lowest poverty rate of 0.0%, which includes 0 families.
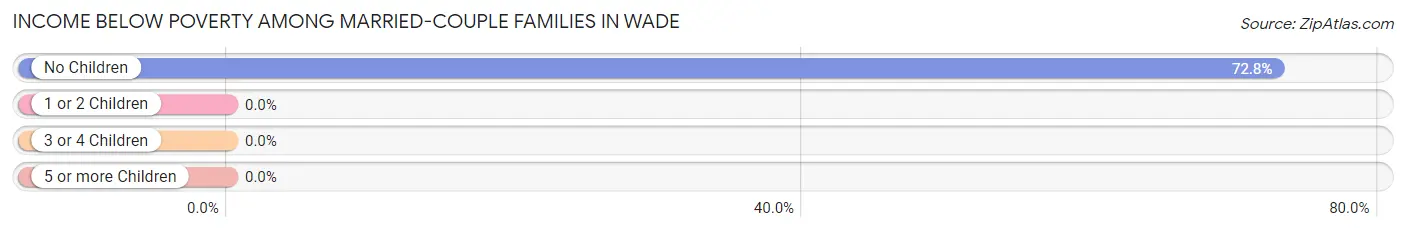
| Children | Above Poverty | Below Poverty |
| No Children | 22 (27.2%) | 59 (72.8%) |
| 1 or 2 Children | 60 (100.0%) | 0 (0.0%) |
| 3 or 4 Children | 0 (0.0%) | 0 (0.0%) |
| 5 or more Children | 0 (0.0%) | 0 (0.0%) |
| Total | 82 (58.2%) | 59 (41.8%) |
Income Below Poverty Among Single-Parent Households in Wade
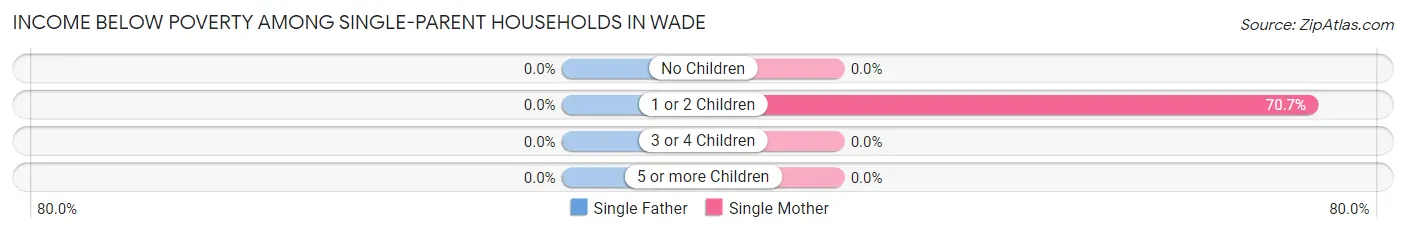
| Children | Single Father | Single Mother |
| No Children | 0 (0.0%) | 0 (0.0%) |
| 1 or 2 Children | 0 (0.0%) | 130 (70.7%) |
| 3 or 4 Children | 0 (0.0%) | 0 (0.0%) |
| 5 or more Children | 0 (0.0%) | 0 (0.0%) |
| Total | 0 (0.0%) | 130 (63.4%) |
Income Below Poverty Among Married-Couple vs Single-Parent Households in Wade
The poverty data for Wade shows that 59 of the married-couple family households (41.8%) and 130 of the single-parent households (63.4%) are living below the poverty level. Within the married-couple family households, those with no children have the highest poverty rate, with 59 households (72.8%) falling below the poverty line. Among the single-parent households, those with 1 or 2 children have the highest poverty rate, with 130 household (70.7%) living below poverty.
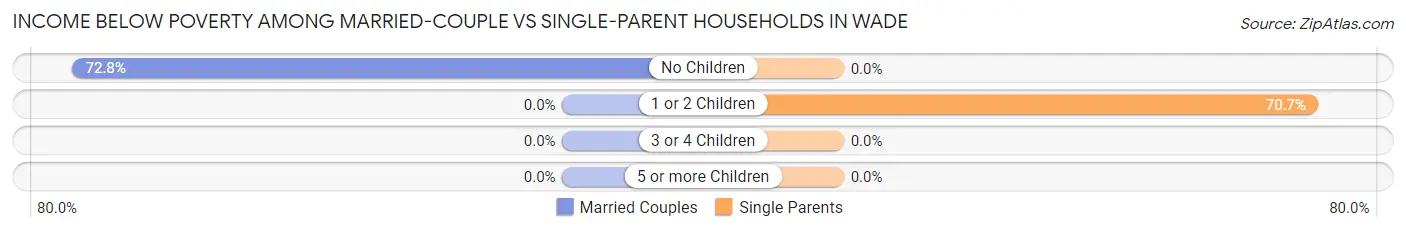
| Children | Married-Couple Families | Single-Parent Households |
| No Children | 59 (72.8%) | 0 (0.0%) |
| 1 or 2 Children | 0 (0.0%) | 130 (70.7%) |
| 3 or 4 Children | 0 (0.0%) | 0 (0.0%) |
| 5 or more Children | 0 (0.0%) | 0 (0.0%) |
| Total | 59 (41.8%) | 130 (63.4%) |
Race in Wade
The most populous races in Wade are , and White / Caucasian (1,349 | 100.0%).
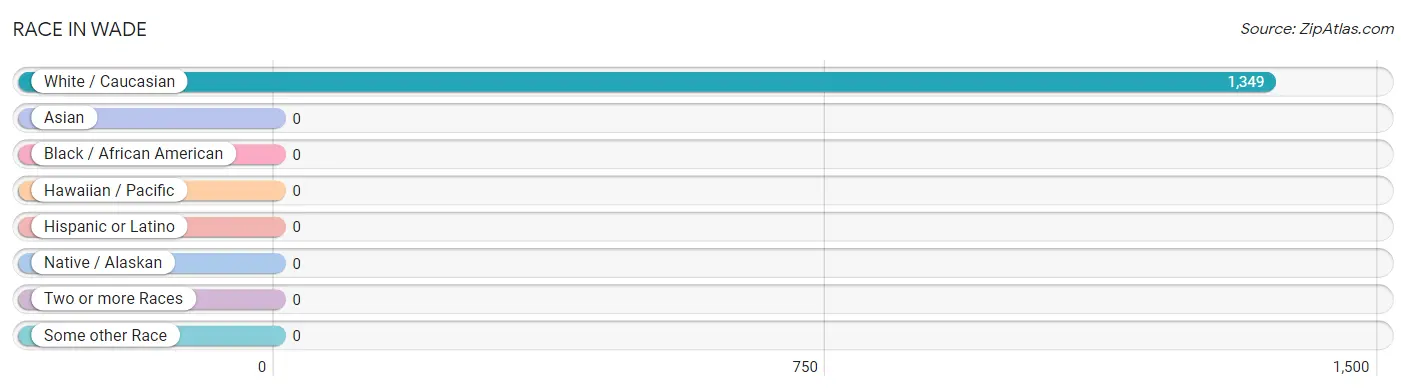
| Race | # Population | % Population |
| Asian | 0 | 0.0% |
| Black / African American | 0 | 0.0% |
| Hawaiian / Pacific | 0 | 0.0% |
| Hispanic or Latino | 0 | 0.0% |
| Native / Alaskan | 0 | 0.0% |
| White / Caucasian | 1,349 | 100.0% |
| Two or more Races | 0 | 0.0% |
| Some other Race | 0 | 0.0% |
| Total | 1,349 | 100.0% |
Ancestry in Wade
The most populous ancestries reported in Wade are English (737 | 54.6%), American (54 | 4.0%), Irish (21 | 1.6%), and Polish (8 | 0.6%), together accounting for 60.8% of all Wade residents.
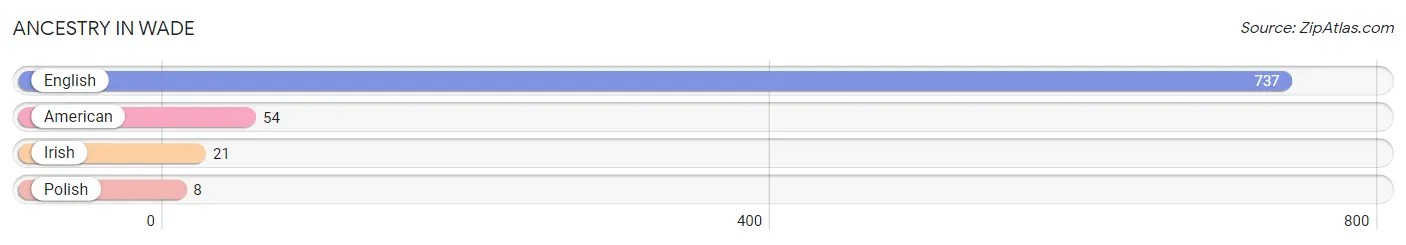
| Ancestry | # Population | % Population |
| American | 54 | 4.0% |
| English | 737 | 54.6% |
| Irish | 21 | 1.6% |
| Polish | 8 | 0.6% | View All 4 Rows |
Immigrants in Wade

| Immigration Origin | # Population | % Population | View All 0 Rows |
Sex and Age in Wade
Sex and Age in Wade
The most populous age groups in Wade are 5 to 9 Years (111 | 18.3%) for men and 55 to 59 Years (282 | 38.0%) for women.
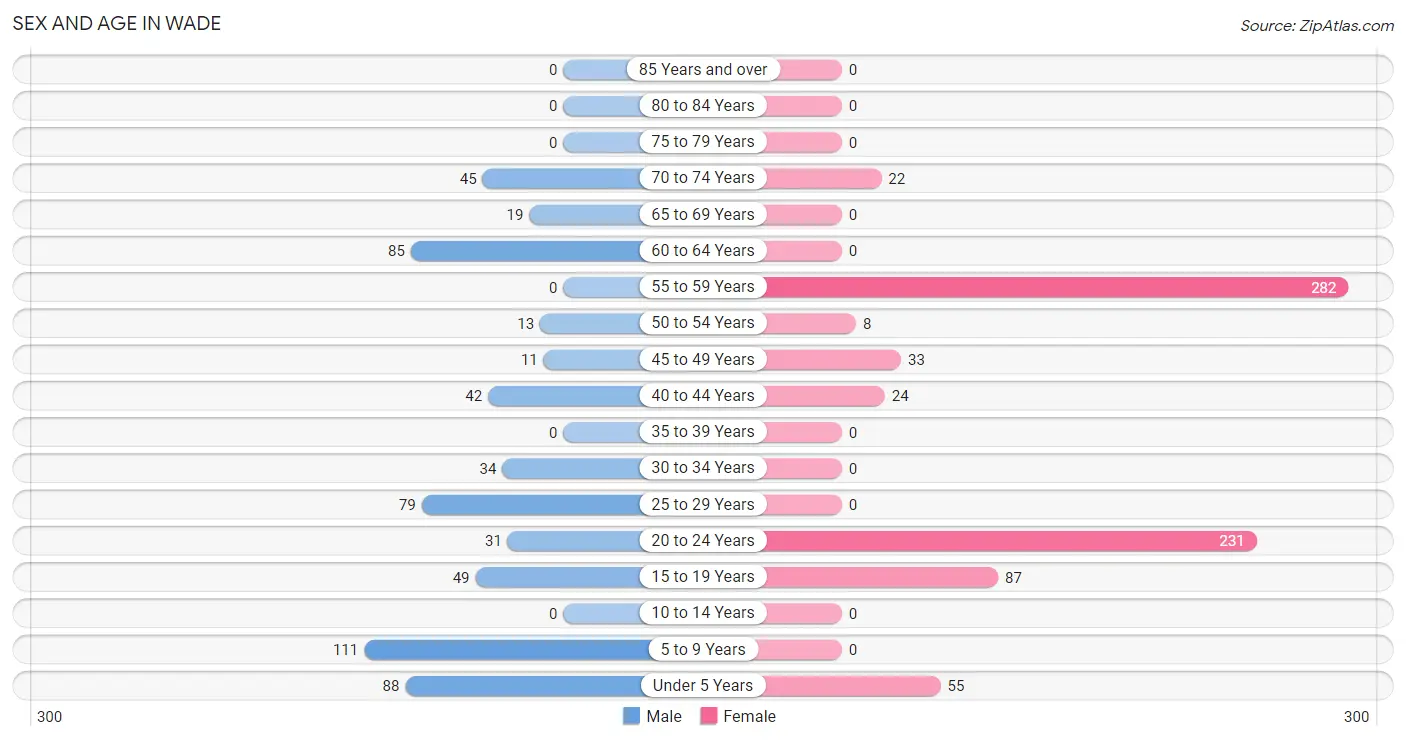
| Age Bracket | Male | Female |
| Under 5 Years | 88 (14.5%) | 55 (7.4%) |
| 5 to 9 Years | 111 (18.3%) | 0 (0.0%) |
| 10 to 14 Years | 0 (0.0%) | 0 (0.0%) |
| 15 to 19 Years | 49 (8.1%) | 87 (11.7%) |
| 20 to 24 Years | 31 (5.1%) | 231 (31.1%) |
| 25 to 29 Years | 79 (13.0%) | 0 (0.0%) |
| 30 to 34 Years | 34 (5.6%) | 0 (0.0%) |
| 35 to 39 Years | 0 (0.0%) | 0 (0.0%) |
| 40 to 44 Years | 42 (6.9%) | 24 (3.2%) |
| 45 to 49 Years | 11 (1.8%) | 33 (4.4%) |
| 50 to 54 Years | 13 (2.1%) | 8 (1.1%) |
| 55 to 59 Years | 0 (0.0%) | 282 (38.0%) |
| 60 to 64 Years | 85 (14.0%) | 0 (0.0%) |
| 65 to 69 Years | 19 (3.1%) | 0 (0.0%) |
| 70 to 74 Years | 45 (7.4%) | 22 (3.0%) |
| 75 to 79 Years | 0 (0.0%) | 0 (0.0%) |
| 80 to 84 Years | 0 (0.0%) | 0 (0.0%) |
| 85 Years and over | 0 (0.0%) | 0 (0.0%) |
| Total | 607 (100.0%) | 742 (100.0%) |
Families and Households in Wade
Median Family Size in Wade
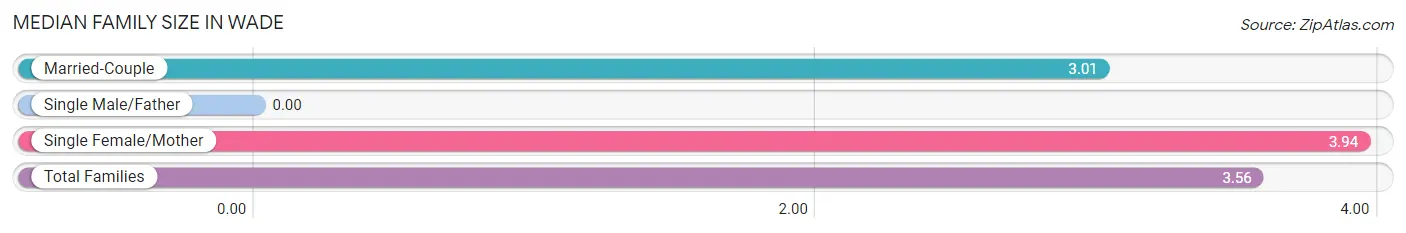
| Family Type | # Families | Family Size |
| Married-Couple | 141 (40.7%) | 3.01 |
| Single Male/Father | 0 (0.0%) | - |
| Single Female/Mother | 205 (59.3%) | 3.94 |
| Total Families | 346 (100.0%) | 3.56 |
Median Household Size in Wade
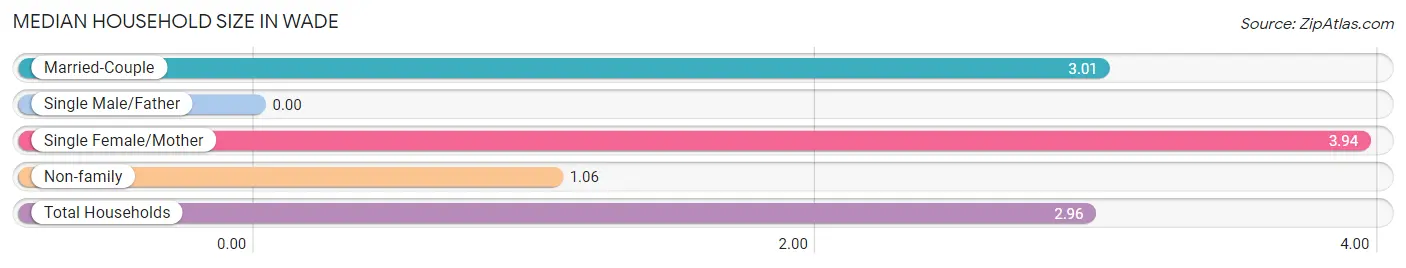
| Household Type | # Households | Household Size |
| Married-Couple | 141 (30.9%) | 3.01 |
| Single Male/Father | 0 (0.0%) | - |
| Single Female/Mother | 205 (45.0%) | 3.94 |
| Non-family | 110 (24.1%) | 1.06 |
| Total Households | 456 (100.0%) | 2.96 |
Household Size by Marriage Status in Wade
Out of a total of 456 households in Wade, 346 (75.9%) are family households, while 110 (24.1%) are nonfamily households. The most numerous type of family households are 4-person households, comprising 142, and the most common type of nonfamily households are 1-person households, comprising 102.
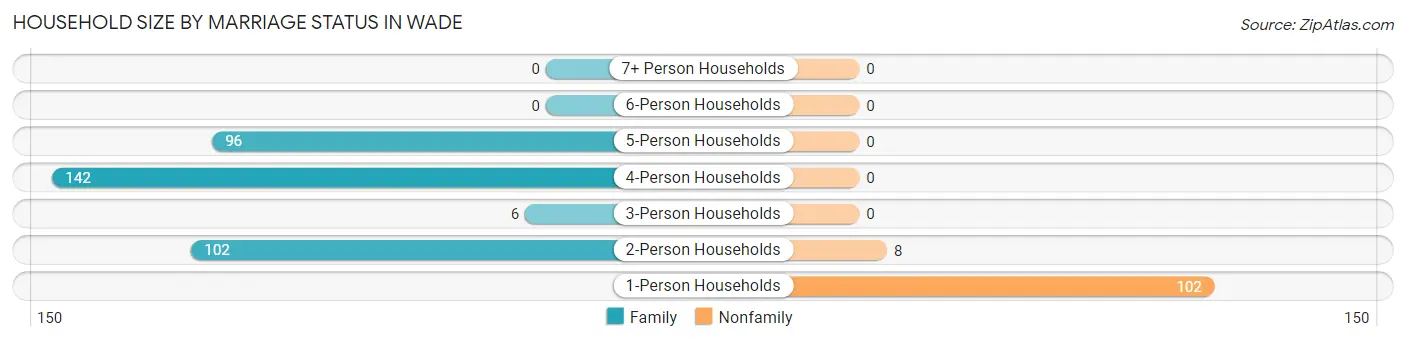
| Household Size | Family Households | Nonfamily Households |
| 1-Person Households | - | 102 (22.4%) |
| 2-Person Households | 102 (22.4%) | 8 (1.8%) |
| 3-Person Households | 6 (1.3%) | 0 (0.0%) |
| 4-Person Households | 142 (31.1%) | 0 (0.0%) |
| 5-Person Households | 96 (21.0%) | 0 (0.0%) |
| 6-Person Households | 0 (0.0%) | 0 (0.0%) |
| 7+ Person Households | 0 (0.0%) | 0 (0.0%) |
| Total | 346 (75.9%) | 110 (24.1%) |
Female Fertility in Wade
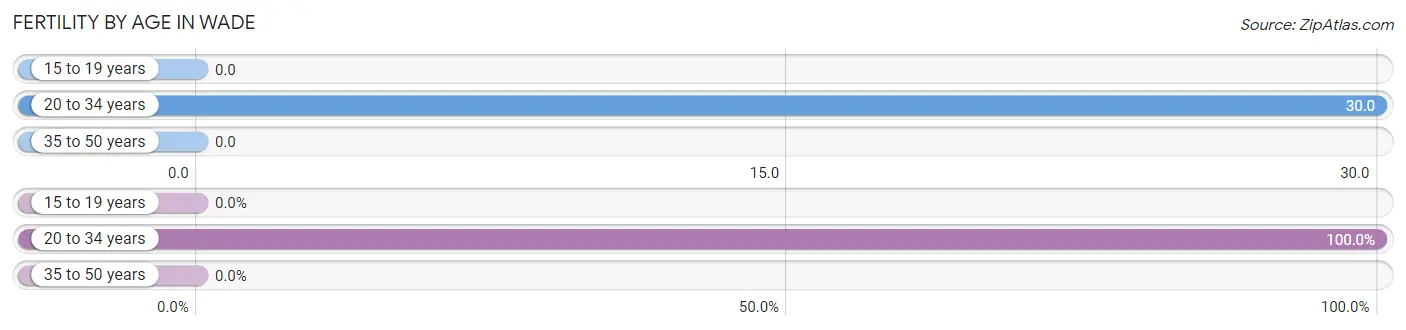
Fertility by Age in Wade
Average fertility rate in Wade is 19.0 births per 1,000 women. Women in the age bracket of 20 to 34 years have the highest fertility rate with 30.0 births per 1,000 women. Women in the age bracket of 20 to 34 years acount for 100.0% of all women with births.
| Age Bracket | Women with Births | Births / 1,000 Women |
| 15 to 19 years | 0 (0.0%) | 0.0 |
| 20 to 34 years | 7 (100.0%) | 30.0 |
| 35 to 50 years | 0 (0.0%) | 0.0 |
| Total | 7 (100.0%) | 19.0 |
Fertility by Age by Marriage Status in Wade
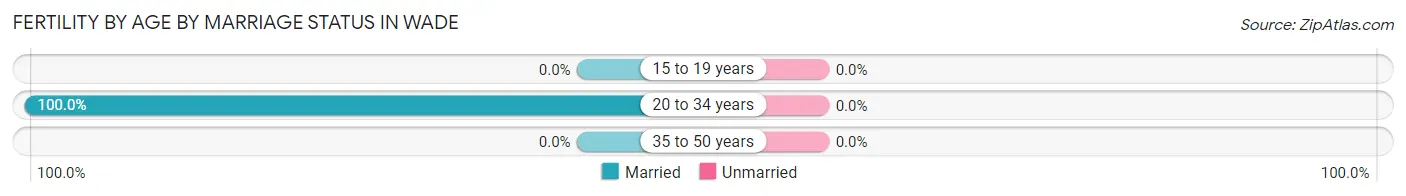
| Age Bracket | Married | Unmarried |
| 15 to 19 years | 0 (0.0%) | 0 (0.0%) |
| 20 to 34 years | 7 (100.0%) | 0 (0.0%) |
| 35 to 50 years | 0 (0.0%) | 0 (0.0%) |
| Total | 7 (100.0%) | 0 (0.0%) |
Fertility by Education in Wade
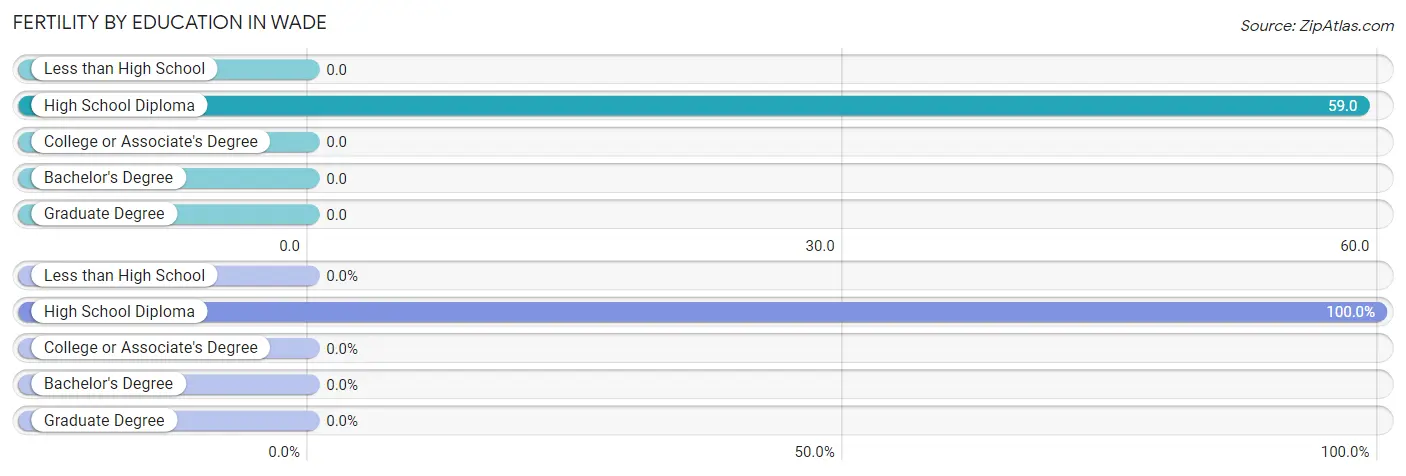
| Educational Attainment | Women with Births | Births / 1,000 Women |
| Less than High School | 0 (0.0%) | 0.0 |
| High School Diploma | 7 (100.0%) | 59.0 |
| College or Associate's Degree | 0 (0.0%) | 0.0 |
| Bachelor's Degree | 0 (0.0%) | 0.0 |
| Graduate Degree | 0 (0.0%) | 0.0 |
| Total | 7 (100.0%) | 19.0 |
Fertility by Education by Marriage Status in Wade
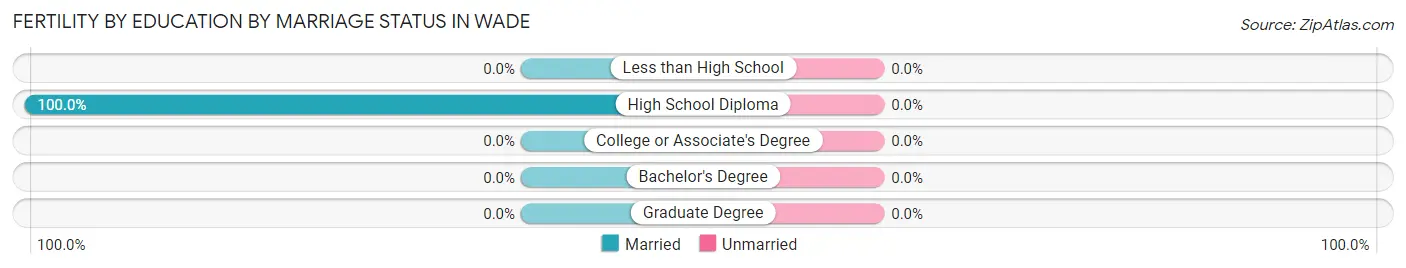
| Educational Attainment | Married | Unmarried |
| Less than High School | 0 (0.0%) | 0 (0.0%) |
| High School Diploma | 7 (100.0%) | 0 (0.0%) |
| College or Associate's Degree | 0 (0.0%) | 0 (0.0%) |
| Bachelor's Degree | 0 (0.0%) | 0 (0.0%) |
| Graduate Degree | 0 (0.0%) | 0 (0.0%) |
| Total | 7 (100.0%) | 0 (0.0%) |
Employment Characteristics in Wade
Employment by Class of Employer in Wade
Among the 261 employed individuals in Wade, private company employees (217 | 83.1%), local government employees (36 | 13.8%), and not-for-profit organizations (8 | 3.1%) make up the most common classes of employment.
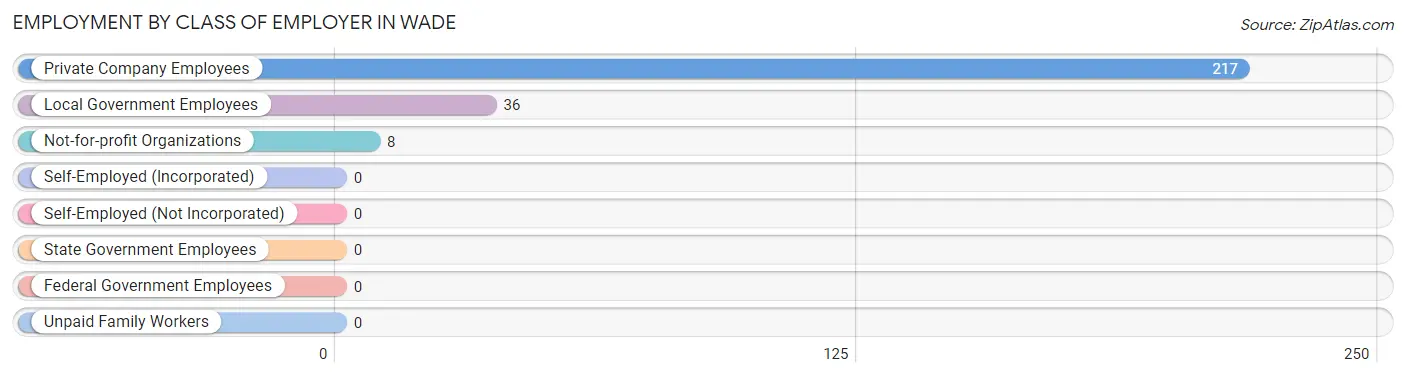
| Employer Class | # Employees | % Employees |
| Private Company Employees | 217 | 83.1% |
| Self-Employed (Incorporated) | 0 | 0.0% |
| Self-Employed (Not Incorporated) | 0 | 0.0% |
| Not-for-profit Organizations | 8 | 3.1% |
| Local Government Employees | 36 | 13.8% |
| State Government Employees | 0 | 0.0% |
| Federal Government Employees | 0 | 0.0% |
| Unpaid Family Workers | 0 | 0.0% |
| Total | 261 | 100.0% |
Employment Status by Age in Wade
According to the labor force statistics for Wade, out of the total population over 16 years of age (1,072), 46.8% or 502 individuals are in the labor force, with 48.0% or 241 of them unemployed. The age group with the highest labor force participation rate is 25 to 29 years, with 100.0% or 79 individuals in the labor force. Within the labor force, the 16 to 19 years age range has the highest percentage of unemployed individuals, with 100.0% or 87 of them being unemployed.
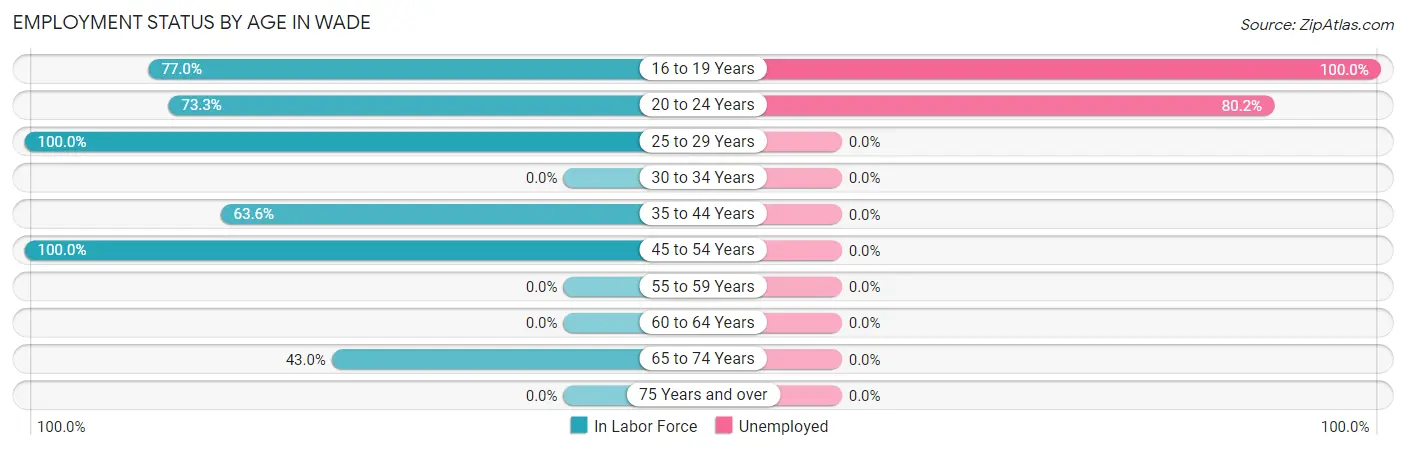
| Age Bracket | In Labor Force | Unemployed |
| 16 to 19 Years | 87 (77.0%) | 87 (100.0%) |
| 20 to 24 Years | 192 (73.3%) | 154 (80.2%) |
| 25 to 29 Years | 79 (100.0%) | 0 (0.0%) |
| 30 to 34 Years | 0 (0.0%) | 0 (0.0%) |
| 35 to 44 Years | 42 (63.6%) | 0 (0.0%) |
| 45 to 54 Years | 65 (100.0%) | 0 (0.0%) |
| 55 to 59 Years | 0 (0.0%) | 0 (0.0%) |
| 60 to 64 Years | 0 (0.0%) | 0 (0.0%) |
| 65 to 74 Years | 37 (43.0%) | 0 (0.0%) |
| 75 Years and over | 0 (0.0%) | 0 (0.0%) |
| Total | 502 (46.8%) | 241 (48.0%) |
Employment Status by Educational Attainment in Wade
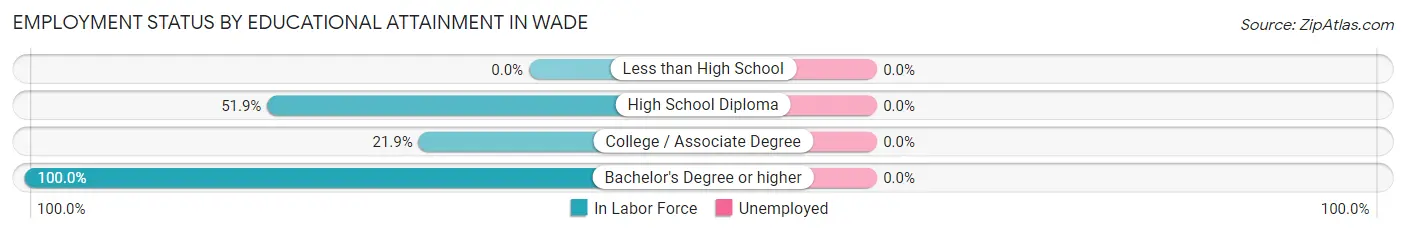
| Educational Attainment | In Labor Force | Unemployed |
| Less than High School | 0 (0.0%) | 0 (0.0%) |
| High School Diploma | 121 (51.9%) | 0 (0.0%) |
| College / Associate Degree | 44 (21.9%) | 0 (0.0%) |
| Bachelor's Degree or higher | 21 (100.0%) | 0 (0.0%) |
| Total | 186 (30.4%) | 0 (0.0%) |
Employment Occupations by Sex in Wade
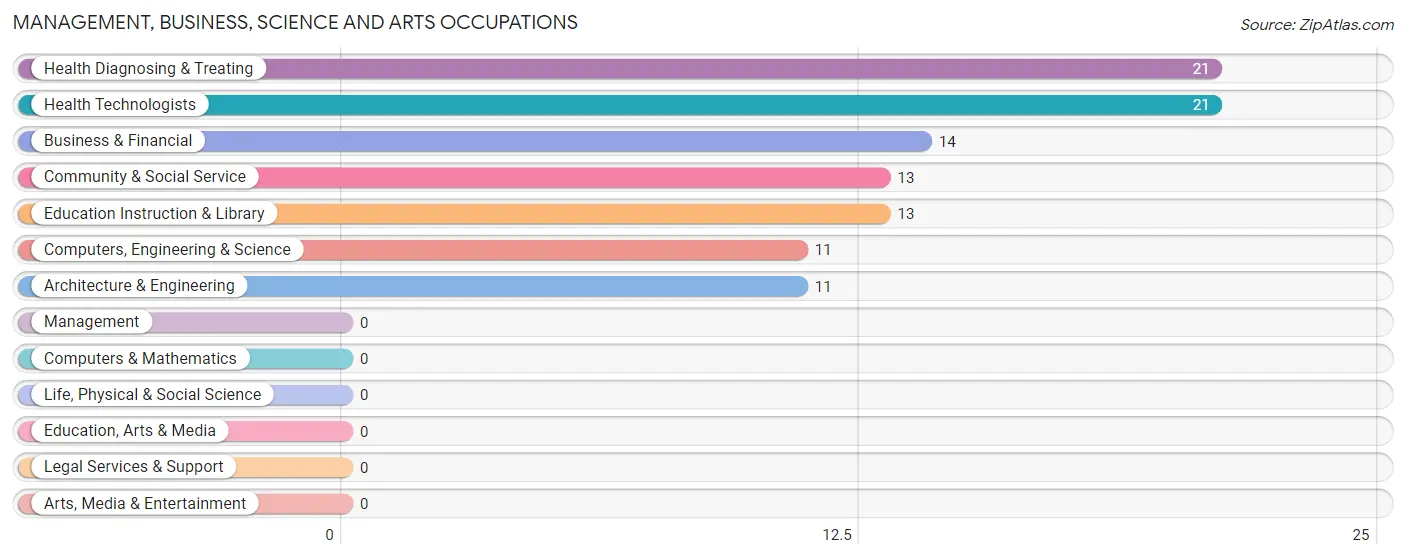
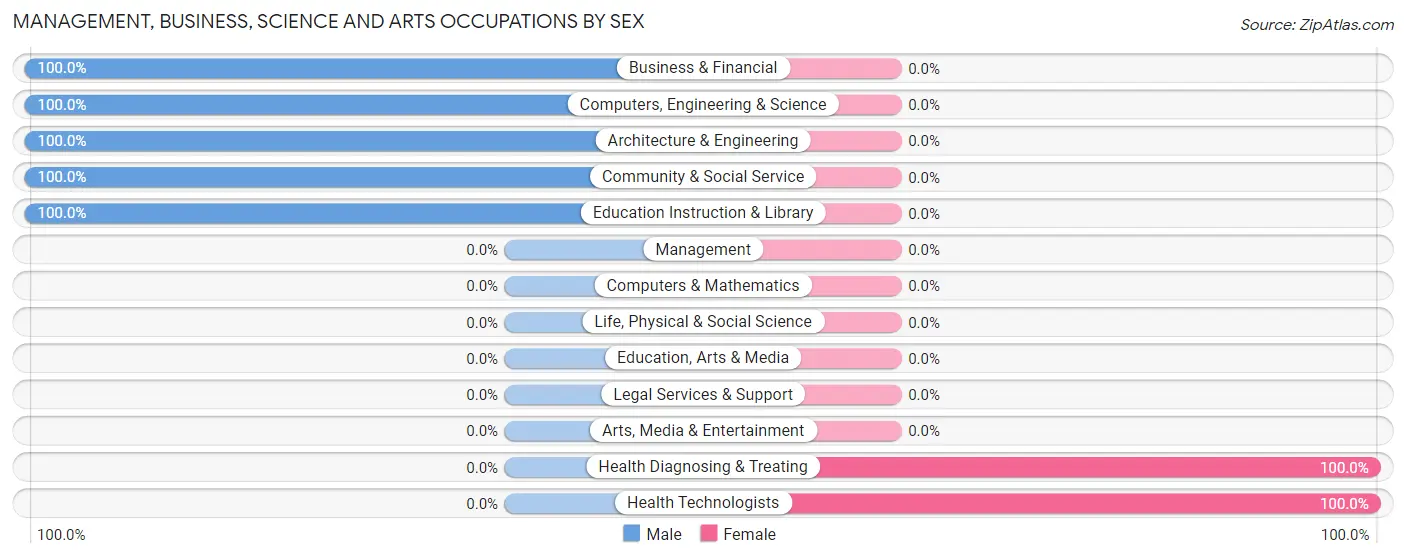
Management, Business, Science and Arts Occupations
The most common Management, Business, Science and Arts occupations in Wade are Health Diagnosing & Treating (21 | 8.1%), Health Technologists (21 | 8.1%), Business & Financial (14 | 5.4%), Community & Social Service (13 | 5.0%), and Education Instruction & Library (13 | 5.0%).
Management, Business, Science and Arts Occupations by Sex
Within the Management, Business, Science and Arts occupations in Wade, the most male-oriented occupations are Business & Financial (100.0%), Computers, Engineering & Science (100.0%), and Architecture & Engineering (100.0%), while the most female-oriented occupations are Health Diagnosing & Treating (100.0%), and Health Technologists (100.0%).
| Occupation | Male | Female |
| Management | 0 (0.0%) | 0 (0.0%) |
| Business & Financial | 14 (100.0%) | 0 (0.0%) |
| Computers, Engineering & Science | 11 (100.0%) | 0 (0.0%) |
| Computers & Mathematics | 0 (0.0%) | 0 (0.0%) |
| Architecture & Engineering | 11 (100.0%) | 0 (0.0%) |
| Life, Physical & Social Science | 0 (0.0%) | 0 (0.0%) |
| Community & Social Service | 13 (100.0%) | 0 (0.0%) |
| Education, Arts & Media | 0 (0.0%) | 0 (0.0%) |
| Legal Services & Support | 0 (0.0%) | 0 (0.0%) |
| Education Instruction & Library | 13 (100.0%) | 0 (0.0%) |
| Arts, Media & Entertainment | 0 (0.0%) | 0 (0.0%) |
| Health Diagnosing & Treating | 0 (0.0%) | 21 (100.0%) |
| Health Technologists | 0 (0.0%) | 21 (100.0%) |
| Total (Category) | 38 (64.4%) | 21 (35.6%) |
| Total (Overall) | 213 (81.6%) | 48 (18.4%) |
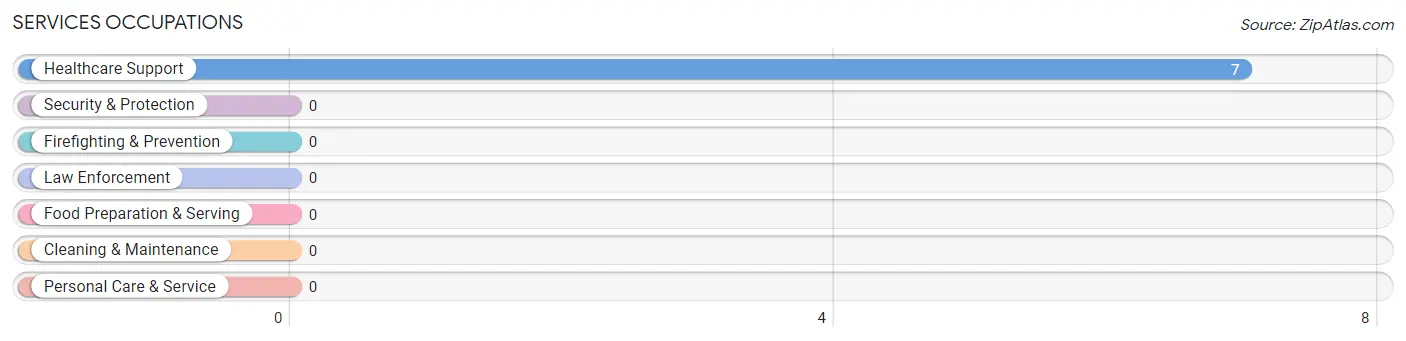
Services Occupations
The most common Services occupations in Wade are , and Healthcare Support (7 | 2.7%).
Services Occupations by Sex
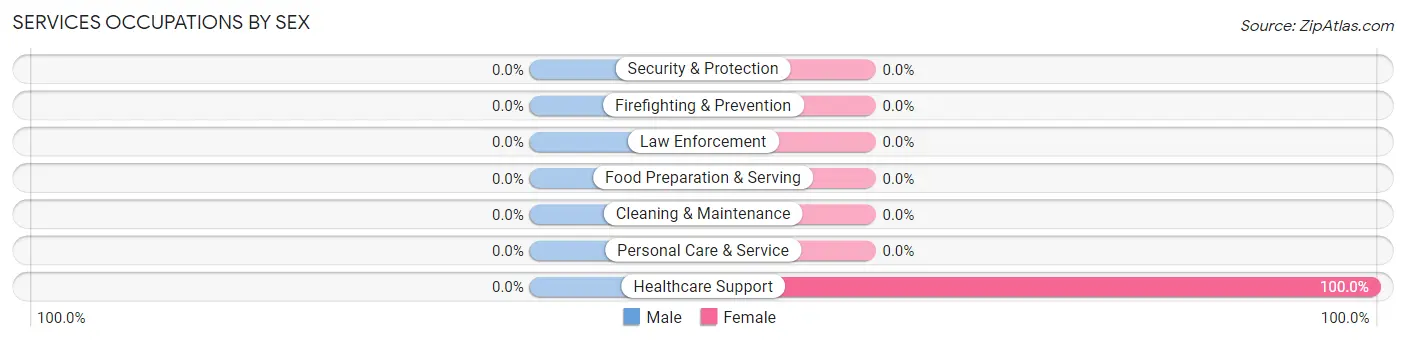
| Occupation | Male | Female |
| Healthcare Support | 0 (0.0%) | 7 (100.0%) |
| Security & Protection | 0 (0.0%) | 0 (0.0%) |
| Firefighting & Prevention | 0 (0.0%) | 0 (0.0%) |
| Law Enforcement | 0 (0.0%) | 0 (0.0%) |
| Food Preparation & Serving | 0 (0.0%) | 0 (0.0%) |
| Cleaning & Maintenance | 0 (0.0%) | 0 (0.0%) |
| Personal Care & Service | 0 (0.0%) | 0 (0.0%) |
| Total (Category) | 0 (0.0%) | 7 (100.0%) |
| Total (Overall) | 213 (81.6%) | 48 (18.4%) |
Sales and Office Occupations
The most common Sales and Office occupations in Wade are Sales & Related (33 | 12.6%), and Office & Administration (12 | 4.6%).

Sales and Office Occupations by Sex

| Occupation | Male | Female |
| Sales & Related | 25 (75.8%) | 8 (24.2%) |
| Office & Administration | 0 (0.0%) | 12 (100.0%) |
| Total (Category) | 25 (55.6%) | 20 (44.4%) |
| Total (Overall) | 213 (81.6%) | 48 (18.4%) |
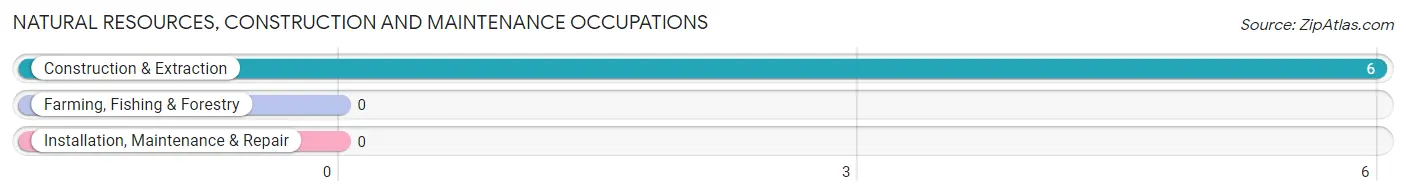
Natural Resources, Construction and Maintenance Occupations
The most common Natural Resources, Construction and Maintenance occupations in Wade are , and Construction & Extraction (6 | 2.3%).
Natural Resources, Construction and Maintenance Occupations by Sex

| Occupation | Male | Female |
| Farming, Fishing & Forestry | 0 (0.0%) | 0 (0.0%) |
| Construction & Extraction | 6 (100.0%) | 0 (0.0%) |
| Installation, Maintenance & Repair | 0 (0.0%) | 0 (0.0%) |
| Total (Category) | 6 (100.0%) | 0 (0.0%) |
| Total (Overall) | 213 (81.6%) | 48 (18.4%) |
Production, Transportation and Moving Occupations
The most common Production, Transportation and Moving occupations in Wade are Production (65 | 24.9%), Transportation (65 | 24.9%), and Material Moving (14 | 5.4%).
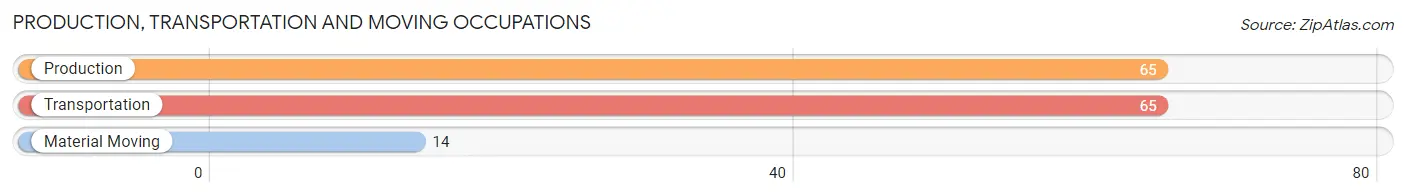
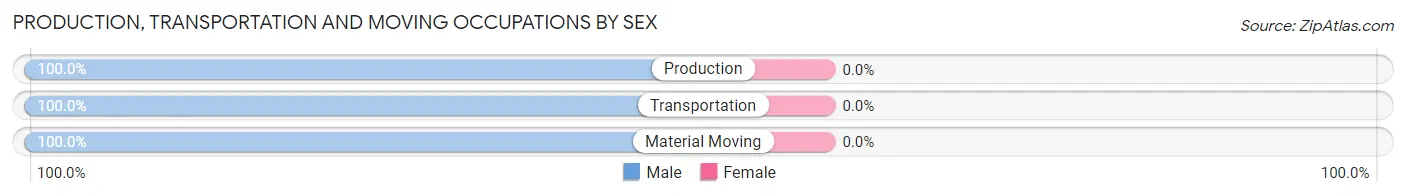
Production, Transportation and Moving Occupations by Sex
| Occupation | Male | Female |
| Production | 65 (100.0%) | 0 (0.0%) |
| Transportation | 65 (100.0%) | 0 (0.0%) |
| Material Moving | 14 (100.0%) | 0 (0.0%) |
| Total (Category) | 144 (100.0%) | 0 (0.0%) |
| Total (Overall) | 213 (81.6%) | 48 (18.4%) |
Employment Industries by Sex in Wade
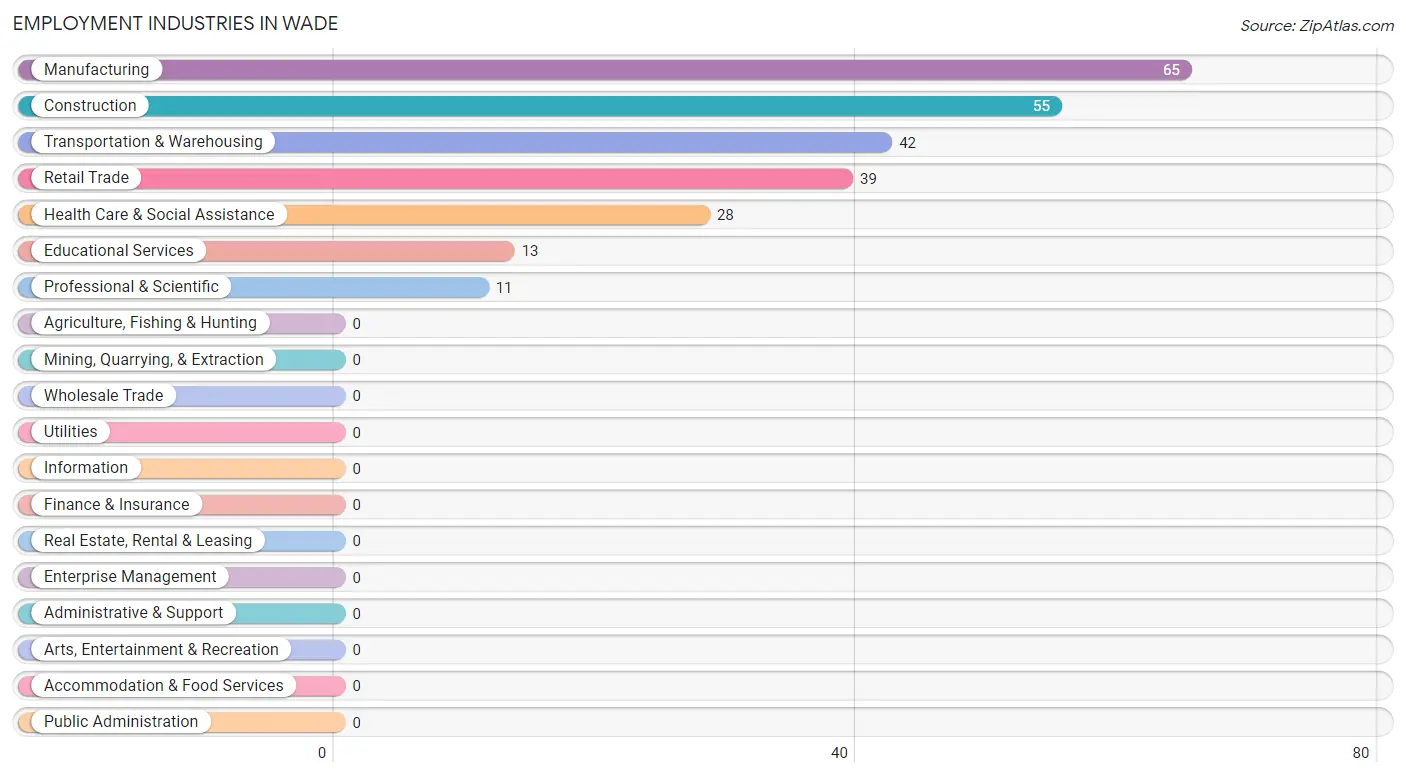
Employment Industries in Wade
The major employment industries in Wade include Manufacturing (65 | 24.9%), Construction (55 | 21.1%), Transportation & Warehousing (42 | 16.1%), Retail Trade (39 | 14.9%), and Health Care & Social Assistance (28 | 10.7%).
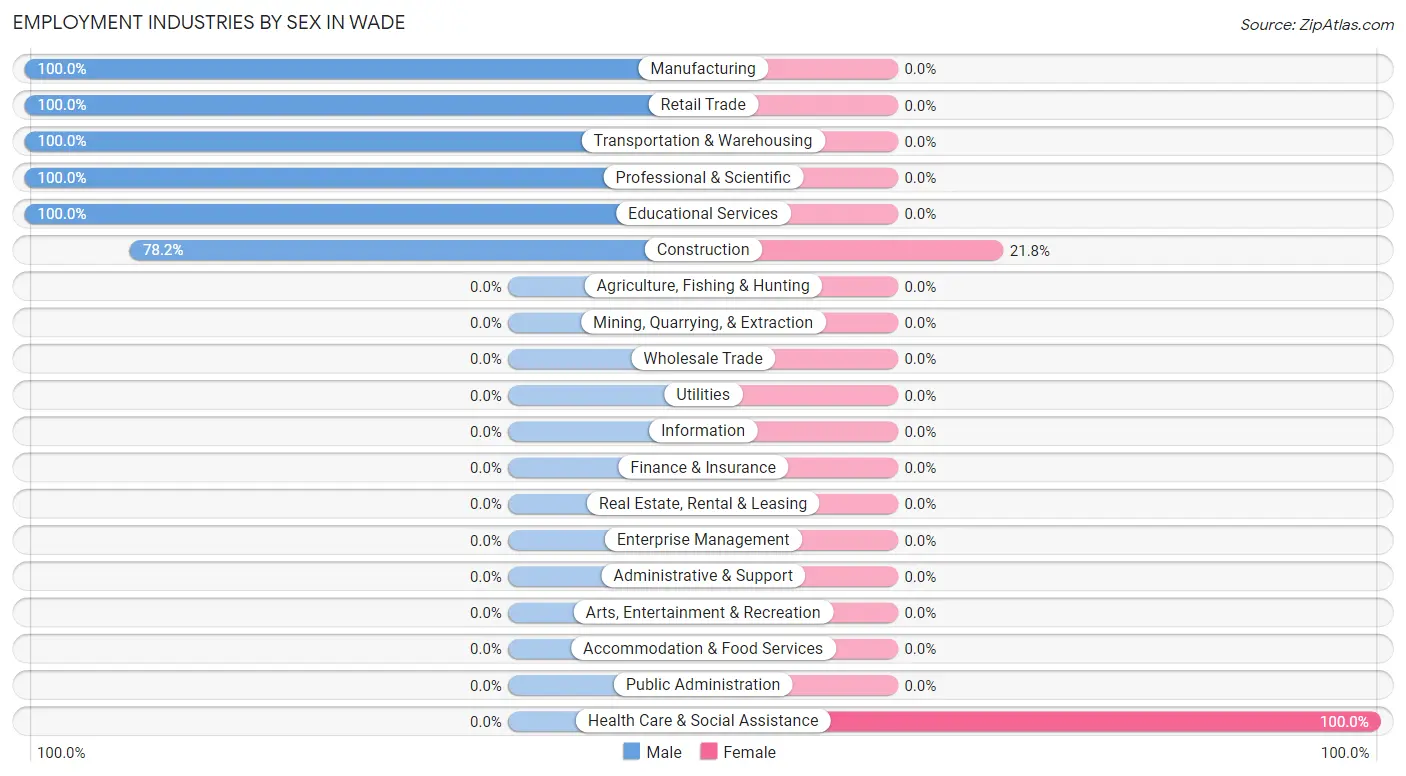
Employment Industries by Sex in Wade
The Wade industries that see more men than women are Manufacturing (100.0%), Retail Trade (100.0%), and Transportation & Warehousing (100.0%), whereas the industries that tend to have a higher number of women are Health Care & Social Assistance (100.0%), and Construction (21.8%).
| Industry | Male | Female |
| Agriculture, Fishing & Hunting | 0 (0.0%) | 0 (0.0%) |
| Mining, Quarrying, & Extraction | 0 (0.0%) | 0 (0.0%) |
| Construction | 43 (78.2%) | 12 (21.8%) |
| Manufacturing | 65 (100.0%) | 0 (0.0%) |
| Wholesale Trade | 0 (0.0%) | 0 (0.0%) |
| Retail Trade | 39 (100.0%) | 0 (0.0%) |
| Transportation & Warehousing | 42 (100.0%) | 0 (0.0%) |
| Utilities | 0 (0.0%) | 0 (0.0%) |
| Information | 0 (0.0%) | 0 (0.0%) |
| Finance & Insurance | 0 (0.0%) | 0 (0.0%) |
| Real Estate, Rental & Leasing | 0 (0.0%) | 0 (0.0%) |
| Professional & Scientific | 11 (100.0%) | 0 (0.0%) |
| Enterprise Management | 0 (0.0%) | 0 (0.0%) |
| Administrative & Support | 0 (0.0%) | 0 (0.0%) |
| Educational Services | 13 (100.0%) | 0 (0.0%) |
| Health Care & Social Assistance | 0 (0.0%) | 28 (100.0%) |
| Arts, Entertainment & Recreation | 0 (0.0%) | 0 (0.0%) |
| Accommodation & Food Services | 0 (0.0%) | 0 (0.0%) |
| Public Administration | 0 (0.0%) | 0 (0.0%) |
| Total | 213 (81.6%) | 48 (18.4%) |
Education in Wade
School Enrollment in Wade
The most common levels of schooling among the 185 students in Wade are elementary school (111 | 60.0%), high school (49 | 26.5%), and college / undergraduate (25 | 13.5%).
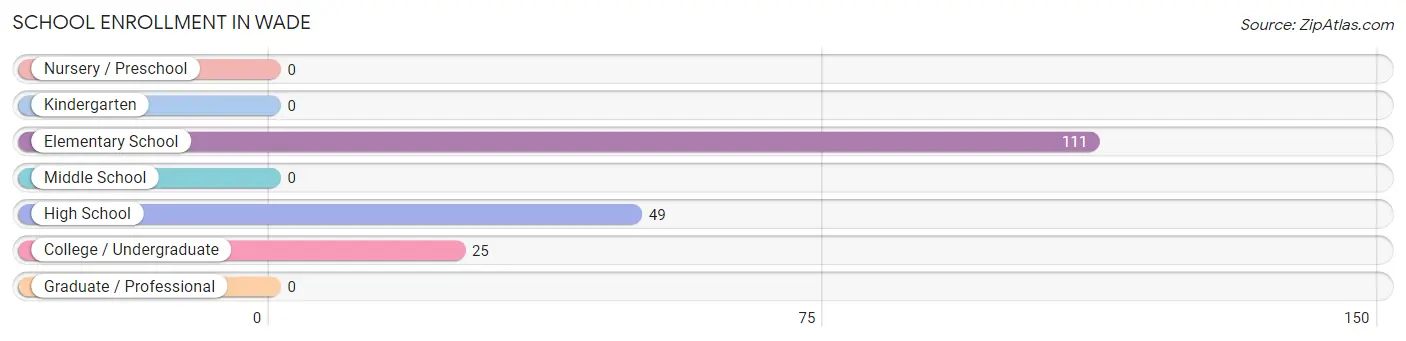
| School Level | # Students | % Students |
| Nursery / Preschool | 0 | 0.0% |
| Kindergarten | 0 | 0.0% |
| Elementary School | 111 | 60.0% |
| Middle School | 0 | 0.0% |
| High School | 49 | 26.5% |
| College / Undergraduate | 25 | 13.5% |
| Graduate / Professional | 0 | 0.0% |
| Total | 185 | 100.0% |
School Enrollment by Age by Funding Source in Wade
Out of a total of 185 students who are enrolled in schools in Wade, 81 (43.8%) attend a private institution, while the remaining 104 (56.2%) are enrolled in public schools. The age group of 15 to 17 year olds has the highest likelihood of being enrolled in private schools, with 23 (100.0% in the age bracket) enrolled. Conversely, the age group of 20 to 24 year olds has the lowest likelihood of being enrolled in a private school, with 25 (100.0% in the age bracket) attending a public institution.
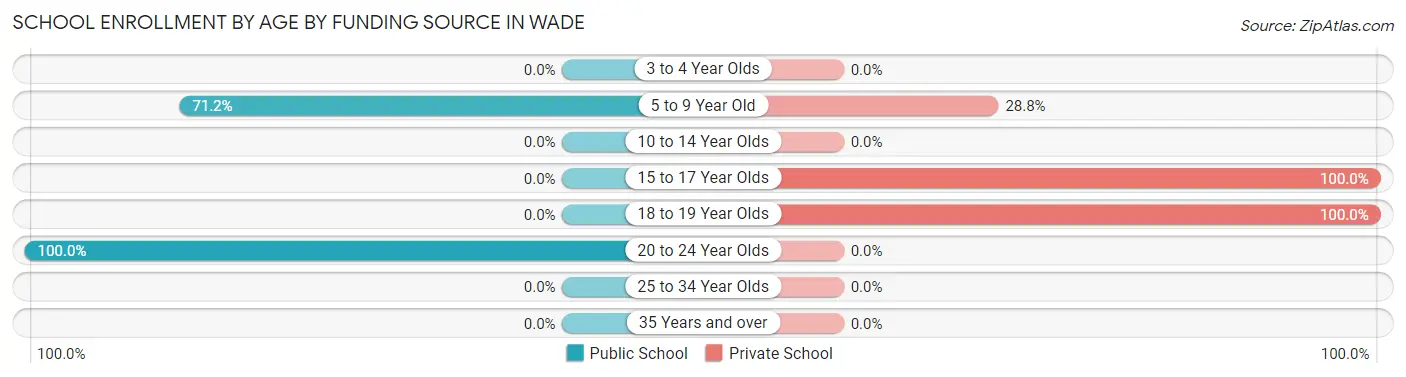
| Age Bracket | Public School | Private School |
| 3 to 4 Year Olds | 0 (0.0%) | 0 (0.0%) |
| 5 to 9 Year Old | 79 (71.2%) | 32 (28.8%) |
| 10 to 14 Year Olds | 0 (0.0%) | 0 (0.0%) |
| 15 to 17 Year Olds | 0 (0.0%) | 23 (100.0%) |
| 18 to 19 Year Olds | 0 (0.0%) | 26 (100.0%) |
| 20 to 24 Year Olds | 25 (100.0%) | 0 (0.0%) |
| 25 to 34 Year Olds | 0 (0.0%) | 0 (0.0%) |
| 35 Years and over | 0 (0.0%) | 0 (0.0%) |
| Total | 104 (56.2%) | 81 (43.8%) |
Educational Attainment by Field of Study in Wade
Education (13 | 61.9%), and business (8 | 38.1%) are the most common fields of study among 21 individuals in Wade who have obtained a bachelor's degree or higher.
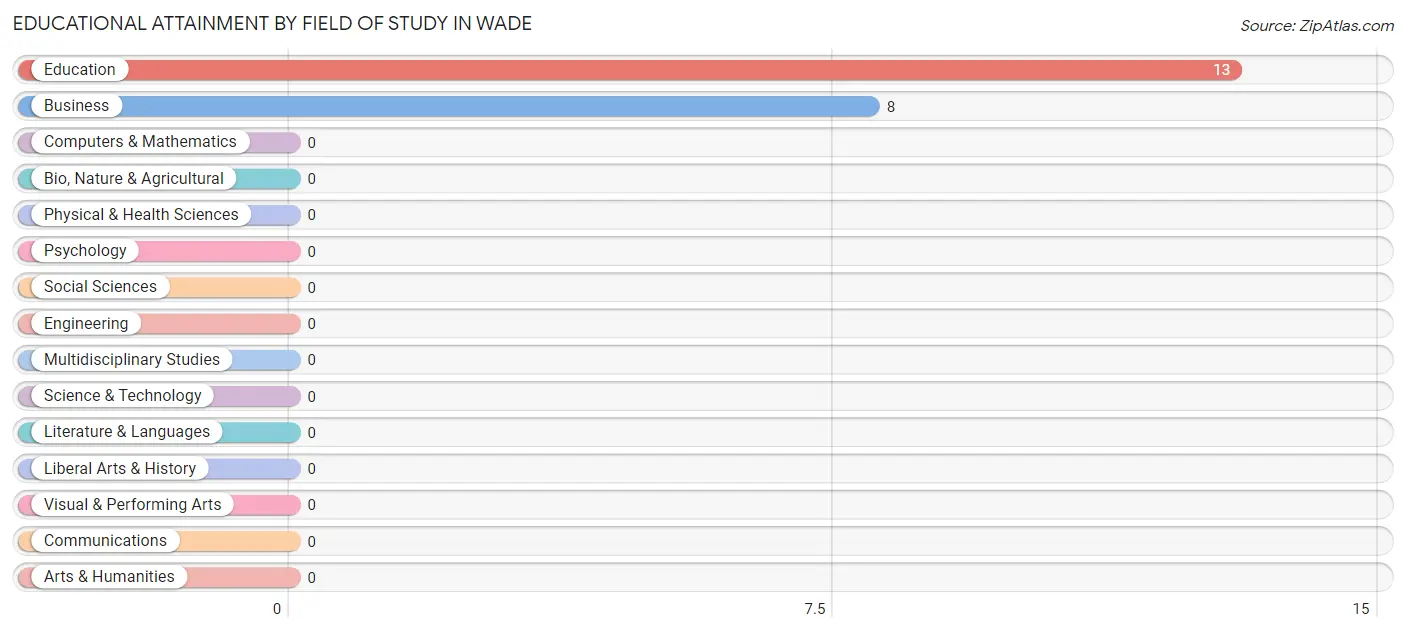
| Field of Study | # Graduates | % Graduates |
| Computers & Mathematics | 0 | 0.0% |
| Bio, Nature & Agricultural | 0 | 0.0% |
| Physical & Health Sciences | 0 | 0.0% |
| Psychology | 0 | 0.0% |
| Social Sciences | 0 | 0.0% |
| Engineering | 0 | 0.0% |
| Multidisciplinary Studies | 0 | 0.0% |
| Science & Technology | 0 | 0.0% |
| Business | 8 | 38.1% |
| Education | 13 | 61.9% |
| Literature & Languages | 0 | 0.0% |
| Liberal Arts & History | 0 | 0.0% |
| Visual & Performing Arts | 0 | 0.0% |
| Communications | 0 | 0.0% |
| Arts & Humanities | 0 | 0.0% |
| Total | 21 | 100.0% |
Transportation & Commute in Wade
Vehicle Availability by Sex in Wade
The most prevalent vehicle ownership categories in Wade are males with 2 vehicles (136, accounting for 63.8%) and females with 2 vehicles (7, making up 283.3%).
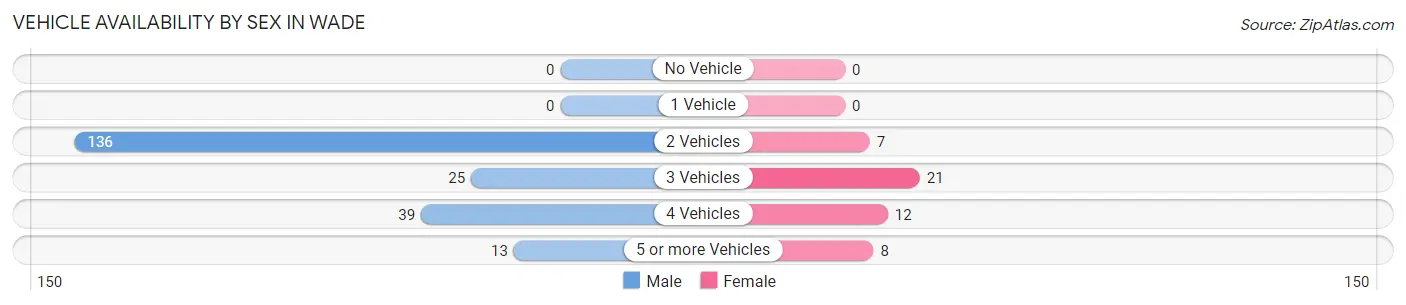
| Vehicles Available | Male | Female |
| No Vehicle | 0 (0.0%) | 0 (0.0%) |
| 1 Vehicle | 0 (0.0%) | 0 (0.0%) |
| 2 Vehicles | 136 (63.8%) | 7 (14.6%) |
| 3 Vehicles | 25 (11.7%) | 21 (43.8%) |
| 4 Vehicles | 39 (18.3%) | 12 (25.0%) |
| 5 or more Vehicles | 13 (6.1%) | 8 (16.7%) |
| Total | 213 (100.0%) | 48 (100.0%) |
Commute Time in Wade
The most frequently occuring commute durations in Wade are 25 to 29 minutes (76 commuters, 29.1%), 30 to 34 minutes (59 commuters, 22.6%), and 90 or more minutes (55 commuters, 21.1%).
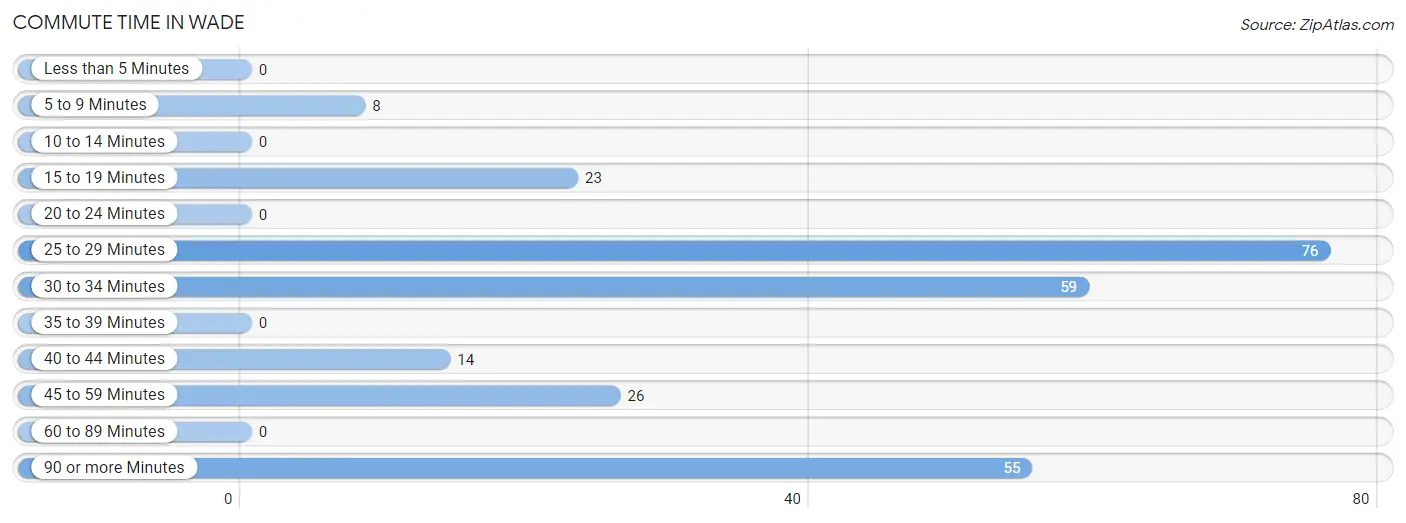
| Commute Time | # Commuters | % Commuters |
| Less than 5 Minutes | 0 | 0.0% |
| 5 to 9 Minutes | 8 | 3.1% |
| 10 to 14 Minutes | 0 | 0.0% |
| 15 to 19 Minutes | 23 | 8.8% |
| 20 to 24 Minutes | 0 | 0.0% |
| 25 to 29 Minutes | 76 | 29.1% |
| 30 to 34 Minutes | 59 | 22.6% |
| 35 to 39 Minutes | 0 | 0.0% |
| 40 to 44 Minutes | 14 | 5.4% |
| 45 to 59 Minutes | 26 | 10.0% |
| 60 to 89 Minutes | 0 | 0.0% |
| 90 or more Minutes | 55 | 21.1% |
Commute Time by Sex in Wade
The most common commute times in Wade are 25 to 29 minutes (76 commuters, 35.7%) for males and 30 to 34 minutes (28 commuters, 58.3%) for females.
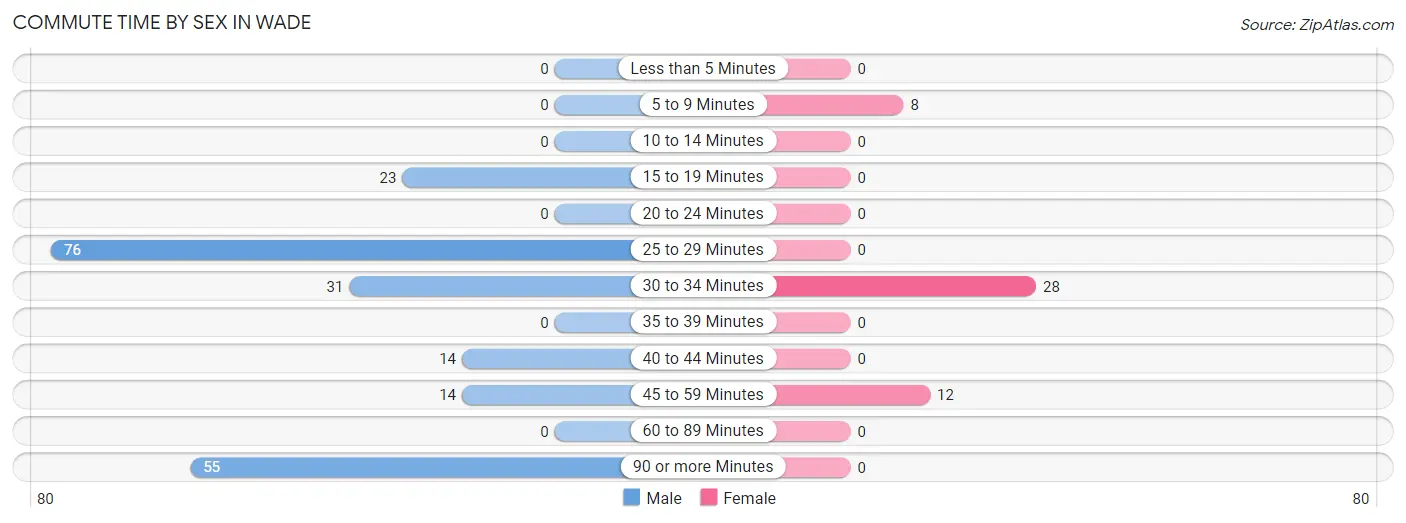
| Commute Time | Male | Female |
| Less than 5 Minutes | 0 (0.0%) | 0 (0.0%) |
| 5 to 9 Minutes | 0 (0.0%) | 8 (16.7%) |
| 10 to 14 Minutes | 0 (0.0%) | 0 (0.0%) |
| 15 to 19 Minutes | 23 (10.8%) | 0 (0.0%) |
| 20 to 24 Minutes | 0 (0.0%) | 0 (0.0%) |
| 25 to 29 Minutes | 76 (35.7%) | 0 (0.0%) |
| 30 to 34 Minutes | 31 (14.5%) | 28 (58.3%) |
| 35 to 39 Minutes | 0 (0.0%) | 0 (0.0%) |
| 40 to 44 Minutes | 14 (6.6%) | 0 (0.0%) |
| 45 to 59 Minutes | 14 (6.6%) | 12 (25.0%) |
| 60 to 89 Minutes | 0 (0.0%) | 0 (0.0%) |
| 90 or more Minutes | 55 (25.8%) | 0 (0.0%) |
Time of Departure to Work by Sex in Wade
The most frequent times of departure to work in Wade are 4:00 PM to 11:59 PM (65, 30.5%) for males and 5:30 AM to 5:59 AM (21, 43.8%) for females.
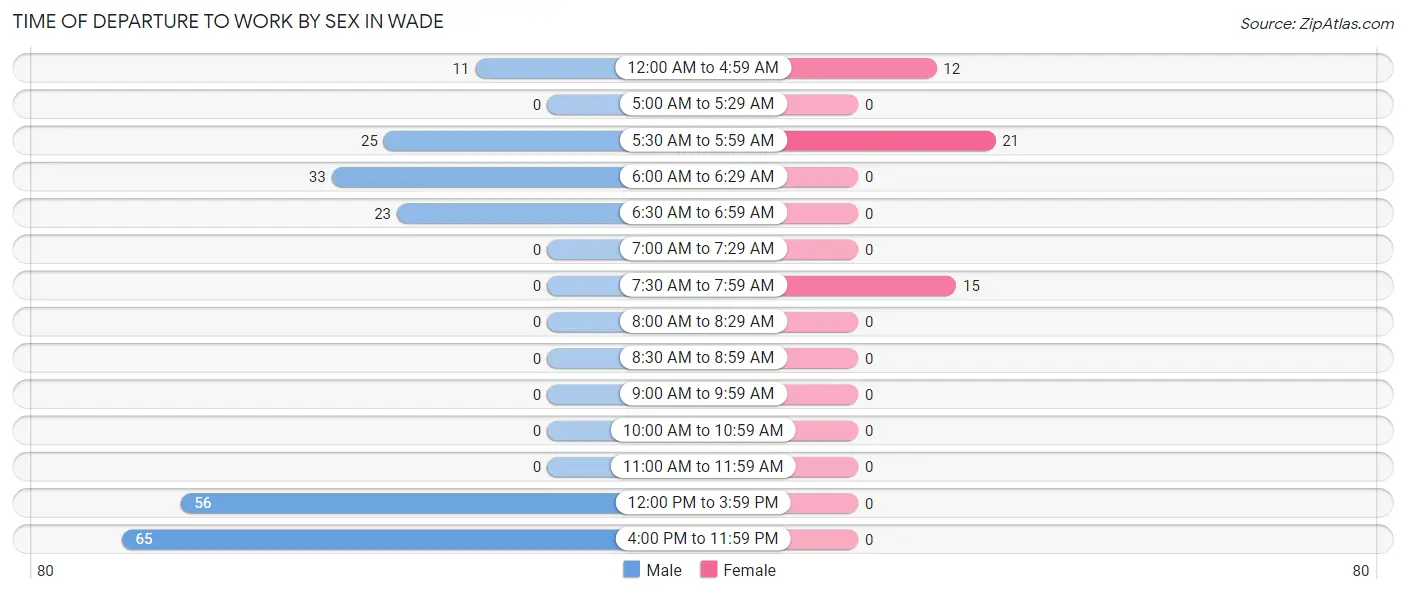
| Time of Departure | Male | Female |
| 12:00 AM to 4:59 AM | 11 (5.2%) | 12 (25.0%) |
| 5:00 AM to 5:29 AM | 0 (0.0%) | 0 (0.0%) |
| 5:30 AM to 5:59 AM | 25 (11.7%) | 21 (43.8%) |
| 6:00 AM to 6:29 AM | 33 (15.5%) | 0 (0.0%) |
| 6:30 AM to 6:59 AM | 23 (10.8%) | 0 (0.0%) |
| 7:00 AM to 7:29 AM | 0 (0.0%) | 0 (0.0%) |
| 7:30 AM to 7:59 AM | 0 (0.0%) | 15 (31.2%) |
| 8:00 AM to 8:29 AM | 0 (0.0%) | 0 (0.0%) |
| 8:30 AM to 8:59 AM | 0 (0.0%) | 0 (0.0%) |
| 9:00 AM to 9:59 AM | 0 (0.0%) | 0 (0.0%) |
| 10:00 AM to 10:59 AM | 0 (0.0%) | 0 (0.0%) |
| 11:00 AM to 11:59 AM | 0 (0.0%) | 0 (0.0%) |
| 12:00 PM to 3:59 PM | 56 (26.3%) | 0 (0.0%) |
| 4:00 PM to 11:59 PM | 65 (30.5%) | 0 (0.0%) |
| Total | 213 (100.0%) | 48 (100.0%) |
Housing Occupancy in Wade
Occupancy by Ownership in Wade
Of the total 456 dwellings in Wade, owner-occupied units account for 266 (58.3%), while renter-occupied units make up 190 (41.7%).
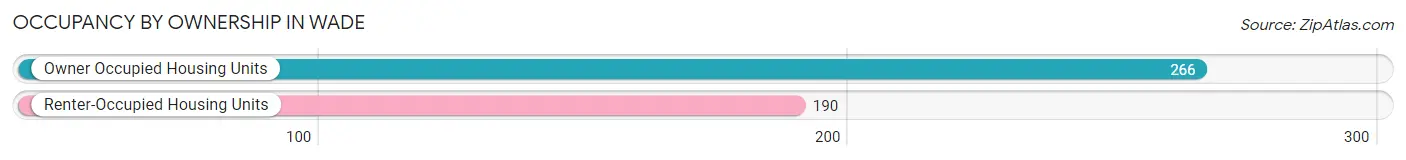
| Occupancy | # Housing Units | % Housing Units |
| Owner Occupied Housing Units | 266 | 58.3% |
| Renter-Occupied Housing Units | 190 | 41.7% |
| Total Occupied Housing Units | 456 | 100.0% |
Occupancy by Household Size in Wade
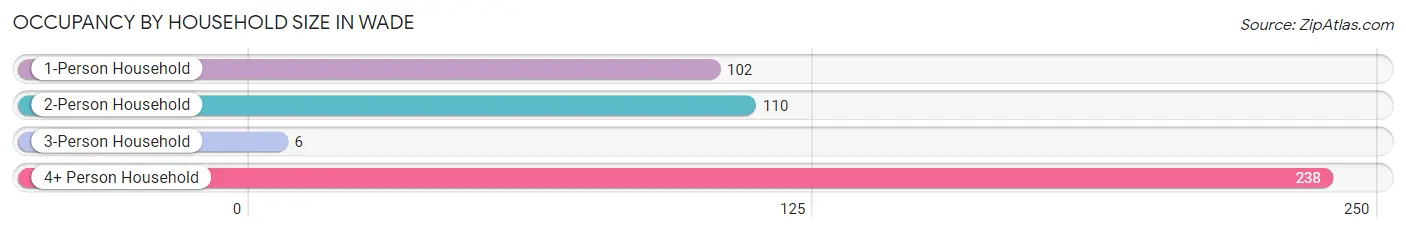
| Household Size | # Housing Units | % Housing Units |
| 1-Person Household | 102 | 22.4% |
| 2-Person Household | 110 | 24.1% |
| 3-Person Household | 6 | 1.3% |
| 4+ Person Household | 238 | 52.2% |
| Total Housing Units | 456 | 100.0% |
Occupancy by Ownership by Household Size in Wade
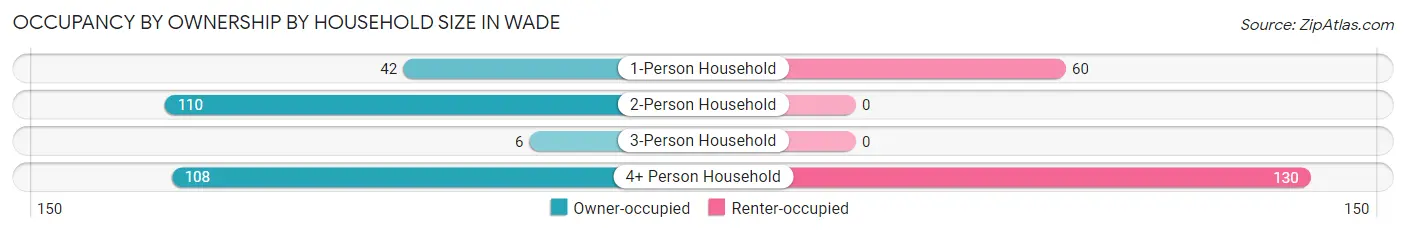
| Household Size | Owner-occupied | Renter-occupied |
| 1-Person Household | 42 (41.2%) | 60 (58.8%) |
| 2-Person Household | 110 (100.0%) | 0 (0.0%) |
| 3-Person Household | 6 (100.0%) | 0 (0.0%) |
| 4+ Person Household | 108 (45.4%) | 130 (54.6%) |
| Total Housing Units | 266 (58.3%) | 190 (41.7%) |
Occupancy by Educational Attainment in Wade
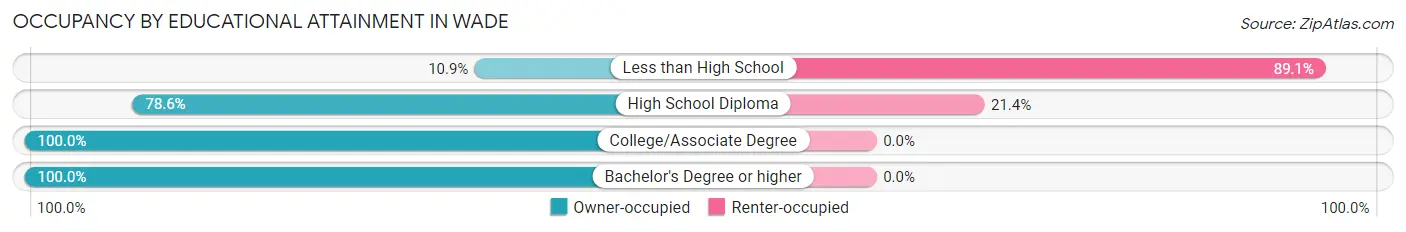
| Household Size | Owner-occupied | Renter-occupied |
| Less than High School | 19 (10.9%) | 156 (89.1%) |
| High School Diploma | 125 (78.6%) | 34 (21.4%) |
| College/Associate Degree | 114 (100.0%) | 0 (0.0%) |
| Bachelor's Degree or higher | 8 (100.0%) | 0 (0.0%) |
Occupancy by Age of Householder in Wade
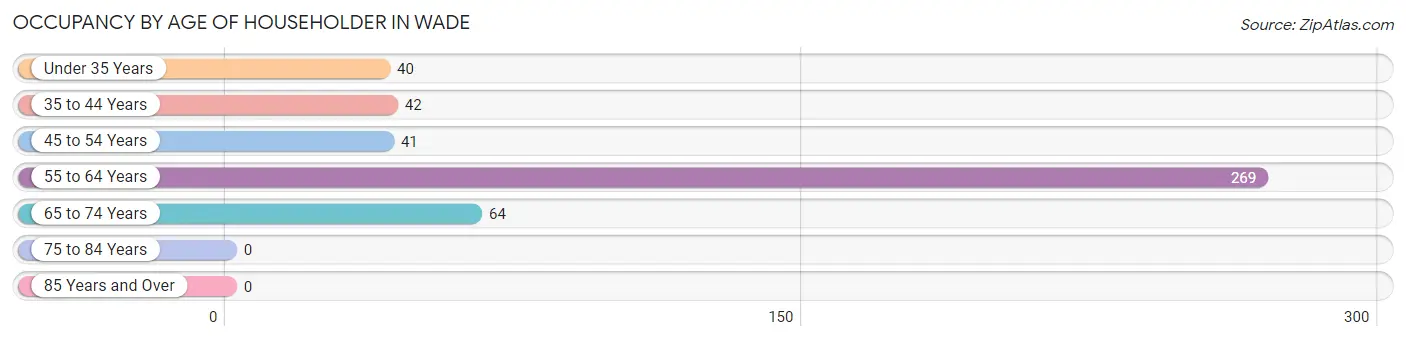
| Age Bracket | # Households | % Households |
| Under 35 Years | 40 | 8.8% |
| 35 to 44 Years | 42 | 9.2% |
| 45 to 54 Years | 41 | 9.0% |
| 55 to 64 Years | 269 | 59.0% |
| 65 to 74 Years | 64 | 14.0% |
| 75 to 84 Years | 0 | 0.0% |
| 85 Years and Over | 0 | 0.0% |
| Total | 456 | 100.0% |
Housing Finances in Wade
Median Income by Occupancy in Wade
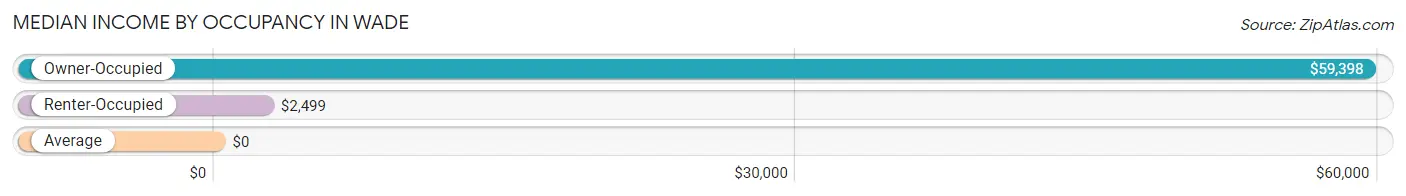
| Occupancy Type | # Households | Median Income |
| Owner-Occupied | 266 (58.3%) | $59,398 |
| Renter-Occupied | 190 (41.7%) | $2,499 |
| Average | 456 (100.0%) | $0 |
Occupancy by Householder Income Bracket in Wade
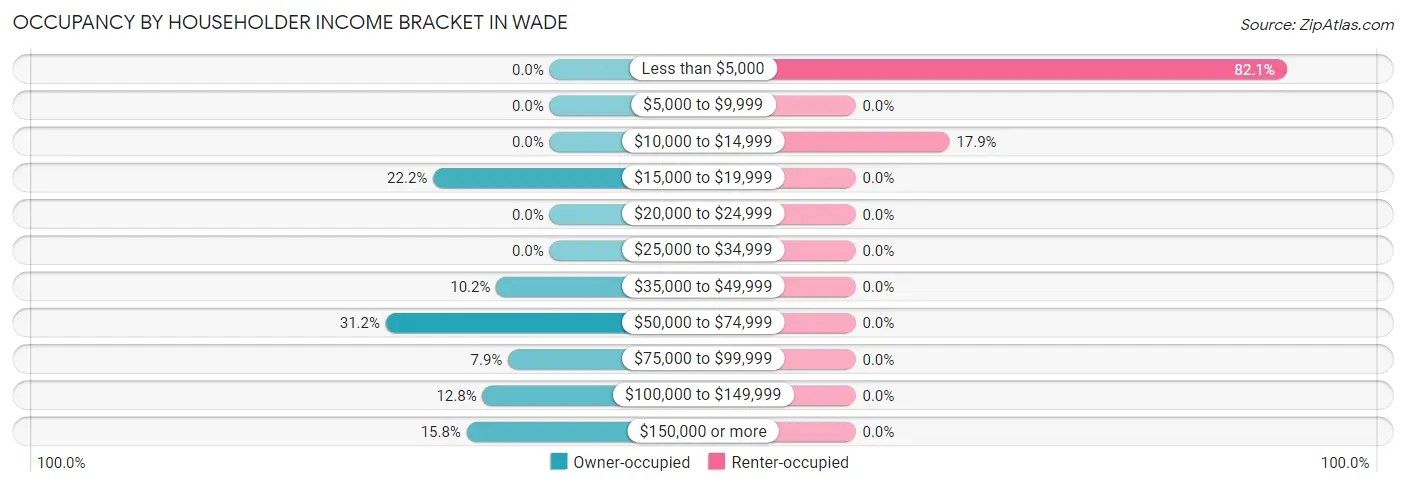
| Income Bracket | Owner-occupied | Renter-occupied |
| Less than $5,000 | 0 (0.0%) | 156 (82.1%) |
| $5,000 to $9,999 | 0 (0.0%) | 0 (0.0%) |
| $10,000 to $14,999 | 0 (0.0%) | 34 (17.9%) |
| $15,000 to $19,999 | 59 (22.2%) | 0 (0.0%) |
| $20,000 to $24,999 | 0 (0.0%) | 0 (0.0%) |
| $25,000 to $34,999 | 0 (0.0%) | 0 (0.0%) |
| $35,000 to $49,999 | 27 (10.2%) | 0 (0.0%) |
| $50,000 to $74,999 | 83 (31.2%) | 0 (0.0%) |
| $75,000 to $99,999 | 21 (7.9%) | 0 (0.0%) |
| $100,000 to $149,999 | 34 (12.8%) | 0 (0.0%) |
| $150,000 or more | 42 (15.8%) | 0 (0.0%) |
| Total | 266 (100.0%) | 190 (100.0%) |
Monthly Housing Cost Tiers in Wade
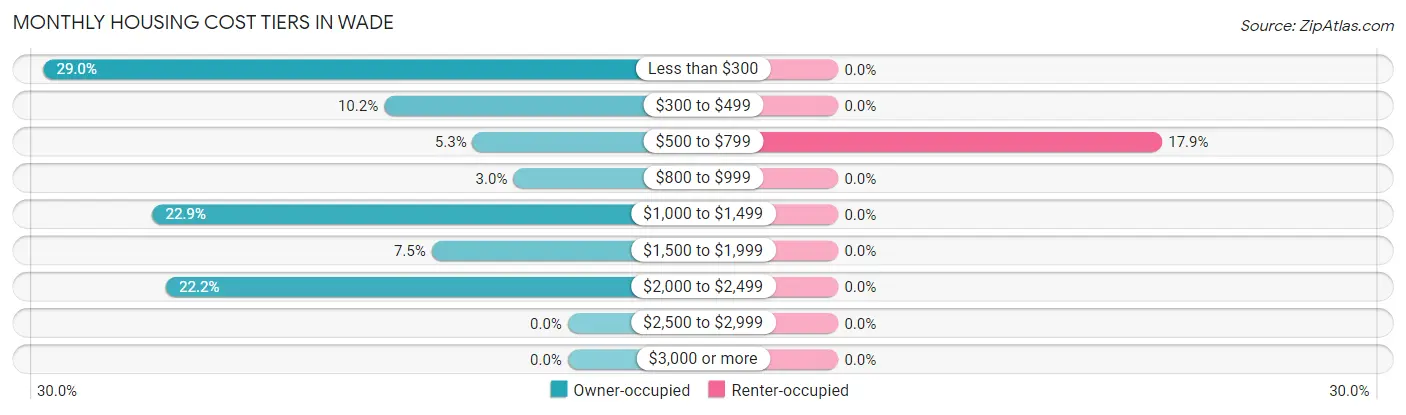
| Monthly Cost | Owner-occupied | Renter-occupied |
| Less than $300 | 77 (28.9%) | 0 (0.0%) |
| $300 to $499 | 27 (10.2%) | 0 (0.0%) |
| $500 to $799 | 14 (5.3%) | 34 (17.9%) |
| $800 to $999 | 8 (3.0%) | 0 (0.0%) |
| $1,000 to $1,499 | 61 (22.9%) | 0 (0.0%) |
| $1,500 to $1,999 | 20 (7.5%) | 0 (0.0%) |
| $2,000 to $2,499 | 59 (22.2%) | 0 (0.0%) |
| $2,500 to $2,999 | 0 (0.0%) | 0 (0.0%) |
| $3,000 or more | 0 (0.0%) | 0 (0.0%) |
| Total | 266 (100.0%) | 190 (100.0%) |
Physical Housing Characteristics in Wade
Housing Structures in Wade
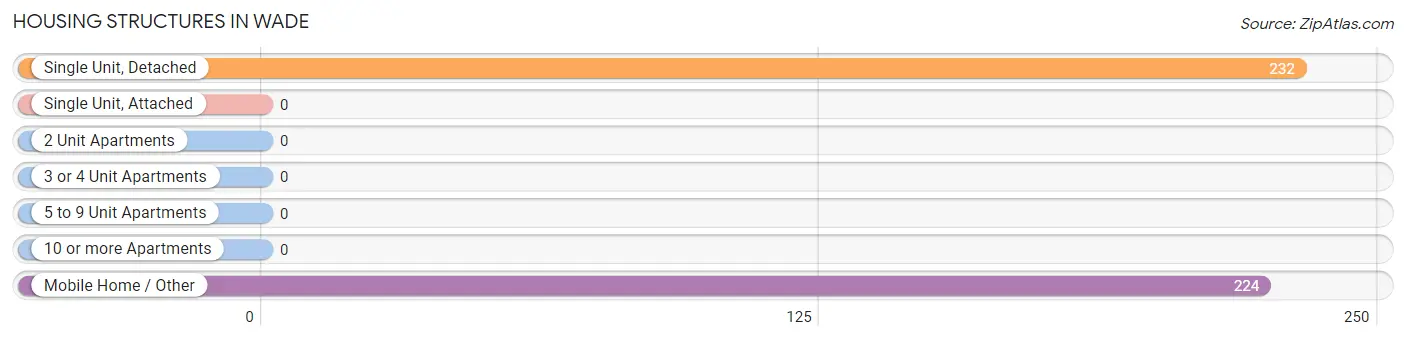
| Structure Type | # Housing Units | % Housing Units |
| Single Unit, Detached | 232 | 50.9% |
| Single Unit, Attached | 0 | 0.0% |
| 2 Unit Apartments | 0 | 0.0% |
| 3 or 4 Unit Apartments | 0 | 0.0% |
| 5 to 9 Unit Apartments | 0 | 0.0% |
| 10 or more Apartments | 0 | 0.0% |
| Mobile Home / Other | 224 | 49.1% |
| Total | 456 | 100.0% |
Housing Structures by Occupancy in Wade
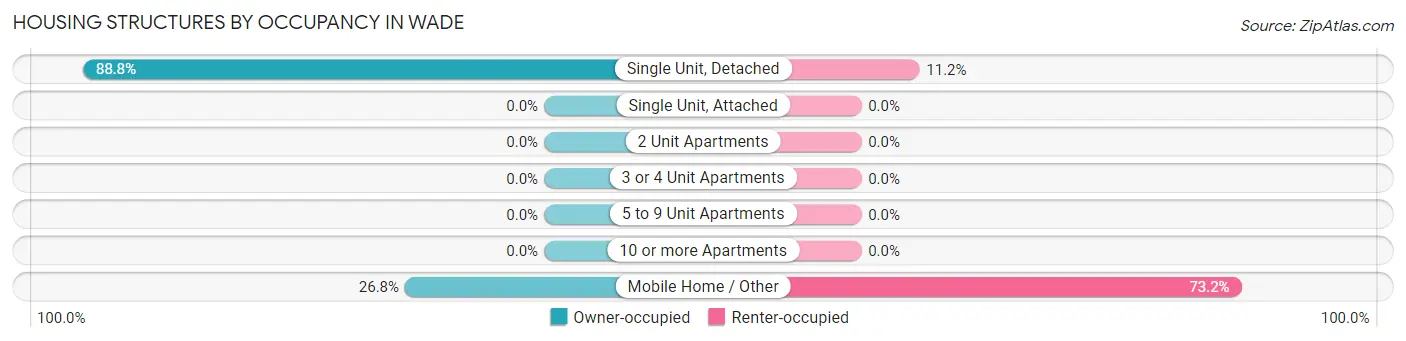
| Structure Type | Owner-occupied | Renter-occupied |
| Single Unit, Detached | 206 (88.8%) | 26 (11.2%) |
| Single Unit, Attached | 0 (0.0%) | 0 (0.0%) |
| 2 Unit Apartments | 0 (0.0%) | 0 (0.0%) |
| 3 or 4 Unit Apartments | 0 (0.0%) | 0 (0.0%) |
| 5 to 9 Unit Apartments | 0 (0.0%) | 0 (0.0%) |
| 10 or more Apartments | 0 (0.0%) | 0 (0.0%) |
| Mobile Home / Other | 60 (26.8%) | 164 (73.2%) |
| Total | 266 (58.3%) | 190 (41.7%) |
Housing Structures by Number of Rooms in Wade
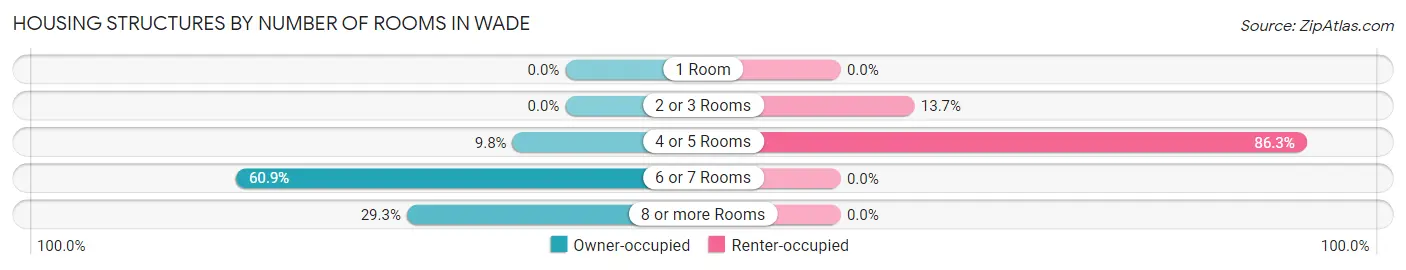
| Number of Rooms | Owner-occupied | Renter-occupied |
| 1 Room | 0 (0.0%) | 0 (0.0%) |
| 2 or 3 Rooms | 0 (0.0%) | 26 (13.7%) |
| 4 or 5 Rooms | 26 (9.8%) | 164 (86.3%) |
| 6 or 7 Rooms | 162 (60.9%) | 0 (0.0%) |
| 8 or more Rooms | 78 (29.3%) | 0 (0.0%) |
| Total | 266 (100.0%) | 190 (100.0%) |
Housing Structure by Heating Type in Wade
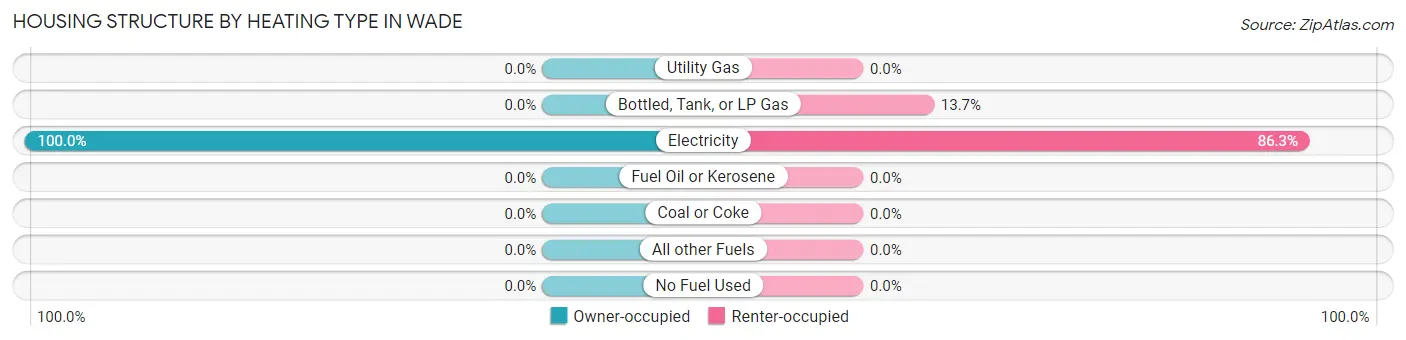
| Heating Type | Owner-occupied | Renter-occupied |
| Utility Gas | 0 (0.0%) | 0 (0.0%) |
| Bottled, Tank, or LP Gas | 0 (0.0%) | 26 (13.7%) |
| Electricity | 266 (100.0%) | 164 (86.3%) |
| Fuel Oil or Kerosene | 0 (0.0%) | 0 (0.0%) |
| Coal or Coke | 0 (0.0%) | 0 (0.0%) |
| All other Fuels | 0 (0.0%) | 0 (0.0%) |
| No Fuel Used | 0 (0.0%) | 0 (0.0%) |
| Total | 266 (100.0%) | 190 (100.0%) |
Household Vehicle Usage in Wade
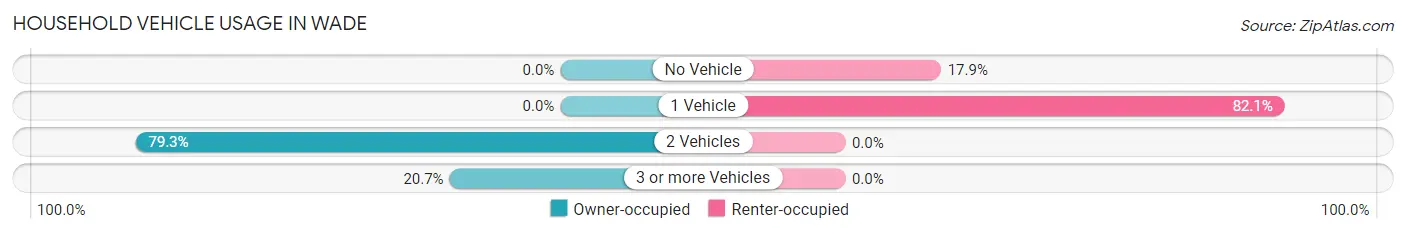
| Vehicles per Household | Owner-occupied | Renter-occupied |
| No Vehicle | 0 (0.0%) | 34 (17.9%) |
| 1 Vehicle | 0 (0.0%) | 156 (82.1%) |
| 2 Vehicles | 211 (79.3%) | 0 (0.0%) |
| 3 or more Vehicles | 55 (20.7%) | 0 (0.0%) |
| Total | 266 (100.0%) | 190 (100.0%) |
Real Estate & Mortgages in Wade
Real Estate and Mortgage Overview in Wade
| Characteristic | Without Mortgage | With Mortgage |
| Housing Units | 126 | 140 |
| Median Property Value | $120,500 | $223,700 |
| Median Household Income | $59,769 | $42 |
| Monthly Housing Costs | - | - |
| Real Estate Taxes | - | - |
Property Value by Mortgage Status in Wade
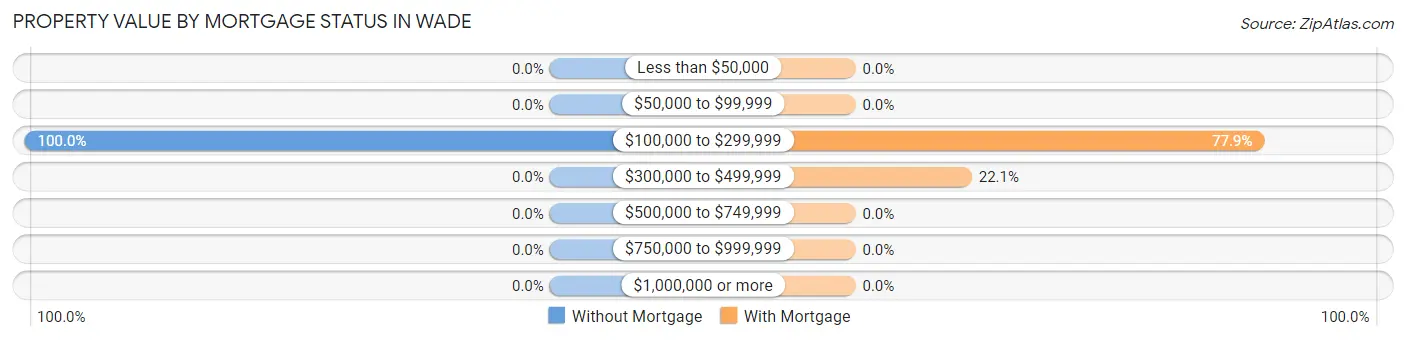
| Property Value | Without Mortgage | With Mortgage |
| Less than $50,000 | 0 (0.0%) | 0 (0.0%) |
| $50,000 to $99,999 | 0 (0.0%) | 0 (0.0%) |
| $100,000 to $299,999 | 126 (100.0%) | 109 (77.9%) |
| $300,000 to $499,999 | 0 (0.0%) | 31 (22.1%) |
| $500,000 to $749,999 | 0 (0.0%) | 0 (0.0%) |
| $750,000 to $999,999 | 0 (0.0%) | 0 (0.0%) |
| $1,000,000 or more | 0 (0.0%) | 0 (0.0%) |
| Total | 126 (100.0%) | 140 (100.0%) |
Household Income by Mortgage Status in Wade
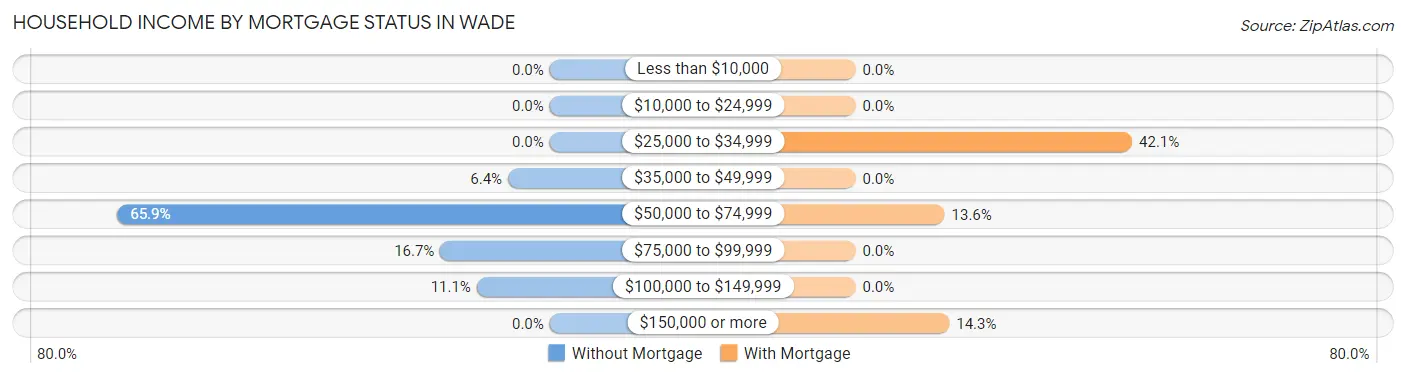
| Household Income | Without Mortgage | With Mortgage |
| Less than $10,000 | 0 (0.0%) | 0 (0.0%) |
| $10,000 to $24,999 | 0 (0.0%) | 0 (0.0%) |
| $25,000 to $34,999 | 0 (0.0%) | 59 (42.1%) |
| $35,000 to $49,999 | 8 (6.4%) | 0 (0.0%) |
| $50,000 to $74,999 | 83 (65.9%) | 19 (13.6%) |
| $75,000 to $99,999 | 21 (16.7%) | 0 (0.0%) |
| $100,000 to $149,999 | 14 (11.1%) | 0 (0.0%) |
| $150,000 or more | 0 (0.0%) | 20 (14.3%) |
| Total | 126 (100.0%) | 140 (100.0%) |
Property Value to Household Income Ratio in Wade
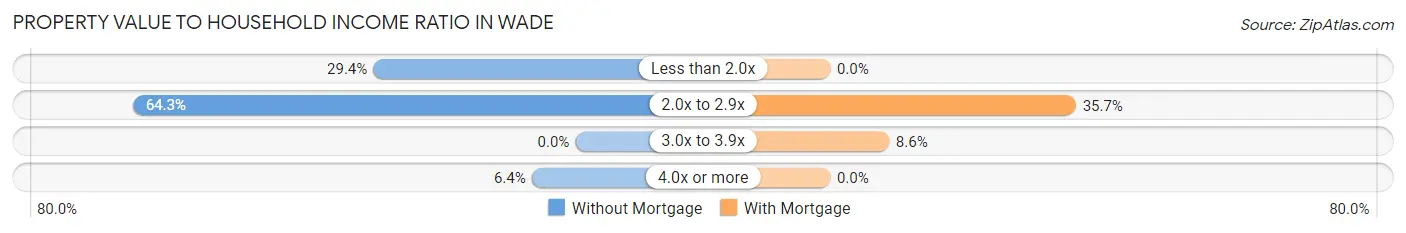
| Value-to-Income Ratio | Without Mortgage | With Mortgage |
| Less than 2.0x | 37 (29.4%) | 0 (0.0%) |
| 2.0x to 2.9x | 81 (64.3%) | 50 (35.7%) |
| 3.0x to 3.9x | 0 (0.0%) | 12 (8.6%) |
| 4.0x or more | 8 (6.4%) | 0 (0.0%) |
| Total | 126 (100.0%) | 140 (100.0%) |
Real Estate Taxes by Mortgage Status in Wade
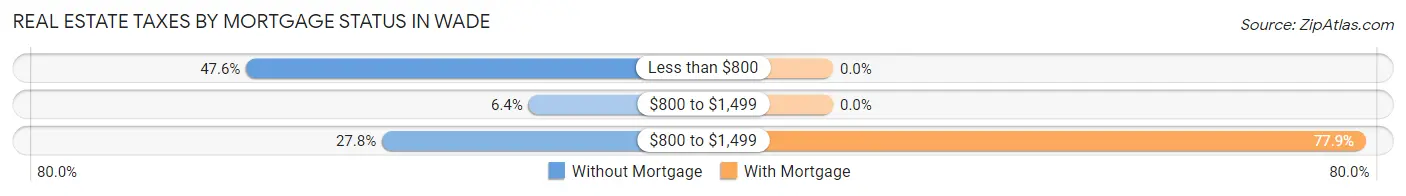
| Property Taxes | Without Mortgage | With Mortgage |
| Less than $800 | 60 (47.6%) | 0 (0.0%) |
| $800 to $1,499 | 8 (6.4%) | 0 (0.0%) |
| $800 to $1,499 | 35 (27.8%) | 109 (77.9%) |
| Total | 126 (100.0%) | 140 (100.0%) |
Health & Disability in Wade
Health Insurance Coverage by Age in Wade
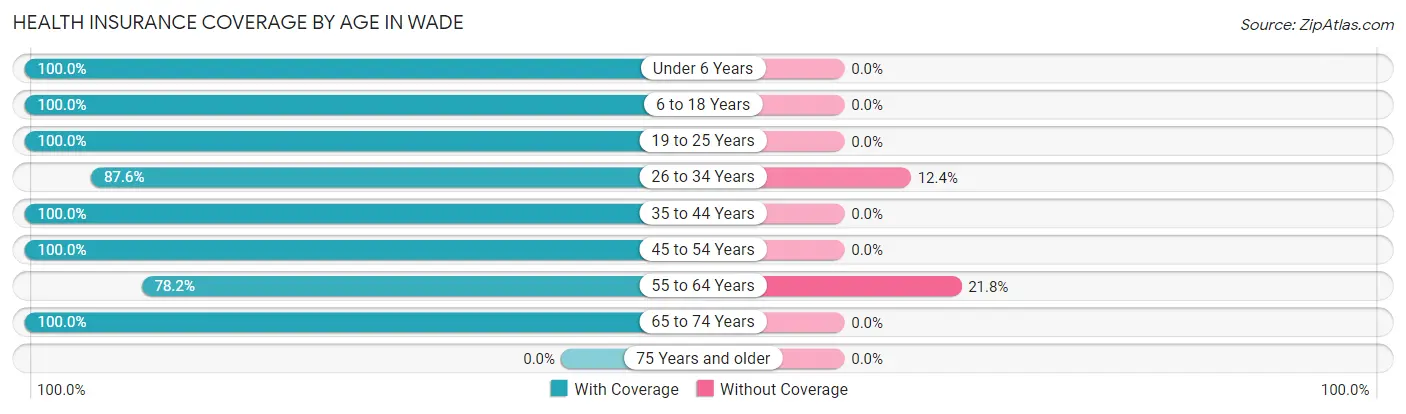
| Age Bracket | With Coverage | Without Coverage |
| Under 6 Years | 143 (100.0%) | 0 (0.0%) |
| 6 to 18 Years | 247 (100.0%) | 0 (0.0%) |
| 19 to 25 Years | 262 (100.0%) | 0 (0.0%) |
| 26 to 34 Years | 99 (87.6%) | 14 (12.4%) |
| 35 to 44 Years | 66 (100.0%) | 0 (0.0%) |
| 45 to 54 Years | 65 (100.0%) | 0 (0.0%) |
| 55 to 64 Years | 287 (78.2%) | 80 (21.8%) |
| 65 to 74 Years | 86 (100.0%) | 0 (0.0%) |
| 75 Years and older | 0 (0.0%) | 0 (0.0%) |
| Total | 1,255 (93.0%) | 94 (7.0%) |
Health Insurance Coverage by Citizenship Status in Wade

| Citizenship Status | With Coverage | Without Coverage |
| Native Born | 143 (100.0%) | 0 (0.0%) |
| Foreign Born, Citizen | 247 (100.0%) | 0 (0.0%) |
| Foreign Born, not a Citizen | 262 (100.0%) | 0 (0.0%) |
Health Insurance Coverage by Household Income in Wade
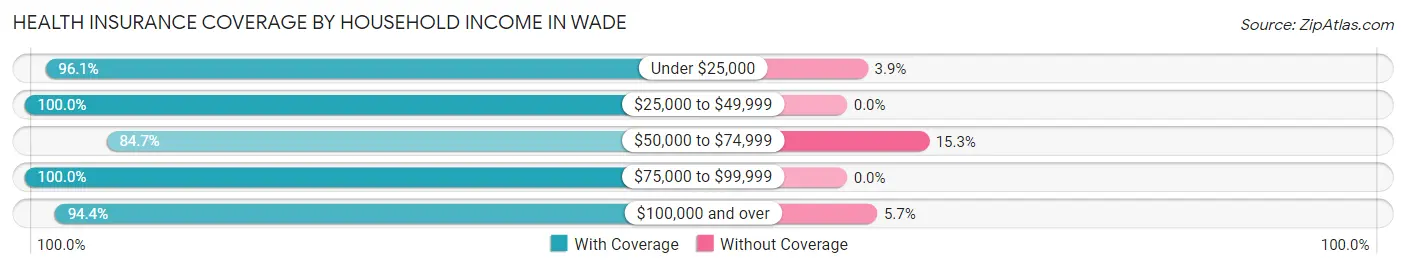
| Household Income | With Coverage | Without Coverage |
| Under $25,000 | 643 (96.1%) | 26 (3.9%) |
| $25,000 to $49,999 | 34 (100.0%) | 0 (0.0%) |
| $50,000 to $74,999 | 298 (84.7%) | 54 (15.3%) |
| $75,000 to $99,999 | 46 (100.0%) | 0 (0.0%) |
| $100,000 and over | 234 (94.4%) | 14 (5.7%) |
Public vs Private Health Insurance Coverage by Age in Wade
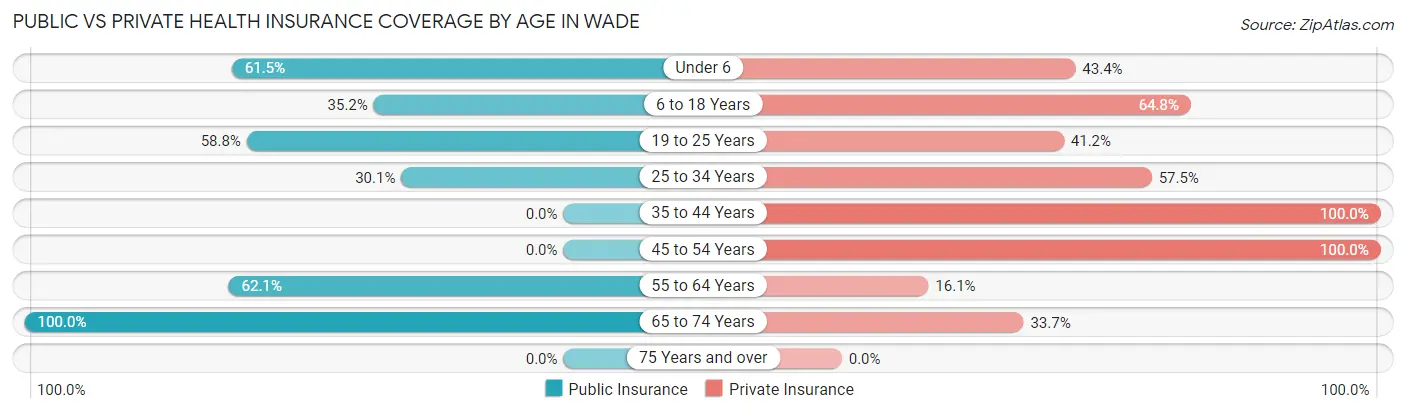
| Age Bracket | Public Insurance | Private Insurance |
| Under 6 | 88 (61.5%) | 62 (43.4%) |
| 6 to 18 Years | 87 (35.2%) | 160 (64.8%) |
| 19 to 25 Years | 154 (58.8%) | 108 (41.2%) |
| 25 to 34 Years | 34 (30.1%) | 65 (57.5%) |
| 35 to 44 Years | 0 (0.0%) | 66 (100.0%) |
| 45 to 54 Years | 0 (0.0%) | 65 (100.0%) |
| 55 to 64 Years | 228 (62.1%) | 59 (16.1%) |
| 65 to 74 Years | 86 (100.0%) | 29 (33.7%) |
| 75 Years and over | 0 (0.0%) | 0 (0.0%) |
| Total | 677 (50.2%) | 614 (45.5%) |
Disability Status by Sex by Age in Wade
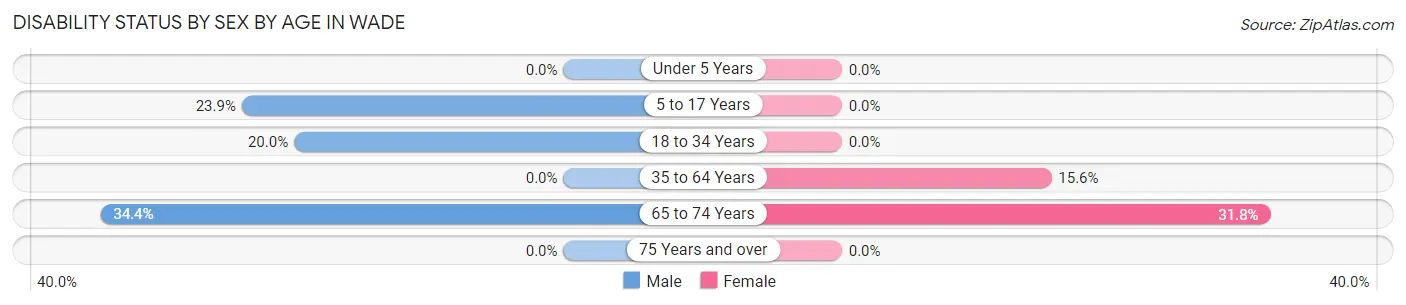
| Age Bracket | Male | Female |
| Under 5 Years | 0 (0.0%) | 0 (0.0%) |
| 5 to 17 Years | 32 (23.9%) | 0 (0.0%) |
| 18 to 34 Years | 34 (20.0%) | 0 (0.0%) |
| 35 to 64 Years | 0 (0.0%) | 54 (15.6%) |
| 65 to 74 Years | 22 (34.4%) | 7 (31.8%) |
| 75 Years and over | 0 (0.0%) | 0 (0.0%) |
Disability Class by Sex by Age in Wade
Disability Class: Hearing Difficulty
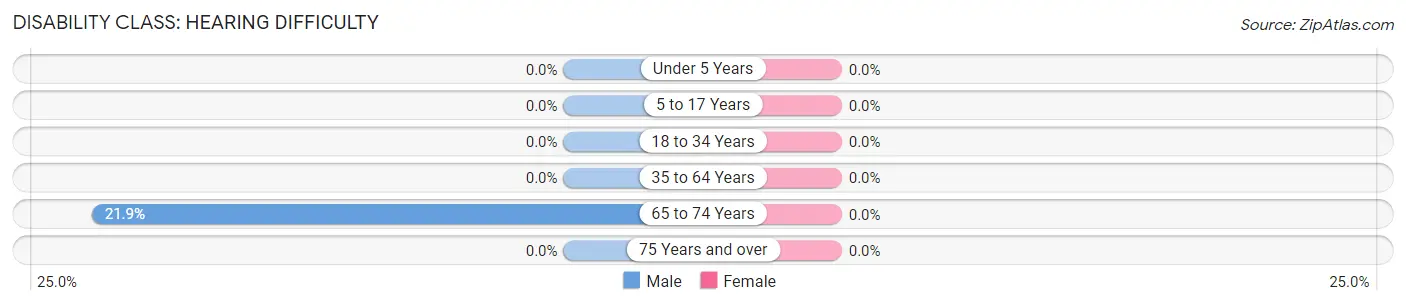
| Age Bracket | Male | Female |
| Under 5 Years | 0 (0.0%) | 0 (0.0%) |
| 5 to 17 Years | 0 (0.0%) | 0 (0.0%) |
| 18 to 34 Years | 0 (0.0%) | 0 (0.0%) |
| 35 to 64 Years | 0 (0.0%) | 0 (0.0%) |
| 65 to 74 Years | 14 (21.9%) | 0 (0.0%) |
| 75 Years and over | 0 (0.0%) | 0 (0.0%) |
Disability Class: Vision Difficulty
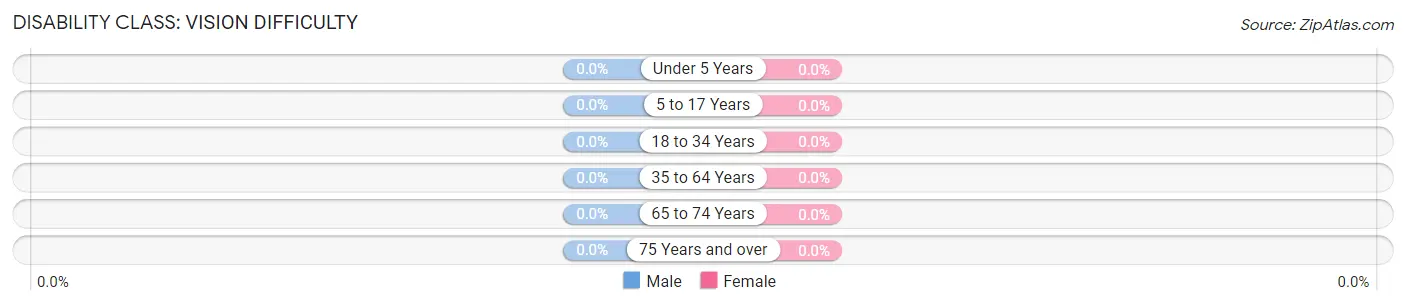
| Age Bracket | Male | Female |
| Under 5 Years | 0 (0.0%) | 0 (0.0%) |
| 5 to 17 Years | 0 (0.0%) | 0 (0.0%) |
| 18 to 34 Years | 0 (0.0%) | 0 (0.0%) |
| 35 to 64 Years | 0 (0.0%) | 0 (0.0%) |
| 65 to 74 Years | 0 (0.0%) | 0 (0.0%) |
| 75 Years and over | 0 (0.0%) | 0 (0.0%) |
Disability Class: Cognitive Difficulty
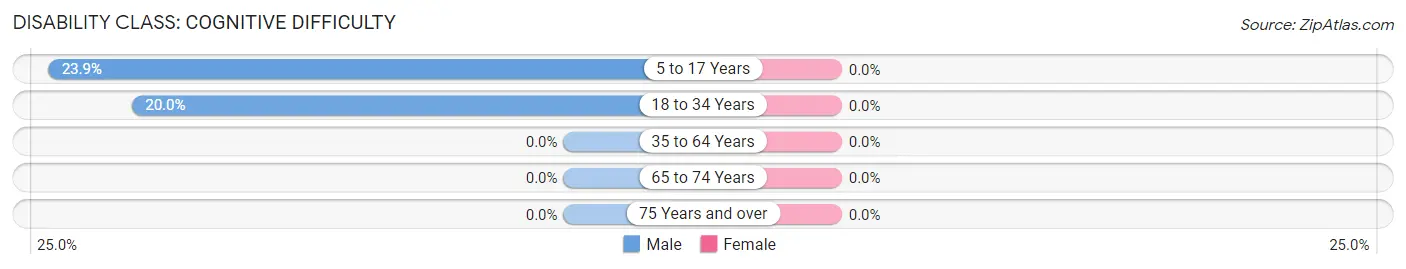
| Age Bracket | Male | Female |
| 5 to 17 Years | 32 (23.9%) | 0 (0.0%) |
| 18 to 34 Years | 34 (20.0%) | 0 (0.0%) |
| 35 to 64 Years | 0 (0.0%) | 0 (0.0%) |
| 65 to 74 Years | 0 (0.0%) | 0 (0.0%) |
| 75 Years and over | 0 (0.0%) | 0 (0.0%) |
Disability Class: Ambulatory Difficulty
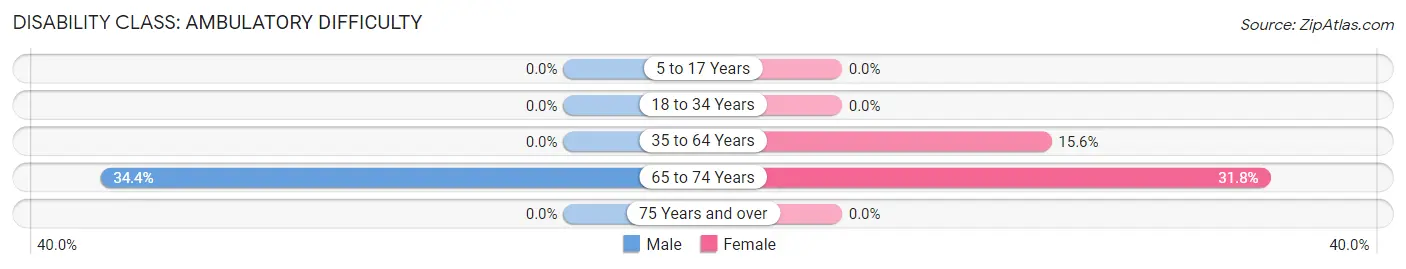
| Age Bracket | Male | Female |
| 5 to 17 Years | 0 (0.0%) | 0 (0.0%) |
| 18 to 34 Years | 0 (0.0%) | 0 (0.0%) |
| 35 to 64 Years | 0 (0.0%) | 54 (15.6%) |
| 65 to 74 Years | 22 (34.4%) | 7 (31.8%) |
| 75 Years and over | 0 (0.0%) | 0 (0.0%) |
Disability Class: Self-Care Difficulty
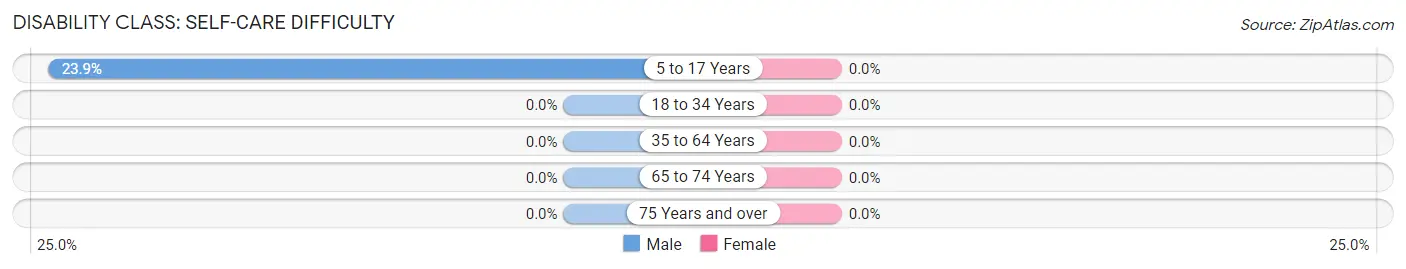
| Age Bracket | Male | Female |
| 5 to 17 Years | 32 (23.9%) | 0 (0.0%) |
| 18 to 34 Years | 0 (0.0%) | 0 (0.0%) |
| 35 to 64 Years | 0 (0.0%) | 0 (0.0%) |
| 65 to 74 Years | 0 (0.0%) | 0 (0.0%) |
| 75 Years and over | 0 (0.0%) | 0 (0.0%) |
Technology Access in Wade
Computing Device Access in Wade
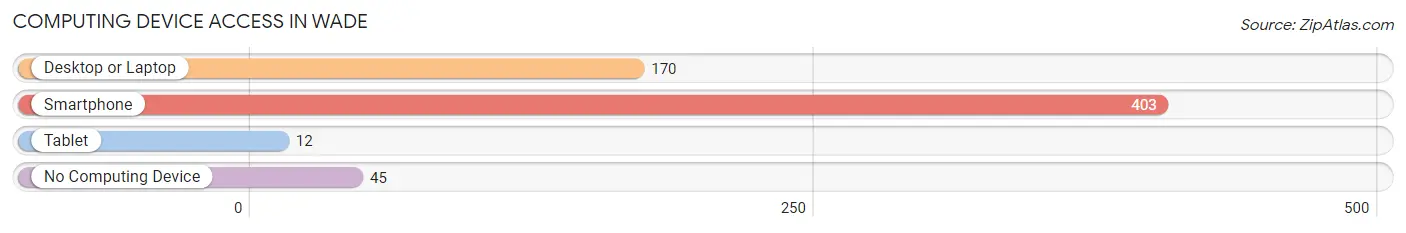
| Device Type | # Households | % Households |
| Desktop or Laptop | 170 | 37.3% |
| Smartphone | 403 | 88.4% |
| Tablet | 12 | 2.6% |
| No Computing Device | 45 | 9.9% |
| Total | 456 | 100.0% |
Internet Access in Wade
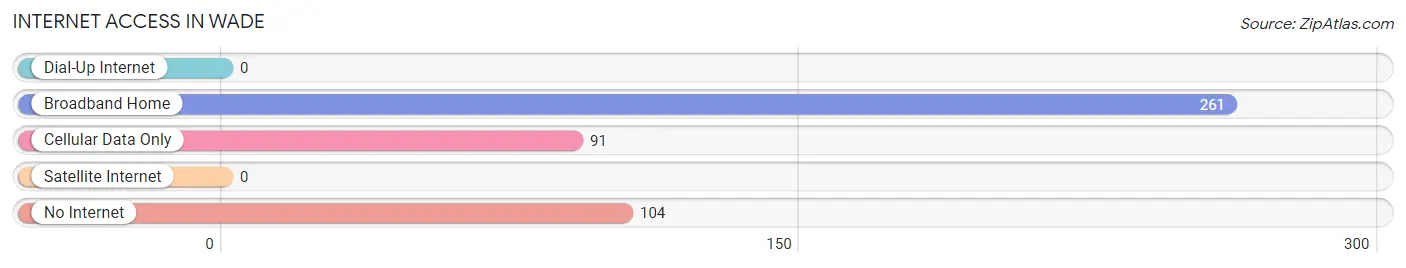
| Internet Type | # Households | % Households |
| Dial-Up Internet | 0 | 0.0% |
| Broadband Home | 261 | 57.2% |
| Cellular Data Only | 91 | 20.0% |
| Satellite Internet | 0 | 0.0% |
| No Internet | 104 | 22.8% |
| Total | 456 | 100.0% |
Wade Summary
MS History
Mississippi is a state located in the southeastern region of the United States. It is bordered by Tennessee to the north, Alabama to the east, the Gulf of Mexico to the south, and Louisiana and Arkansas to the west. Mississippi was admitted to the Union as the 20th state on December 10, 1817.
The history of Mississippi dates back to the Paleo-Indian period, which began around 12,000 years ago. The first inhabitants of the area were Native American tribes, including the Choctaw, Chickasaw, and Natchez. The first Europeans to explore the area were the Spanish, who arrived in the 16th century. The French also explored the area and established settlements in the late 17th century.
In the early 19th century, the United States acquired the area through the Louisiana Purchase. The state of Mississippi was created in 1817, and the first state constitution was adopted in 1832. During the Civil War, Mississippi seceded from the Union and joined the Confederate States of America. After the war, the state was readmitted to the Union in 1870.
In the late 19th and early 20th centuries, Mississippi was a major center of African-American culture and civil rights activism. The state was the site of the 1964 Freedom Summer, when civil rights activists from around the country came to Mississippi to register African-American voters and challenge segregation.
Geography
Mississippi is located in the southeastern region of the United States. It is bordered by Tennessee to the north, Alabama to the east, the Gulf of Mexico to the south, and Louisiana and Arkansas to the west. The state has a total area of 48,430 square miles, making it the 32nd largest state in the country.
The landscape of Mississippi is mostly flat, with rolling hills in the north and east. The state is divided into three distinct geographic regions: the Gulf Coastal Plain in the south, the Mississippi Alluvial Plain in the center, and the Mississippi Hills in the north. The highest point in the state is Woodall Mountain, which has an elevation of 806 feet.
Economy
The economy of Mississippi is largely based on agriculture, manufacturing, and services. The state is a major producer of cotton, soybeans, corn, and rice. Other important agricultural products include poultry, dairy products, and timber.
Manufacturing is also an important part of the state’s economy. Mississippi is home to a number of automotive, aerospace, and defense companies. The state is also a major producer of chemicals, furniture, and processed foods.
The service sector is the largest contributor to the state’s economy, accounting for over half of all jobs in the state. The largest employers in the state are in the healthcare, education, and retail sectors.
Demographics
As of 2019, the population of Mississippi was estimated to be 2,976,149. The state has a population density of 60.7 people per square mile, making it the 37th most densely populated state in the country.
The racial makeup of Mississippi is 63.7% White, 37.3% African American, 0.3% Native American, 0.5% Asian, 0.1% Pacific Islander, 0.2% from other races, and 1.8% from two or more races. The largest ancestry groups in the state are African American, English, Irish, German, and French.
The median household income in Mississippi is $41,754, and the poverty rate is 19.8%. The largest cities in the state are Jackson, Gulfport, Southaven, Hattiesburg, and Biloxi. The state’s capital is Jackson.
Common Questions
What is Per Capita Income in Wade?
Per Capita income in Wade is $16,734.
What is Income or Wage Gap in Wade?
Income or Wage Gap in Wade is 12.4%.
Women in Wade earn 87.6 cents for every dollar earned by a man.
What is Inequality or Gini Index in Wade?
Inequality or Gini Index in Wade is 0.61.
What is the Total Population of Wade?
Total Population of Wade is 1,349.
What is the Total Male Population of Wade?
Total Male Population of Wade is 607.
What is the Total Female Population of Wade?
Total Female Population of Wade is 742.
What is the Ratio of Males per 100 Females in Wade?
There are 81.81 Males per 100 Females in Wade.
What is the Ratio of Females per 100 Males in Wade?
There are 122.24 Females per 100 Males in Wade.
What is the Median Population Age in Wade?
Median Population Age in Wade is 28.1 Years.
What is the Average Family Size in Wade
Average Family Size in Wade is 3.6 People.
What is the Average Household Size in Wade
Average Household Size in Wade is 3.0 People.
How Large is the Labor Force in Wade?
There are 502 People in the Labor Forcein in Wade.
What is the Percentage of People in the Labor Force in Wade?
46.8% of People are in the Labor Force in Wade.
What is the Unemployment Rate in Wade?
Unemployment Rate in Wade is 48.0%.