Tishomingo, MS Map & Demographics
Tishomingo Map
Tishomingo Overview
$27,157
PER CAPITA INCOME
$78,182
AVG FAMILY INCOME
$54,167
AVG HOUSEHOLD INCOME
35.8%
WAGE / INCOME GAP [ % ]
64.2¢/ $1
WAGE / INCOME GAP [ $ ]
0.41
INEQUALITY / GINI INDEX
526
TOTAL POPULATION
243
MALE POPULATION
283
FEMALE POPULATION
85.87
MALES / 100 FEMALES
116.46
FEMALES / 100 MALES
31.5
MEDIAN AGE
2.9
AVG FAMILY SIZE
2.4
AVG HOUSEHOLD SIZE
224
LABOR FORCE [ PEOPLE ]
56.7%
PERCENT IN LABOR FORCE
0.9%
UNEMPLOYMENT RATE
Tishomingo Zip Codes
Tishomingo Area Codes
Income in Tishomingo
Income Overview in Tishomingo
Per Capita Income in Tishomingo is $27,157, while median incomes of families and households are $78,182 and $54,167 respectively.
| Characteristic | Number | Measure |
| Per Capita Income | 526 | $27,157 |
| Median Family Income | 154 | $78,182 |
| Mean Family Income | 154 | $84,991 |
| Median Household Income | 224 | $54,167 |
| Mean Household Income | 224 | $67,174 |
| Income Deficit | 154 | $0 |
| Wage / Income Gap (%) | 526 | 35.79% |
| Wage / Income Gap ($) | 526 | 64.21¢ per $1 |
| Gini / Inequality Index | 526 | 0.41 |
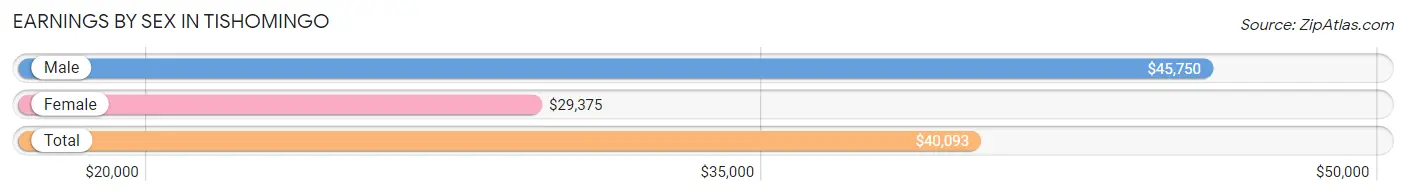
Earnings by Sex in Tishomingo
Average Earnings in Tishomingo are $40,093, $45,750 for men and $29,375 for women, a difference of 35.8%.
| Sex | Number | Average Earnings |
| Male | 141 (57.8%) | $45,750 |
| Female | 103 (42.2%) | $29,375 |
| Total | 244 (100.0%) | $40,093 |
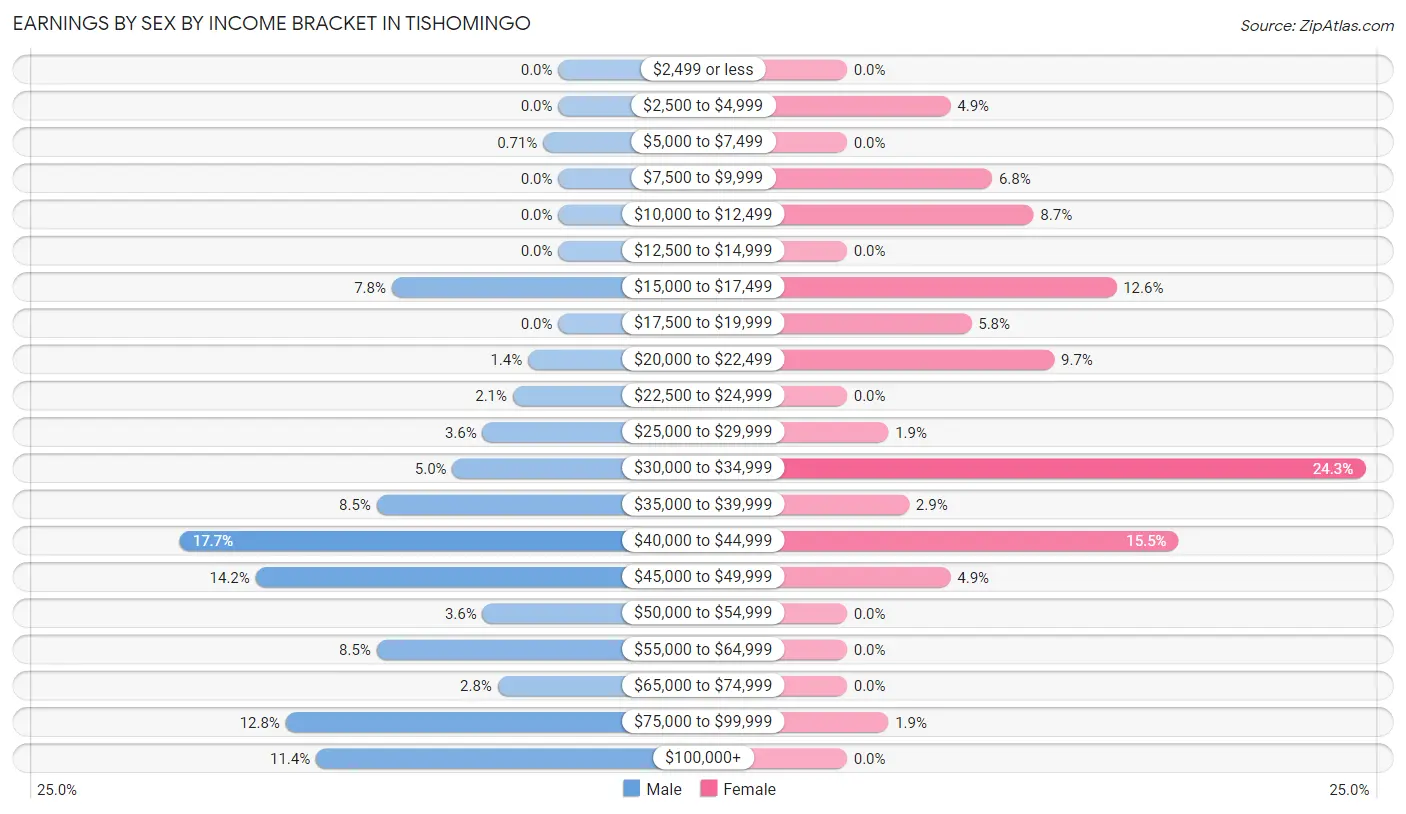
Earnings by Sex by Income Bracket in Tishomingo
The most common earnings brackets in Tishomingo are $40,000 to $44,999 for men (25 | 17.7%) and $30,000 to $34,999 for women (25 | 24.3%).
| Income | Male | Female |
| $2,499 or less | 0 (0.0%) | 0 (0.0%) |
| $2,500 to $4,999 | 0 (0.0%) | 5 (4.9%) |
| $5,000 to $7,499 | 1 (0.7%) | 0 (0.0%) |
| $7,500 to $9,999 | 0 (0.0%) | 7 (6.8%) |
| $10,000 to $12,499 | 0 (0.0%) | 9 (8.7%) |
| $12,500 to $14,999 | 0 (0.0%) | 0 (0.0%) |
| $15,000 to $17,499 | 11 (7.8%) | 13 (12.6%) |
| $17,500 to $19,999 | 0 (0.0%) | 6 (5.8%) |
| $20,000 to $22,499 | 2 (1.4%) | 10 (9.7%) |
| $22,500 to $24,999 | 3 (2.1%) | 0 (0.0%) |
| $25,000 to $29,999 | 5 (3.5%) | 2 (1.9%) |
| $30,000 to $34,999 | 7 (5.0%) | 25 (24.3%) |
| $35,000 to $39,999 | 12 (8.5%) | 3 (2.9%) |
| $40,000 to $44,999 | 25 (17.7%) | 16 (15.5%) |
| $45,000 to $49,999 | 20 (14.2%) | 5 (4.9%) |
| $50,000 to $54,999 | 5 (3.5%) | 0 (0.0%) |
| $55,000 to $64,999 | 12 (8.5%) | 0 (0.0%) |
| $65,000 to $74,999 | 4 (2.8%) | 0 (0.0%) |
| $75,000 to $99,999 | 18 (12.8%) | 2 (1.9%) |
| $100,000+ | 16 (11.4%) | 0 (0.0%) |
| Total | 141 (100.0%) | 103 (100.0%) |
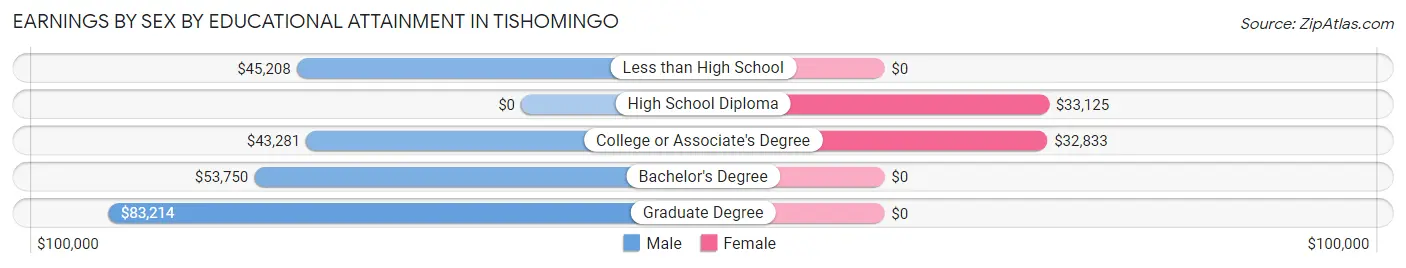
Earnings by Sex by Educational Attainment in Tishomingo
Average earnings in Tishomingo are $46,583 for men and $32,632 for women, a difference of 29.9%. Men with an educational attainment of graduate degree enjoy the highest average annual earnings of $83,214, while those with college or associate's degree education earn the least with $43,281. Women with an educational attainment of high school diploma earn the most with the average annual earnings of $33,125, while those with college or associate's degree education have the smallest earnings of $32,833.
| Educational Attainment | Male Income | Female Income |
| Less than High School | $45,208 | $0 |
| High School Diploma | - | - |
| College or Associate's Degree | $43,281 | $32,833 |
| Bachelor's Degree | $53,750 | $0 |
| Graduate Degree | $83,214 | $0 |
| Total | $46,583 | $32,632 |
Family Income in Tishomingo
Family Income Brackets in Tishomingo
According to the Tishomingo family income data, there are 55 families falling into the $75,000 to $99,999 income range, which is the most common income bracket and makes up 35.7% of all families.
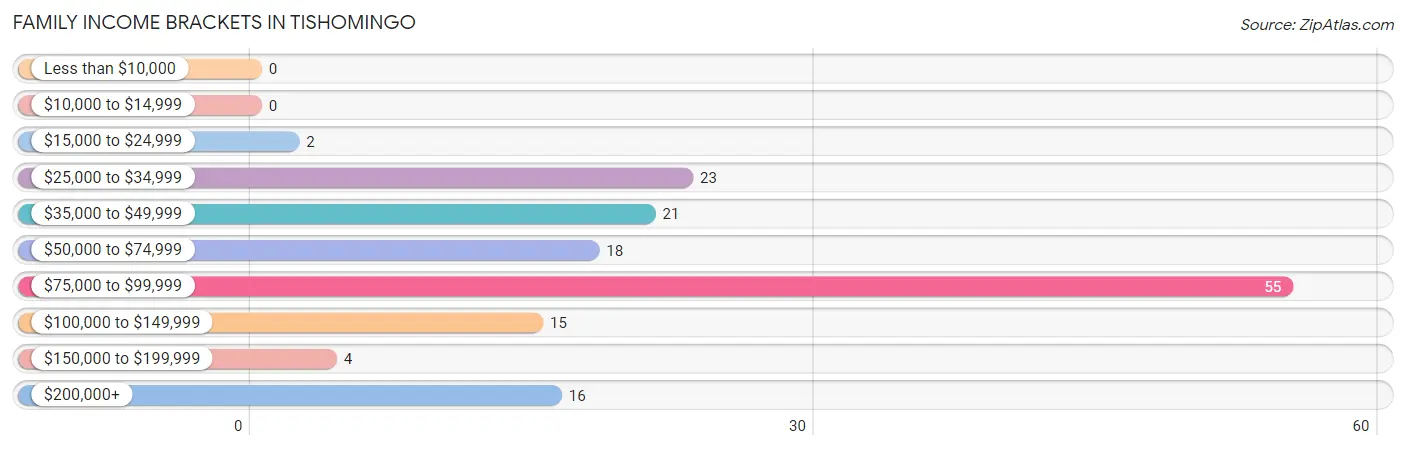
| Income Bracket | # Families | % Families |
| Less than $10,000 | 0 | 0.0% |
| $10,000 to $14,999 | 0 | 0.0% |
| $15,000 to $24,999 | 2 | 1.3% |
| $25,000 to $34,999 | 23 | 14.9% |
| $35,000 to $49,999 | 21 | 13.6% |
| $50,000 to $74,999 | 18 | 11.7% |
| $75,000 to $99,999 | 55 | 35.7% |
| $100,000 to $149,999 | 15 | 9.7% |
| $150,000 to $199,999 | 4 | 2.6% |
| $200,000+ | 16 | 10.4% |
Family Income by Famaliy Size in Tishomingo
3-person families (79 | 51.3%) account for the highest median family income in Tishomingo with $79,271 per family, while 2-person families (38 | 24.7%) have the highest median income of $27,500 per family member.
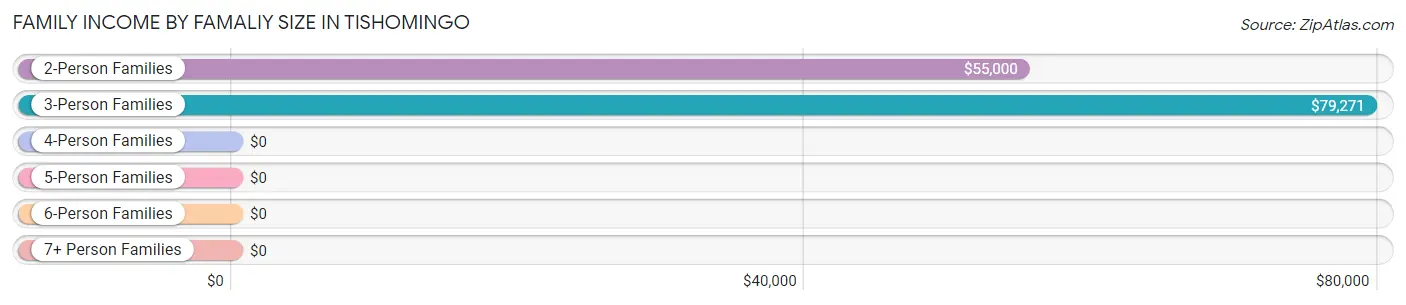
| Income Bracket | # Families | Median Income |
| 2-Person Families | 38 (24.7%) | $55,000 |
| 3-Person Families | 79 (51.3%) | $79,271 |
| 4-Person Families | 20 (13.0%) | $0 |
| 5-Person Families | 17 (11.0%) | $0 |
| 6-Person Families | 0 (0.0%) | $0 |
| 7+ Person Families | 0 (0.0%) | $0 |
| Total | 154 (100.0%) | $78,182 |
Family Income by Number of Earners in Tishomingo
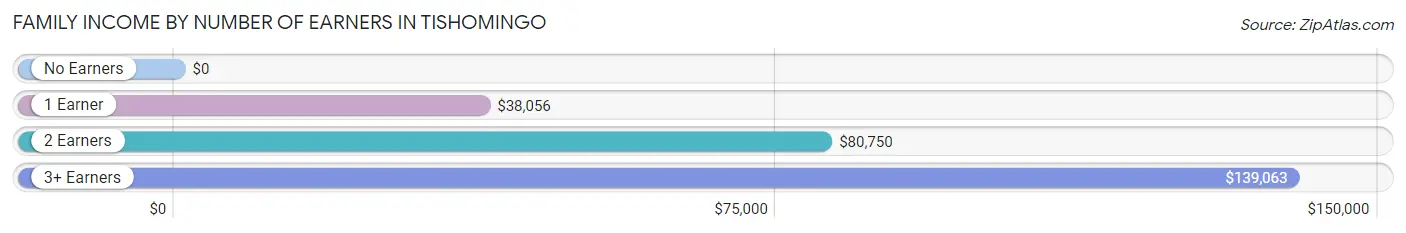
| Number of Earners | # Families | Median Income |
| No Earners | 18 (11.7%) | $0 |
| 1 Earner | 36 (23.4%) | $38,056 |
| 2 Earners | 91 (59.1%) | $80,750 |
| 3+ Earners | 9 (5.8%) | $139,063 |
| Total | 154 (100.0%) | $78,182 |
Household Income in Tishomingo
Household Income Brackets in Tishomingo
With 56 households falling in the category, the $75,000 to $99,999 income range is the most frequent in Tishomingo, accounting for 25.0% of all households. In contrast, only 4 households (1.8%) fall into the $150,000 to $199,999 income bracket, making it the least populous group.
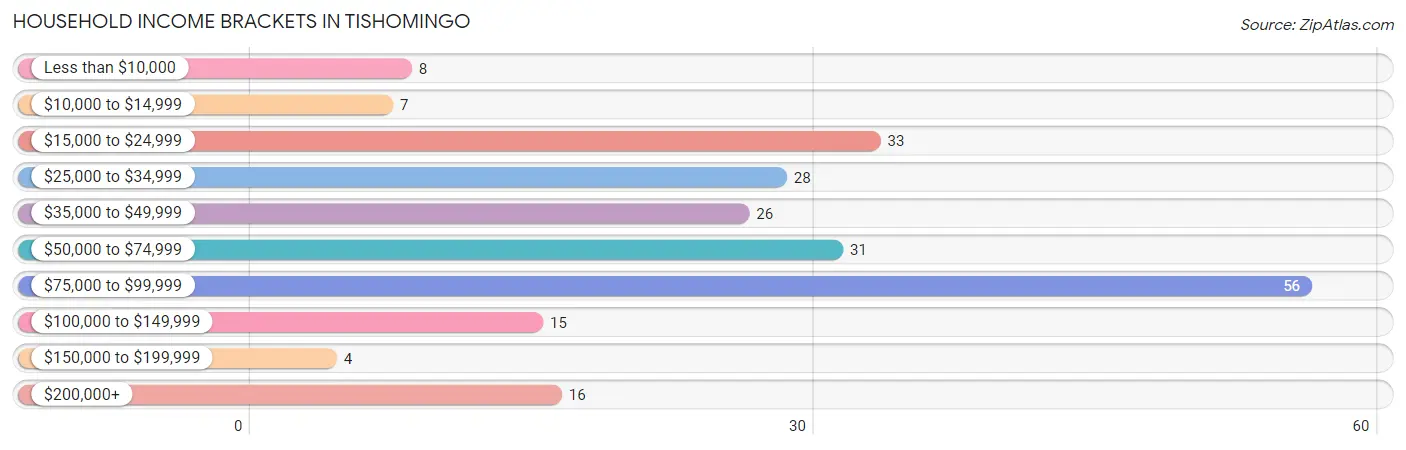
| Income Bracket | # Households | % Households |
| Less than $10,000 | 8 | 3.6% |
| $10,000 to $14,999 | 7 | 3.1% |
| $15,000 to $24,999 | 33 | 14.7% |
| $25,000 to $34,999 | 28 | 12.5% |
| $35,000 to $49,999 | 26 | 11.6% |
| $50,000 to $74,999 | 31 | 13.8% |
| $75,000 to $99,999 | 56 | 25.0% |
| $100,000 to $149,999 | 15 | 6.7% |
| $150,000 to $199,999 | 4 | 1.8% |
| $200,000+ | 16 | 7.1% |
Household Income by Householder Age in Tishomingo
The median household income in Tishomingo is $54,167, with the highest median household income of $79,500 found in the 25 to 44 years age bracket for the primary householder. A total of 80 households (35.7%) fall into this category. Meanwhile, the 45 to 64 years age bracket for the primary householder has the lowest median household income of $0, with 73 households (32.6%) in this group.
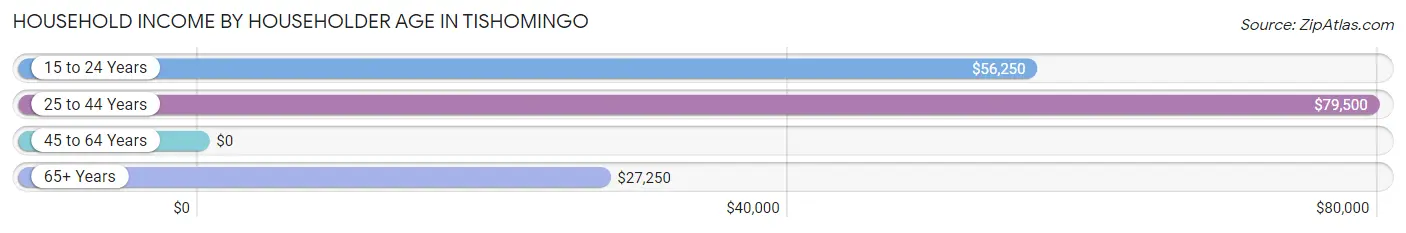
| Income Bracket | # Households | Median Income |
| 15 to 24 Years | 8 (3.6%) | $56,250 |
| 25 to 44 Years | 80 (35.7%) | $79,500 |
| 45 to 64 Years | 73 (32.6%) | $0 |
| 65+ Years | 63 (28.1%) | $27,250 |
| Total | 224 (100.0%) | $54,167 |
Poverty in Tishomingo
Income Below Poverty by Sex and Age in Tishomingo
With 2.9% poverty level for males and 5.7% for females among the residents of Tishomingo, 55 to 64 year old males and 18 to 24 year old females are the most vulnerable to poverty, with 6 males (46.2%) and 4 females (16.7%) in their respective age groups living below the poverty level.
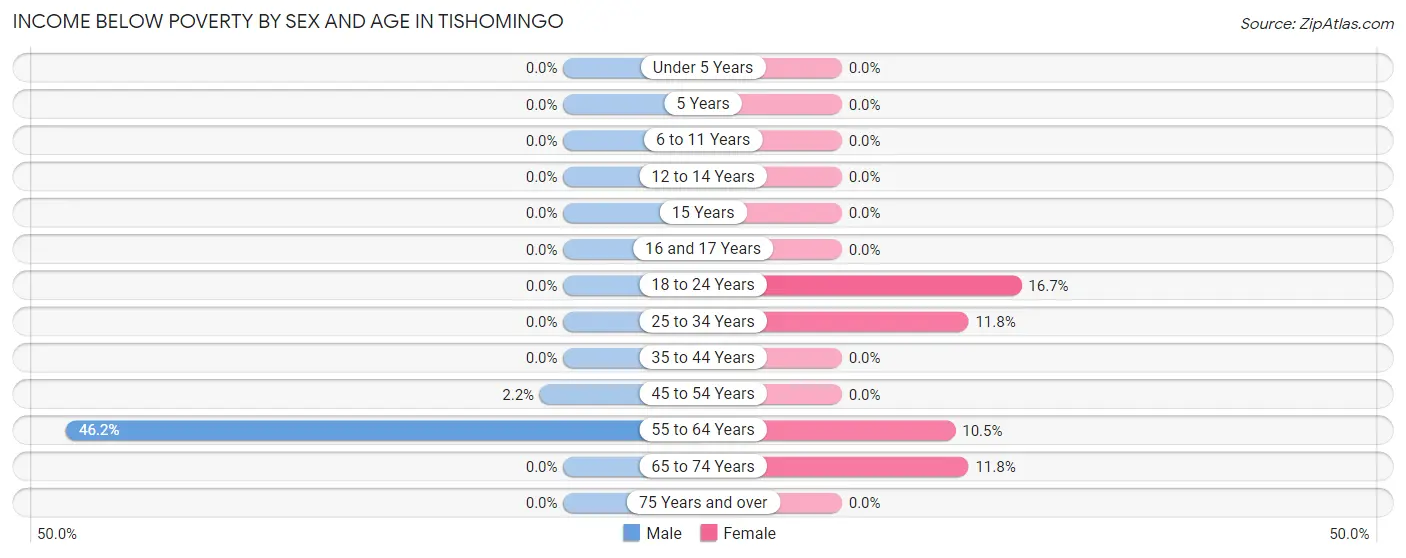
| Age Bracket | Male | Female |
| Under 5 Years | 0 (0.0%) | 0 (0.0%) |
| 5 Years | 0 (0.0%) | 0 (0.0%) |
| 6 to 11 Years | 0 (0.0%) | 0 (0.0%) |
| 12 to 14 Years | 0 (0.0%) | 0 (0.0%) |
| 15 Years | 0 (0.0%) | 0 (0.0%) |
| 16 and 17 Years | 0 (0.0%) | 0 (0.0%) |
| 18 to 24 Years | 0 (0.0%) | 4 (16.7%) |
| 25 to 34 Years | 0 (0.0%) | 6 (11.8%) |
| 35 to 44 Years | 0 (0.0%) | 0 (0.0%) |
| 45 to 54 Years | 1 (2.2%) | 0 (0.0%) |
| 55 to 64 Years | 6 (46.2%) | 2 (10.5%) |
| 65 to 74 Years | 0 (0.0%) | 4 (11.8%) |
| 75 Years and over | 0 (0.0%) | 0 (0.0%) |
| Total | 7 (2.9%) | 16 (5.7%) |
Income Above Poverty by Sex and Age in Tishomingo
According to the poverty statistics in Tishomingo, males aged under 5 years and females aged under 5 years are the age groups that are most secure financially, with 100.0% of males and 100.0% of females in these age groups living above the poverty line.
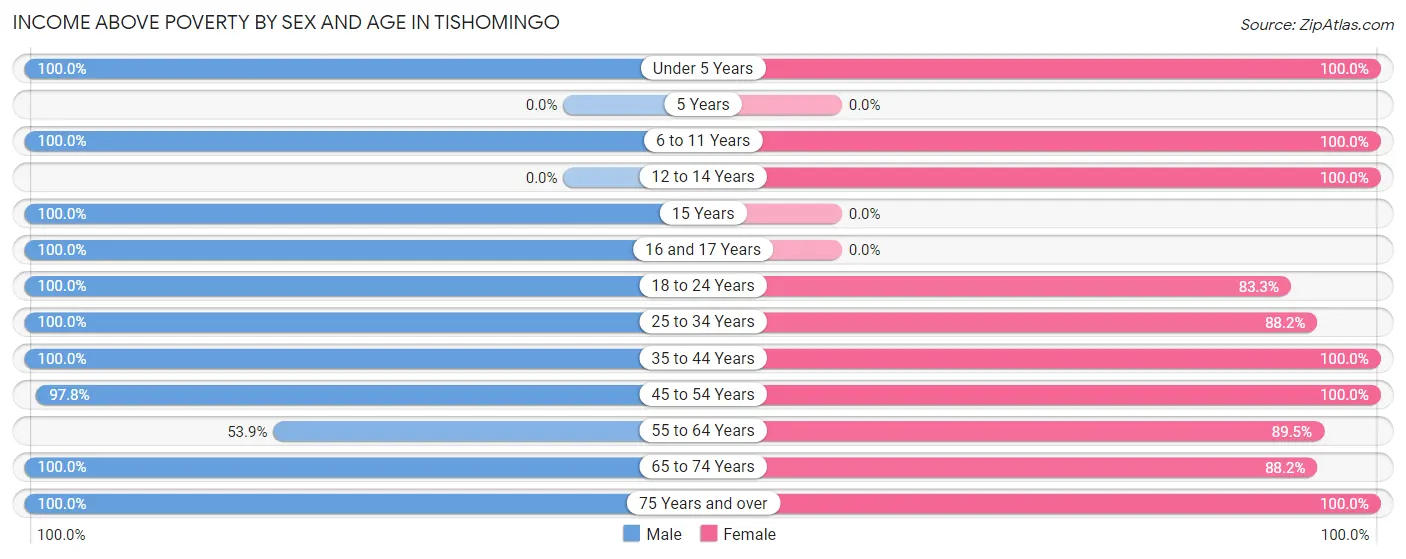
| Age Bracket | Male | Female |
| Under 5 Years | 45 (100.0%) | 34 (100.0%) |
| 5 Years | 0 (0.0%) | 0 (0.0%) |
| 6 to 11 Years | 12 (100.0%) | 28 (100.0%) |
| 12 to 14 Years | 0 (0.0%) | 5 (100.0%) |
| 15 Years | 7 (100.0%) | 0 (0.0%) |
| 16 and 17 Years | 7 (100.0%) | 0 (0.0%) |
| 18 to 24 Years | 11 (100.0%) | 20 (83.3%) |
| 25 to 34 Years | 69 (100.0%) | 45 (88.2%) |
| 35 to 44 Years | 11 (100.0%) | 20 (100.0%) |
| 45 to 54 Years | 45 (97.8%) | 38 (100.0%) |
| 55 to 64 Years | 7 (53.8%) | 17 (89.5%) |
| 65 to 74 Years | 9 (100.0%) | 30 (88.2%) |
| 75 Years and over | 13 (100.0%) | 30 (100.0%) |
| Total | 236 (97.1%) | 267 (94.4%) |
Income Below Poverty Among Married-Couple Families in Tishomingo
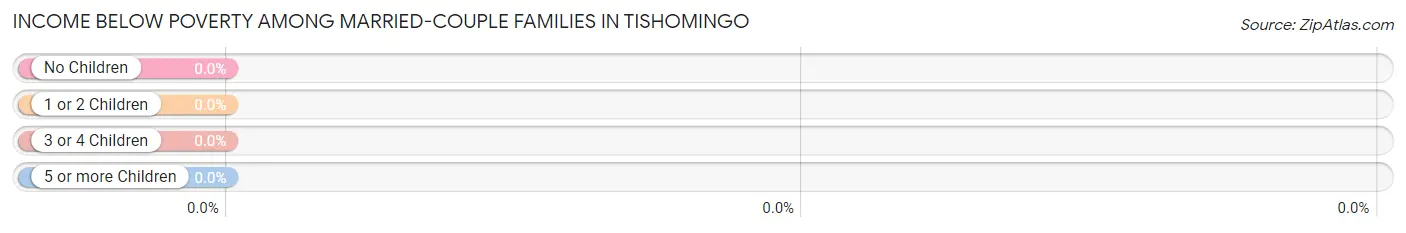
| Children | Above Poverty | Below Poverty |
| No Children | 38 (100.0%) | 0 (0.0%) |
| 1 or 2 Children | 73 (100.0%) | 0 (0.0%) |
| 3 or 4 Children | 10 (100.0%) | 0 (0.0%) |
| 5 or more Children | 0 (0.0%) | 0 (0.0%) |
| Total | 121 (100.0%) | 0 (0.0%) |
Income Below Poverty Among Single-Parent Households in Tishomingo
| Children | Single Father | Single Mother |
| No Children | 0 (0.0%) | 0 (0.0%) |
| 1 or 2 Children | 0 (0.0%) | 0 (0.0%) |
| 3 or 4 Children | 0 (0.0%) | 0 (0.0%) |
| 5 or more Children | 0 (0.0%) | 0 (0.0%) |
| Total | 0 (0.0%) | 0 (0.0%) |
Income Below Poverty Among Married-Couple vs Single-Parent Households in Tishomingo
| Children | Married-Couple Families | Single-Parent Households |
| No Children | 0 (0.0%) | 0 (0.0%) |
| 1 or 2 Children | 0 (0.0%) | 0 (0.0%) |
| 3 or 4 Children | 0 (0.0%) | 0 (0.0%) |
| 5 or more Children | 0 (0.0%) | 0 (0.0%) |
| Total | 0 (0.0%) | 0 (0.0%) |
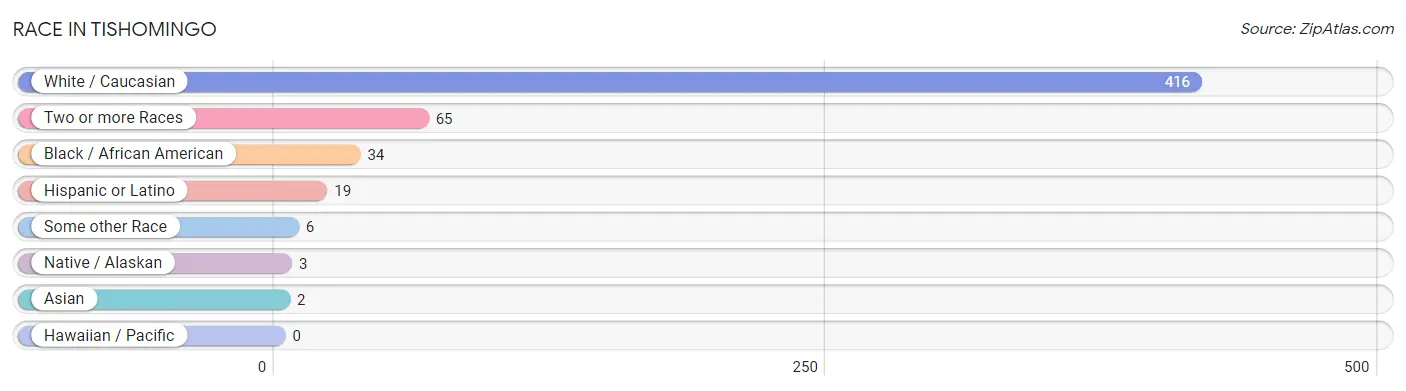
Race in Tishomingo
The most populous races in Tishomingo are White / Caucasian (416 | 79.1%), Two or more Races (65 | 12.4%), and Black / African American (34 | 6.5%).
| Race | # Population | % Population |
| Asian | 2 | 0.4% |
| Black / African American | 34 | 6.5% |
| Hawaiian / Pacific | 0 | 0.0% |
| Hispanic or Latino | 19 | 3.6% |
| Native / Alaskan | 3 | 0.6% |
| White / Caucasian | 416 | 79.1% |
| Two or more Races | 65 | 12.4% |
| Some other Race | 6 | 1.1% |
| Total | 526 | 100.0% |
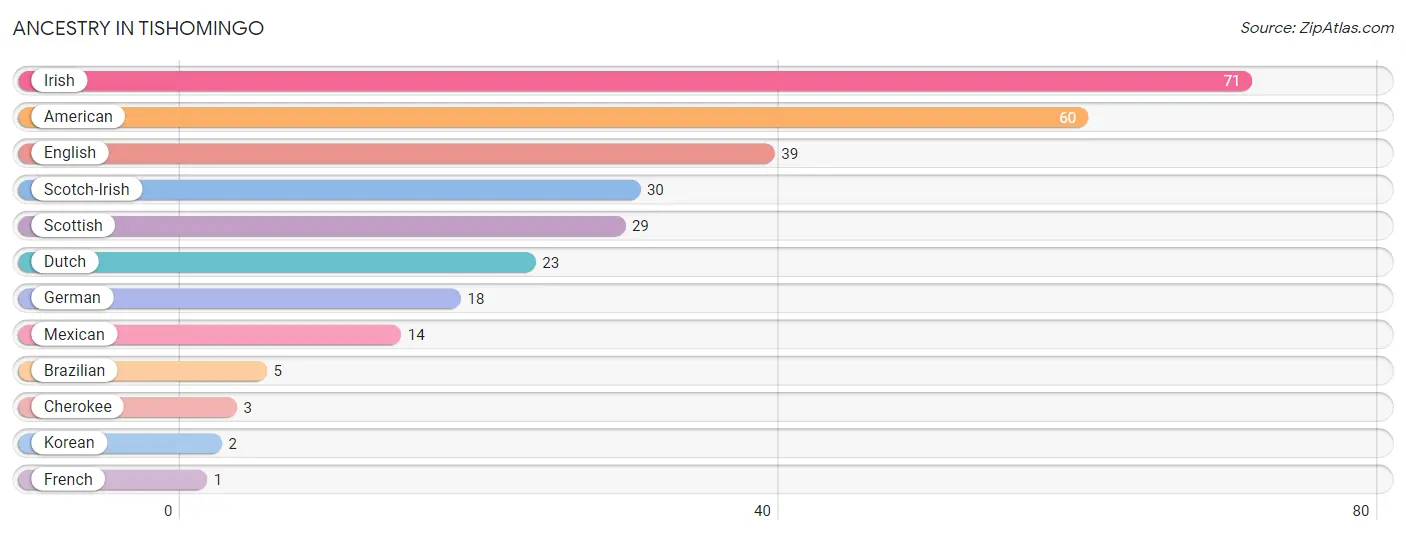
Ancestry in Tishomingo
The most populous ancestries reported in Tishomingo are Irish (71 | 13.5%), American (60 | 11.4%), English (39 | 7.4%), Scotch-Irish (30 | 5.7%), and Scottish (29 | 5.5%), together accounting for 43.5% of all Tishomingo residents.
| Ancestry | # Population | % Population |
| American | 60 | 11.4% |
| Brazilian | 5 | 0.9% |
| Cherokee | 3 | 0.6% |
| Dutch | 23 | 4.4% |
| English | 39 | 7.4% |
| French | 1 | 0.2% |
| German | 18 | 3.4% |
| Irish | 71 | 13.5% |
| Korean | 2 | 0.4% |
| Mexican | 14 | 2.7% |
| Scotch-Irish | 30 | 5.7% |
| Scottish | 29 | 5.5% | View All 12 Rows |
Immigrants in Tishomingo
The most numerous immigrant groups reported in Tishomingo came from Brazil (5 | 0.9%), Latin America (5 | 0.9%), South America (5 | 0.9%), Asia (2 | 0.4%), and Philippines (2 | 0.4%), together accounting for 3.6% of all Tishomingo residents.
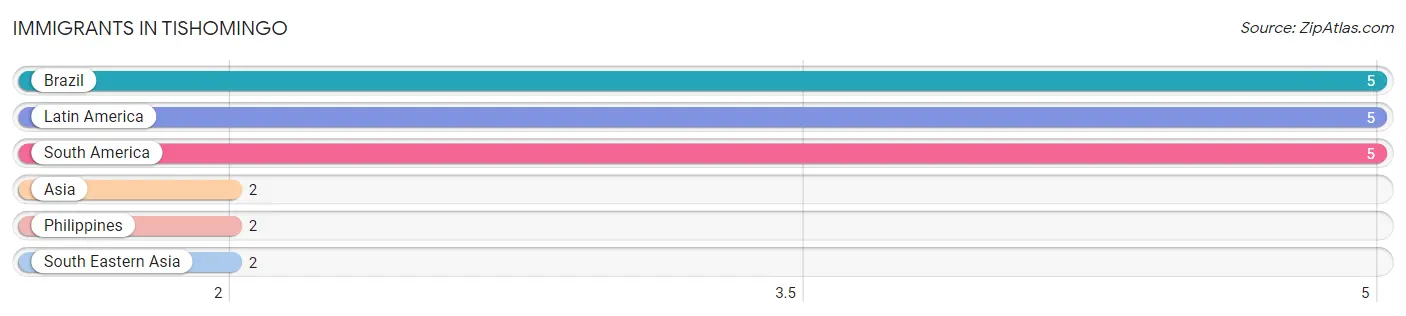
| Immigration Origin | # Population | % Population |
| Asia | 2 | 0.4% |
| Brazil | 5 | 0.9% |
| Latin America | 5 | 0.9% |
| Philippines | 2 | 0.4% |
| South America | 5 | 0.9% |
| South Eastern Asia | 2 | 0.4% | View All 6 Rows |
Sex and Age in Tishomingo
Sex and Age in Tishomingo
The most populous age groups in Tishomingo are Under 5 Years (45 | 18.5%) for men and 25 to 29 Years (42 | 14.8%) for women.
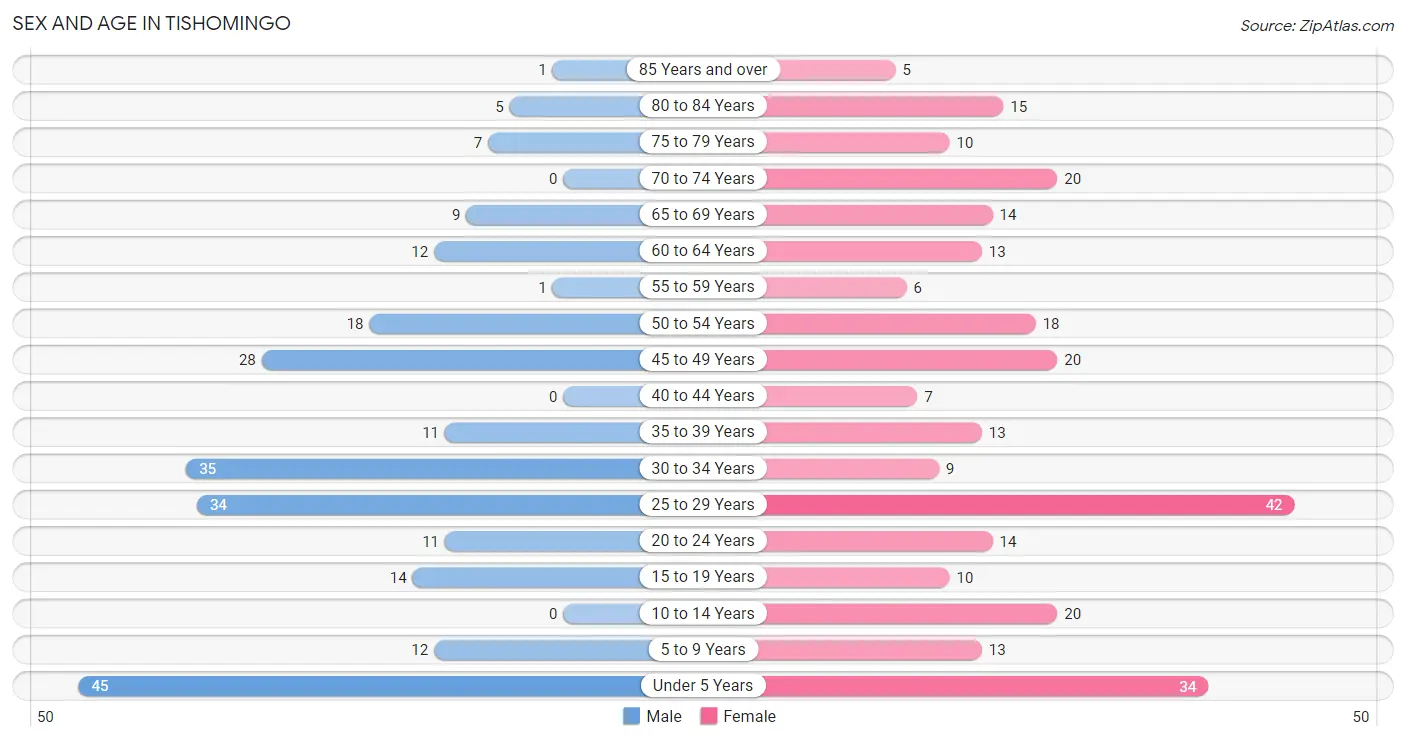
| Age Bracket | Male | Female |
| Under 5 Years | 45 (18.5%) | 34 (12.0%) |
| 5 to 9 Years | 12 (4.9%) | 13 (4.6%) |
| 10 to 14 Years | 0 (0.0%) | 20 (7.1%) |
| 15 to 19 Years | 14 (5.8%) | 10 (3.5%) |
| 20 to 24 Years | 11 (4.5%) | 14 (5.0%) |
| 25 to 29 Years | 34 (14.0%) | 42 (14.8%) |
| 30 to 34 Years | 35 (14.4%) | 9 (3.2%) |
| 35 to 39 Years | 11 (4.5%) | 13 (4.6%) |
| 40 to 44 Years | 0 (0.0%) | 7 (2.5%) |
| 45 to 49 Years | 28 (11.5%) | 20 (7.1%) |
| 50 to 54 Years | 18 (7.4%) | 18 (6.4%) |
| 55 to 59 Years | 1 (0.4%) | 6 (2.1%) |
| 60 to 64 Years | 12 (4.9%) | 13 (4.6%) |
| 65 to 69 Years | 9 (3.7%) | 14 (5.0%) |
| 70 to 74 Years | 0 (0.0%) | 20 (7.1%) |
| 75 to 79 Years | 7 (2.9%) | 10 (3.5%) |
| 80 to 84 Years | 5 (2.1%) | 15 (5.3%) |
| 85 Years and over | 1 (0.4%) | 5 (1.8%) |
| Total | 243 (100.0%) | 283 (100.0%) |
Families and Households in Tishomingo
Median Family Size in Tishomingo
The median family size in Tishomingo is 2.88 persons per family, with married-couple families (121 | 78.6%) accounting for the largest median family size of 2.98 persons per family. On the other hand, single male/father families (11 | 7.1%) represent the smallest median family size with 2.18 persons per family.
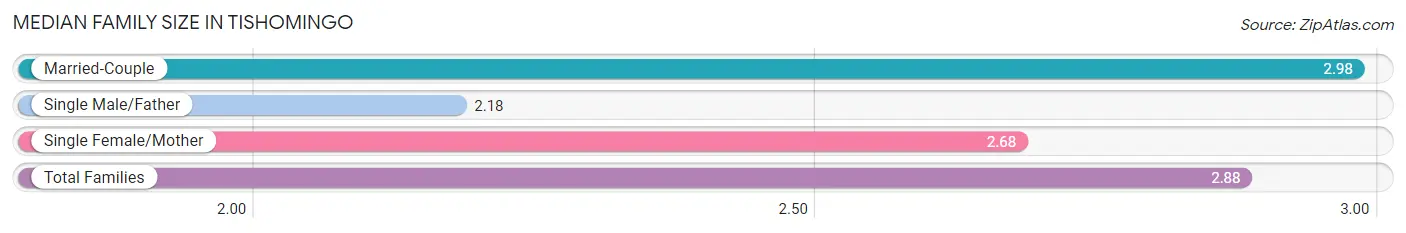
| Family Type | # Families | Family Size |
| Married-Couple | 121 (78.6%) | 2.98 |
| Single Male/Father | 11 (7.1%) | 2.18 |
| Single Female/Mother | 22 (14.3%) | 2.68 |
| Total Families | 154 (100.0%) | 2.88 |
Median Household Size in Tishomingo
The median household size in Tishomingo is 2.35 persons per household, with single male/father households (11 | 4.9%) accounting for the largest median household size of 3.09 persons per household. non-family households (70 | 31.2%) represent the smallest median household size with 1.03 persons per household.
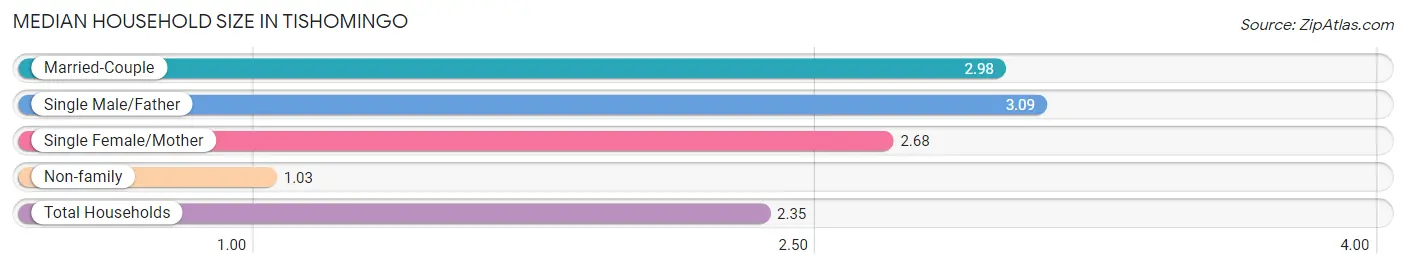
| Household Type | # Households | Household Size |
| Married-Couple | 121 (54.0%) | 2.98 |
| Single Male/Father | 11 (4.9%) | 3.09 |
| Single Female/Mother | 22 (9.8%) | 2.68 |
| Non-family | 70 (31.2%) | 1.03 |
| Total Households | 224 (100.0%) | 2.35 |
Household Size by Marriage Status in Tishomingo
Out of a total of 224 households in Tishomingo, 154 (68.8%) are family households, while 70 (31.2%) are nonfamily households. The most numerous type of family households are 3-person households, comprising 75, and the most common type of nonfamily households are 1-person households, comprising 69.
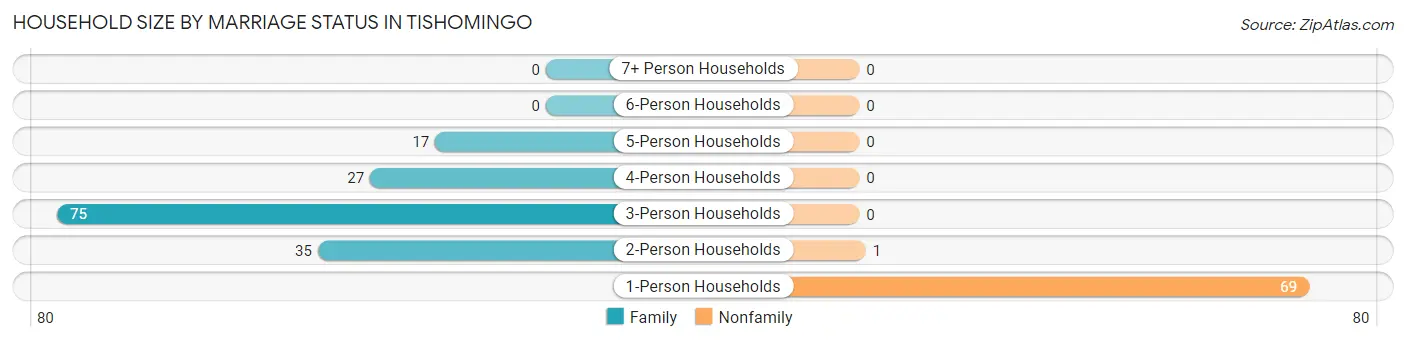
| Household Size | Family Households | Nonfamily Households |
| 1-Person Households | - | 69 (30.8%) |
| 2-Person Households | 35 (15.6%) | 1 (0.4%) |
| 3-Person Households | 75 (33.5%) | 0 (0.0%) |
| 4-Person Households | 27 (12.0%) | 0 (0.0%) |
| 5-Person Households | 17 (7.6%) | 0 (0.0%) |
| 6-Person Households | 0 (0.0%) | 0 (0.0%) |
| 7+ Person Households | 0 (0.0%) | 0 (0.0%) |
| Total | 154 (68.8%) | 70 (31.2%) |
Female Fertility in Tishomingo
Fertility by Age in Tishomingo
Average fertility rate in Tishomingo is 128.0 births per 1,000 women. Women in the age bracket of 20 to 34 years have the highest fertility rate with 246.0 births per 1,000 women. Women in the age bracket of 20 to 34 years acount for 100.0% of all women with births.
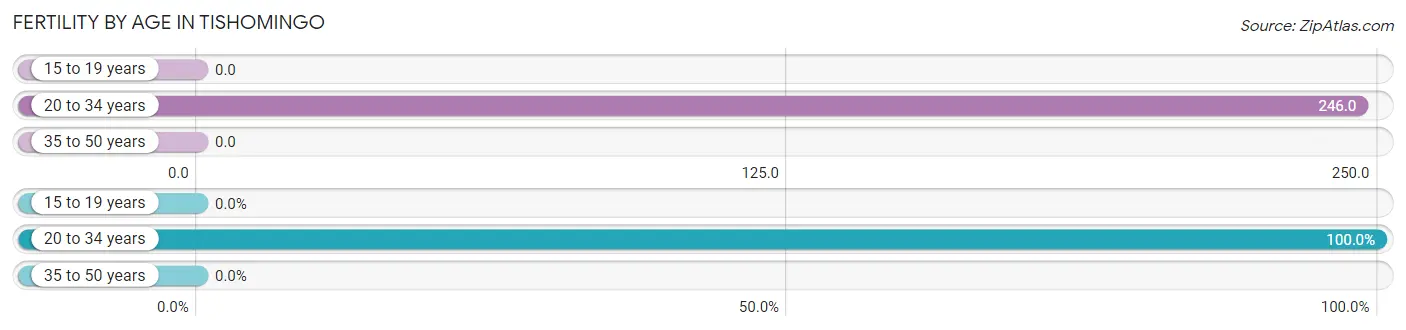
| Age Bracket | Women with Births | Births / 1,000 Women |
| 15 to 19 years | 0 (0.0%) | 0.0 |
| 20 to 34 years | 16 (100.0%) | 246.0 |
| 35 to 50 years | 0 (0.0%) | 0.0 |
| Total | 16 (100.0%) | 128.0 |
Fertility by Age by Marriage Status in Tishomingo
62.5% of women with births (16) in Tishomingo are married. The highest percentage of unmarried women with births falls into 20 to 34 years age bracket with 37.5% of them unmarried at the time of birth, while the lowest percentage of unmarried women with births belong to 20 to 34 years age bracket with 37.5% of them unmarried.
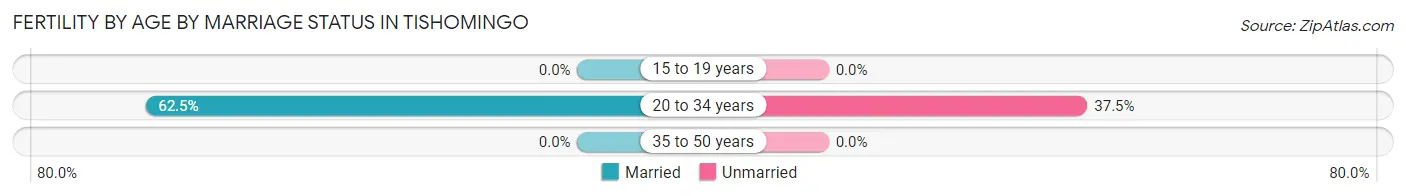
| Age Bracket | Married | Unmarried |
| 15 to 19 years | 0 (0.0%) | 0 (0.0%) |
| 20 to 34 years | 10 (62.5%) | 6 (37.5%) |
| 35 to 50 years | 0 (0.0%) | 0 (0.0%) |
| Total | 10 (62.5%) | 6 (37.5%) |
Fertility by Education in Tishomingo
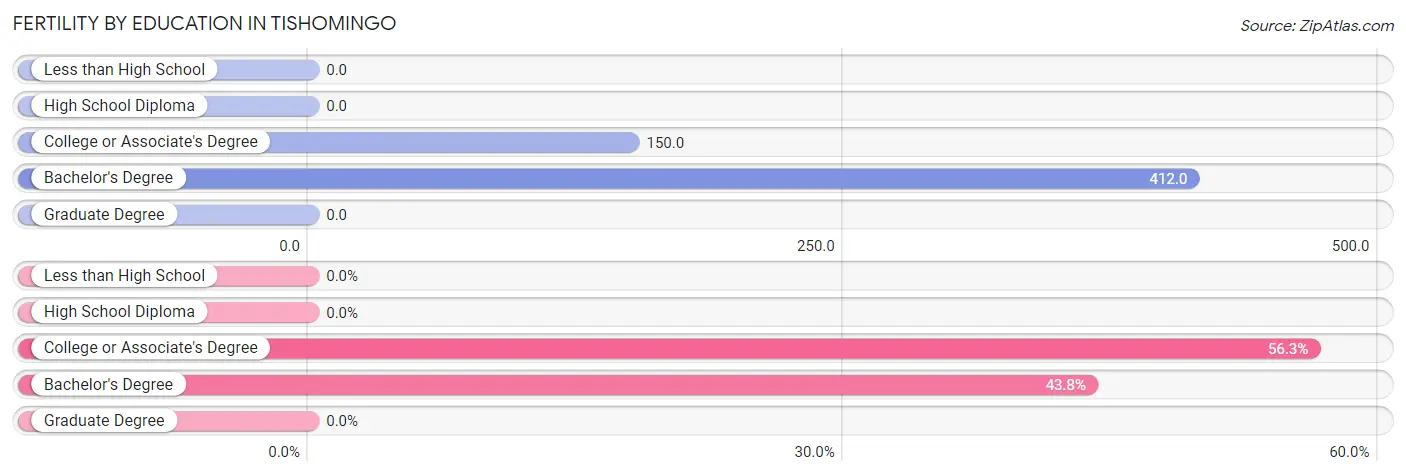
| Educational Attainment | Women with Births | Births / 1,000 Women |
| Less than High School | 0 (0.0%) | 0.0 |
| High School Diploma | 0 (0.0%) | 0.0 |
| College or Associate's Degree | 9 (56.2%) | 150.0 |
| Bachelor's Degree | 7 (43.8%) | 412.0 |
| Graduate Degree | 0 (0.0%) | 0.0 |
| Total | 16 (100.0%) | 128.0 |
Fertility by Education by Marriage Status in Tishomingo
37.5% of women with births in Tishomingo are unmarried. Women with the educational attainment of bachelor's degree are most likely to be married with 100.0% of them married at childbirth, while women with the educational attainment of college or associate's degree are least likely to be married with 66.7% of them unmarried at childbirth.
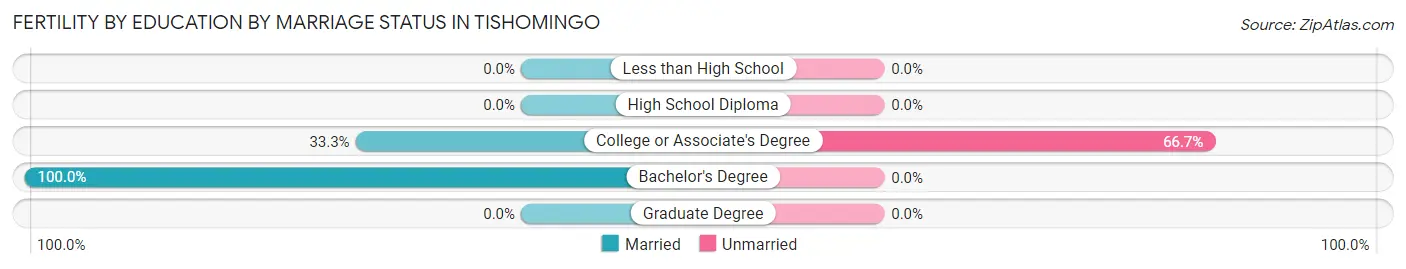
| Educational Attainment | Married | Unmarried |
| Less than High School | 0 (0.0%) | 0 (0.0%) |
| High School Diploma | 0 (0.0%) | 0 (0.0%) |
| College or Associate's Degree | 3 (33.3%) | 6 (66.7%) |
| Bachelor's Degree | 7 (100.0%) | 0 (0.0%) |
| Graduate Degree | 0 (0.0%) | 0 (0.0%) |
| Total | 10 (62.5%) | 6 (37.5%) |
Employment Characteristics in Tishomingo
Employment by Class of Employer in Tishomingo
Among the 222 employed individuals in Tishomingo, private company employees (135 | 60.8%), local government employees (33 | 14.9%), and state government employees (28 | 12.6%) make up the most common classes of employment.
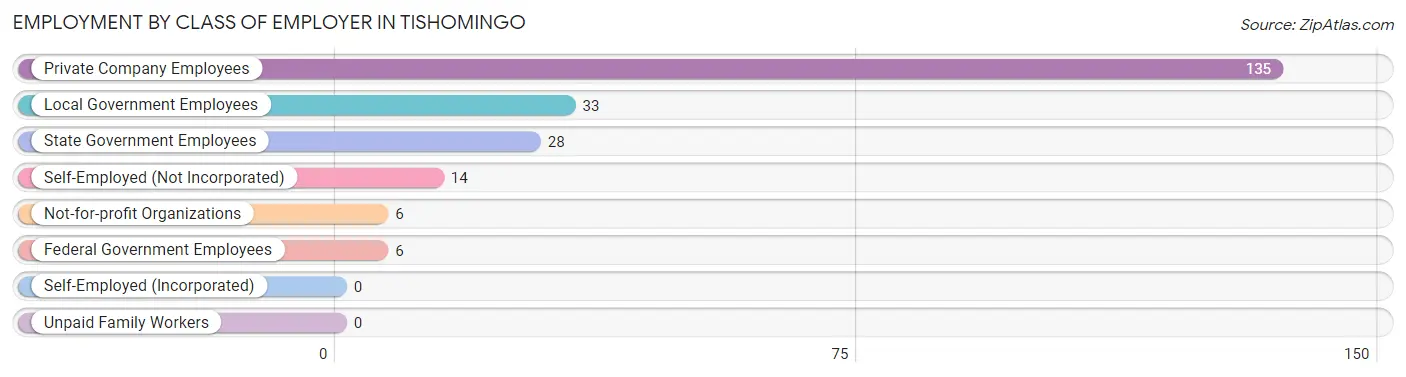
| Employer Class | # Employees | % Employees |
| Private Company Employees | 135 | 60.8% |
| Self-Employed (Incorporated) | 0 | 0.0% |
| Self-Employed (Not Incorporated) | 14 | 6.3% |
| Not-for-profit Organizations | 6 | 2.7% |
| Local Government Employees | 33 | 14.9% |
| State Government Employees | 28 | 12.6% |
| Federal Government Employees | 6 | 2.7% |
| Unpaid Family Workers | 0 | 0.0% |
| Total | 222 | 100.0% |
Employment Status by Age in Tishomingo
According to the labor force statistics for Tishomingo, out of the total population over 16 years of age (395), 56.7% or 224 individuals are in the labor force, with 0.9% or 2 of them unemployed. The age group with the highest labor force participation rate is 20 to 24 years, with 96.0% or 24 individuals in the labor force. Within the labor force, the 65 to 74 years age range has the highest percentage of unemployed individuals, with 25.0% or 2 of them being unemployed.
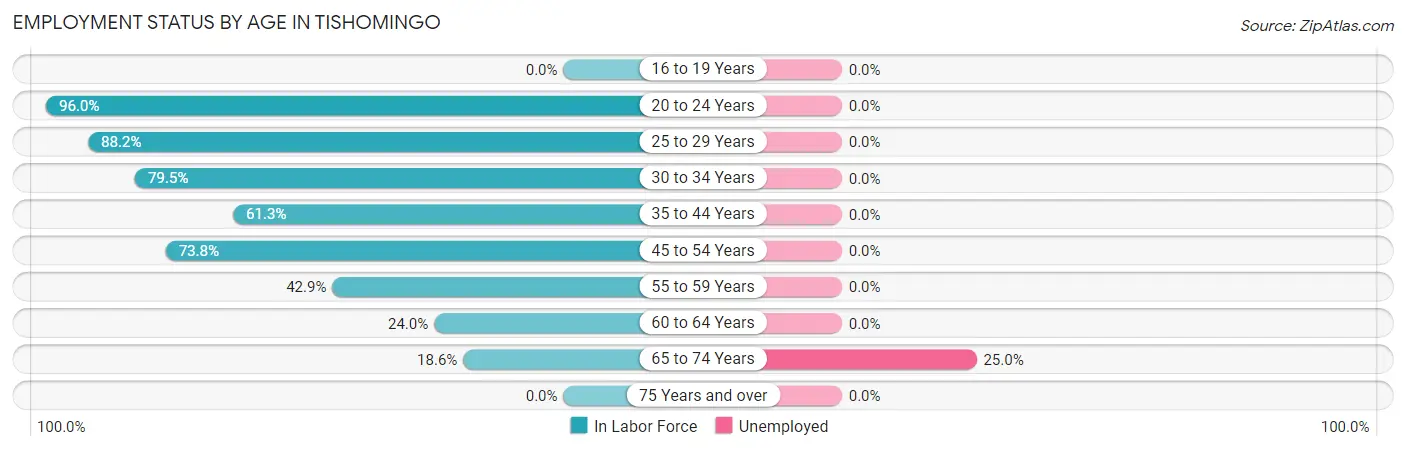
| Age Bracket | In Labor Force | Unemployed |
| 16 to 19 Years | 0 (0.0%) | 0 (0.0%) |
| 20 to 24 Years | 24 (96.0%) | 0 (0.0%) |
| 25 to 29 Years | 67 (88.2%) | 0 (0.0%) |
| 30 to 34 Years | 35 (79.5%) | 0 (0.0%) |
| 35 to 44 Years | 19 (61.3%) | 0 (0.0%) |
| 45 to 54 Years | 62 (73.8%) | 0 (0.0%) |
| 55 to 59 Years | 3 (42.9%) | 0 (0.0%) |
| 60 to 64 Years | 6 (24.0%) | 0 (0.0%) |
| 65 to 74 Years | 8 (18.6%) | 2 (25.0%) |
| 75 Years and over | 0 (0.0%) | 0 (0.0%) |
| Total | 224 (56.7%) | 2 (0.9%) |
Employment Status by Educational Attainment in Tishomingo
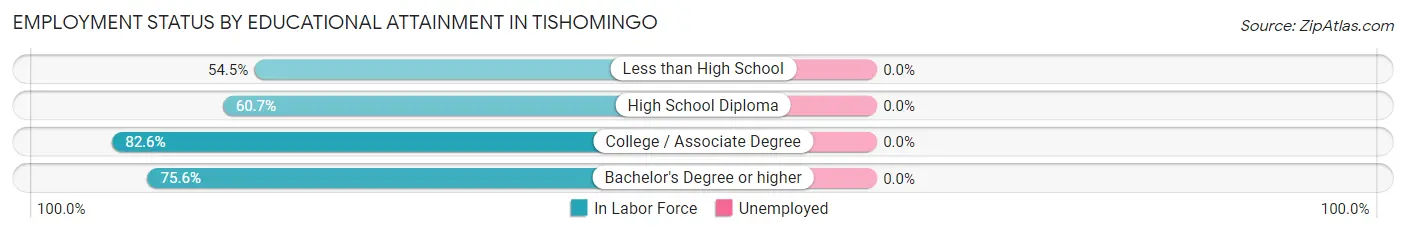
| Educational Attainment | In Labor Force | Unemployed |
| Less than High School | 24 (54.5%) | 0 (0.0%) |
| High School Diploma | 37 (60.7%) | 0 (0.0%) |
| College / Associate Degree | 100 (82.6%) | 0 (0.0%) |
| Bachelor's Degree or higher | 31 (75.6%) | 0 (0.0%) |
| Total | 192 (71.9%) | 0 (0.0%) |
Employment Occupations by Sex in Tishomingo
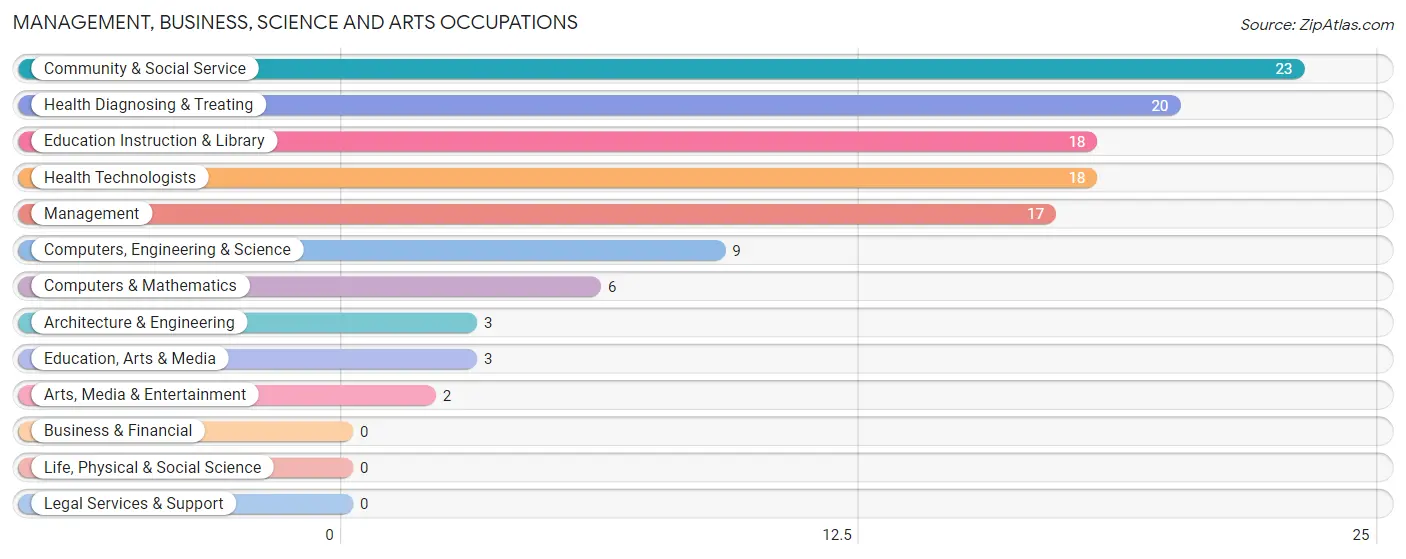
Management, Business, Science and Arts Occupations
The most common Management, Business, Science and Arts occupations in Tishomingo are Community & Social Service (23 | 10.4%), Health Diagnosing & Treating (20 | 9.0%), Education Instruction & Library (18 | 8.1%), Health Technologists (18 | 8.1%), and Management (17 | 7.7%).
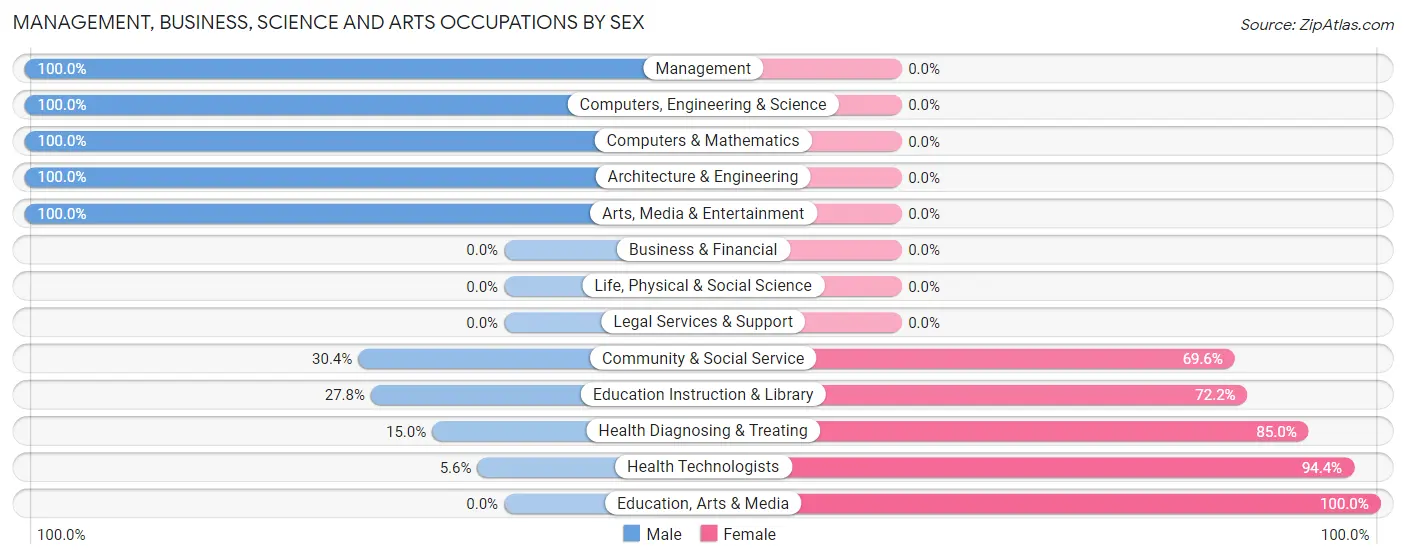
Management, Business, Science and Arts Occupations by Sex
Within the Management, Business, Science and Arts occupations in Tishomingo, the most male-oriented occupations are Management (100.0%), Computers, Engineering & Science (100.0%), and Computers & Mathematics (100.0%), while the most female-oriented occupations are Education, Arts & Media (100.0%), Health Technologists (94.4%), and Health Diagnosing & Treating (85.0%).
| Occupation | Male | Female |
| Management | 17 (100.0%) | 0 (0.0%) |
| Business & Financial | 0 (0.0%) | 0 (0.0%) |
| Computers, Engineering & Science | 9 (100.0%) | 0 (0.0%) |
| Computers & Mathematics | 6 (100.0%) | 0 (0.0%) |
| Architecture & Engineering | 3 (100.0%) | 0 (0.0%) |
| Life, Physical & Social Science | 0 (0.0%) | 0 (0.0%) |
| Community & Social Service | 7 (30.4%) | 16 (69.6%) |
| Education, Arts & Media | 0 (0.0%) | 3 (100.0%) |
| Legal Services & Support | 0 (0.0%) | 0 (0.0%) |
| Education Instruction & Library | 5 (27.8%) | 13 (72.2%) |
| Arts, Media & Entertainment | 2 (100.0%) | 0 (0.0%) |
| Health Diagnosing & Treating | 3 (15.0%) | 17 (85.0%) |
| Health Technologists | 1 (5.6%) | 17 (94.4%) |
| Total (Category) | 36 (52.2%) | 33 (47.8%) |
| Total (Overall) | 138 (62.2%) | 84 (37.8%) |
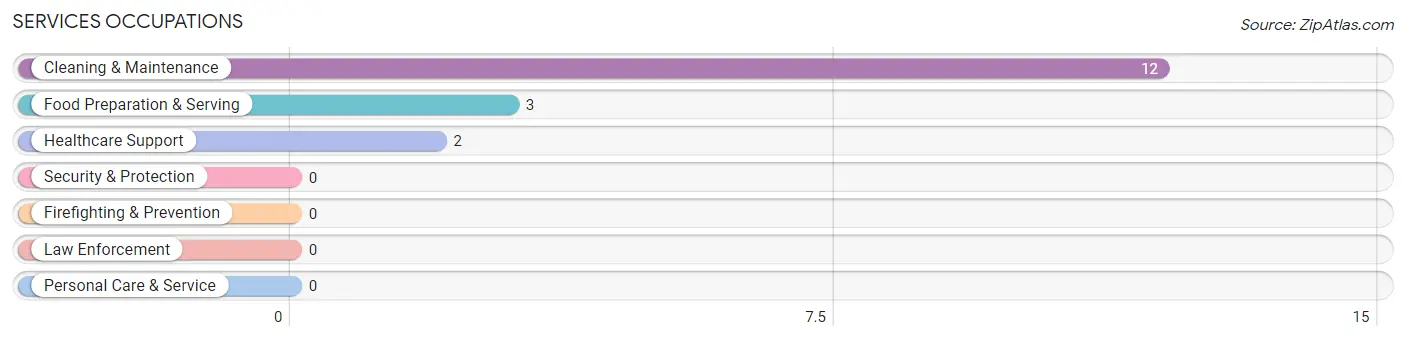
Services Occupations
The most common Services occupations in Tishomingo are Cleaning & Maintenance (12 | 5.4%), Food Preparation & Serving (3 | 1.3%), and Healthcare Support (2 | 0.9%).
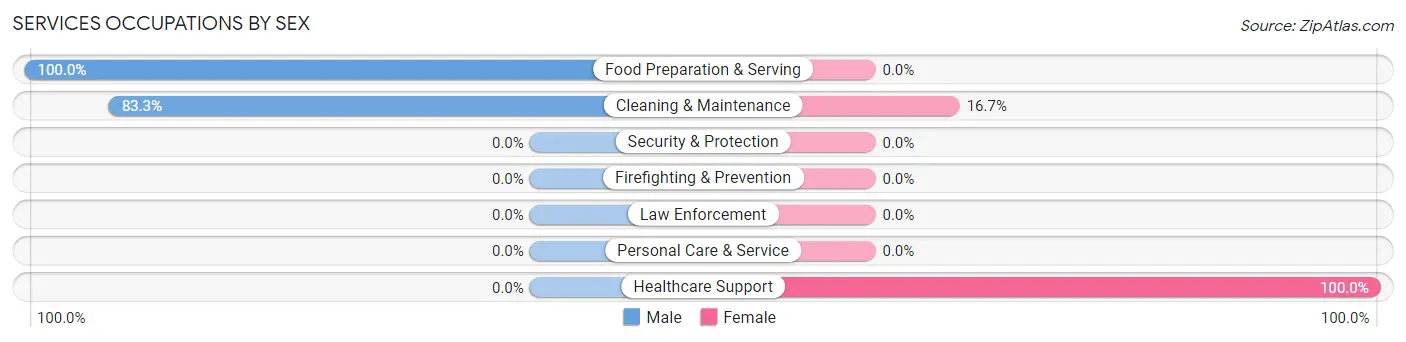
Services Occupations by Sex
Within the Services occupations in Tishomingo, the most male-oriented occupations are Food Preparation & Serving (100.0%), and Cleaning & Maintenance (83.3%), while the most female-oriented occupations are Healthcare Support (100.0%), and Cleaning & Maintenance (16.7%).
| Occupation | Male | Female |
| Healthcare Support | 0 (0.0%) | 2 (100.0%) |
| Security & Protection | 0 (0.0%) | 0 (0.0%) |
| Firefighting & Prevention | 0 (0.0%) | 0 (0.0%) |
| Law Enforcement | 0 (0.0%) | 0 (0.0%) |
| Food Preparation & Serving | 3 (100.0%) | 0 (0.0%) |
| Cleaning & Maintenance | 10 (83.3%) | 2 (16.7%) |
| Personal Care & Service | 0 (0.0%) | 0 (0.0%) |
| Total (Category) | 13 (76.5%) | 4 (23.5%) |
| Total (Overall) | 138 (62.2%) | 84 (37.8%) |
Sales and Office Occupations
The most common Sales and Office occupations in Tishomingo are Office & Administration (34 | 15.3%), and Sales & Related (16 | 7.2%).
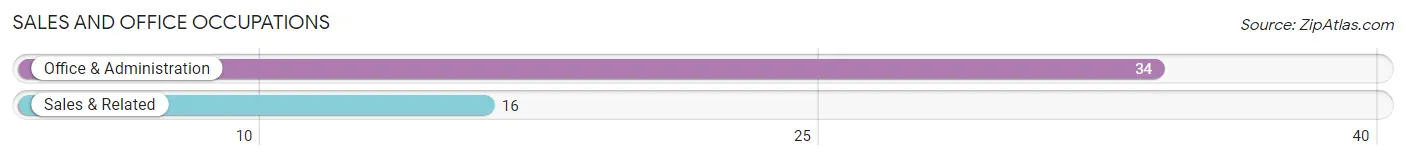
Sales and Office Occupations by Sex
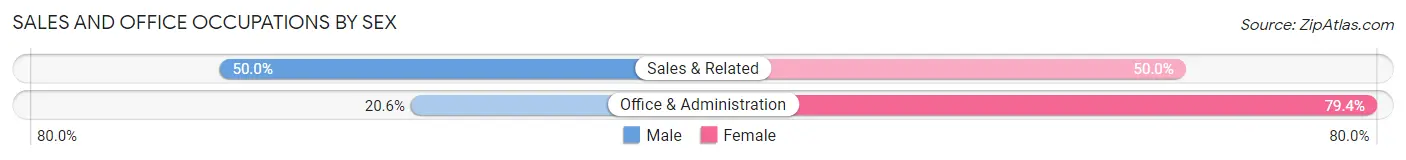
| Occupation | Male | Female |
| Sales & Related | 8 (50.0%) | 8 (50.0%) |
| Office & Administration | 7 (20.6%) | 27 (79.4%) |
| Total (Category) | 15 (30.0%) | 35 (70.0%) |
| Total (Overall) | 138 (62.2%) | 84 (37.8%) |
Natural Resources, Construction and Maintenance Occupations
The most common Natural Resources, Construction and Maintenance occupations in Tishomingo are Construction & Extraction (8 | 3.6%), and Installation, Maintenance & Repair (6 | 2.7%).
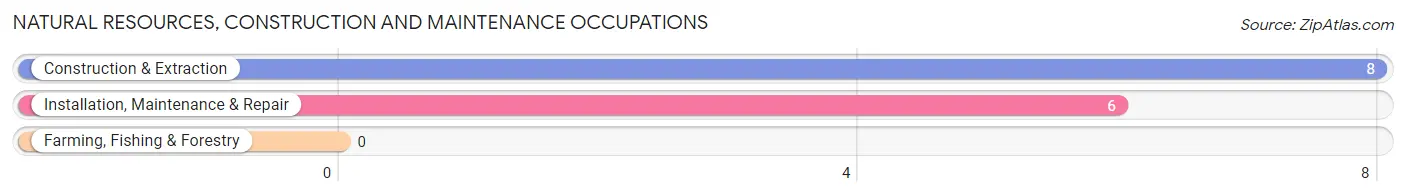
Natural Resources, Construction and Maintenance Occupations by Sex
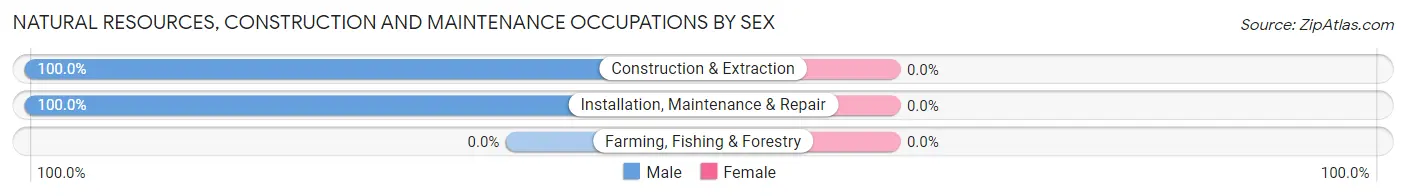
| Occupation | Male | Female |
| Farming, Fishing & Forestry | 0 (0.0%) | 0 (0.0%) |
| Construction & Extraction | 8 (100.0%) | 0 (0.0%) |
| Installation, Maintenance & Repair | 6 (100.0%) | 0 (0.0%) |
| Total (Category) | 14 (100.0%) | 0 (0.0%) |
| Total (Overall) | 138 (62.2%) | 84 (37.8%) |
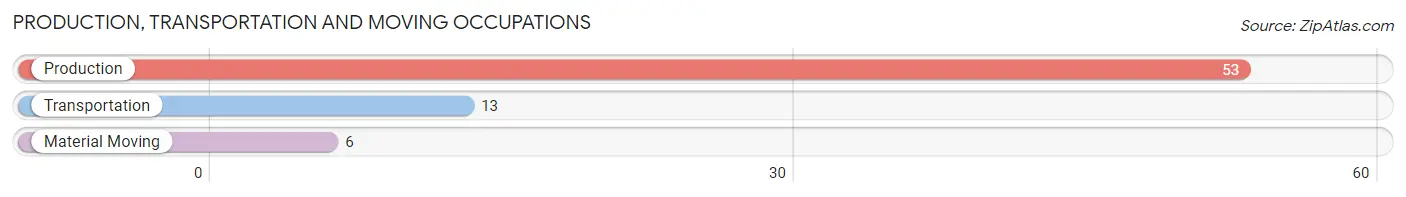
Production, Transportation and Moving Occupations
The most common Production, Transportation and Moving occupations in Tishomingo are Production (53 | 23.9%), Transportation (13 | 5.9%), and Material Moving (6 | 2.7%).
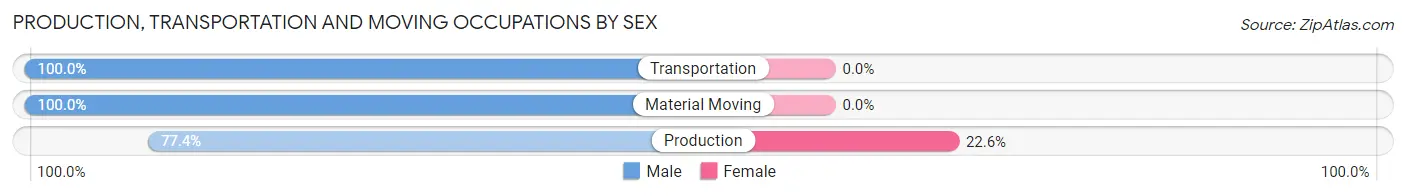
Production, Transportation and Moving Occupations by Sex
| Occupation | Male | Female |
| Production | 41 (77.4%) | 12 (22.6%) |
| Transportation | 13 (100.0%) | 0 (0.0%) |
| Material Moving | 6 (100.0%) | 0 (0.0%) |
| Total (Category) | 60 (83.3%) | 12 (16.7%) |
| Total (Overall) | 138 (62.2%) | 84 (37.8%) |
Employment Industries by Sex in Tishomingo
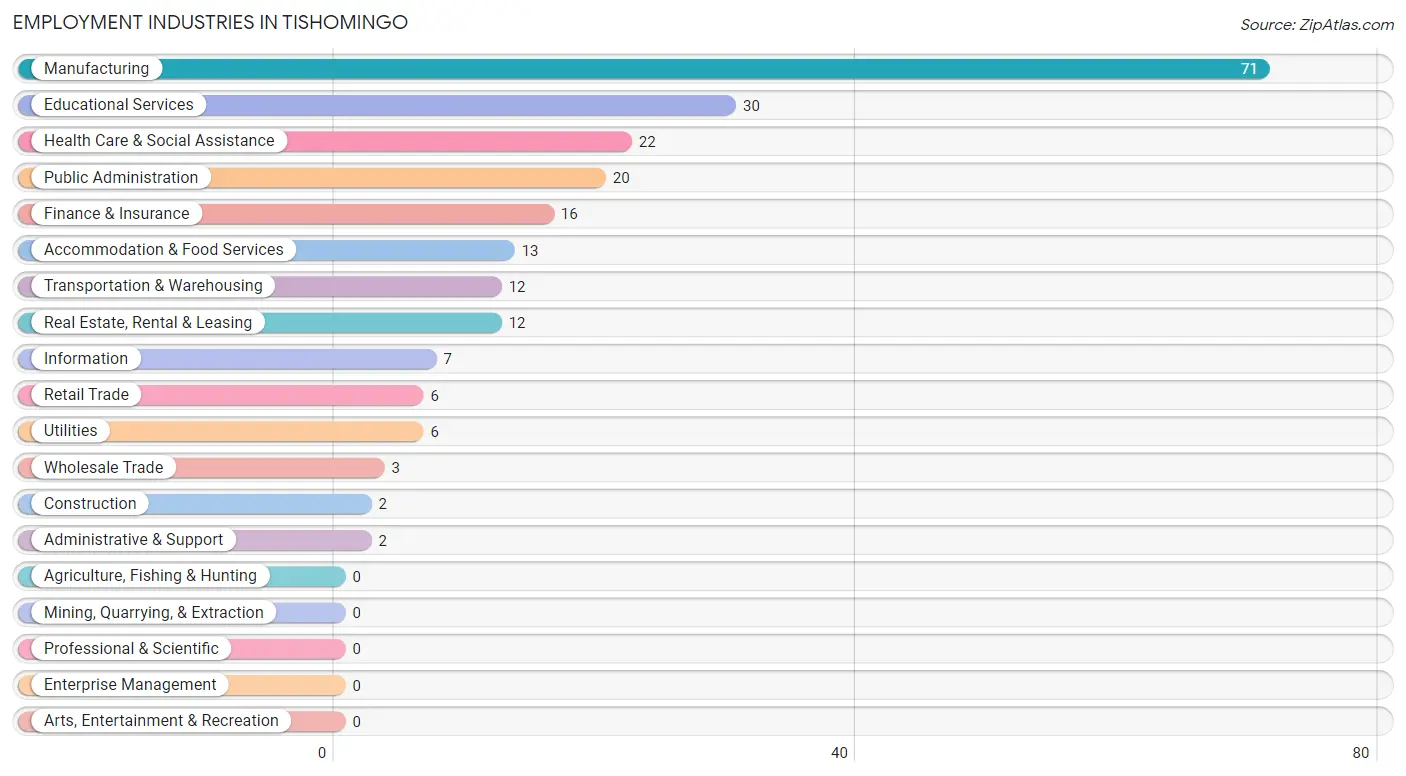
Employment Industries in Tishomingo
The major employment industries in Tishomingo include Manufacturing (71 | 32.0%), Educational Services (30 | 13.5%), Health Care & Social Assistance (22 | 9.9%), Public Administration (20 | 9.0%), and Finance & Insurance (16 | 7.2%).
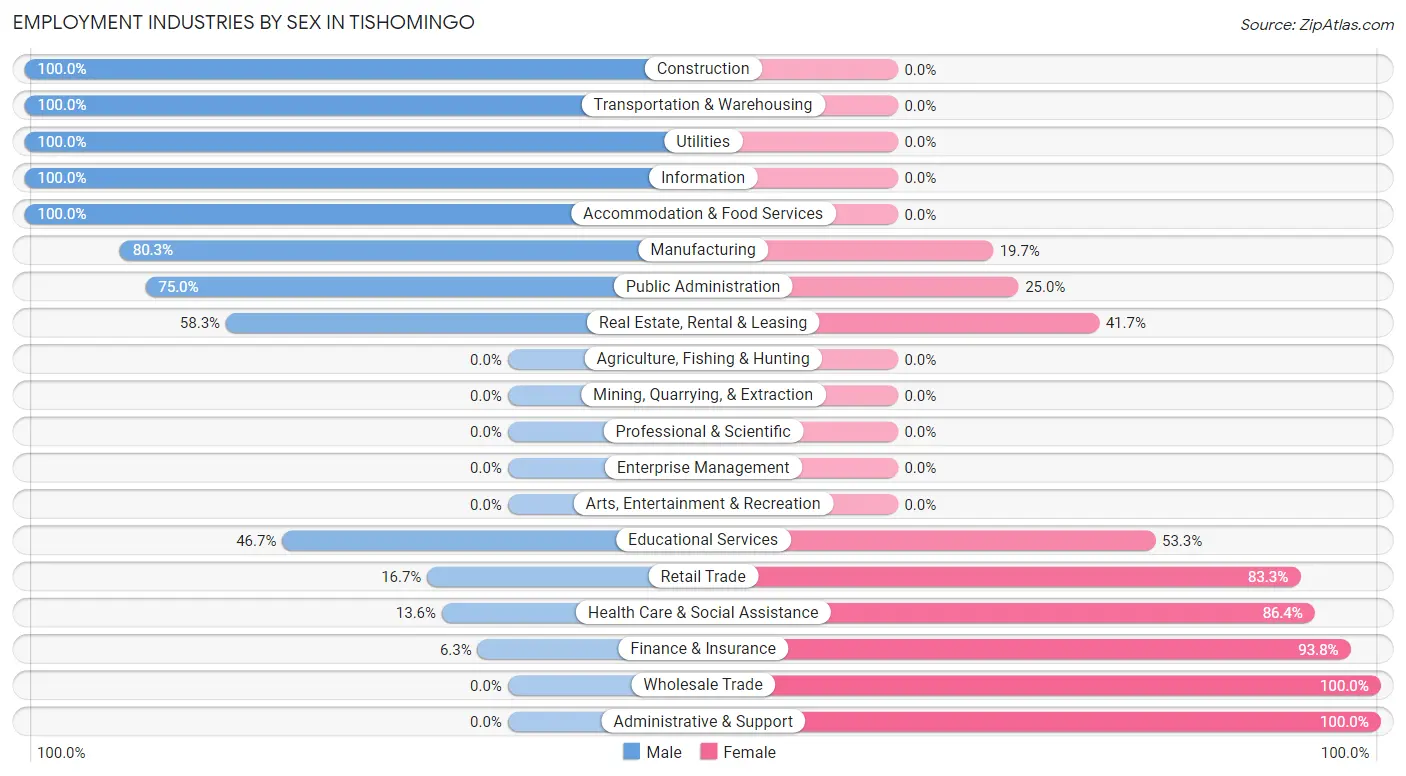
Employment Industries by Sex in Tishomingo
The Tishomingo industries that see more men than women are Construction (100.0%), Transportation & Warehousing (100.0%), and Utilities (100.0%), whereas the industries that tend to have a higher number of women are Wholesale Trade (100.0%), Administrative & Support (100.0%), and Finance & Insurance (93.8%).
| Industry | Male | Female |
| Agriculture, Fishing & Hunting | 0 (0.0%) | 0 (0.0%) |
| Mining, Quarrying, & Extraction | 0 (0.0%) | 0 (0.0%) |
| Construction | 2 (100.0%) | 0 (0.0%) |
| Manufacturing | 57 (80.3%) | 14 (19.7%) |
| Wholesale Trade | 0 (0.0%) | 3 (100.0%) |
| Retail Trade | 1 (16.7%) | 5 (83.3%) |
| Transportation & Warehousing | 12 (100.0%) | 0 (0.0%) |
| Utilities | 6 (100.0%) | 0 (0.0%) |
| Information | 7 (100.0%) | 0 (0.0%) |
| Finance & Insurance | 1 (6.2%) | 15 (93.8%) |
| Real Estate, Rental & Leasing | 7 (58.3%) | 5 (41.7%) |
| Professional & Scientific | 0 (0.0%) | 0 (0.0%) |
| Enterprise Management | 0 (0.0%) | 0 (0.0%) |
| Administrative & Support | 0 (0.0%) | 2 (100.0%) |
| Educational Services | 14 (46.7%) | 16 (53.3%) |
| Health Care & Social Assistance | 3 (13.6%) | 19 (86.4%) |
| Arts, Entertainment & Recreation | 0 (0.0%) | 0 (0.0%) |
| Accommodation & Food Services | 13 (100.0%) | 0 (0.0%) |
| Public Administration | 15 (75.0%) | 5 (25.0%) |
| Total | 138 (62.2%) | 84 (37.8%) |
Education in Tishomingo
School Enrollment in Tishomingo
The most common levels of schooling among the 81 students in Tishomingo are elementary school (38 | 46.9%), high school (19 | 23.5%), and college / undergraduate (9 | 11.1%).
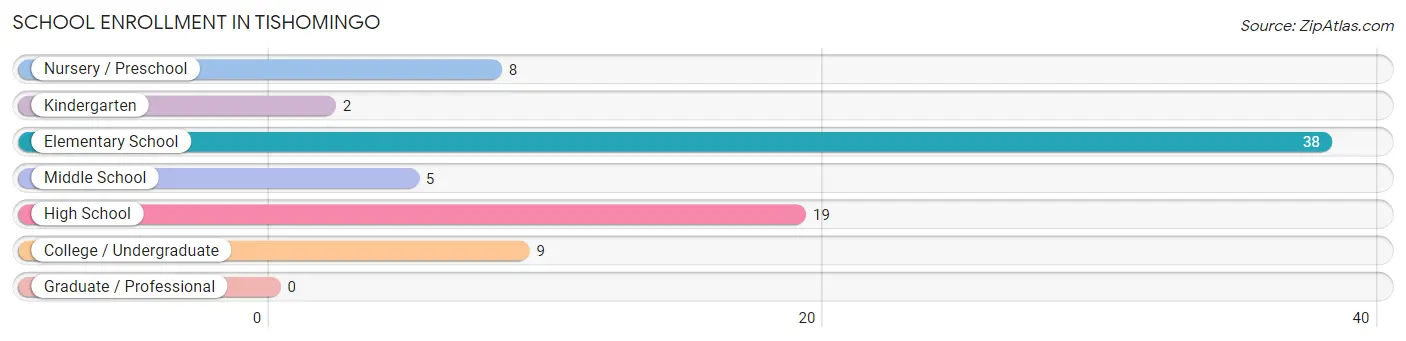
| School Level | # Students | % Students |
| Nursery / Preschool | 8 | 9.9% |
| Kindergarten | 2 | 2.5% |
| Elementary School | 38 | 46.9% |
| Middle School | 5 | 6.2% |
| High School | 19 | 23.5% |
| College / Undergraduate | 9 | 11.1% |
| Graduate / Professional | 0 | 0.0% |
| Total | 81 | 100.0% |
School Enrollment by Age by Funding Source in Tishomingo
Out of a total of 81 students who are enrolled in schools in Tishomingo, 3 (3.7%) attend a private institution, while the remaining 78 (96.3%) are enrolled in public schools. The age group of 20 to 24 year olds has the highest likelihood of being enrolled in private schools, with 1 (50.0% in the age bracket) enrolled. Conversely, the age group of 3 to 4 year olds has the lowest likelihood of being enrolled in a private school, with 8 (100.0% in the age bracket) attending a public institution.
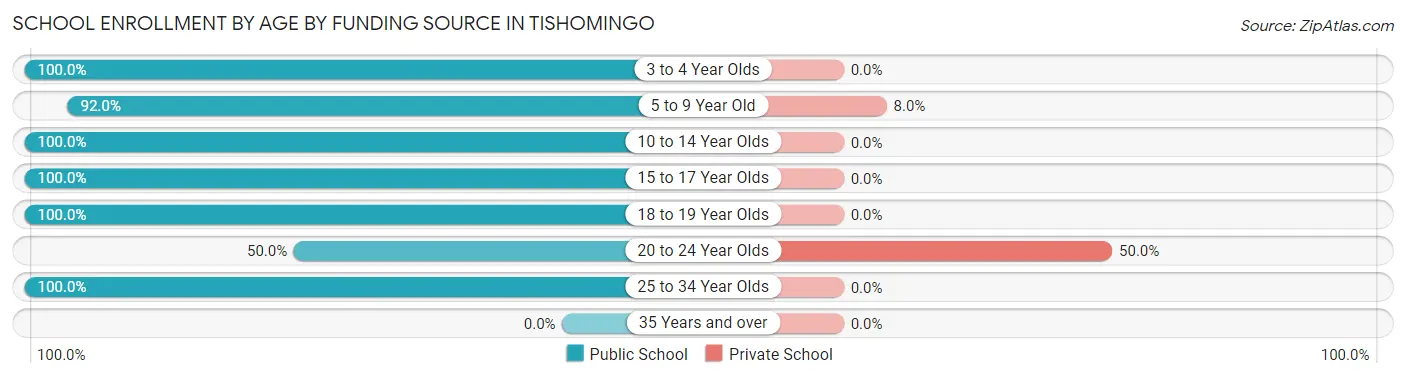
| Age Bracket | Public School | Private School |
| 3 to 4 Year Olds | 8 (100.0%) | 0 (0.0%) |
| 5 to 9 Year Old | 23 (92.0%) | 2 (8.0%) |
| 10 to 14 Year Olds | 20 (100.0%) | 0 (0.0%) |
| 15 to 17 Year Olds | 14 (100.0%) | 0 (0.0%) |
| 18 to 19 Year Olds | 7 (100.0%) | 0 (0.0%) |
| 20 to 24 Year Olds | 1 (50.0%) | 1 (50.0%) |
| 25 to 34 Year Olds | 5 (100.0%) | 0 (0.0%) |
| 35 Years and over | 0 (0.0%) | 0 (0.0%) |
| Total | 78 (96.3%) | 3 (3.7%) |
Educational Attainment by Field of Study in Tishomingo
Business (15 | 27.3%), education (13 | 23.6%), bio, nature & agricultural (7 | 12.7%), engineering (6 | 10.9%), and computers & mathematics (5 | 9.1%) are the most common fields of study among 55 individuals in Tishomingo who have obtained a bachelor's degree or higher.
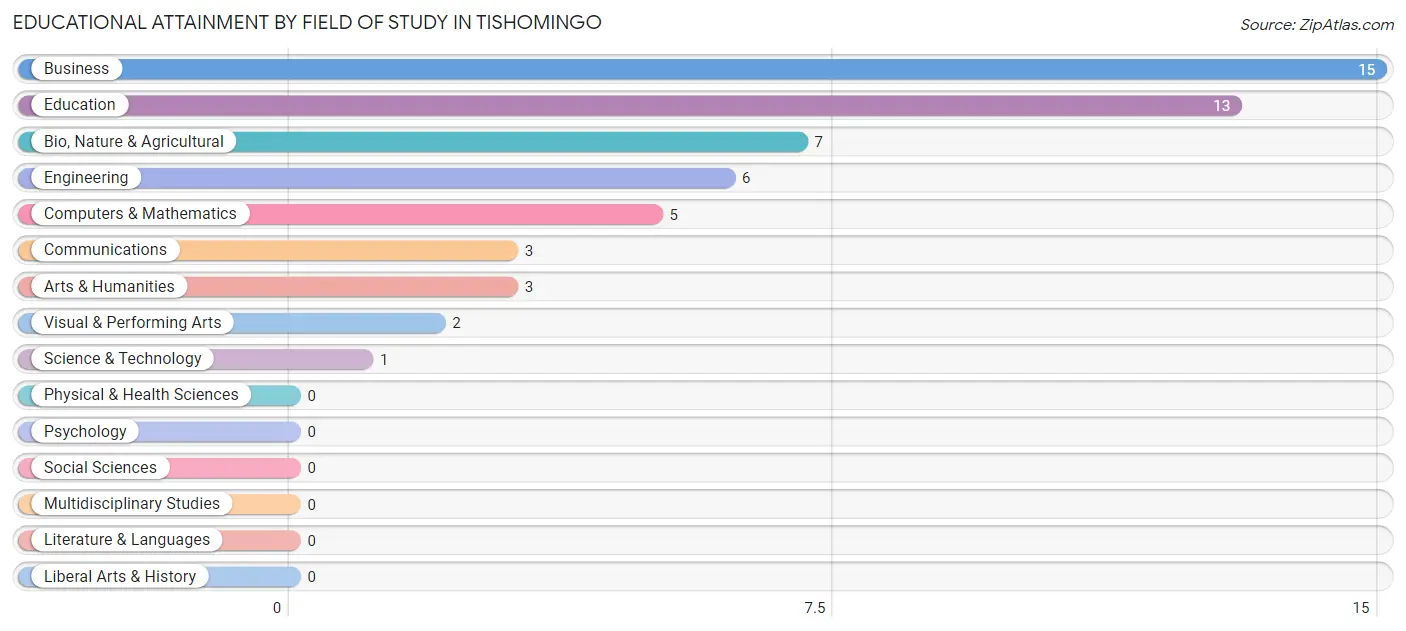
| Field of Study | # Graduates | % Graduates |
| Computers & Mathematics | 5 | 9.1% |
| Bio, Nature & Agricultural | 7 | 12.7% |
| Physical & Health Sciences | 0 | 0.0% |
| Psychology | 0 | 0.0% |
| Social Sciences | 0 | 0.0% |
| Engineering | 6 | 10.9% |
| Multidisciplinary Studies | 0 | 0.0% |
| Science & Technology | 1 | 1.8% |
| Business | 15 | 27.3% |
| Education | 13 | 23.6% |
| Literature & Languages | 0 | 0.0% |
| Liberal Arts & History | 0 | 0.0% |
| Visual & Performing Arts | 2 | 3.6% |
| Communications | 3 | 5.4% |
| Arts & Humanities | 3 | 5.4% |
| Total | 55 | 100.0% |
Transportation & Commute in Tishomingo
Vehicle Availability by Sex in Tishomingo
The most prevalent vehicle ownership categories in Tishomingo are males with 2 vehicles (66, accounting for 47.8%) and females with 2 vehicles (27, making up 78.6%).
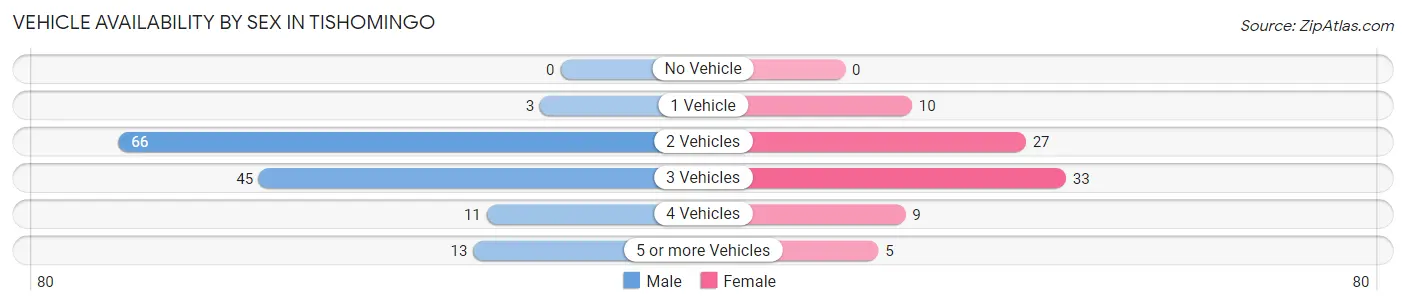
| Vehicles Available | Male | Female |
| No Vehicle | 0 (0.0%) | 0 (0.0%) |
| 1 Vehicle | 3 (2.2%) | 10 (11.9%) |
| 2 Vehicles | 66 (47.8%) | 27 (32.1%) |
| 3 Vehicles | 45 (32.6%) | 33 (39.3%) |
| 4 Vehicles | 11 (8.0%) | 9 (10.7%) |
| 5 or more Vehicles | 13 (9.4%) | 5 (5.9%) |
| Total | 138 (100.0%) | 84 (100.0%) |
Commute Time in Tishomingo
The most frequently occuring commute durations in Tishomingo are less than 5 minutes (38 commuters, 17.3%), 15 to 19 minutes (35 commuters, 15.9%), and 60 to 89 minutes (31 commuters, 14.1%).
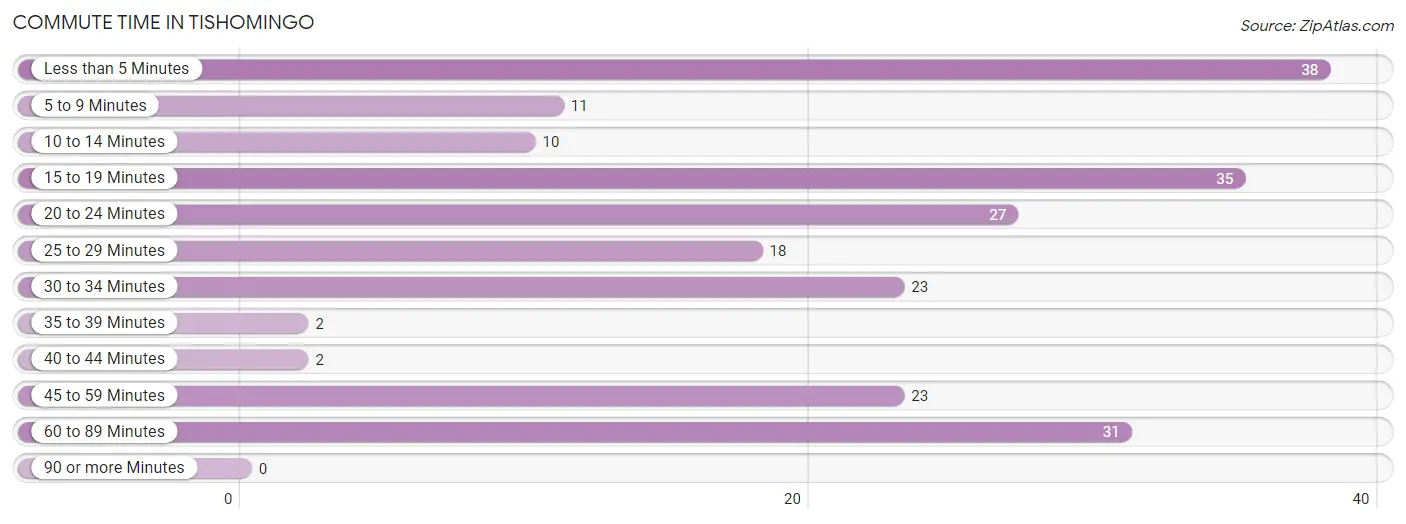
| Commute Time | # Commuters | % Commuters |
| Less than 5 Minutes | 38 | 17.3% |
| 5 to 9 Minutes | 11 | 5.0% |
| 10 to 14 Minutes | 10 | 4.5% |
| 15 to 19 Minutes | 35 | 15.9% |
| 20 to 24 Minutes | 27 | 12.3% |
| 25 to 29 Minutes | 18 | 8.2% |
| 30 to 34 Minutes | 23 | 10.4% |
| 35 to 39 Minutes | 2 | 0.9% |
| 40 to 44 Minutes | 2 | 0.9% |
| 45 to 59 Minutes | 23 | 10.4% |
| 60 to 89 Minutes | 31 | 14.1% |
| 90 or more Minutes | 0 | 0.0% |
Commute Time by Sex in Tishomingo
The most common commute times in Tishomingo are 60 to 89 minutes (31 commuters, 22.8%) for males and 15 to 19 minutes (24 commuters, 28.6%) for females.
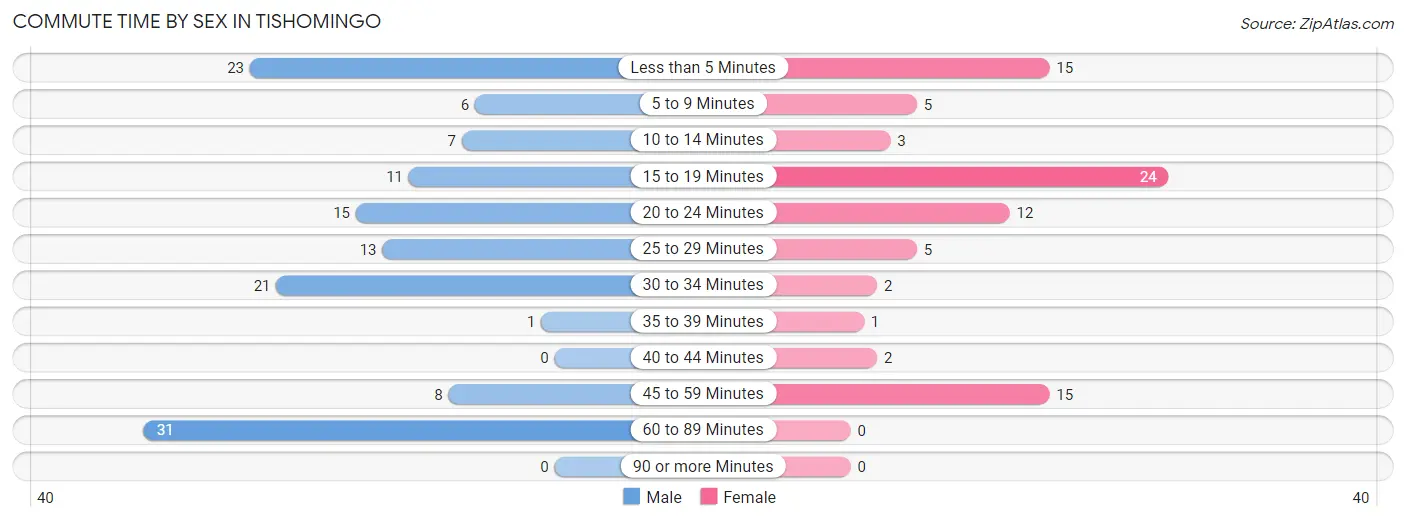
| Commute Time | Male | Female |
| Less than 5 Minutes | 23 (16.9%) | 15 (17.9%) |
| 5 to 9 Minutes | 6 (4.4%) | 5 (5.9%) |
| 10 to 14 Minutes | 7 (5.1%) | 3 (3.6%) |
| 15 to 19 Minutes | 11 (8.1%) | 24 (28.6%) |
| 20 to 24 Minutes | 15 (11.0%) | 12 (14.3%) |
| 25 to 29 Minutes | 13 (9.6%) | 5 (5.9%) |
| 30 to 34 Minutes | 21 (15.4%) | 2 (2.4%) |
| 35 to 39 Minutes | 1 (0.7%) | 1 (1.2%) |
| 40 to 44 Minutes | 0 (0.0%) | 2 (2.4%) |
| 45 to 59 Minutes | 8 (5.9%) | 15 (17.9%) |
| 60 to 89 Minutes | 31 (22.8%) | 0 (0.0%) |
| 90 or more Minutes | 0 (0.0%) | 0 (0.0%) |
Time of Departure to Work by Sex in Tishomingo
The most frequent times of departure to work in Tishomingo are 6:00 AM to 6:29 AM (37, 27.2%) for males and 5:30 AM to 5:59 AM (19, 22.6%) for females.
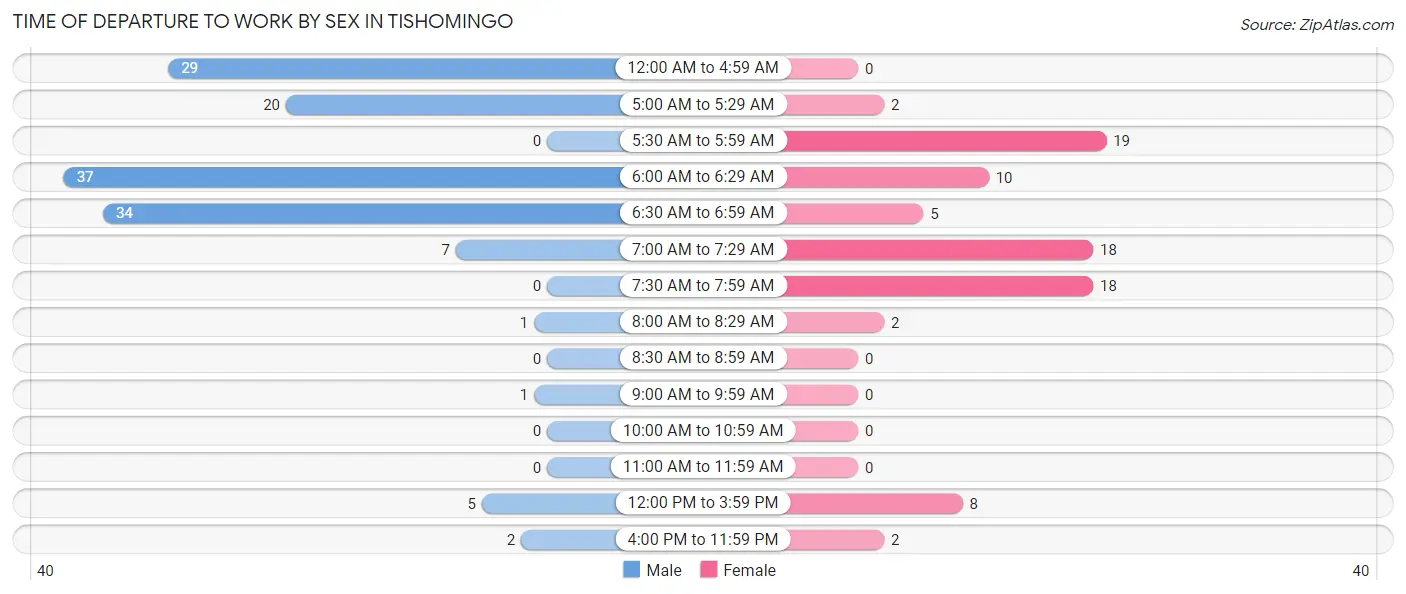
| Time of Departure | Male | Female |
| 12:00 AM to 4:59 AM | 29 (21.3%) | 0 (0.0%) |
| 5:00 AM to 5:29 AM | 20 (14.7%) | 2 (2.4%) |
| 5:30 AM to 5:59 AM | 0 (0.0%) | 19 (22.6%) |
| 6:00 AM to 6:29 AM | 37 (27.2%) | 10 (11.9%) |
| 6:30 AM to 6:59 AM | 34 (25.0%) | 5 (5.9%) |
| 7:00 AM to 7:29 AM | 7 (5.1%) | 18 (21.4%) |
| 7:30 AM to 7:59 AM | 0 (0.0%) | 18 (21.4%) |
| 8:00 AM to 8:29 AM | 1 (0.7%) | 2 (2.4%) |
| 8:30 AM to 8:59 AM | 0 (0.0%) | 0 (0.0%) |
| 9:00 AM to 9:59 AM | 1 (0.7%) | 0 (0.0%) |
| 10:00 AM to 10:59 AM | 0 (0.0%) | 0 (0.0%) |
| 11:00 AM to 11:59 AM | 0 (0.0%) | 0 (0.0%) |
| 12:00 PM to 3:59 PM | 5 (3.7%) | 8 (9.5%) |
| 4:00 PM to 11:59 PM | 2 (1.5%) | 2 (2.4%) |
| Total | 136 (100.0%) | 84 (100.0%) |
Housing Occupancy in Tishomingo
Occupancy by Ownership in Tishomingo
Of the total 224 dwellings in Tishomingo, owner-occupied units account for 157 (70.1%), while renter-occupied units make up 67 (29.9%).
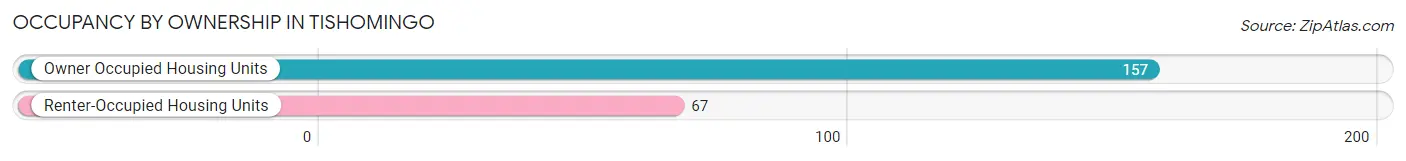
| Occupancy | # Housing Units | % Housing Units |
| Owner Occupied Housing Units | 157 | 70.1% |
| Renter-Occupied Housing Units | 67 | 29.9% |
| Total Occupied Housing Units | 224 | 100.0% |
Occupancy by Household Size in Tishomingo
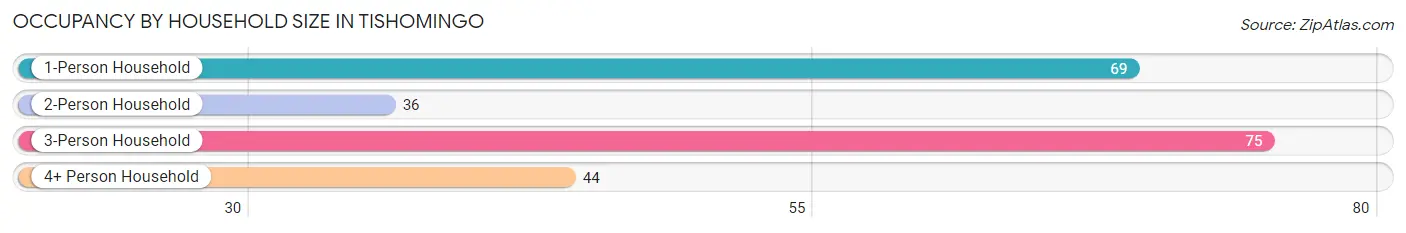
| Household Size | # Housing Units | % Housing Units |
| 1-Person Household | 69 | 30.8% |
| 2-Person Household | 36 | 16.1% |
| 3-Person Household | 75 | 33.5% |
| 4+ Person Household | 44 | 19.6% |
| Total Housing Units | 224 | 100.0% |
Occupancy by Ownership by Household Size in Tishomingo
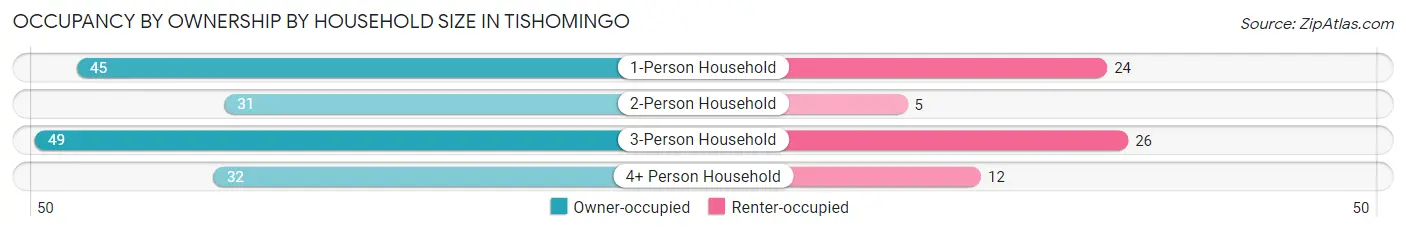
| Household Size | Owner-occupied | Renter-occupied |
| 1-Person Household | 45 (65.2%) | 24 (34.8%) |
| 2-Person Household | 31 (86.1%) | 5 (13.9%) |
| 3-Person Household | 49 (65.3%) | 26 (34.7%) |
| 4+ Person Household | 32 (72.7%) | 12 (27.3%) |
| Total Housing Units | 157 (70.1%) | 67 (29.9%) |
Occupancy by Educational Attainment in Tishomingo
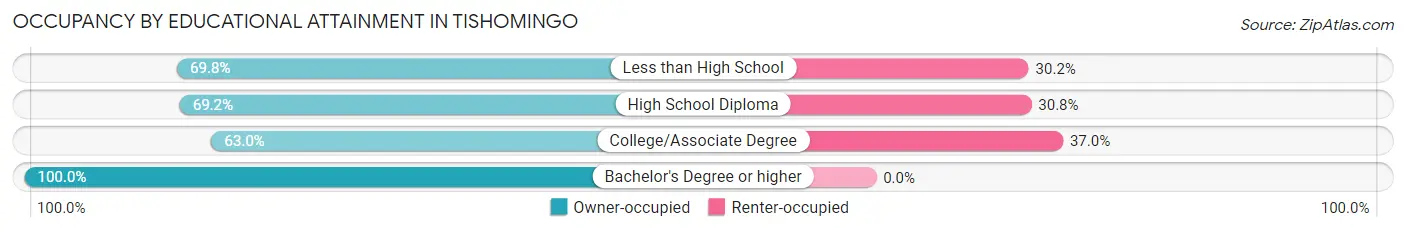
| Household Size | Owner-occupied | Renter-occupied |
| Less than High School | 30 (69.8%) | 13 (30.2%) |
| High School Diploma | 54 (69.2%) | 24 (30.8%) |
| College/Associate Degree | 51 (63.0%) | 30 (37.0%) |
| Bachelor's Degree or higher | 22 (100.0%) | 0 (0.0%) |
Occupancy by Age of Householder in Tishomingo
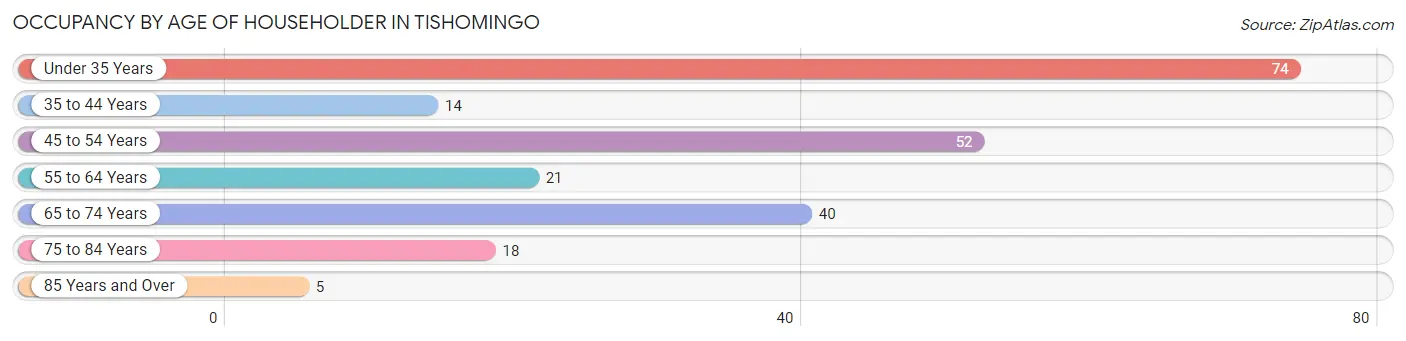
| Age Bracket | # Households | % Households |
| Under 35 Years | 74 | 33.0% |
| 35 to 44 Years | 14 | 6.2% |
| 45 to 54 Years | 52 | 23.2% |
| 55 to 64 Years | 21 | 9.4% |
| 65 to 74 Years | 40 | 17.9% |
| 75 to 84 Years | 18 | 8.0% |
| 85 Years and Over | 5 | 2.2% |
| Total | 224 | 100.0% |
Housing Finances in Tishomingo
Median Income by Occupancy in Tishomingo
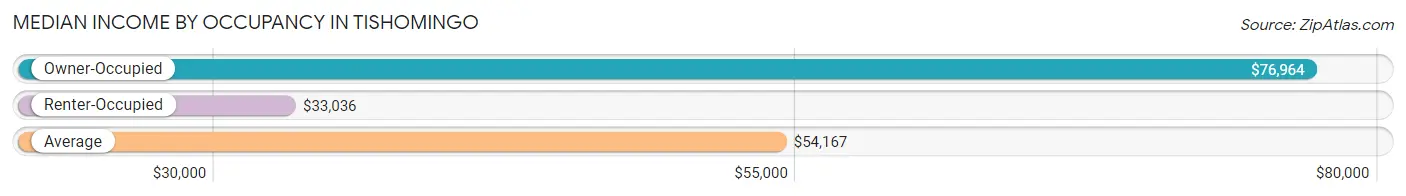
| Occupancy Type | # Households | Median Income |
| Owner-Occupied | 157 (70.1%) | $76,964 |
| Renter-Occupied | 67 (29.9%) | $33,036 |
| Average | 224 (100.0%) | $54,167 |
Occupancy by Householder Income Bracket in Tishomingo
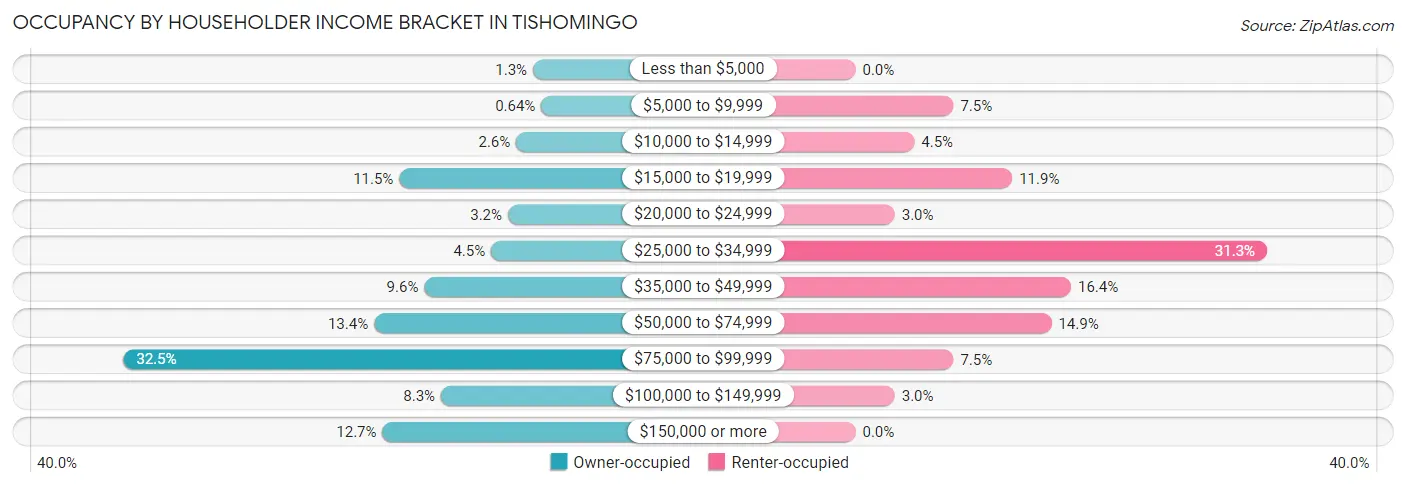
| Income Bracket | Owner-occupied | Renter-occupied |
| Less than $5,000 | 2 (1.3%) | 0 (0.0%) |
| $5,000 to $9,999 | 1 (0.6%) | 5 (7.5%) |
| $10,000 to $14,999 | 4 (2.5%) | 3 (4.5%) |
| $15,000 to $19,999 | 18 (11.5%) | 8 (11.9%) |
| $20,000 to $24,999 | 5 (3.2%) | 2 (3.0%) |
| $25,000 to $34,999 | 7 (4.5%) | 21 (31.3%) |
| $35,000 to $49,999 | 15 (9.6%) | 11 (16.4%) |
| $50,000 to $74,999 | 21 (13.4%) | 10 (14.9%) |
| $75,000 to $99,999 | 51 (32.5%) | 5 (7.5%) |
| $100,000 to $149,999 | 13 (8.3%) | 2 (3.0%) |
| $150,000 or more | 20 (12.7%) | 0 (0.0%) |
| Total | 157 (100.0%) | 67 (100.0%) |
Monthly Housing Cost Tiers in Tishomingo
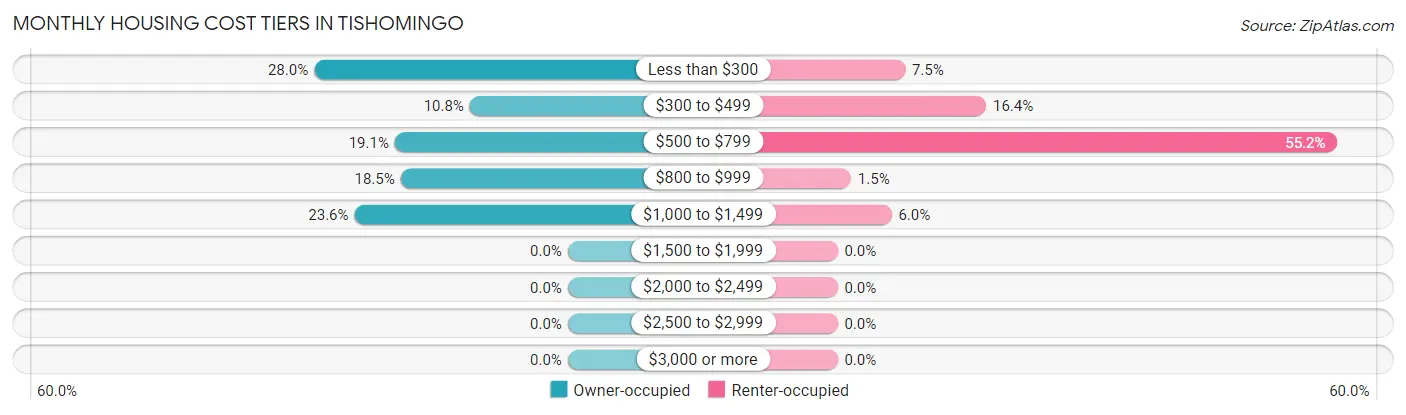
| Monthly Cost | Owner-occupied | Renter-occupied |
| Less than $300 | 44 (28.0%) | 5 (7.5%) |
| $300 to $499 | 17 (10.8%) | 11 (16.4%) |
| $500 to $799 | 30 (19.1%) | 37 (55.2%) |
| $800 to $999 | 29 (18.5%) | 1 (1.5%) |
| $1,000 to $1,499 | 37 (23.6%) | 4 (6.0%) |
| $1,500 to $1,999 | 0 (0.0%) | 0 (0.0%) |
| $2,000 to $2,499 | 0 (0.0%) | 0 (0.0%) |
| $2,500 to $2,999 | 0 (0.0%) | 0 (0.0%) |
| $3,000 or more | 0 (0.0%) | 0 (0.0%) |
| Total | 157 (100.0%) | 67 (100.0%) |
Physical Housing Characteristics in Tishomingo
Housing Structures in Tishomingo
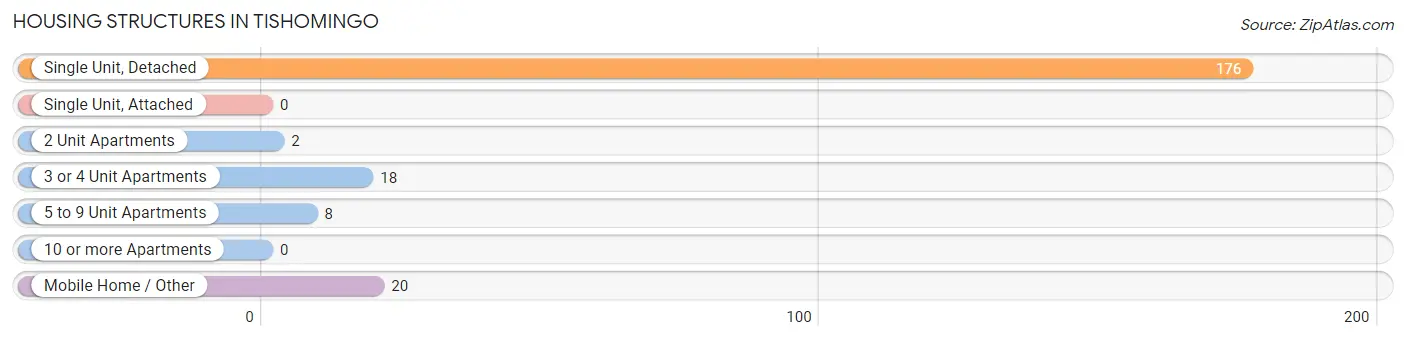
| Structure Type | # Housing Units | % Housing Units |
| Single Unit, Detached | 176 | 78.6% |
| Single Unit, Attached | 0 | 0.0% |
| 2 Unit Apartments | 2 | 0.9% |
| 3 or 4 Unit Apartments | 18 | 8.0% |
| 5 to 9 Unit Apartments | 8 | 3.6% |
| 10 or more Apartments | 0 | 0.0% |
| Mobile Home / Other | 20 | 8.9% |
| Total | 224 | 100.0% |
Housing Structures by Occupancy in Tishomingo
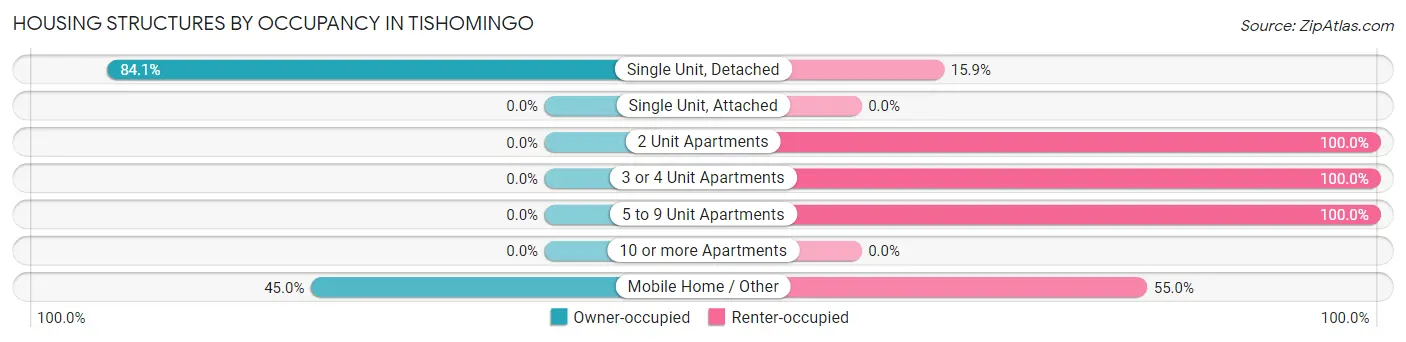
| Structure Type | Owner-occupied | Renter-occupied |
| Single Unit, Detached | 148 (84.1%) | 28 (15.9%) |
| Single Unit, Attached | 0 (0.0%) | 0 (0.0%) |
| 2 Unit Apartments | 0 (0.0%) | 2 (100.0%) |
| 3 or 4 Unit Apartments | 0 (0.0%) | 18 (100.0%) |
| 5 to 9 Unit Apartments | 0 (0.0%) | 8 (100.0%) |
| 10 or more Apartments | 0 (0.0%) | 0 (0.0%) |
| Mobile Home / Other | 9 (45.0%) | 11 (55.0%) |
| Total | 157 (70.1%) | 67 (29.9%) |
Housing Structures by Number of Rooms in Tishomingo
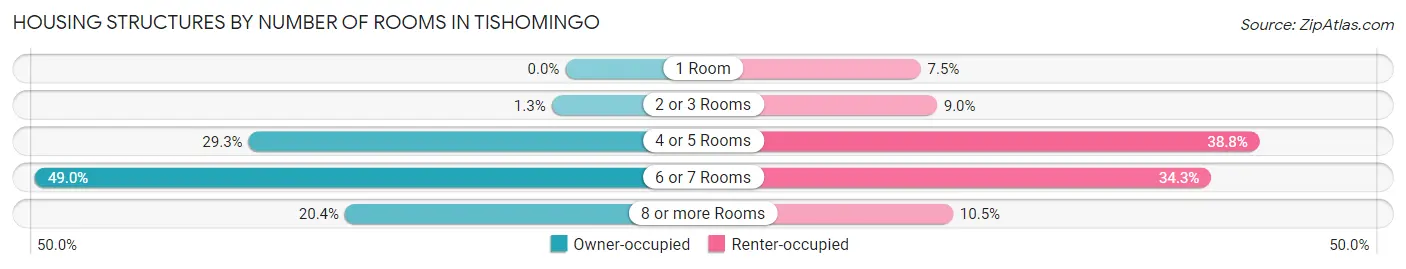
| Number of Rooms | Owner-occupied | Renter-occupied |
| 1 Room | 0 (0.0%) | 5 (7.5%) |
| 2 or 3 Rooms | 2 (1.3%) | 6 (9.0%) |
| 4 or 5 Rooms | 46 (29.3%) | 26 (38.8%) |
| 6 or 7 Rooms | 77 (49.0%) | 23 (34.3%) |
| 8 or more Rooms | 32 (20.4%) | 7 (10.4%) |
| Total | 157 (100.0%) | 67 (100.0%) |
Housing Structure by Heating Type in Tishomingo
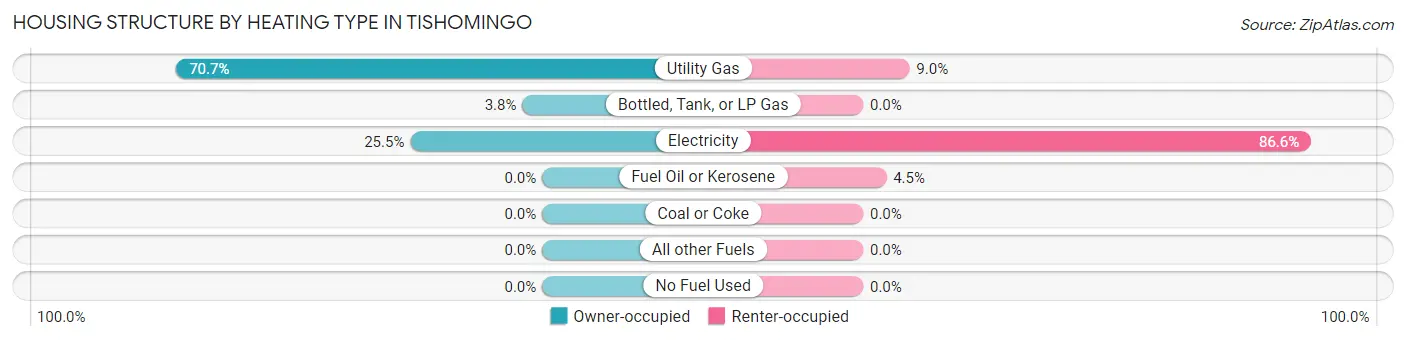
| Heating Type | Owner-occupied | Renter-occupied |
| Utility Gas | 111 (70.7%) | 6 (9.0%) |
| Bottled, Tank, or LP Gas | 6 (3.8%) | 0 (0.0%) |
| Electricity | 40 (25.5%) | 58 (86.6%) |
| Fuel Oil or Kerosene | 0 (0.0%) | 3 (4.5%) |
| Coal or Coke | 0 (0.0%) | 0 (0.0%) |
| All other Fuels | 0 (0.0%) | 0 (0.0%) |
| No Fuel Used | 0 (0.0%) | 0 (0.0%) |
| Total | 157 (100.0%) | 67 (100.0%) |
Household Vehicle Usage in Tishomingo
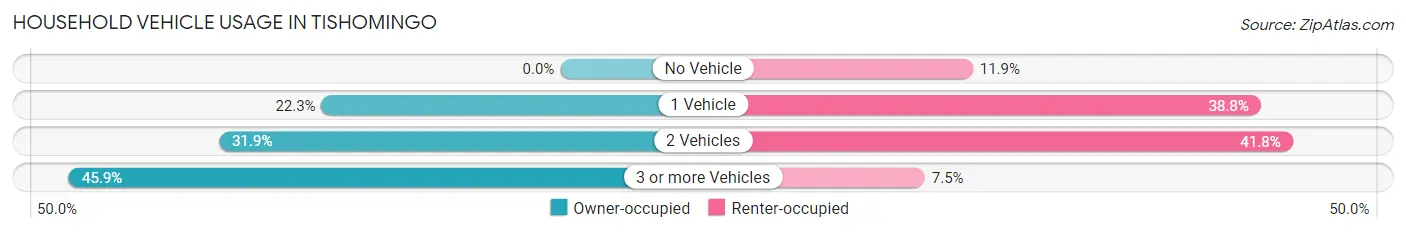
| Vehicles per Household | Owner-occupied | Renter-occupied |
| No Vehicle | 0 (0.0%) | 8 (11.9%) |
| 1 Vehicle | 35 (22.3%) | 26 (38.8%) |
| 2 Vehicles | 50 (31.9%) | 28 (41.8%) |
| 3 or more Vehicles | 72 (45.9%) | 5 (7.5%) |
| Total | 157 (100.0%) | 67 (100.0%) |
Real Estate & Mortgages in Tishomingo
Real Estate and Mortgage Overview in Tishomingo
| Characteristic | Without Mortgage | With Mortgage |
| Housing Units | 76 | 81 |
| Median Property Value | $76,800 | $96,300 |
| Median Household Income | $38,333 | $16 |
| Monthly Housing Costs | $286 | $0 |
| Real Estate Taxes | - | - |
Property Value by Mortgage Status in Tishomingo
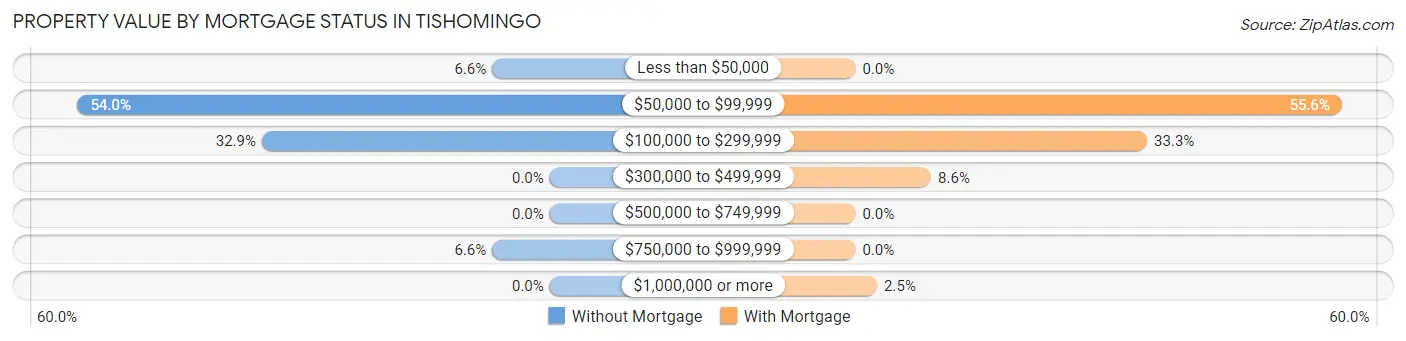
| Property Value | Without Mortgage | With Mortgage |
| Less than $50,000 | 5 (6.6%) | 0 (0.0%) |
| $50,000 to $99,999 | 41 (53.9%) | 45 (55.6%) |
| $100,000 to $299,999 | 25 (32.9%) | 27 (33.3%) |
| $300,000 to $499,999 | 0 (0.0%) | 7 (8.6%) |
| $500,000 to $749,999 | 0 (0.0%) | 0 (0.0%) |
| $750,000 to $999,999 | 5 (6.6%) | 0 (0.0%) |
| $1,000,000 or more | 0 (0.0%) | 2 (2.5%) |
| Total | 76 (100.0%) | 81 (100.0%) |
Household Income by Mortgage Status in Tishomingo
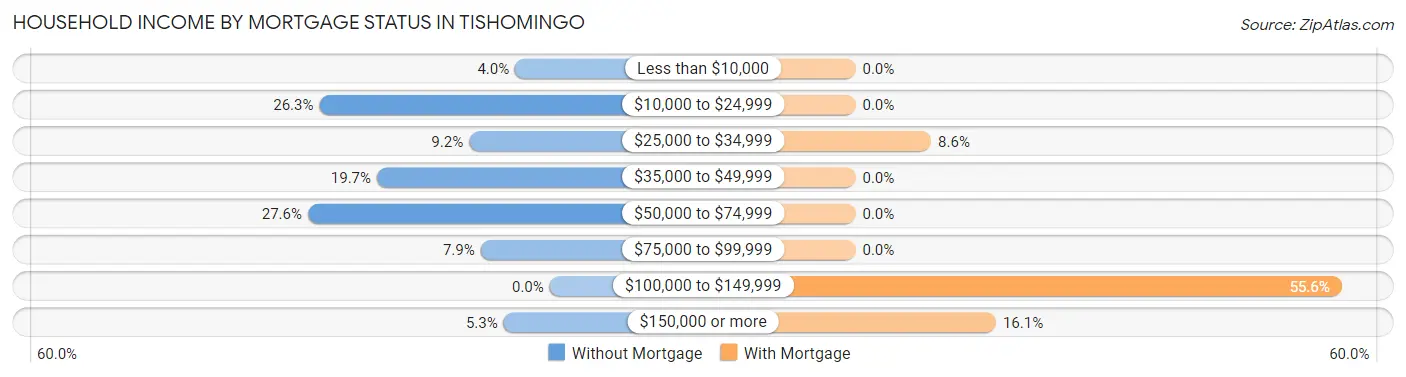
| Household Income | Without Mortgage | With Mortgage |
| Less than $10,000 | 3 (4.0%) | 0 (0.0%) |
| $10,000 to $24,999 | 20 (26.3%) | 0 (0.0%) |
| $25,000 to $34,999 | 7 (9.2%) | 7 (8.6%) |
| $35,000 to $49,999 | 15 (19.7%) | 0 (0.0%) |
| $50,000 to $74,999 | 21 (27.6%) | 0 (0.0%) |
| $75,000 to $99,999 | 6 (7.9%) | 0 (0.0%) |
| $100,000 to $149,999 | 0 (0.0%) | 45 (55.6%) |
| $150,000 or more | 4 (5.3%) | 13 (16.1%) |
| Total | 76 (100.0%) | 81 (100.0%) |
Property Value to Household Income Ratio in Tishomingo
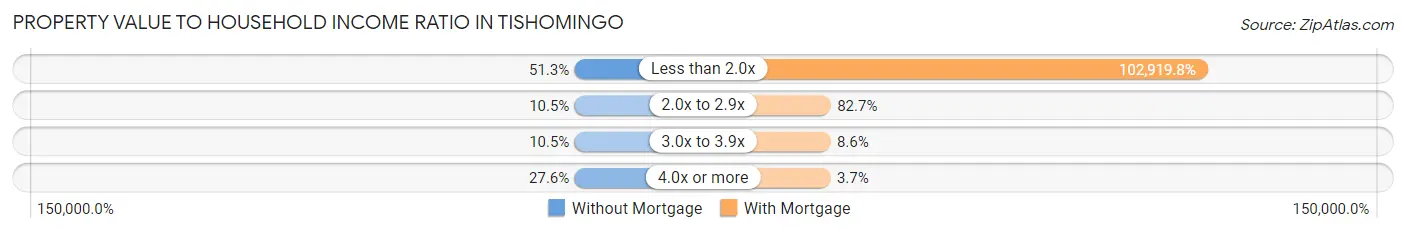
| Value-to-Income Ratio | Without Mortgage | With Mortgage |
| Less than 2.0x | 39 (51.3%) | 83,365 (102,919.7%) |
| 2.0x to 2.9x | 8 (10.5%) | 67 (82.7%) |
| 3.0x to 3.9x | 8 (10.5%) | 7 (8.6%) |
| 4.0x or more | 21 (27.6%) | 3 (3.7%) |
| Total | 76 (100.0%) | 81 (100.0%) |
Real Estate Taxes by Mortgage Status in Tishomingo
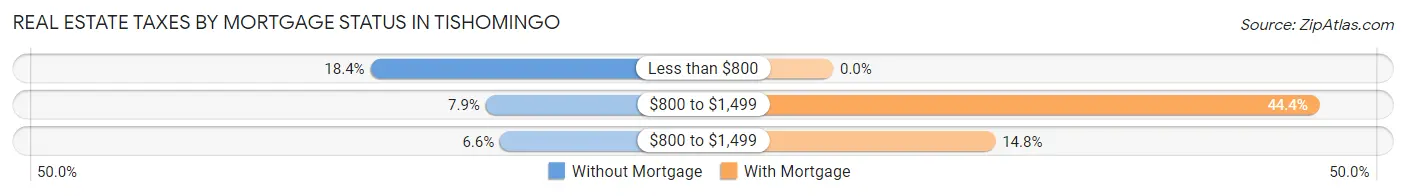
| Property Taxes | Without Mortgage | With Mortgage |
| Less than $800 | 14 (18.4%) | 0 (0.0%) |
| $800 to $1,499 | 6 (7.9%) | 36 (44.4%) |
| $800 to $1,499 | 5 (6.6%) | 12 (14.8%) |
| Total | 76 (100.0%) | 81 (100.0%) |
Health & Disability in Tishomingo
Health Insurance Coverage by Age in Tishomingo
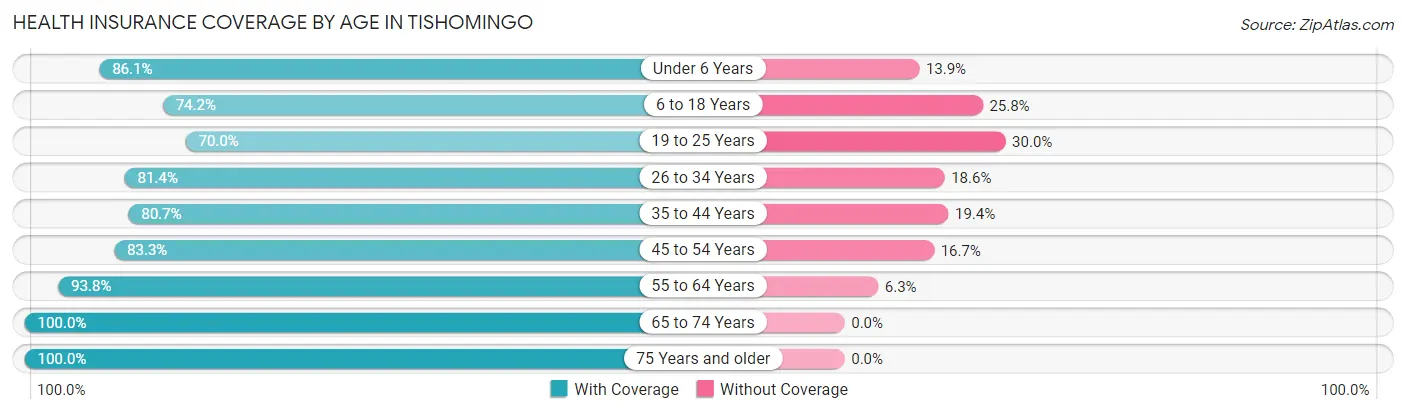
| Age Bracket | With Coverage | Without Coverage |
| Under 6 Years | 68 (86.1%) | 11 (13.9%) |
| 6 to 18 Years | 49 (74.2%) | 17 (25.8%) |
| 19 to 25 Years | 21 (70.0%) | 9 (30.0%) |
| 26 to 34 Years | 96 (81.4%) | 22 (18.6%) |
| 35 to 44 Years | 25 (80.6%) | 6 (19.4%) |
| 45 to 54 Years | 70 (83.3%) | 14 (16.7%) |
| 55 to 64 Years | 30 (93.8%) | 2 (6.2%) |
| 65 to 74 Years | 43 (100.0%) | 0 (0.0%) |
| 75 Years and older | 43 (100.0%) | 0 (0.0%) |
| Total | 445 (84.6%) | 81 (15.4%) |
Health Insurance Coverage by Citizenship Status in Tishomingo
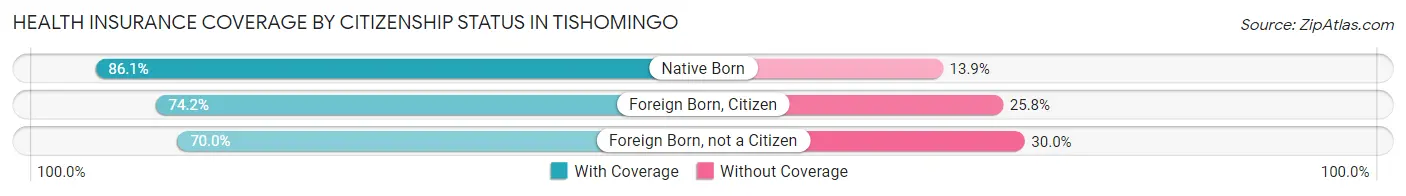
| Citizenship Status | With Coverage | Without Coverage |
| Native Born | 68 (86.1%) | 11 (13.9%) |
| Foreign Born, Citizen | 49 (74.2%) | 17 (25.8%) |
| Foreign Born, not a Citizen | 21 (70.0%) | 9 (30.0%) |
Health Insurance Coverage by Household Income in Tishomingo
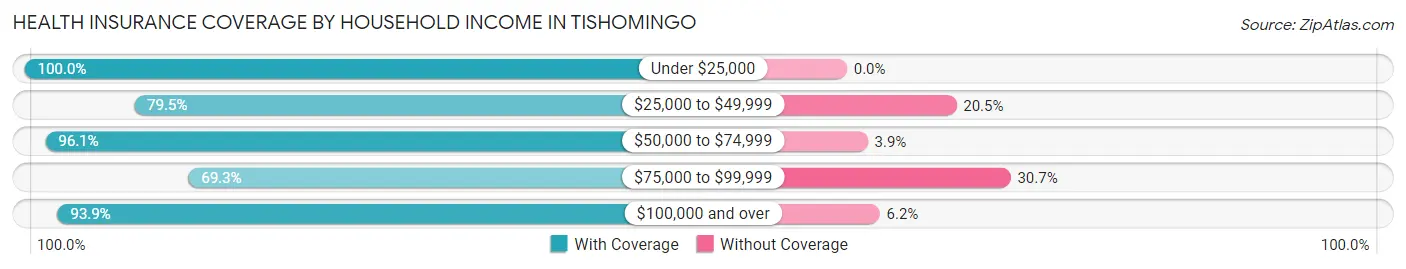
| Household Income | With Coverage | Without Coverage |
| Under $25,000 | 52 (100.0%) | 0 (0.0%) |
| $25,000 to $49,999 | 93 (79.5%) | 24 (20.5%) |
| $50,000 to $74,999 | 74 (96.1%) | 3 (3.9%) |
| $75,000 to $99,999 | 104 (69.3%) | 46 (30.7%) |
| $100,000 and over | 122 (93.9%) | 8 (6.1%) |
Public vs Private Health Insurance Coverage by Age in Tishomingo
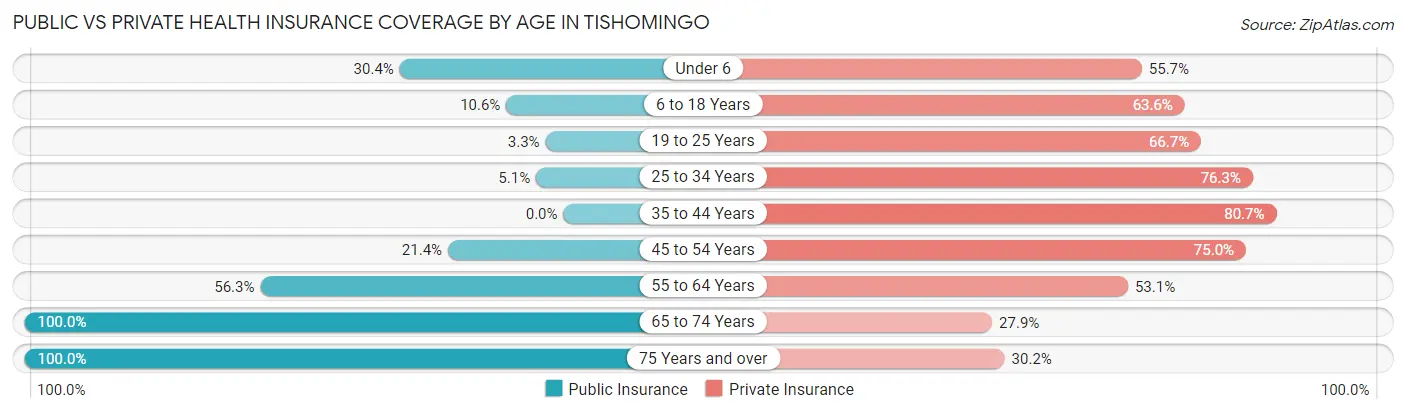
| Age Bracket | Public Insurance | Private Insurance |
| Under 6 | 24 (30.4%) | 44 (55.7%) |
| 6 to 18 Years | 7 (10.6%) | 42 (63.6%) |
| 19 to 25 Years | 1 (3.3%) | 20 (66.7%) |
| 25 to 34 Years | 6 (5.1%) | 90 (76.3%) |
| 35 to 44 Years | 0 (0.0%) | 25 (80.6%) |
| 45 to 54 Years | 18 (21.4%) | 63 (75.0%) |
| 55 to 64 Years | 18 (56.2%) | 17 (53.1%) |
| 65 to 74 Years | 43 (100.0%) | 12 (27.9%) |
| 75 Years and over | 43 (100.0%) | 13 (30.2%) |
| Total | 160 (30.4%) | 326 (62.0%) |
Disability Status by Sex by Age in Tishomingo
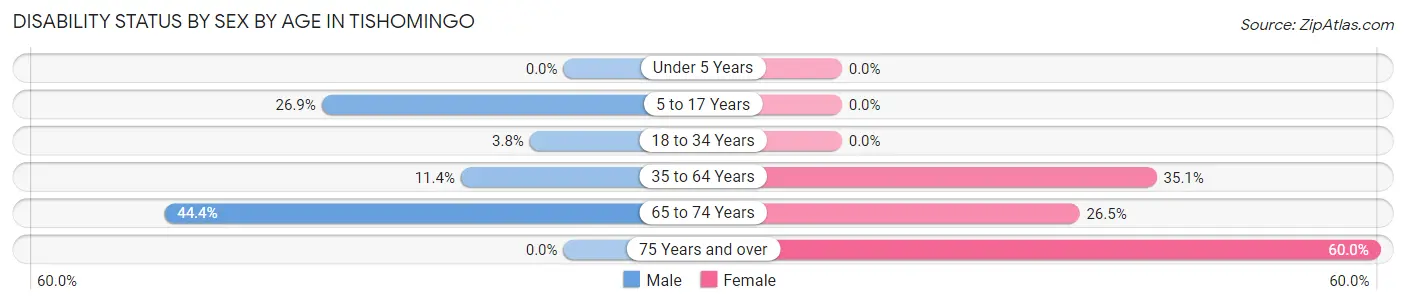
| Age Bracket | Male | Female |
| Under 5 Years | 0 (0.0%) | 0 (0.0%) |
| 5 to 17 Years | 7 (26.9%) | 0 (0.0%) |
| 18 to 34 Years | 3 (3.7%) | 0 (0.0%) |
| 35 to 64 Years | 8 (11.4%) | 27 (35.1%) |
| 65 to 74 Years | 4 (44.4%) | 9 (26.5%) |
| 75 Years and over | 0 (0.0%) | 18 (60.0%) |
Disability Class by Sex by Age in Tishomingo
Disability Class: Hearing Difficulty
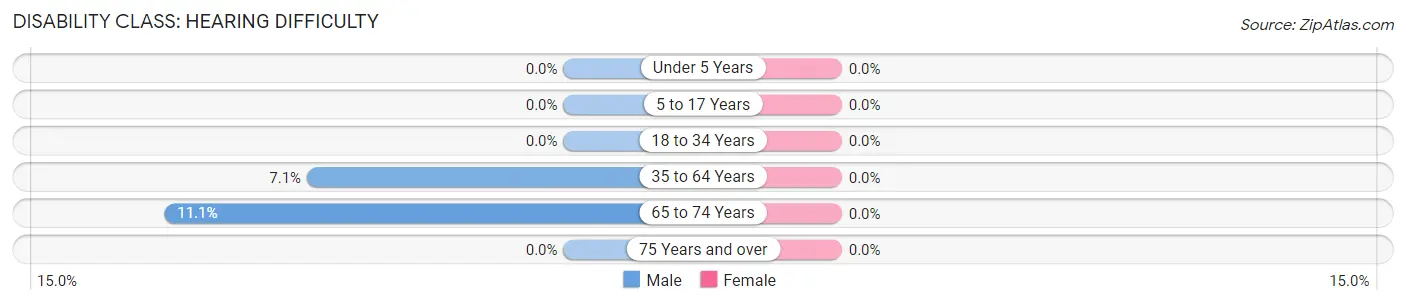
| Age Bracket | Male | Female |
| Under 5 Years | 0 (0.0%) | 0 (0.0%) |
| 5 to 17 Years | 0 (0.0%) | 0 (0.0%) |
| 18 to 34 Years | 0 (0.0%) | 0 (0.0%) |
| 35 to 64 Years | 5 (7.1%) | 0 (0.0%) |
| 65 to 74 Years | 1 (11.1%) | 0 (0.0%) |
| 75 Years and over | 0 (0.0%) | 0 (0.0%) |
Disability Class: Vision Difficulty
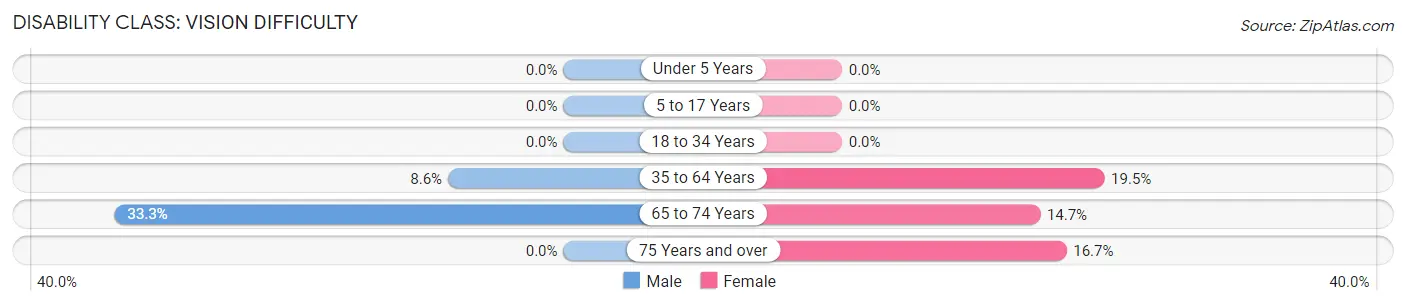
| Age Bracket | Male | Female |
| Under 5 Years | 0 (0.0%) | 0 (0.0%) |
| 5 to 17 Years | 0 (0.0%) | 0 (0.0%) |
| 18 to 34 Years | 0 (0.0%) | 0 (0.0%) |
| 35 to 64 Years | 6 (8.6%) | 15 (19.5%) |
| 65 to 74 Years | 3 (33.3%) | 5 (14.7%) |
| 75 Years and over | 0 (0.0%) | 5 (16.7%) |
Disability Class: Cognitive Difficulty
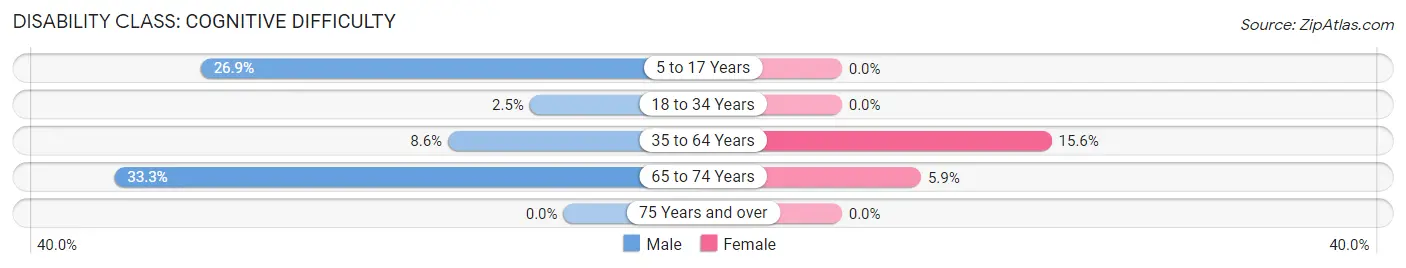
| Age Bracket | Male | Female |
| 5 to 17 Years | 7 (26.9%) | 0 (0.0%) |
| 18 to 34 Years | 2 (2.5%) | 0 (0.0%) |
| 35 to 64 Years | 6 (8.6%) | 12 (15.6%) |
| 65 to 74 Years | 3 (33.3%) | 2 (5.9%) |
| 75 Years and over | 0 (0.0%) | 0 (0.0%) |
Disability Class: Ambulatory Difficulty
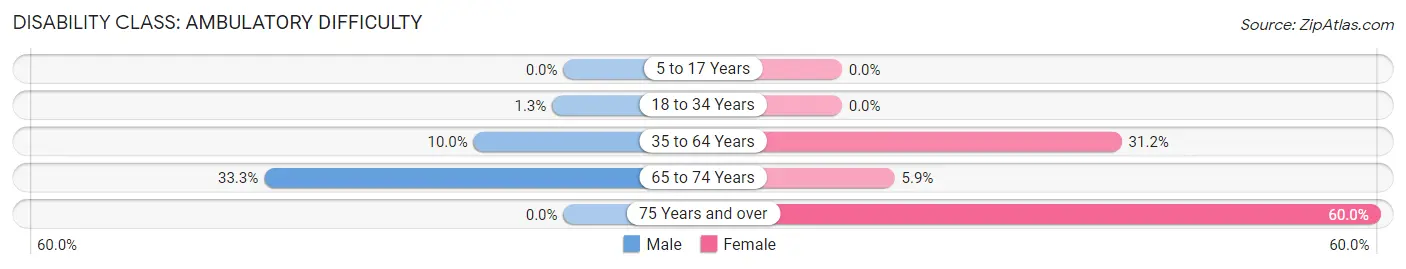
| Age Bracket | Male | Female |
| 5 to 17 Years | 0 (0.0%) | 0 (0.0%) |
| 18 to 34 Years | 1 (1.3%) | 0 (0.0%) |
| 35 to 64 Years | 7 (10.0%) | 24 (31.2%) |
| 65 to 74 Years | 3 (33.3%) | 2 (5.9%) |
| 75 Years and over | 0 (0.0%) | 18 (60.0%) |
Disability Class: Self-Care Difficulty
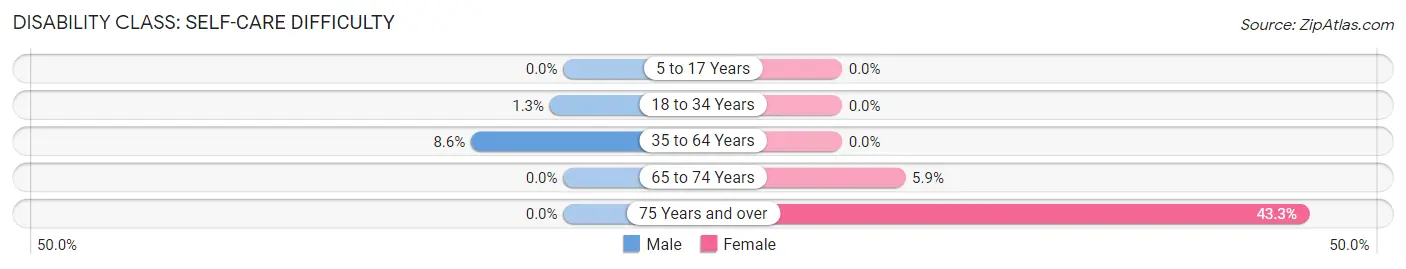
| Age Bracket | Male | Female |
| 5 to 17 Years | 0 (0.0%) | 0 (0.0%) |
| 18 to 34 Years | 1 (1.3%) | 0 (0.0%) |
| 35 to 64 Years | 6 (8.6%) | 0 (0.0%) |
| 65 to 74 Years | 0 (0.0%) | 2 (5.9%) |
| 75 Years and over | 0 (0.0%) | 13 (43.3%) |
Technology Access in Tishomingo
Computing Device Access in Tishomingo
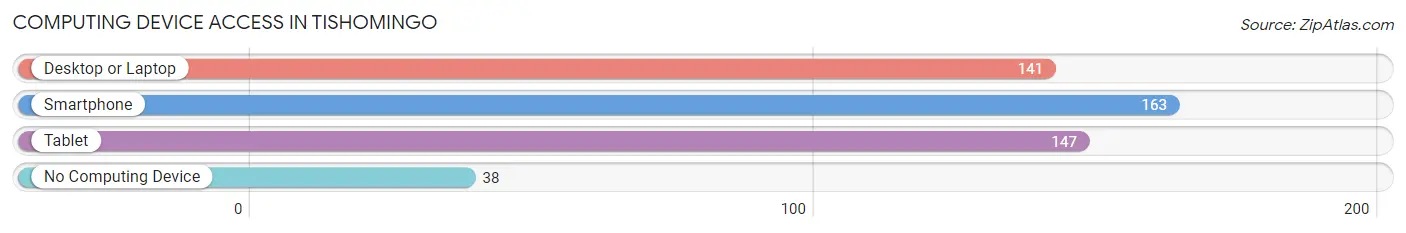
| Device Type | # Households | % Households |
| Desktop or Laptop | 141 | 62.9% |
| Smartphone | 163 | 72.8% |
| Tablet | 147 | 65.6% |
| No Computing Device | 38 | 17.0% |
| Total | 224 | 100.0% |
Internet Access in Tishomingo
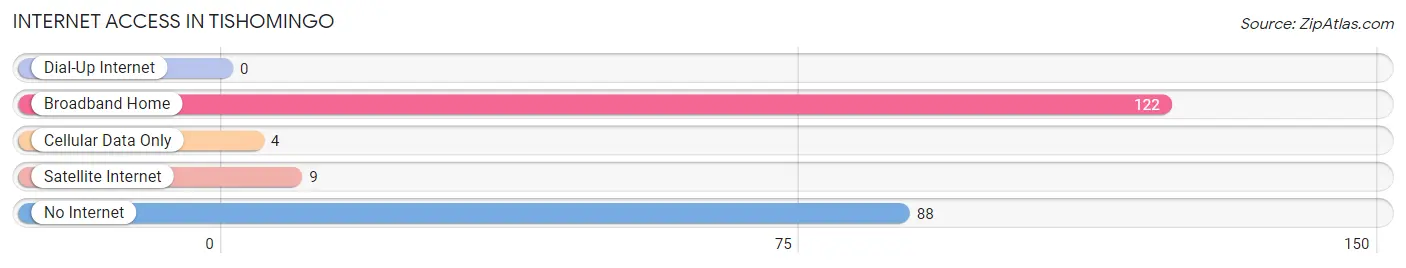
| Internet Type | # Households | % Households |
| Dial-Up Internet | 0 | 0.0% |
| Broadband Home | 122 | 54.5% |
| Cellular Data Only | 4 | 1.8% |
| Satellite Internet | 9 | 4.0% |
| No Internet | 88 | 39.3% |
| Total | 224 | 100.0% |
Tishomingo Summary
Tishomingo is a city located in the northeastern corner of Mississippi, in the foothills of the Appalachian Mountains. It is the county seat of Tishomingo County and is part of the Tupelo Micropolitan Statistical Area. The city was founded in 1836 and named after Chief Tishomingo, a Chickasaw leader.
History
The area that is now Tishomingo was originally inhabited by the Chickasaw Native American tribe. The Chickasaw were a powerful and influential tribe in the region, and their leader, Chief Tishomingo, was a prominent figure in the area. The Chickasaw were eventually forced to cede their land to the United States in the 1830s, and the area was opened up for settlement.
In 1836, the city of Tishomingo was founded and named after Chief Tishomingo. The city was incorporated in 1837 and quickly became an important trading center in the region. The city was also a major stop on the Mobile and Ohio Railroad, which connected the city to other parts of the state and the country.
During the Civil War, Tishomingo was the site of several battles between Union and Confederate forces. The city was also the site of a major Confederate victory in the Battle of Iuka in 1862.
Geography
Tishomingo is located in the northeastern corner of Mississippi, in the foothills of the Appalachian Mountains. The city is situated at the intersection of U.S. Route 72 and Mississippi Highway 25. The city is located about 90 miles northeast of Memphis, Tennessee, and about 120 miles south of Nashville, Tennessee.
The city has a total area of 4.2 square miles, all of which is land. The city is located in a hilly region, with elevations ranging from 500 to 800 feet above sea level. The city is located in a humid subtropical climate zone, with hot, humid summers and mild winters.
Economy
Tishomingo’s economy is largely based on agriculture and manufacturing. The city is home to several large manufacturing plants, including a furniture factory, a paper mill, and a plastics plant. The city is also home to several agricultural operations, including cattle and poultry farms.
The city is also home to several retail stores, restaurants, and other businesses. The city is also home to a branch of the University of Mississippi, which offers a variety of degree programs.
Demographics
As of the 2010 census, the city of Tishomingo had a population of 2,845. The racial makeup of the city was 79.2% White, 18.3% African American, 0.3% Native American, 0.2% Asian, 0.1% Pacific Islander, 0.7% from other races, and 1.4% from two or more races. Hispanic or Latino of any race were 1.7% of the population.
The median household income in the city was $30,938, and the median family income was $37,813. The per capita income for the city was $17,845. About 17.2% of the population was below the poverty line.
Conclusion
Tishomingo is a city located in the northeastern corner of Mississippi, in the foothills of the Appalachian Mountains. The city was founded in 1836 and named after Chief Tishomingo, a Chickasaw leader. The city’s economy is largely based on agriculture and manufacturing, and the city is home to several large manufacturing plants and agricultural operations. As of the 2010 census, the city had a population of 2,845, with a median household income of $30,938 and a median family income of $37,813.
Common Questions
What is Per Capita Income in Tishomingo?
Per Capita income in Tishomingo is $27,157.
What is the Median Family Income in Tishomingo?
Median Family Income in Tishomingo is $78,182.
What is the Median Household income in Tishomingo?
Median Household Income in Tishomingo is $54,167.
What is Income or Wage Gap in Tishomingo?
Income or Wage Gap in Tishomingo is 35.8%.
Women in Tishomingo earn 64.2 cents for every dollar earned by a man.
What is Inequality or Gini Index in Tishomingo?
Inequality or Gini Index in Tishomingo is 0.41.
What is the Total Population of Tishomingo?
Total Population of Tishomingo is 526.
What is the Total Male Population of Tishomingo?
Total Male Population of Tishomingo is 243.
What is the Total Female Population of Tishomingo?
Total Female Population of Tishomingo is 283.
What is the Ratio of Males per 100 Females in Tishomingo?
There are 85.87 Males per 100 Females in Tishomingo.
What is the Ratio of Females per 100 Males in Tishomingo?
There are 116.46 Females per 100 Males in Tishomingo.
What is the Median Population Age in Tishomingo?
Median Population Age in Tishomingo is 31.5 Years.
What is the Average Family Size in Tishomingo
Average Family Size in Tishomingo is 2.9 People.
What is the Average Household Size in Tishomingo
Average Household Size in Tishomingo is 2.4 People.
How Large is the Labor Force in Tishomingo?
There are 224 People in the Labor Forcein in Tishomingo.
What is the Percentage of People in the Labor Force in Tishomingo?
56.7% of People are in the Labor Force in Tishomingo.
What is the Unemployment Rate in Tishomingo?
Unemployment Rate in Tishomingo is 0.9%.