French Camp, MS Map & Demographics
French Camp Map
French Camp Overview
$23,574
PER CAPITA INCOME
$64,688
AVG FAMILY INCOME
$65,313
AVG HOUSEHOLD INCOME
39.9%
WAGE / INCOME GAP [ % ]
60.1¢/ $1
WAGE / INCOME GAP [ $ ]
0.34
INEQUALITY / GINI INDEX
247
TOTAL POPULATION
140
MALE POPULATION
107
FEMALE POPULATION
130.84
MALES / 100 FEMALES
76.43
FEMALES / 100 MALES
44.1
MEDIAN AGE
2.5
AVG FAMILY SIZE
2.5
AVG HOUSEHOLD SIZE
92
LABOR FORCE [ PEOPLE ]
45.8%
PERCENT IN LABOR FORCE
2.2%
UNEMPLOYMENT RATE
French Camp Zip Codes
French Camp Area Codes
Income in French Camp
Income Overview in French Camp
Per Capita Income in French Camp is $23,574, while median incomes of families and households are $64,688 and $65,313 respectively.
| Characteristic | Number | Measure |
| Per Capita Income | 247 | $23,574 |
| Median Family Income | 63 | $64,688 |
| Mean Family Income | 63 | $78,205 |
| Median Household Income | 73 | $65,313 |
| Mean Household Income | 73 | $73,456 |
| Income Deficit | 63 | $0 |
| Wage / Income Gap (%) | 247 | 39.92% |
| Wage / Income Gap ($) | 247 | 60.08¢ per $1 |
| Gini / Inequality Index | 247 | 0.34 |
Earnings by Sex in French Camp
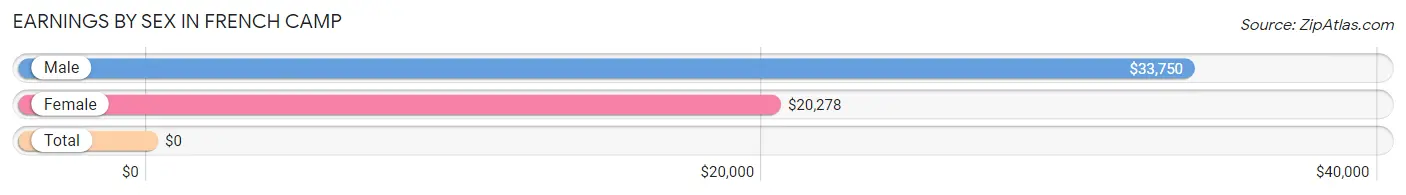
| Sex | Number | Average Earnings |
| Male | 78 (56.5%) | $33,750 |
| Female | 60 (43.5%) | $20,278 |
| Total | 138 (100.0%) | $0 |
Earnings by Sex by Income Bracket in French Camp
The most common earnings brackets in French Camp are $17,500 to $19,999 for men (22 | 28.2%) and $45,000 to $49,999 for women (14 | 23.3%).
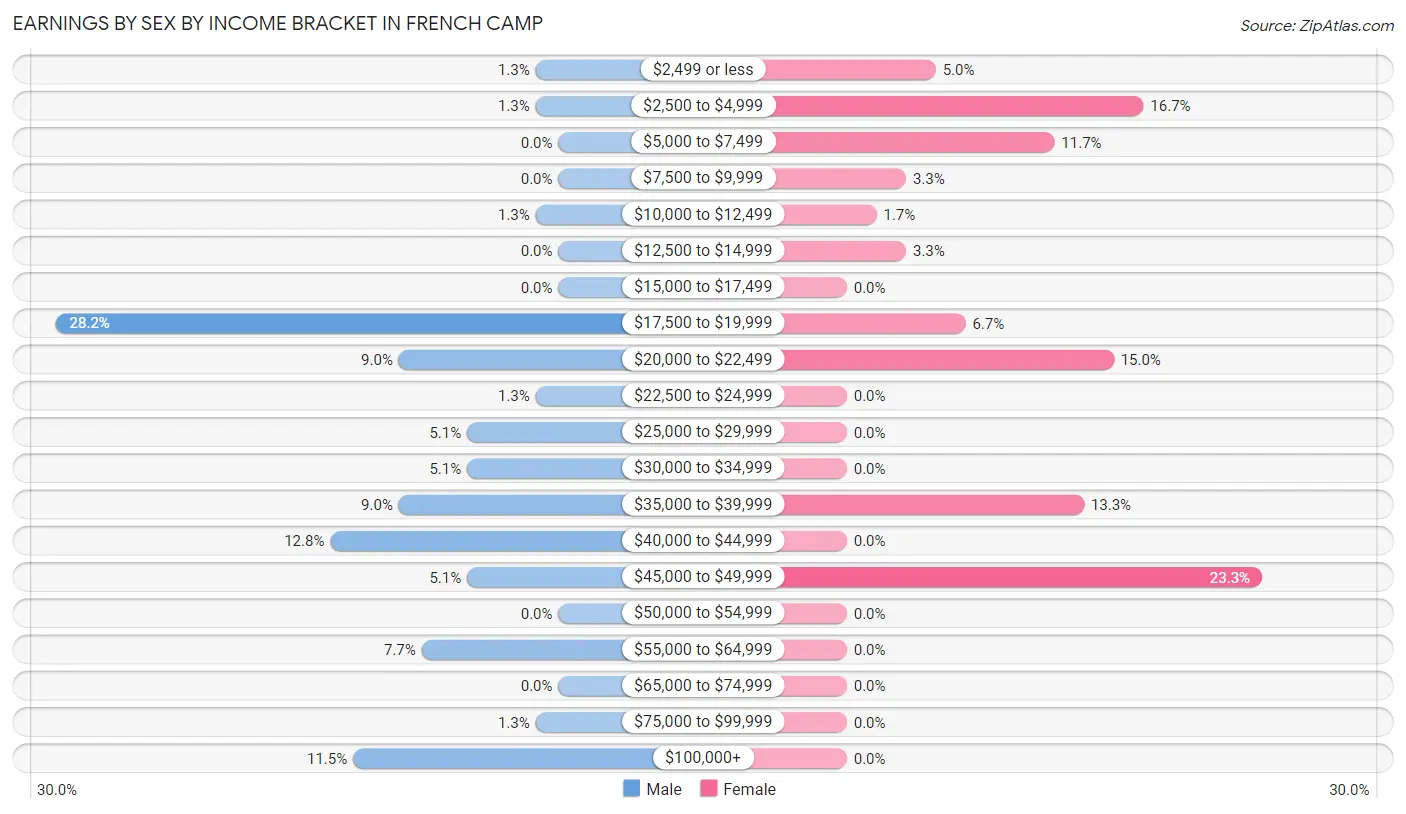
| Income | Male | Female |
| $2,499 or less | 1 (1.3%) | 3 (5.0%) |
| $2,500 to $4,999 | 1 (1.3%) | 10 (16.7%) |
| $5,000 to $7,499 | 0 (0.0%) | 7 (11.7%) |
| $7,500 to $9,999 | 0 (0.0%) | 2 (3.3%) |
| $10,000 to $12,499 | 1 (1.3%) | 1 (1.7%) |
| $12,500 to $14,999 | 0 (0.0%) | 2 (3.3%) |
| $15,000 to $17,499 | 0 (0.0%) | 0 (0.0%) |
| $17,500 to $19,999 | 22 (28.2%) | 4 (6.7%) |
| $20,000 to $22,499 | 7 (9.0%) | 9 (15.0%) |
| $22,500 to $24,999 | 1 (1.3%) | 0 (0.0%) |
| $25,000 to $29,999 | 4 (5.1%) | 0 (0.0%) |
| $30,000 to $34,999 | 4 (5.1%) | 0 (0.0%) |
| $35,000 to $39,999 | 7 (9.0%) | 8 (13.3%) |
| $40,000 to $44,999 | 10 (12.8%) | 0 (0.0%) |
| $45,000 to $49,999 | 4 (5.1%) | 14 (23.3%) |
| $50,000 to $54,999 | 0 (0.0%) | 0 (0.0%) |
| $55,000 to $64,999 | 6 (7.7%) | 0 (0.0%) |
| $65,000 to $74,999 | 0 (0.0%) | 0 (0.0%) |
| $75,000 to $99,999 | 1 (1.3%) | 0 (0.0%) |
| $100,000+ | 9 (11.5%) | 0 (0.0%) |
| Total | 78 (100.0%) | 60 (100.0%) |
Earnings by Sex by Educational Attainment in French Camp
Average earnings in French Camp are $40,750 for men and $20,556 for women, a difference of 49.6%. Men with an educational attainment of college or associate's degree enjoy the highest average annual earnings of $41,389, while those with graduate degree education earn the least with $34,063. Women with an educational attainment of graduate degree earn the most with the average annual earnings of $20,208, while those with graduate degree education have the smallest earnings of $20,208.
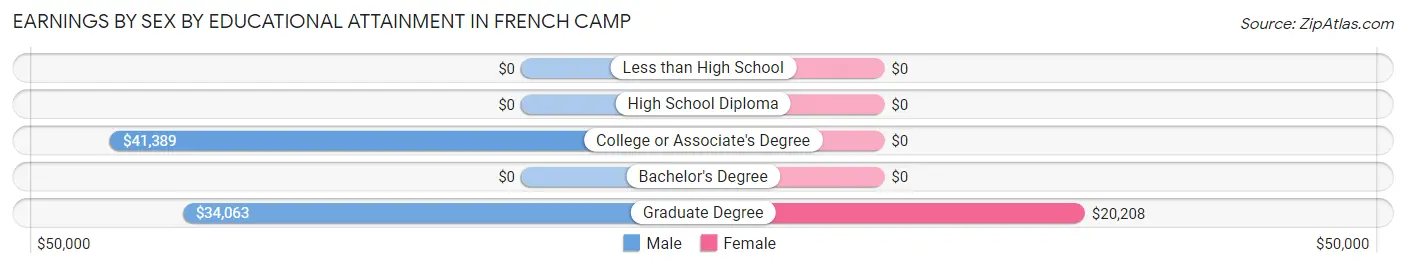
| Educational Attainment | Male Income | Female Income |
| Less than High School | - | - |
| High School Diploma | - | - |
| College or Associate's Degree | $41,389 | $0 |
| Bachelor's Degree | - | - |
| Graduate Degree | $34,063 | $20,208 |
| Total | $40,750 | $20,556 |
Family Income in French Camp
Family Income Brackets in French Camp
According to the French Camp family income data, there are 15 families falling into the $50,000 to $74,999 income range, which is the most common income bracket and makes up 23.8% of all families.
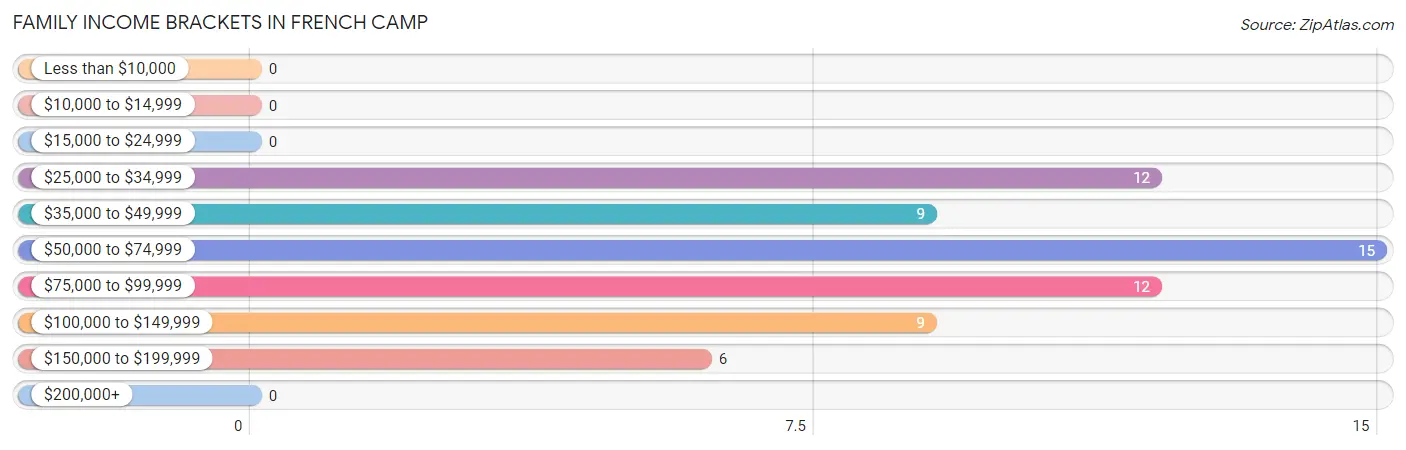
| Income Bracket | # Families | % Families |
| Less than $10,000 | 0 | 0.0% |
| $10,000 to $14,999 | 0 | 0.0% |
| $15,000 to $24,999 | 0 | 0.0% |
| $25,000 to $34,999 | 12 | 19.0% |
| $35,000 to $49,999 | 9 | 14.3% |
| $50,000 to $74,999 | 15 | 23.8% |
| $75,000 to $99,999 | 12 | 19.0% |
| $100,000 to $149,999 | 9 | 14.3% |
| $150,000 to $199,999 | 6 | 9.5% |
| $200,000+ | 0 | 0.0% |
Family Income by Famaliy Size in French Camp
2-person families (35 | 55.6%) account for the highest median family income in French Camp with $94,306 per family, while 2-person families (35 | 55.6%) have the highest median income of $47,153 per family member.
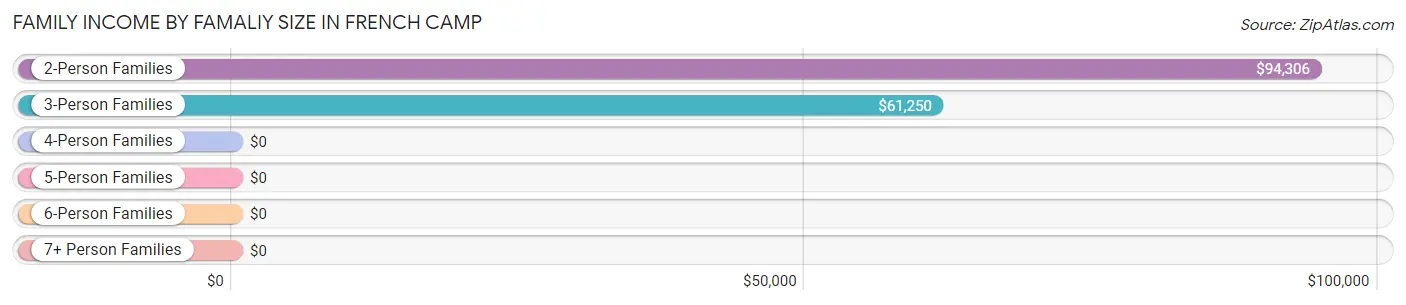
| Income Bracket | # Families | Median Income |
| 2-Person Families | 35 (55.6%) | $94,306 |
| 3-Person Families | 14 (22.2%) | $61,250 |
| 4-Person Families | 9 (14.3%) | $0 |
| 5-Person Families | 5 (7.9%) | $0 |
| 6-Person Families | 0 (0.0%) | $0 |
| 7+ Person Families | 0 (0.0%) | $0 |
| Total | 63 (100.0%) | $64,688 |
Family Income by Number of Earners in French Camp
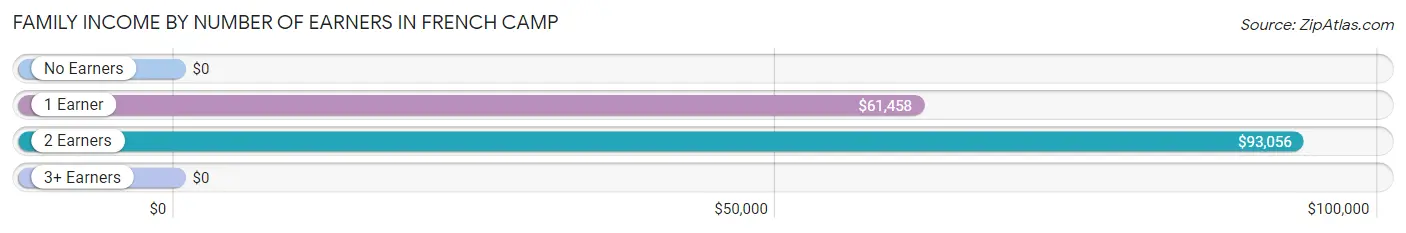
| Number of Earners | # Families | Median Income |
| No Earners | 0 (0.0%) | $0 |
| 1 Earner | 23 (36.5%) | $61,458 |
| 2 Earners | 40 (63.5%) | $93,056 |
| 3+ Earners | 0 (0.0%) | $0 |
| Total | 63 (100.0%) | $64,688 |
Household Income in French Camp
Household Income Brackets in French Camp
With 18 households falling in the category, the $75,000 to $99,999 income range is the most frequent in French Camp, accounting for 24.7% of all households.
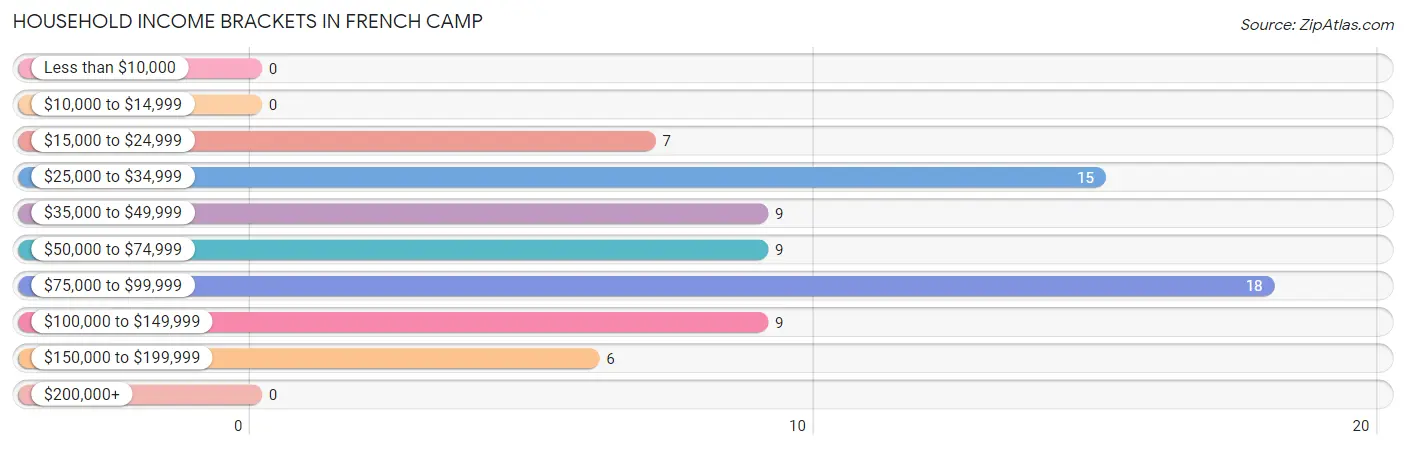
| Income Bracket | # Households | % Households |
| Less than $10,000 | 0 | 0.0% |
| $10,000 to $14,999 | 0 | 0.0% |
| $15,000 to $24,999 | 7 | 9.6% |
| $25,000 to $34,999 | 15 | 20.5% |
| $35,000 to $49,999 | 9 | 12.3% |
| $50,000 to $74,999 | 9 | 12.3% |
| $75,000 to $99,999 | 18 | 24.7% |
| $100,000 to $149,999 | 9 | 12.3% |
| $150,000 to $199,999 | 6 | 8.2% |
| $200,000+ | 0 | 0.0% |
Household Income by Householder Age in French Camp
The median household income in French Camp is $65,313, with the highest median household income of $93,472 found in the 45 to 64 years age bracket for the primary householder. A total of 49 households (67.1%) fall into this category. Meanwhile, the 15 to 24 years age bracket for the primary householder has the lowest median household income of $0, with 2 households (2.7%) in this group.
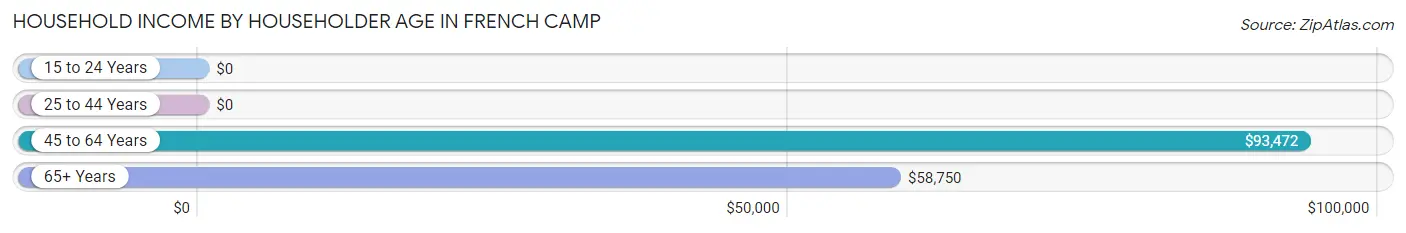
| Income Bracket | # Households | Median Income |
| 15 to 24 Years | 2 (2.7%) | $0 |
| 25 to 44 Years | 9 (12.3%) | $0 |
| 45 to 64 Years | 49 (67.1%) | $93,472 |
| 65+ Years | 13 (17.8%) | $58,750 |
| Total | 73 (100.0%) | $65,313 |
Poverty in French Camp
Income Below Poverty by Sex and Age in French Camp
With 26.0% poverty level for males and 13.0% for females among the residents of French Camp, 16 and 17 year old males and 15 year old females are the most vulnerable to poverty, with 3 males (100.0%) and 3 females (50.0%) in their respective age groups living below the poverty level.
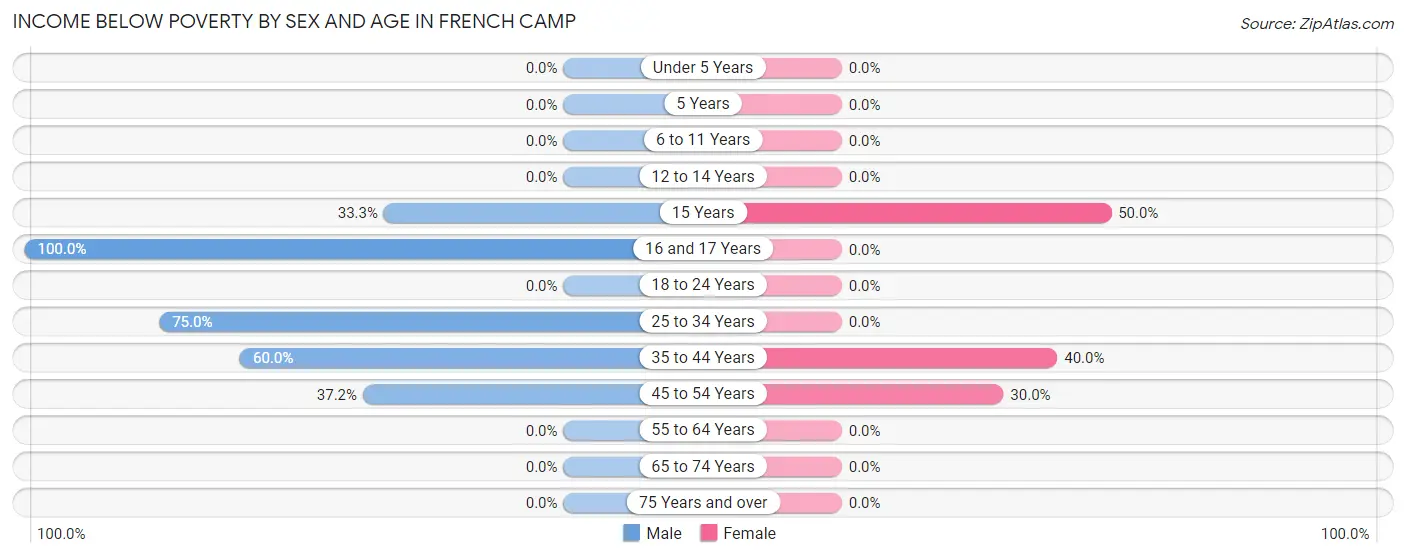
| Age Bracket | Male | Female |
| Under 5 Years | 0 (0.0%) | 0 (0.0%) |
| 5 Years | 0 (0.0%) | 0 (0.0%) |
| 6 to 11 Years | 0 (0.0%) | 0 (0.0%) |
| 12 to 14 Years | 0 (0.0%) | 0 (0.0%) |
| 15 Years | 4 (33.3%) | 3 (50.0%) |
| 16 and 17 Years | 3 (100.0%) | 0 (0.0%) |
| 18 to 24 Years | 0 (0.0%) | 0 (0.0%) |
| 25 to 34 Years | 3 (75.0%) | 0 (0.0%) |
| 35 to 44 Years | 6 (60.0%) | 4 (40.0%) |
| 45 to 54 Years | 16 (37.2%) | 6 (30.0%) |
| 55 to 64 Years | 0 (0.0%) | 0 (0.0%) |
| 65 to 74 Years | 0 (0.0%) | 0 (0.0%) |
| 75 Years and over | 0 (0.0%) | 0 (0.0%) |
| Total | 32 (26.0%) | 13 (13.0%) |
Income Above Poverty by Sex and Age in French Camp
According to the poverty statistics in French Camp, males aged under 5 years and females aged under 5 years are the age groups that are most secure financially, with 100.0% of males and 100.0% of females in these age groups living above the poverty line.
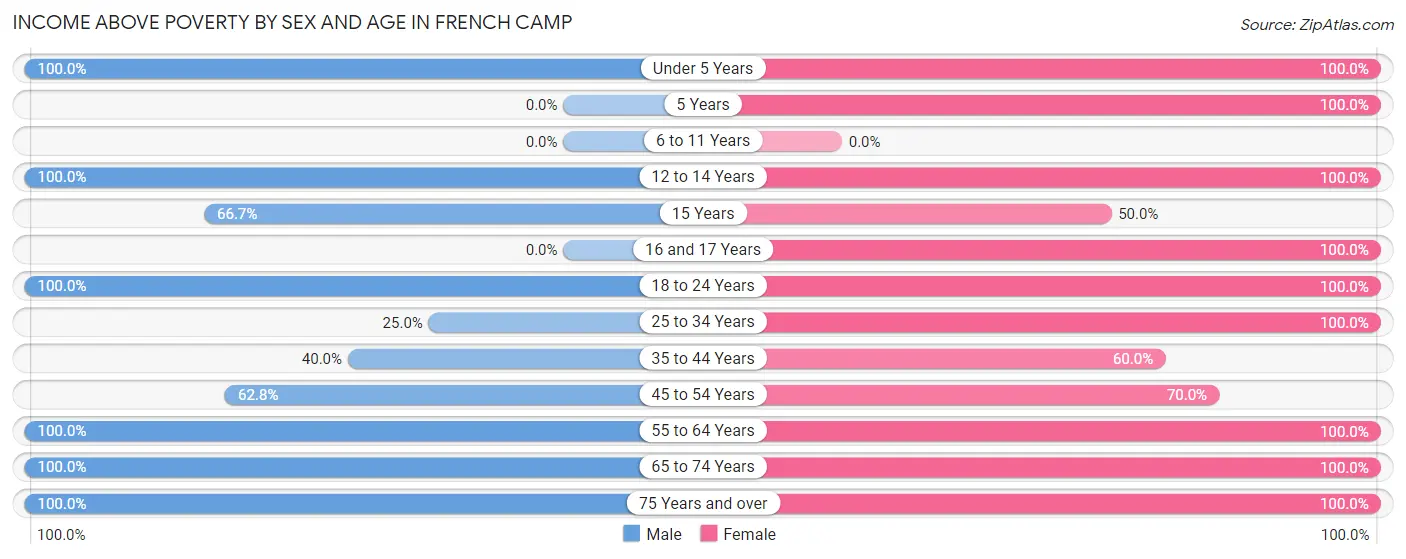
| Age Bracket | Male | Female |
| Under 5 Years | 4 (100.0%) | 1 (100.0%) |
| 5 Years | 0 (0.0%) | 1 (100.0%) |
| 6 to 11 Years | 0 (0.0%) | 0 (0.0%) |
| 12 to 14 Years | 2 (100.0%) | 10 (100.0%) |
| 15 Years | 8 (66.7%) | 3 (50.0%) |
| 16 and 17 Years | 0 (0.0%) | 1 (100.0%) |
| 18 to 24 Years | 21 (100.0%) | 8 (100.0%) |
| 25 to 34 Years | 1 (25.0%) | 10 (100.0%) |
| 35 to 44 Years | 4 (40.0%) | 6 (60.0%) |
| 45 to 54 Years | 27 (62.8%) | 14 (70.0%) |
| 55 to 64 Years | 18 (100.0%) | 17 (100.0%) |
| 65 to 74 Years | 5 (100.0%) | 9 (100.0%) |
| 75 Years and over | 1 (100.0%) | 7 (100.0%) |
| Total | 91 (74.0%) | 87 (87.0%) |
Income Below Poverty Among Married-Couple Families in French Camp
The poverty statistics for married-couple families in French Camp show that 7.4% or 4 of the total 54 families live below the poverty line. Families with 1 or 2 children have the highest poverty rate of 23.5%, comprising of 4 families. On the other hand, families with no children have the lowest poverty rate of 0.0%, which includes 0 families.
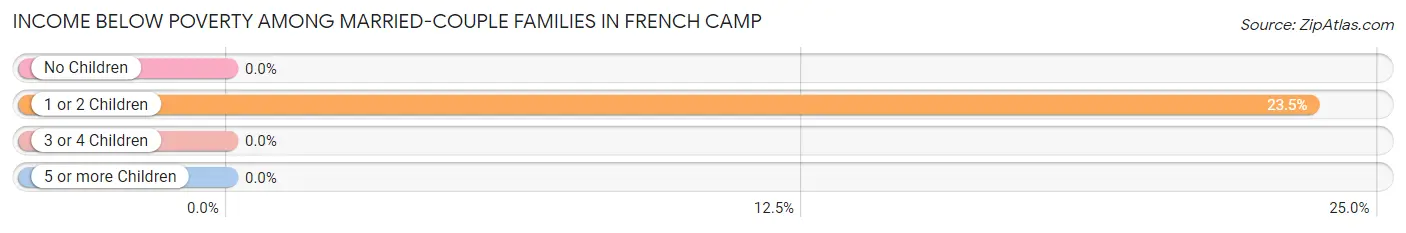
| Children | Above Poverty | Below Poverty |
| No Children | 32 (100.0%) | 0 (0.0%) |
| 1 or 2 Children | 13 (76.5%) | 4 (23.5%) |
| 3 or 4 Children | 5 (100.0%) | 0 (0.0%) |
| 5 or more Children | 0 (0.0%) | 0 (0.0%) |
| Total | 50 (92.6%) | 4 (7.4%) |
Income Below Poverty Among Single-Parent Households in French Camp
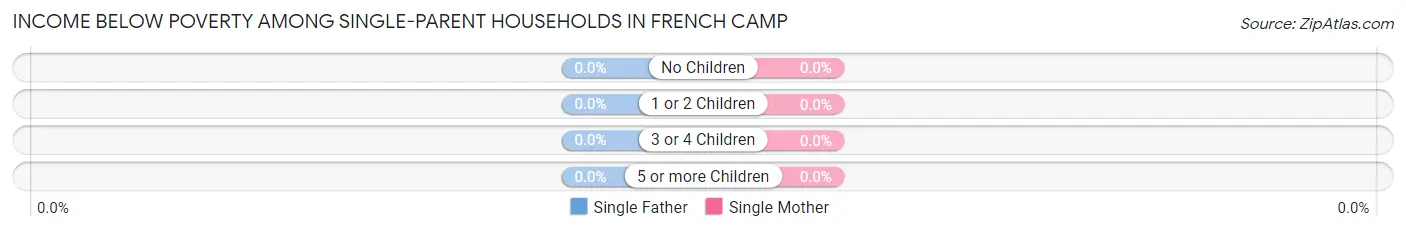
| Children | Single Father | Single Mother |
| No Children | 0 (0.0%) | 0 (0.0%) |
| 1 or 2 Children | 0 (0.0%) | 0 (0.0%) |
| 3 or 4 Children | 0 (0.0%) | 0 (0.0%) |
| 5 or more Children | 0 (0.0%) | 0 (0.0%) |
| Total | 0 (0.0%) | 0 (0.0%) |
Income Below Poverty Among Married-Couple vs Single-Parent Households in French Camp
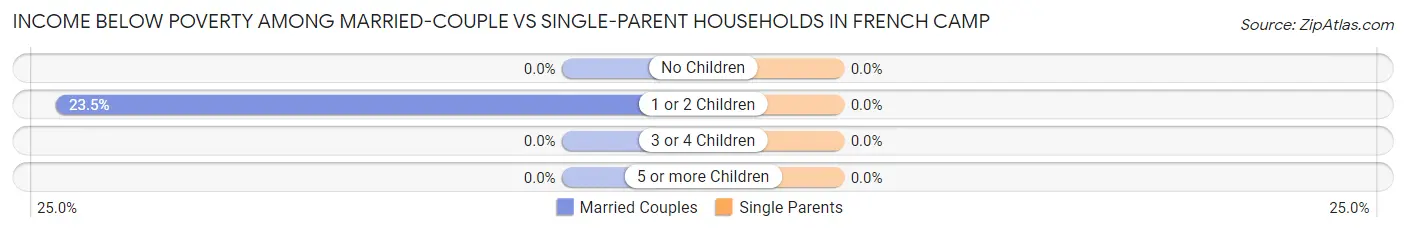
| Children | Married-Couple Families | Single-Parent Households |
| No Children | 0 (0.0%) | 0 (0.0%) |
| 1 or 2 Children | 4 (23.5%) | 0 (0.0%) |
| 3 or 4 Children | 0 (0.0%) | 0 (0.0%) |
| 5 or more Children | 0 (0.0%) | 0 (0.0%) |
| Total | 4 (7.4%) | 0 (0.0%) |
Race in French Camp
The most populous races in French Camp are White / Caucasian (204 | 82.6%), Black / African American (35 | 14.2%), and Two or more Races (8 | 3.2%).
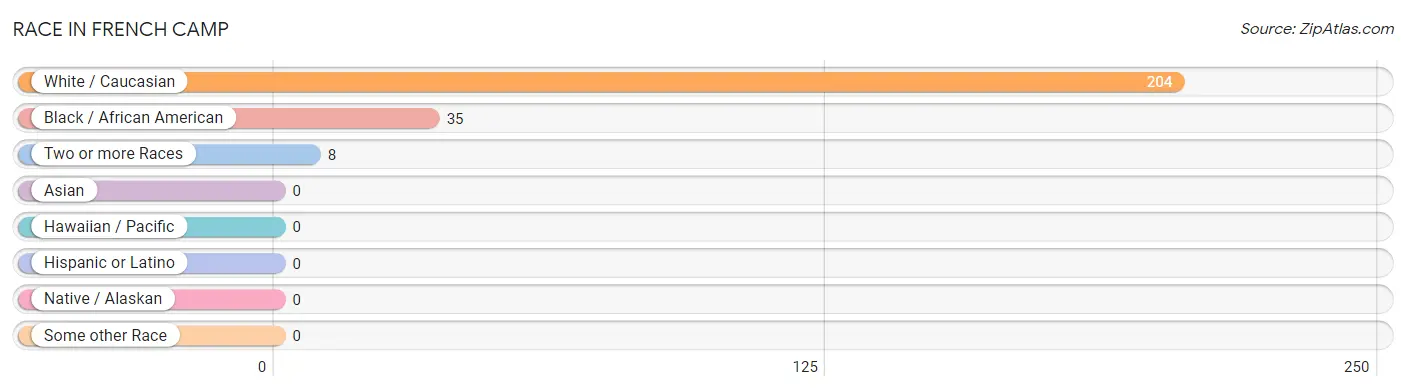
| Race | # Population | % Population |
| Asian | 0 | 0.0% |
| Black / African American | 35 | 14.2% |
| Hawaiian / Pacific | 0 | 0.0% |
| Hispanic or Latino | 0 | 0.0% |
| Native / Alaskan | 0 | 0.0% |
| White / Caucasian | 204 | 82.6% |
| Two or more Races | 8 | 3.2% |
| Some other Race | 0 | 0.0% |
| Total | 247 | 100.0% |
Ancestry in French Camp
The most populous ancestries reported in French Camp are Scotch-Irish (50 | 20.2%), English (37 | 15.0%), German (26 | 10.5%), Scottish (21 | 8.5%), and American (16 | 6.5%), together accounting for 60.7% of all French Camp residents.
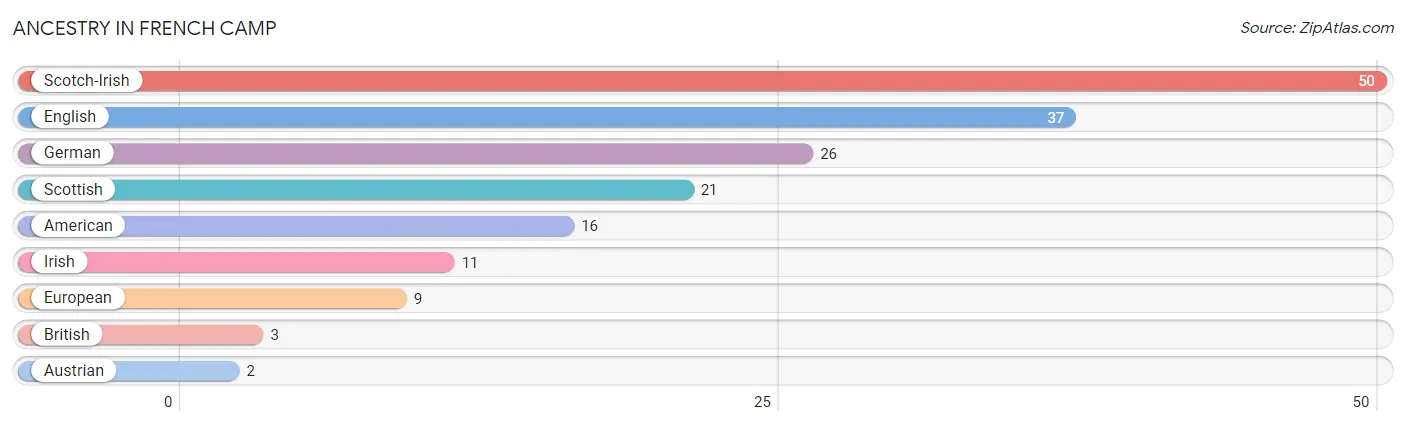
| Ancestry | # Population | % Population |
| American | 16 | 6.5% |
| Austrian | 2 | 0.8% |
| British | 3 | 1.2% |
| English | 37 | 15.0% |
| European | 9 | 3.6% |
| German | 26 | 10.5% |
| Irish | 11 | 4.4% |
| Scotch-Irish | 50 | 20.2% |
| Scottish | 21 | 8.5% | View All 9 Rows |
Immigrants in French Camp

| Immigration Origin | # Population | % Population | View All 0 Rows |
Sex and Age in French Camp
Sex and Age in French Camp
The most populous age groups in French Camp are 15 to 19 Years (32 | 22.9%) for men and 45 to 49 Years (19 | 17.8%) for women.
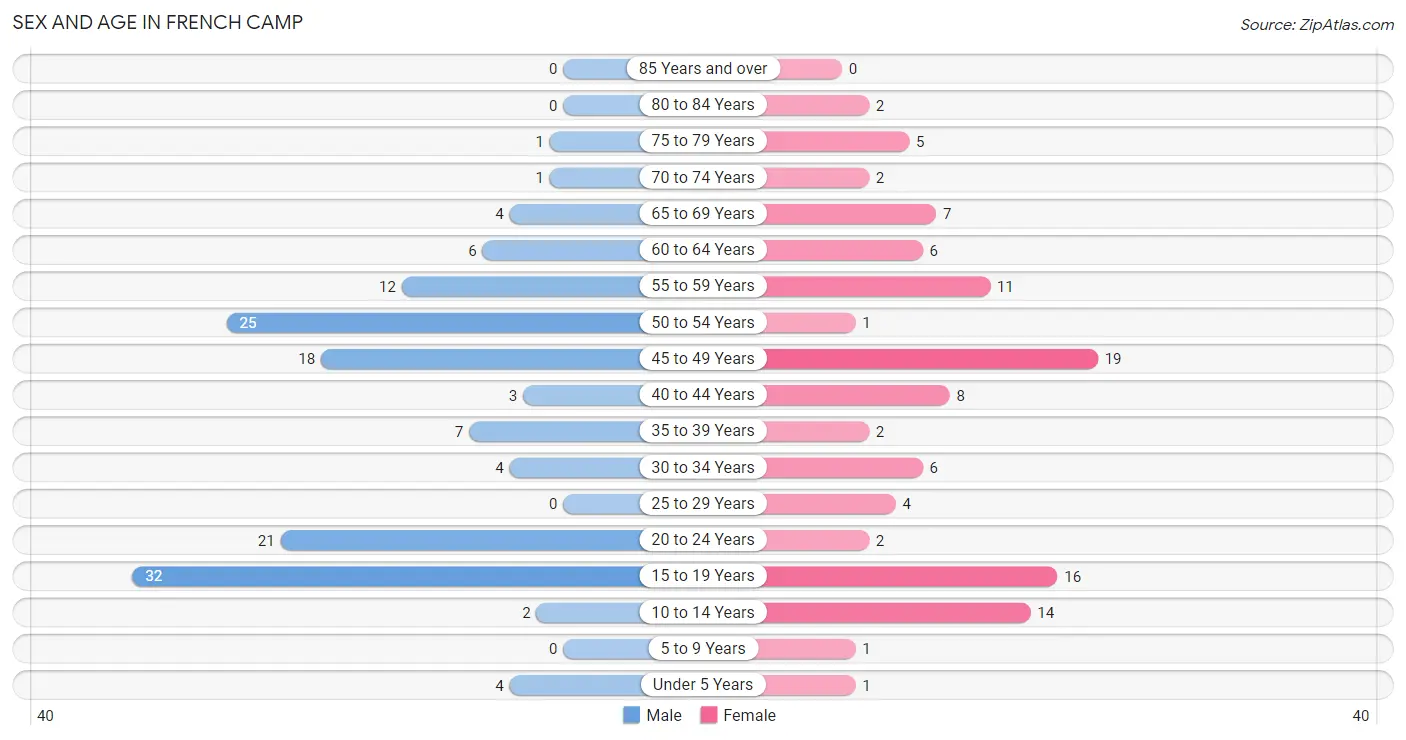
| Age Bracket | Male | Female |
| Under 5 Years | 4 (2.9%) | 1 (0.9%) |
| 5 to 9 Years | 0 (0.0%) | 1 (0.9%) |
| 10 to 14 Years | 2 (1.4%) | 14 (13.1%) |
| 15 to 19 Years | 32 (22.9%) | 16 (14.9%) |
| 20 to 24 Years | 21 (15.0%) | 2 (1.9%) |
| 25 to 29 Years | 0 (0.0%) | 4 (3.7%) |
| 30 to 34 Years | 4 (2.9%) | 6 (5.6%) |
| 35 to 39 Years | 7 (5.0%) | 2 (1.9%) |
| 40 to 44 Years | 3 (2.1%) | 8 (7.5%) |
| 45 to 49 Years | 18 (12.9%) | 19 (17.8%) |
| 50 to 54 Years | 25 (17.9%) | 1 (0.9%) |
| 55 to 59 Years | 12 (8.6%) | 11 (10.3%) |
| 60 to 64 Years | 6 (4.3%) | 6 (5.6%) |
| 65 to 69 Years | 4 (2.9%) | 7 (6.5%) |
| 70 to 74 Years | 1 (0.7%) | 2 (1.9%) |
| 75 to 79 Years | 1 (0.7%) | 5 (4.7%) |
| 80 to 84 Years | 0 (0.0%) | 2 (1.9%) |
| 85 Years and over | 0 (0.0%) | 0 (0.0%) |
| Total | 140 (100.0%) | 107 (100.0%) |
Families and Households in French Camp
Median Family Size in French Camp
The median family size in French Camp is 2.46 persons per family, with single male/father families (6 | 9.5%) accounting for the largest median family size of 2.67 persons per family. On the other hand, single female/mother families (3 | 4.8%) represent the smallest median family size with 2.33 persons per family.
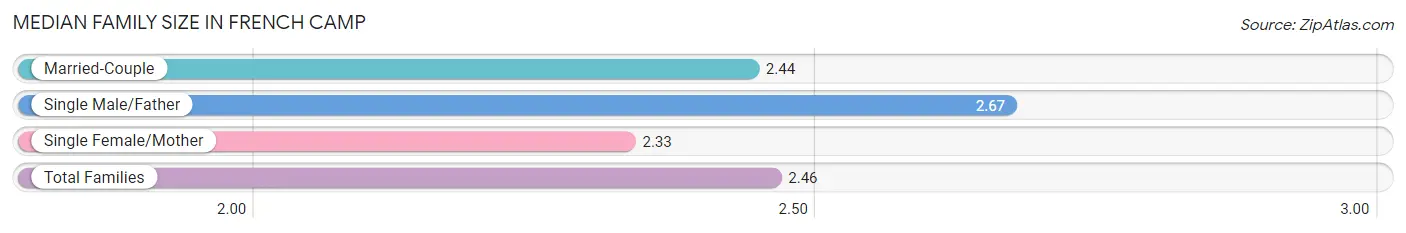
| Family Type | # Families | Family Size |
| Married-Couple | 54 (85.7%) | 2.44 |
| Single Male/Father | 6 (9.5%) | 2.67 |
| Single Female/Mother | 3 (4.8%) | 2.33 |
| Total Families | 63 (100.0%) | 2.46 |
Median Household Size in French Camp
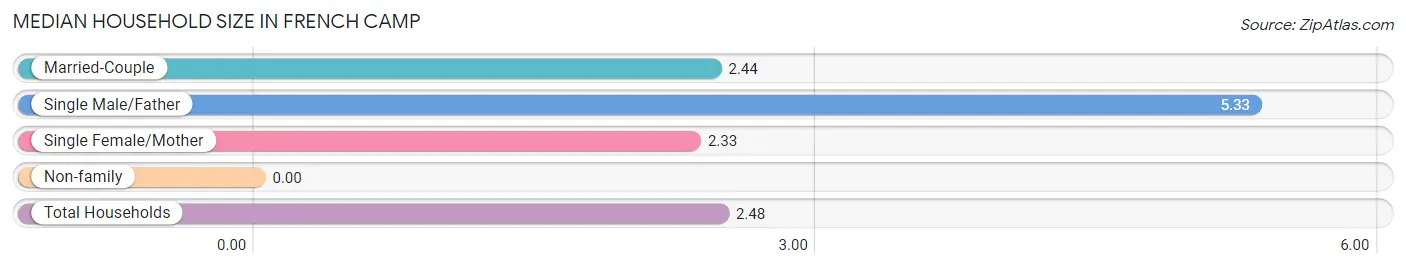
| Household Type | # Households | Household Size |
| Married-Couple | 54 (74.0%) | 2.44 |
| Single Male/Father | 6 (8.2%) | 5.33 |
| Single Female/Mother | 3 (4.1%) | 2.33 |
| Non-family | 10 (13.7%) | - |
| Total Households | 73 (100.0%) | 2.48 |
Household Size by Marriage Status in French Camp
Out of a total of 73 households in French Camp, 63 (86.3%) are family households, while 10 (13.7%) are nonfamily households. The most numerous type of family households are 2-person households, comprising 35, and the most common type of nonfamily households are 1-person households, comprising 10.
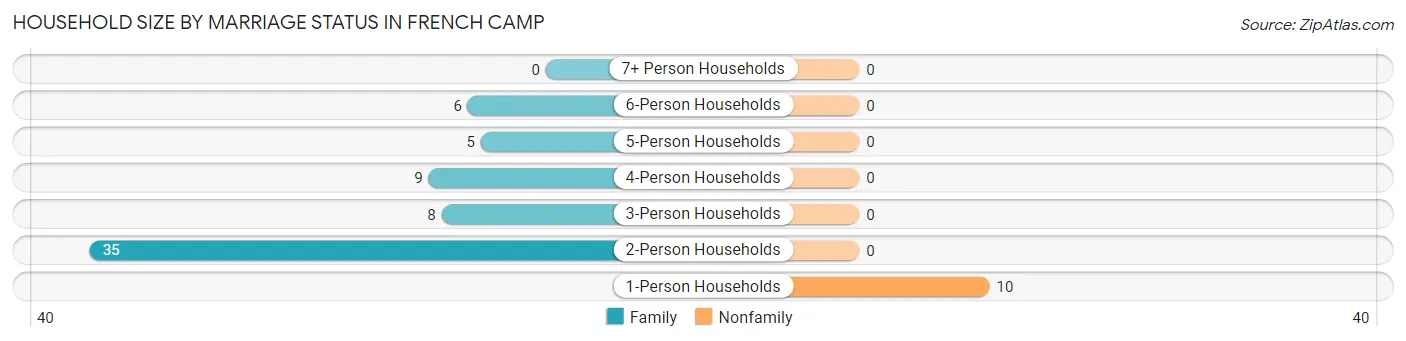
| Household Size | Family Households | Nonfamily Households |
| 1-Person Households | - | 10 (13.7%) |
| 2-Person Households | 35 (47.9%) | 0 (0.0%) |
| 3-Person Households | 8 (11.0%) | 0 (0.0%) |
| 4-Person Households | 9 (12.3%) | 0 (0.0%) |
| 5-Person Households | 5 (6.9%) | 0 (0.0%) |
| 6-Person Households | 6 (8.2%) | 0 (0.0%) |
| 7+ Person Households | 0 (0.0%) | 0 (0.0%) |
| Total | 63 (86.3%) | 10 (13.7%) |
Female Fertility in French Camp
Fertility by Age in French Camp
Average fertility rate in French Camp is 35.0 births per 1,000 women. Women in the age bracket of 20 to 34 years have the highest fertility rate with 167.0 births per 1,000 women. Women in the age bracket of 20 to 34 years acount for 100.0% of all women with births.
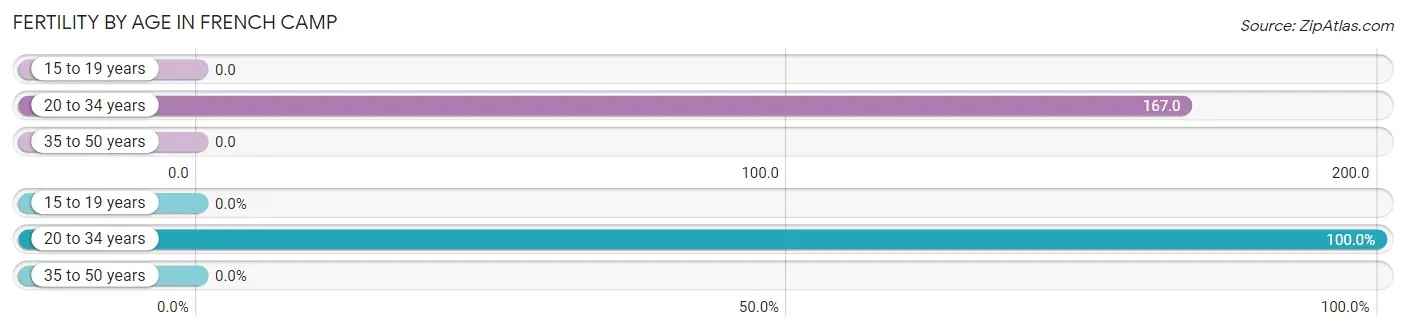
| Age Bracket | Women with Births | Births / 1,000 Women |
| 15 to 19 years | 0 (0.0%) | 0.0 |
| 20 to 34 years | 2 (100.0%) | 167.0 |
| 35 to 50 years | 0 (0.0%) | 0.0 |
| Total | 2 (100.0%) | 35.0 |
Fertility by Age by Marriage Status in French Camp
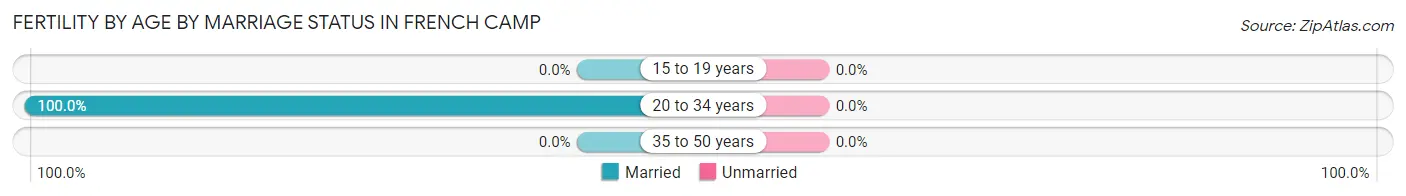
| Age Bracket | Married | Unmarried |
| 15 to 19 years | 0 (0.0%) | 0 (0.0%) |
| 20 to 34 years | 2 (100.0%) | 0 (0.0%) |
| 35 to 50 years | 0 (0.0%) | 0 (0.0%) |
| Total | 2 (100.0%) | 0 (0.0%) |
Fertility by Education in French Camp
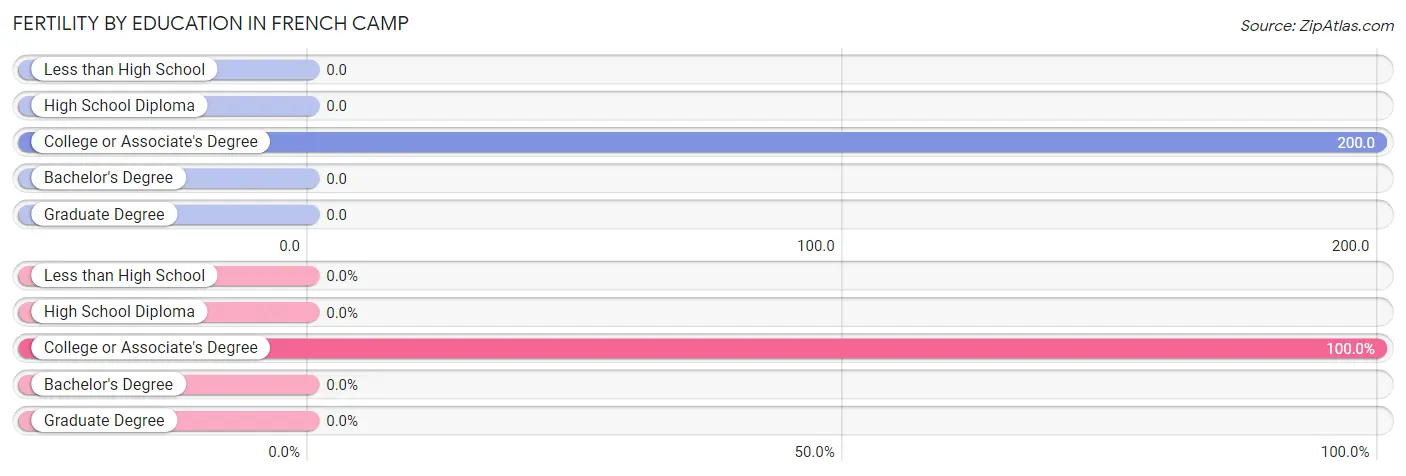
| Educational Attainment | Women with Births | Births / 1,000 Women |
| Less than High School | 0 (0.0%) | 0.0 |
| High School Diploma | 0 (0.0%) | 0.0 |
| College or Associate's Degree | 2 (100.0%) | 200.0 |
| Bachelor's Degree | 0 (0.0%) | 0.0 |
| Graduate Degree | 0 (0.0%) | 0.0 |
| Total | 2 (100.0%) | 35.0 |
Fertility by Education by Marriage Status in French Camp
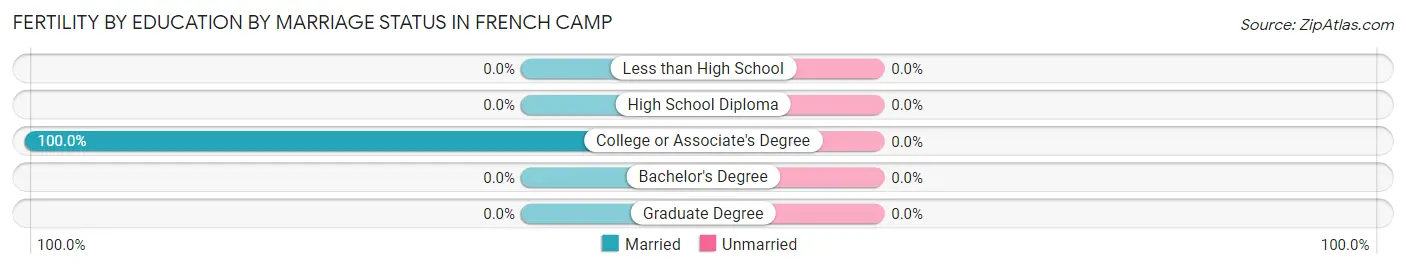
| Educational Attainment | Married | Unmarried |
| Less than High School | 0 (0.0%) | 0 (0.0%) |
| High School Diploma | 0 (0.0%) | 0 (0.0%) |
| College or Associate's Degree | 2 (100.0%) | 0 (0.0%) |
| Bachelor's Degree | 0 (0.0%) | 0 (0.0%) |
| Graduate Degree | 0 (0.0%) | 0 (0.0%) |
| Total | 2 (100.0%) | 0 (0.0%) |
Employment Characteristics in French Camp
Employment by Class of Employer in French Camp
Among the 89 employed individuals in French Camp, not-for-profit organizations (42 | 47.2%), private company employees (39 | 43.8%), and local government employees (5 | 5.6%) make up the most common classes of employment.
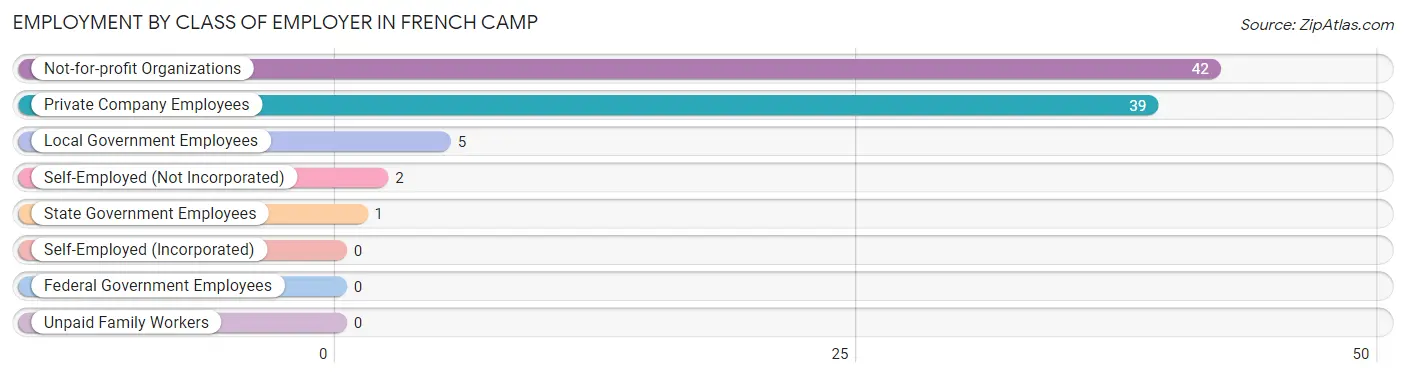
| Employer Class | # Employees | % Employees |
| Private Company Employees | 39 | 43.8% |
| Self-Employed (Incorporated) | 0 | 0.0% |
| Self-Employed (Not Incorporated) | 2 | 2.2% |
| Not-for-profit Organizations | 42 | 47.2% |
| Local Government Employees | 5 | 5.6% |
| State Government Employees | 1 | 1.1% |
| Federal Government Employees | 0 | 0.0% |
| Unpaid Family Workers | 0 | 0.0% |
| Total | 89 | 100.0% |
Employment Status by Age in French Camp
According to the labor force statistics for French Camp, out of the total population over 16 years of age (201), 45.8% or 92 individuals are in the labor force, with 2.2% or 2 of them unemployed. The age group with the highest labor force participation rate is 25 to 29 years, with 100.0% or 4 individuals in the labor force. Within the labor force, the 30 to 34 years age range has the highest percentage of unemployed individuals, with 66.7% or 2 of them being unemployed.
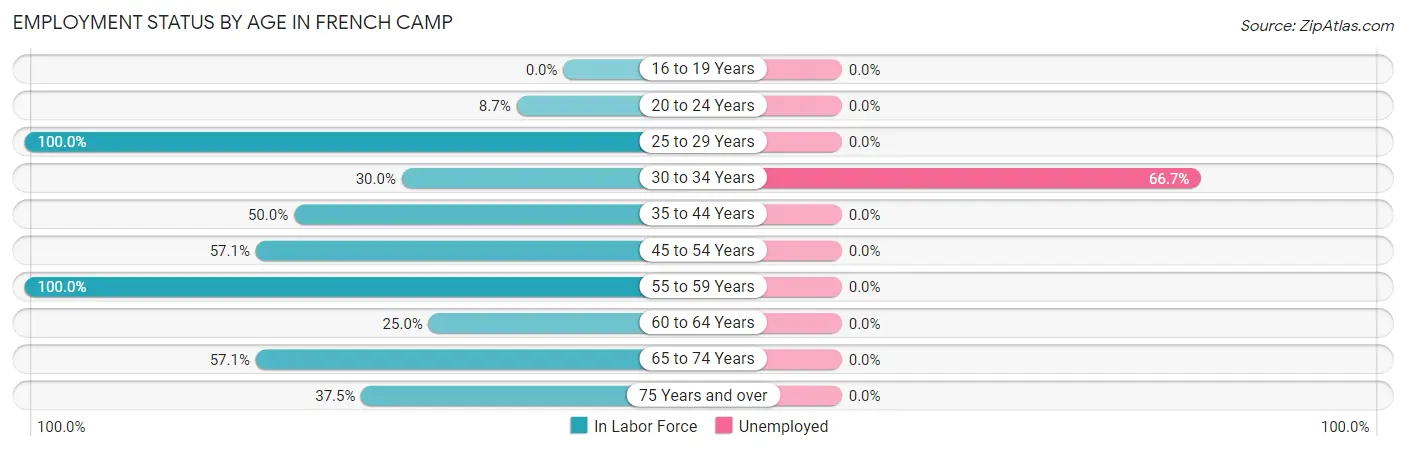
| Age Bracket | In Labor Force | Unemployed |
| 16 to 19 Years | 0 (0.0%) | 0 (0.0%) |
| 20 to 24 Years | 2 (8.7%) | 0 (0.0%) |
| 25 to 29 Years | 4 (100.0%) | 0 (0.0%) |
| 30 to 34 Years | 3 (30.0%) | 2 (66.7%) |
| 35 to 44 Years | 10 (50.0%) | 0 (0.0%) |
| 45 to 54 Years | 36 (57.1%) | 0 (0.0%) |
| 55 to 59 Years | 23 (100.0%) | 0 (0.0%) |
| 60 to 64 Years | 3 (25.0%) | 0 (0.0%) |
| 65 to 74 Years | 8 (57.1%) | 0 (0.0%) |
| 75 Years and over | 3 (37.5%) | 0 (0.0%) |
| Total | 92 (45.8%) | 2 (2.2%) |
Employment Status by Educational Attainment in French Camp
According to labor force statistics for French Camp, 59.8% of individuals (79) out of the total population between 25 and 64 years of age (132) are in the labor force, with 2.5% or 2 of them being unemployed. The group with the highest labor force participation rate are those with the educational attainment of bachelor's degree or higher, with 77.2% or 44 individuals in the labor force. Within the labor force, individuals with college / associate degree education have the highest percentage of unemployment, with 8.3% or 2 of them being unemployed.
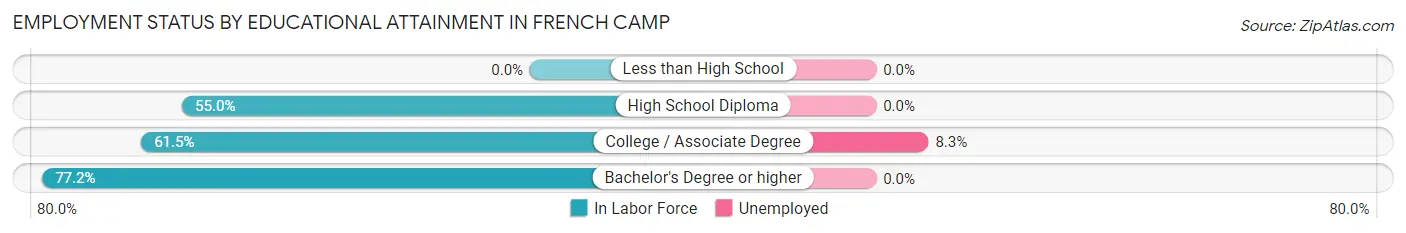
| Educational Attainment | In Labor Force | Unemployed |
| Less than High School | 0 (0.0%) | 0 (0.0%) |
| High School Diploma | 11 (55.0%) | 0 (0.0%) |
| College / Associate Degree | 24 (61.5%) | 3 (8.3%) |
| Bachelor's Degree or higher | 44 (77.2%) | 0 (0.0%) |
| Total | 79 (59.8%) | 3 (2.5%) |
Employment Occupations by Sex in French Camp
Management, Business, Science and Arts Occupations
The most common Management, Business, Science and Arts occupations in French Camp are Community & Social Service (13 | 14.4%), Management (12 | 13.3%), Computers, Engineering & Science (11 | 12.2%), Education Instruction & Library (11 | 12.2%), and Architecture & Engineering (10 | 11.1%).
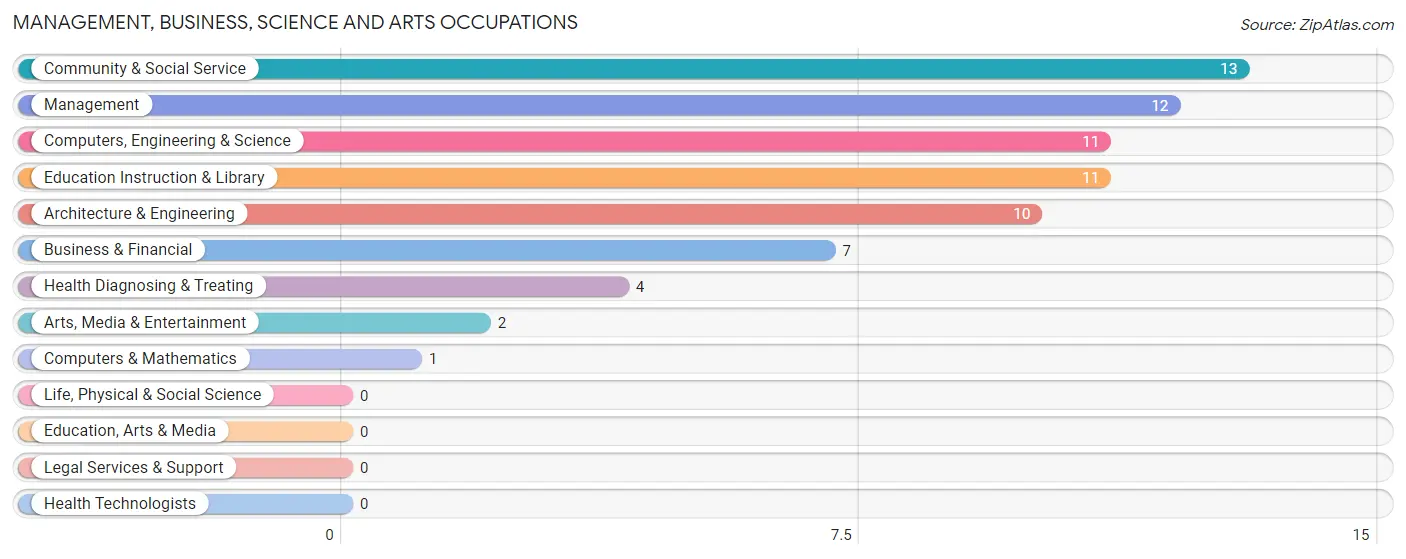
Management, Business, Science and Arts Occupations by Sex
Within the Management, Business, Science and Arts occupations in French Camp, the most male-oriented occupations are Computers, Engineering & Science (100.0%), Computers & Mathematics (100.0%), and Architecture & Engineering (100.0%), while the most female-oriented occupations are Community & Social Service (100.0%), Education Instruction & Library (100.0%), and Arts, Media & Entertainment (100.0%).
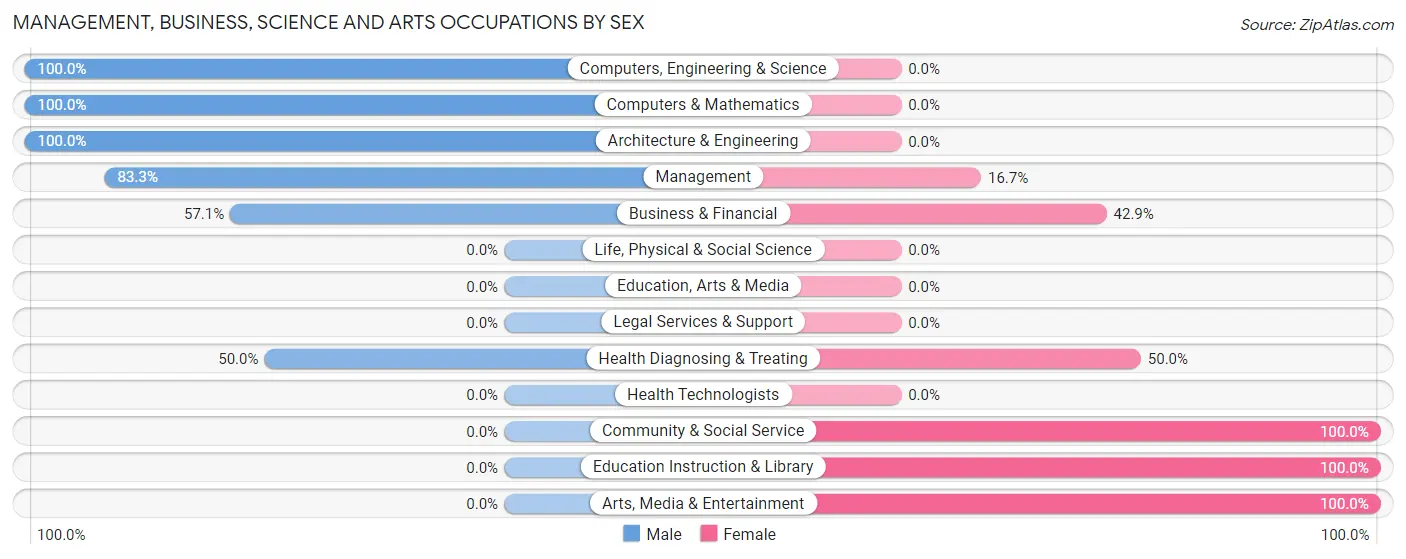
| Occupation | Male | Female |
| Management | 10 (83.3%) | 2 (16.7%) |
| Business & Financial | 4 (57.1%) | 3 (42.9%) |
| Computers, Engineering & Science | 11 (100.0%) | 0 (0.0%) |
| Computers & Mathematics | 1 (100.0%) | 0 (0.0%) |
| Architecture & Engineering | 10 (100.0%) | 0 (0.0%) |
| Life, Physical & Social Science | 0 (0.0%) | 0 (0.0%) |
| Community & Social Service | 0 (0.0%) | 13 (100.0%) |
| Education, Arts & Media | 0 (0.0%) | 0 (0.0%) |
| Legal Services & Support | 0 (0.0%) | 0 (0.0%) |
| Education Instruction & Library | 0 (0.0%) | 11 (100.0%) |
| Arts, Media & Entertainment | 0 (0.0%) | 2 (100.0%) |
| Health Diagnosing & Treating | 2 (50.0%) | 2 (50.0%) |
| Health Technologists | 0 (0.0%) | 0 (0.0%) |
| Total (Category) | 27 (57.5%) | 20 (42.5%) |
| Total (Overall) | 40 (44.4%) | 50 (55.6%) |
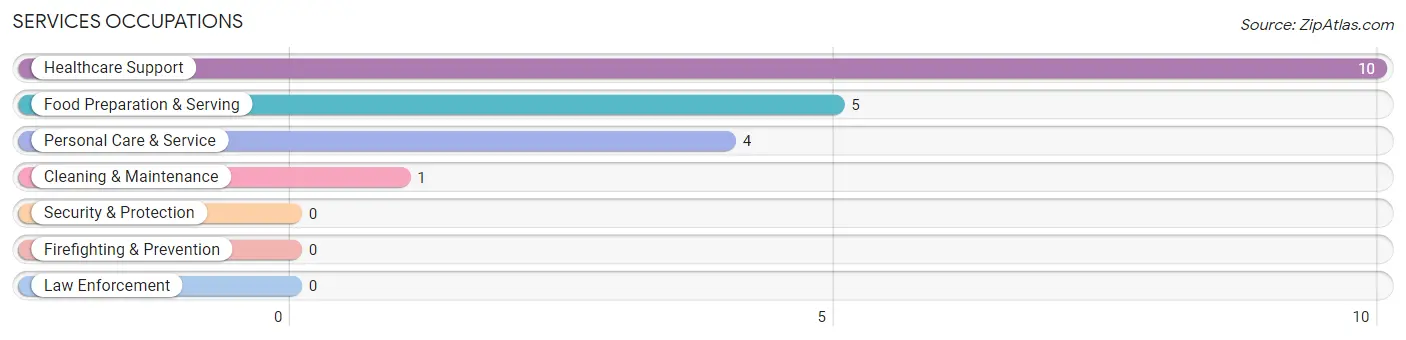
Services Occupations
The most common Services occupations in French Camp are Healthcare Support (10 | 11.1%), Food Preparation & Serving (5 | 5.6%), Personal Care & Service (4 | 4.4%), and Cleaning & Maintenance (1 | 1.1%).
Services Occupations by Sex
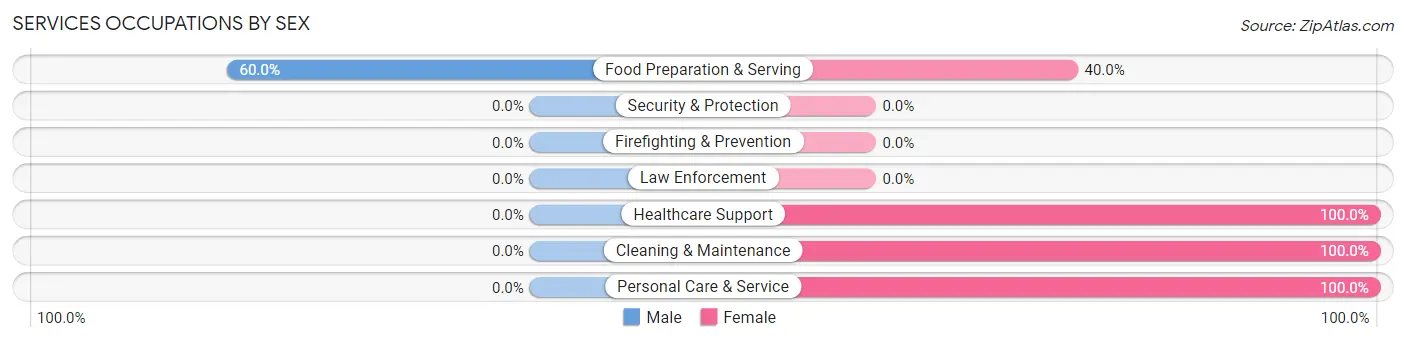
| Occupation | Male | Female |
| Healthcare Support | 0 (0.0%) | 10 (100.0%) |
| Security & Protection | 0 (0.0%) | 0 (0.0%) |
| Firefighting & Prevention | 0 (0.0%) | 0 (0.0%) |
| Law Enforcement | 0 (0.0%) | 0 (0.0%) |
| Food Preparation & Serving | 3 (60.0%) | 2 (40.0%) |
| Cleaning & Maintenance | 0 (0.0%) | 1 (100.0%) |
| Personal Care & Service | 0 (0.0%) | 4 (100.0%) |
| Total (Category) | 3 (15.0%) | 17 (85.0%) |
| Total (Overall) | 40 (44.4%) | 50 (55.6%) |
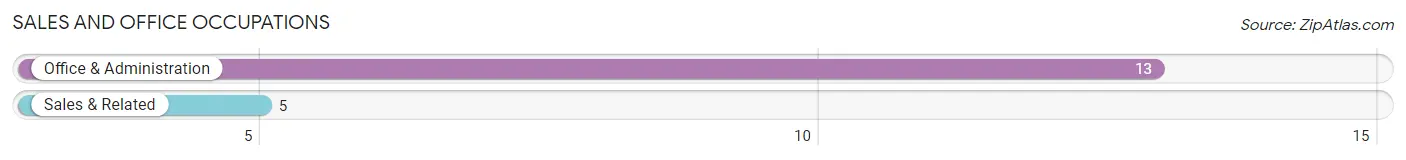
Sales and Office Occupations
The most common Sales and Office occupations in French Camp are Office & Administration (13 | 14.4%), and Sales & Related (5 | 5.6%).
Sales and Office Occupations by Sex
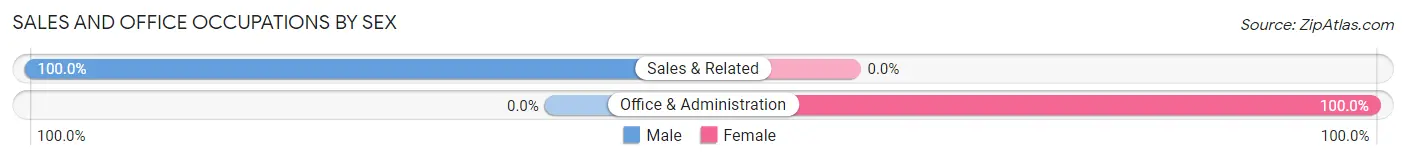
| Occupation | Male | Female |
| Sales & Related | 5 (100.0%) | 0 (0.0%) |
| Office & Administration | 0 (0.0%) | 13 (100.0%) |
| Total (Category) | 5 (27.8%) | 13 (72.2%) |
| Total (Overall) | 40 (44.4%) | 50 (55.6%) |
Natural Resources, Construction and Maintenance Occupations
Natural Resources, Construction and Maintenance Occupations by Sex
| Occupation | Male | Female |
| Farming, Fishing & Forestry | 0 (0.0%) | 0 (0.0%) |
| Construction & Extraction | 0 (0.0%) | 0 (0.0%) |
| Installation, Maintenance & Repair | 0 (0.0%) | 0 (0.0%) |
| Total (Category) | 0 (0.0%) | 0 (0.0%) |
| Total (Overall) | 40 (44.4%) | 50 (55.6%) |
Production, Transportation and Moving Occupations
The most common Production, Transportation and Moving occupations in French Camp are , and Material Moving (5 | 5.6%).
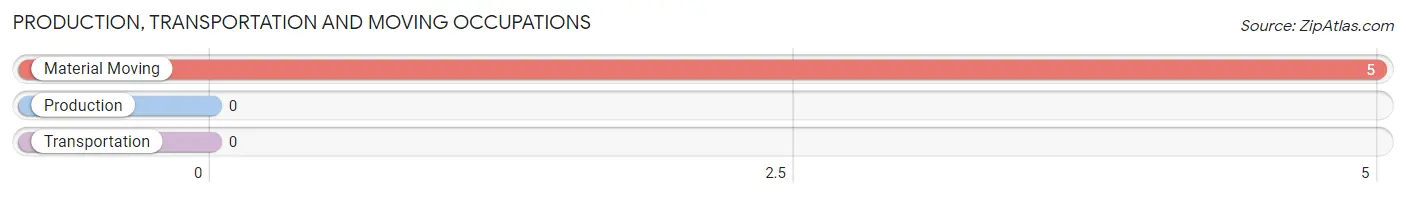
Production, Transportation and Moving Occupations by Sex
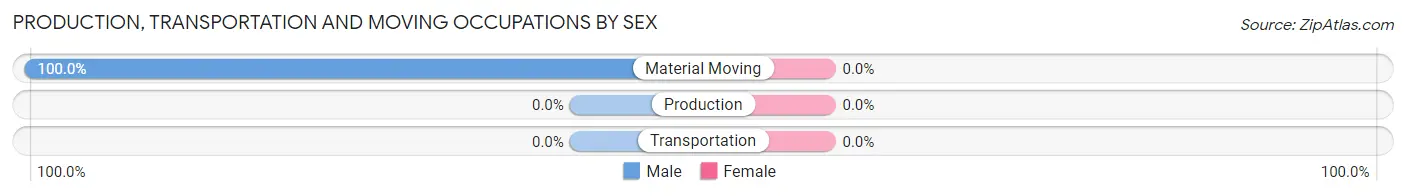
| Occupation | Male | Female |
| Production | 0 (0.0%) | 0 (0.0%) |
| Transportation | 0 (0.0%) | 0 (0.0%) |
| Material Moving | 5 (100.0%) | 0 (0.0%) |
| Total (Category) | 5 (100.0%) | 0 (0.0%) |
| Total (Overall) | 40 (44.4%) | 50 (55.6%) |
Employment Industries by Sex in French Camp
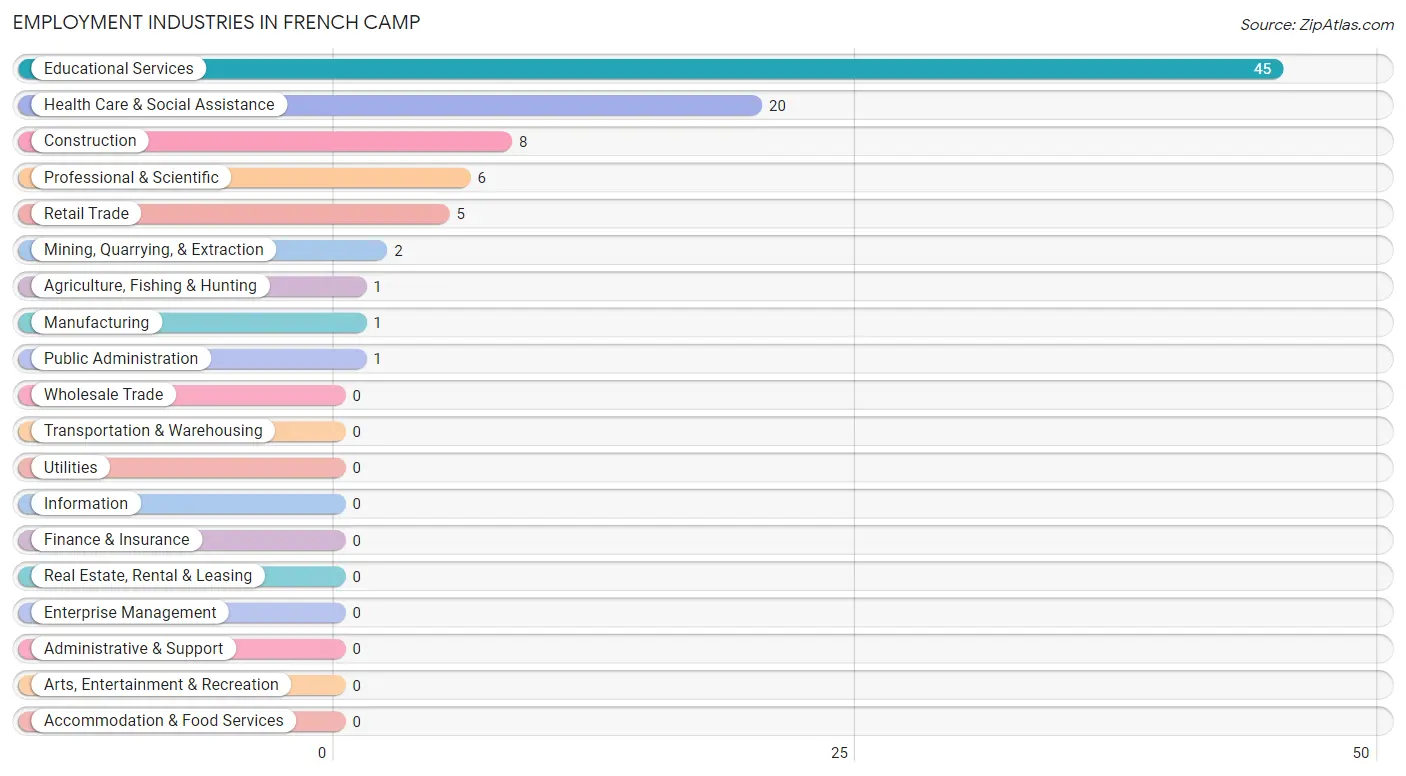
Employment Industries in French Camp
The major employment industries in French Camp include Educational Services (45 | 50.0%), Health Care & Social Assistance (20 | 22.2%), Construction (8 | 8.9%), Professional & Scientific (6 | 6.7%), and Retail Trade (5 | 5.6%).
Employment Industries by Sex in French Camp
The French Camp industries that see more men than women are Agriculture, Fishing & Hunting (100.0%), Mining, Quarrying, & Extraction (100.0%), and Construction (100.0%), whereas the industries that tend to have a higher number of women are Health Care & Social Assistance (100.0%), Public Administration (100.0%), and Educational Services (62.2%).
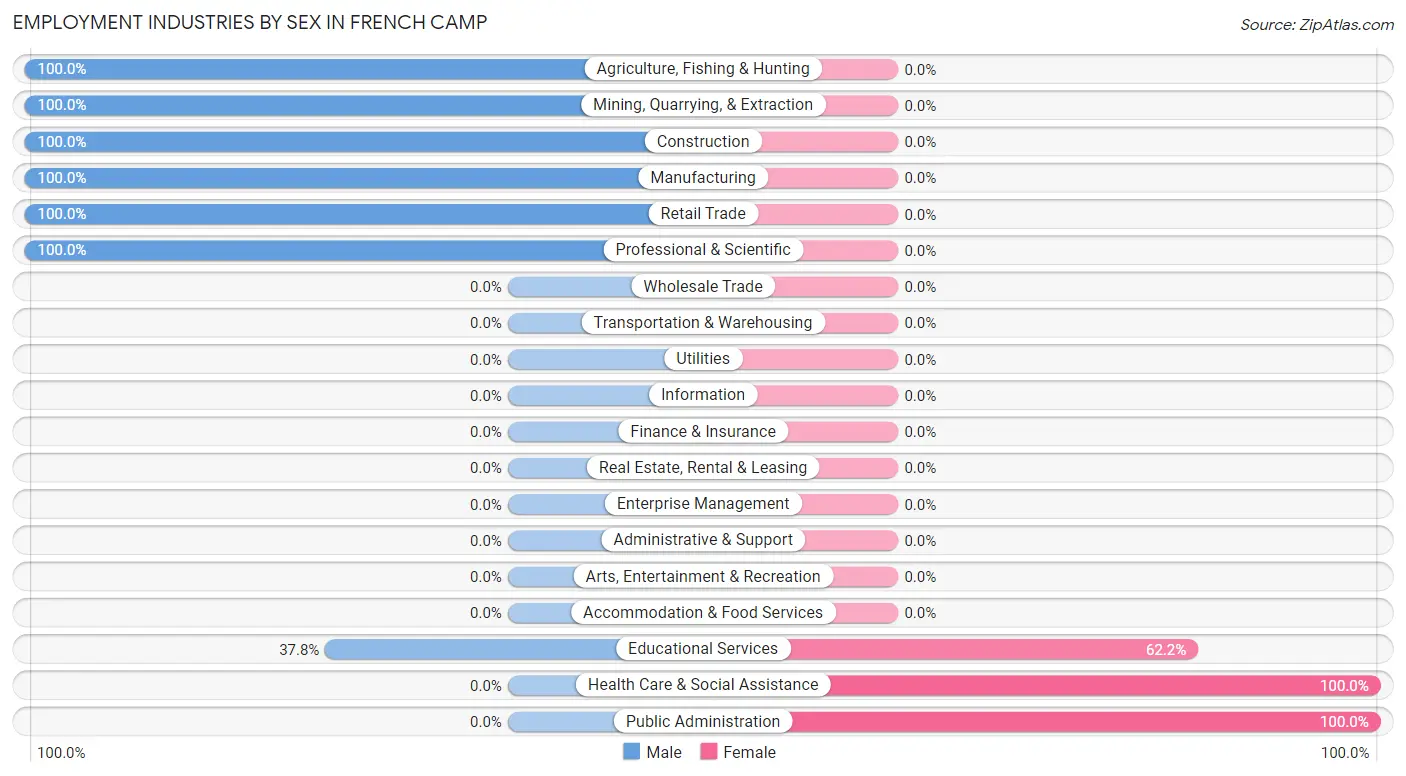
| Industry | Male | Female |
| Agriculture, Fishing & Hunting | 1 (100.0%) | 0 (0.0%) |
| Mining, Quarrying, & Extraction | 2 (100.0%) | 0 (0.0%) |
| Construction | 8 (100.0%) | 0 (0.0%) |
| Manufacturing | 1 (100.0%) | 0 (0.0%) |
| Wholesale Trade | 0 (0.0%) | 0 (0.0%) |
| Retail Trade | 5 (100.0%) | 0 (0.0%) |
| Transportation & Warehousing | 0 (0.0%) | 0 (0.0%) |
| Utilities | 0 (0.0%) | 0 (0.0%) |
| Information | 0 (0.0%) | 0 (0.0%) |
| Finance & Insurance | 0 (0.0%) | 0 (0.0%) |
| Real Estate, Rental & Leasing | 0 (0.0%) | 0 (0.0%) |
| Professional & Scientific | 6 (100.0%) | 0 (0.0%) |
| Enterprise Management | 0 (0.0%) | 0 (0.0%) |
| Administrative & Support | 0 (0.0%) | 0 (0.0%) |
| Educational Services | 17 (37.8%) | 28 (62.2%) |
| Health Care & Social Assistance | 0 (0.0%) | 20 (100.0%) |
| Arts, Entertainment & Recreation | 0 (0.0%) | 0 (0.0%) |
| Accommodation & Food Services | 0 (0.0%) | 0 (0.0%) |
| Public Administration | 0 (0.0%) | 1 (100.0%) |
| Total | 40 (44.4%) | 50 (55.6%) |
Education in French Camp
School Enrollment in French Camp
The most common levels of schooling among the 66 students in French Camp are high school (40 | 60.6%), middle school (16 | 24.2%), and college / undergraduate (9 | 13.6%).
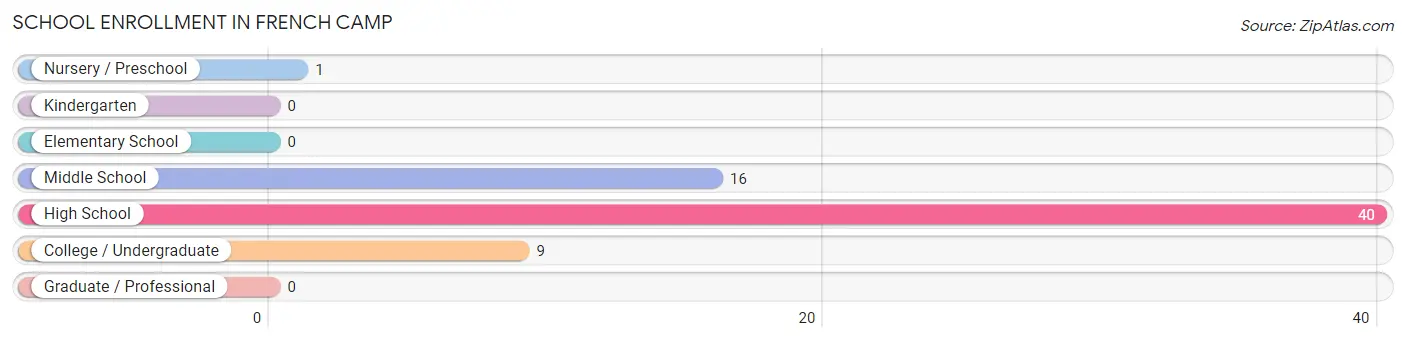
| School Level | # Students | % Students |
| Nursery / Preschool | 1 | 1.5% |
| Kindergarten | 0 | 0.0% |
| Elementary School | 0 | 0.0% |
| Middle School | 16 | 24.2% |
| High School | 40 | 60.6% |
| College / Undergraduate | 9 | 13.6% |
| Graduate / Professional | 0 | 0.0% |
| Total | 66 | 100.0% |
School Enrollment by Age by Funding Source in French Camp
Out of a total of 66 students who are enrolled in schools in French Camp, 47 (71.2%) attend a private institution, while the remaining 19 (28.8%) are enrolled in public schools. The age group of 10 to 14 year olds has the highest likelihood of being enrolled in private schools, with 14 (87.5% in the age bracket) enrolled. Conversely, the age group of 5 to 9 year old has the lowest likelihood of being enrolled in a private school, with 1 (100.0% in the age bracket) attending a public institution.
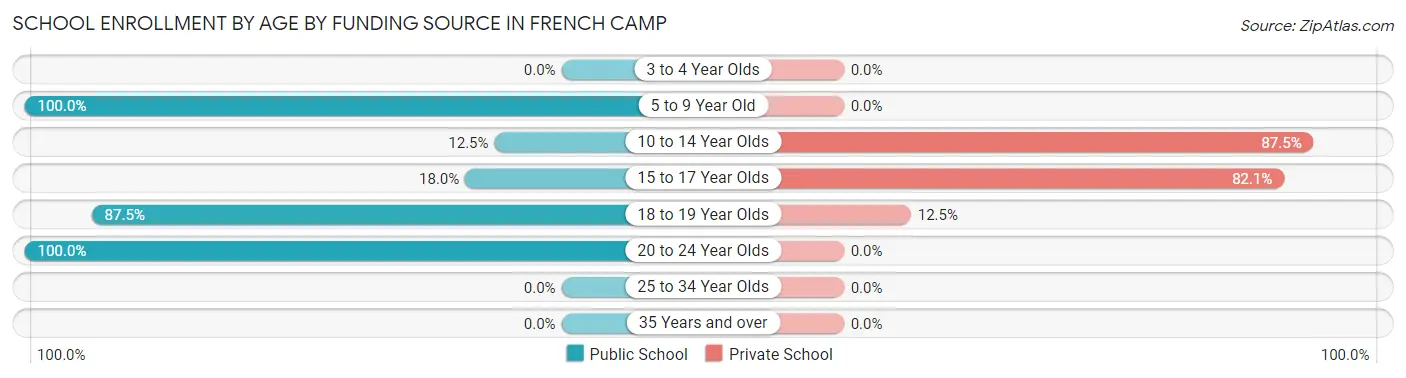
| Age Bracket | Public School | Private School |
| 3 to 4 Year Olds | 0 (0.0%) | 0 (0.0%) |
| 5 to 9 Year Old | 1 (100.0%) | 0 (0.0%) |
| 10 to 14 Year Olds | 2 (12.5%) | 14 (87.5%) |
| 15 to 17 Year Olds | 7 (17.9%) | 32 (82.1%) |
| 18 to 19 Year Olds | 7 (87.5%) | 1 (12.5%) |
| 20 to 24 Year Olds | 2 (100.0%) | 0 (0.0%) |
| 25 to 34 Year Olds | 0 (0.0%) | 0 (0.0%) |
| 35 Years and over | 0 (0.0%) | 0 (0.0%) |
| Total | 19 (28.8%) | 47 (71.2%) |
Educational Attainment by Field of Study in French Camp
Science & technology (13 | 17.1%), business (12 | 15.8%), education (12 | 15.8%), bio, nature & agricultural (11 | 14.5%), and visual & performing arts (10 | 13.2%) are the most common fields of study among 76 individuals in French Camp who have obtained a bachelor's degree or higher.
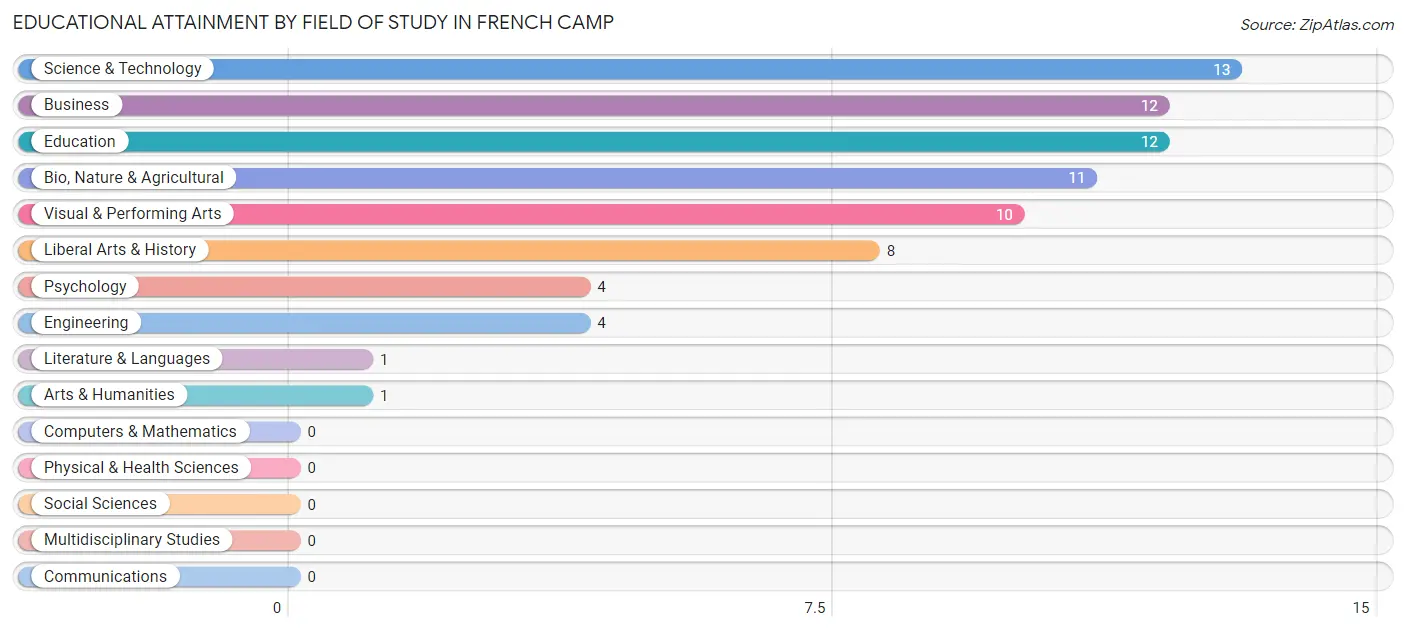
| Field of Study | # Graduates | % Graduates |
| Computers & Mathematics | 0 | 0.0% |
| Bio, Nature & Agricultural | 11 | 14.5% |
| Physical & Health Sciences | 0 | 0.0% |
| Psychology | 4 | 5.3% |
| Social Sciences | 0 | 0.0% |
| Engineering | 4 | 5.3% |
| Multidisciplinary Studies | 0 | 0.0% |
| Science & Technology | 13 | 17.1% |
| Business | 12 | 15.8% |
| Education | 12 | 15.8% |
| Literature & Languages | 1 | 1.3% |
| Liberal Arts & History | 8 | 10.5% |
| Visual & Performing Arts | 10 | 13.2% |
| Communications | 0 | 0.0% |
| Arts & Humanities | 1 | 1.3% |
| Total | 76 | 100.0% |
Transportation & Commute in French Camp
Vehicle Availability by Sex in French Camp
The most prevalent vehicle ownership categories in French Camp are males with 3 vehicles (15, accounting for 37.5%) and females with 3 vehicles (15, making up 30.6%).
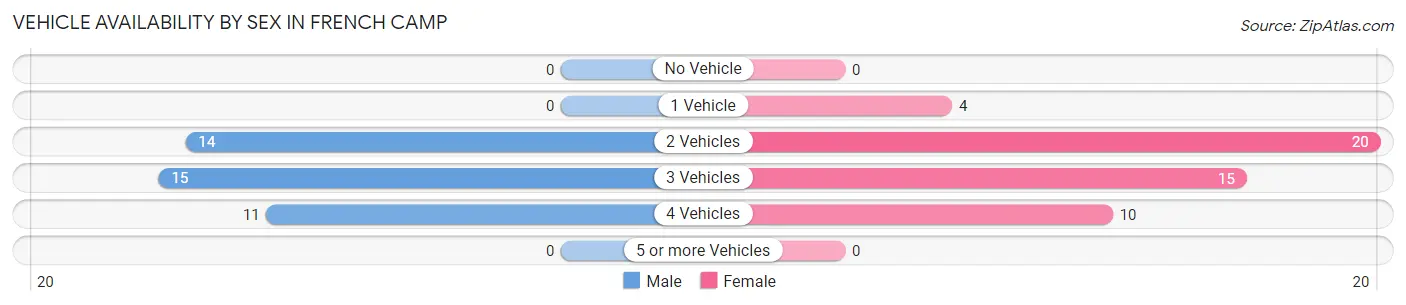
| Vehicles Available | Male | Female |
| No Vehicle | 0 (0.0%) | 0 (0.0%) |
| 1 Vehicle | 0 (0.0%) | 4 (8.2%) |
| 2 Vehicles | 14 (35.0%) | 20 (40.8%) |
| 3 Vehicles | 15 (37.5%) | 15 (30.6%) |
| 4 Vehicles | 11 (27.5%) | 10 (20.4%) |
| 5 or more Vehicles | 0 (0.0%) | 0 (0.0%) |
| Total | 40 (100.0%) | 49 (100.0%) |
Commute Time in French Camp
The most frequently occuring commute durations in French Camp are less than 5 minutes (36 commuters, 46.8%), 30 to 34 minutes (16 commuters, 20.8%), and 5 to 9 minutes (13 commuters, 16.9%).
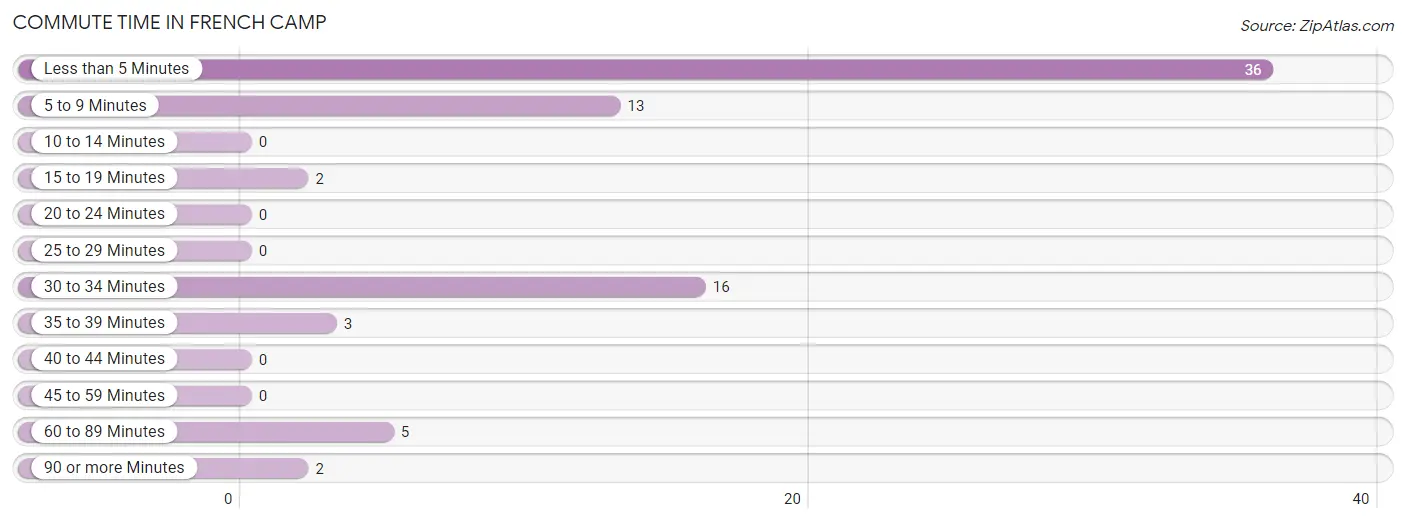
| Commute Time | # Commuters | % Commuters |
| Less than 5 Minutes | 36 | 46.8% |
| 5 to 9 Minutes | 13 | 16.9% |
| 10 to 14 Minutes | 0 | 0.0% |
| 15 to 19 Minutes | 2 | 2.6% |
| 20 to 24 Minutes | 0 | 0.0% |
| 25 to 29 Minutes | 0 | 0.0% |
| 30 to 34 Minutes | 16 | 20.8% |
| 35 to 39 Minutes | 3 | 3.9% |
| 40 to 44 Minutes | 0 | 0.0% |
| 45 to 59 Minutes | 0 | 0.0% |
| 60 to 89 Minutes | 5 | 6.5% |
| 90 or more Minutes | 2 | 2.6% |
Commute Time by Sex in French Camp
The most common commute times in French Camp are less than 5 minutes (24 commuters, 61.5%) for males and less than 5 minutes (12 commuters, 31.6%) for females.
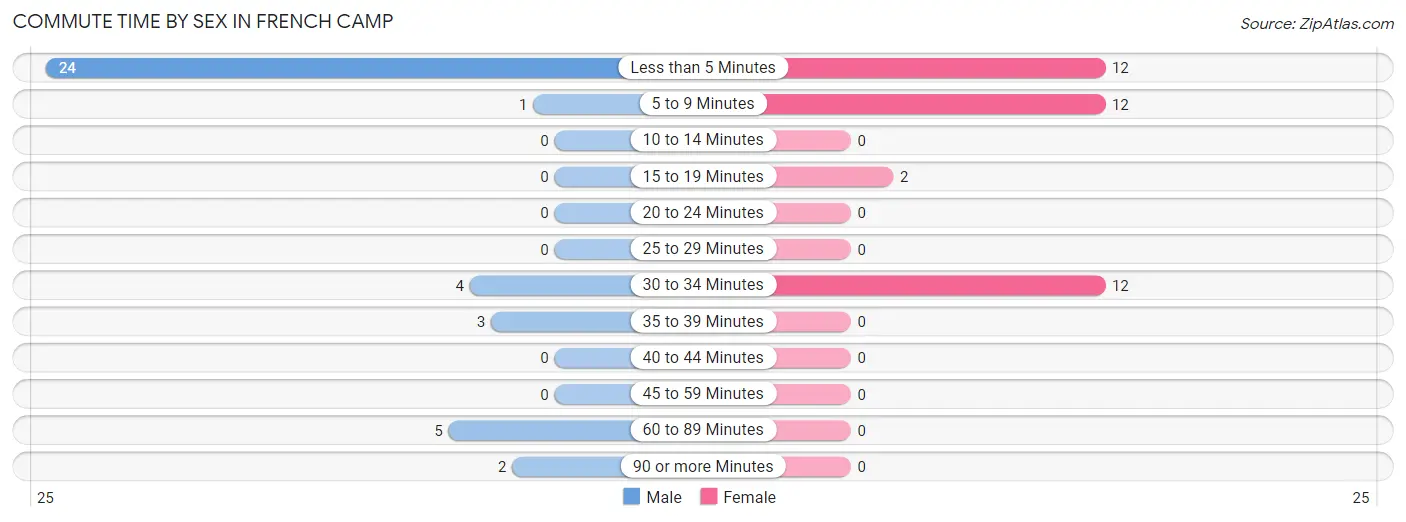
| Commute Time | Male | Female |
| Less than 5 Minutes | 24 (61.5%) | 12 (31.6%) |
| 5 to 9 Minutes | 1 (2.6%) | 12 (31.6%) |
| 10 to 14 Minutes | 0 (0.0%) | 0 (0.0%) |
| 15 to 19 Minutes | 0 (0.0%) | 2 (5.3%) |
| 20 to 24 Minutes | 0 (0.0%) | 0 (0.0%) |
| 25 to 29 Minutes | 0 (0.0%) | 0 (0.0%) |
| 30 to 34 Minutes | 4 (10.3%) | 12 (31.6%) |
| 35 to 39 Minutes | 3 (7.7%) | 0 (0.0%) |
| 40 to 44 Minutes | 0 (0.0%) | 0 (0.0%) |
| 45 to 59 Minutes | 0 (0.0%) | 0 (0.0%) |
| 60 to 89 Minutes | 5 (12.8%) | 0 (0.0%) |
| 90 or more Minutes | 2 (5.1%) | 0 (0.0%) |
Time of Departure to Work by Sex in French Camp
The most frequent times of departure to work in French Camp are 7:00 AM to 7:29 AM (9, 23.1%) for males and 7:30 AM to 7:59 AM (15, 39.5%) for females.
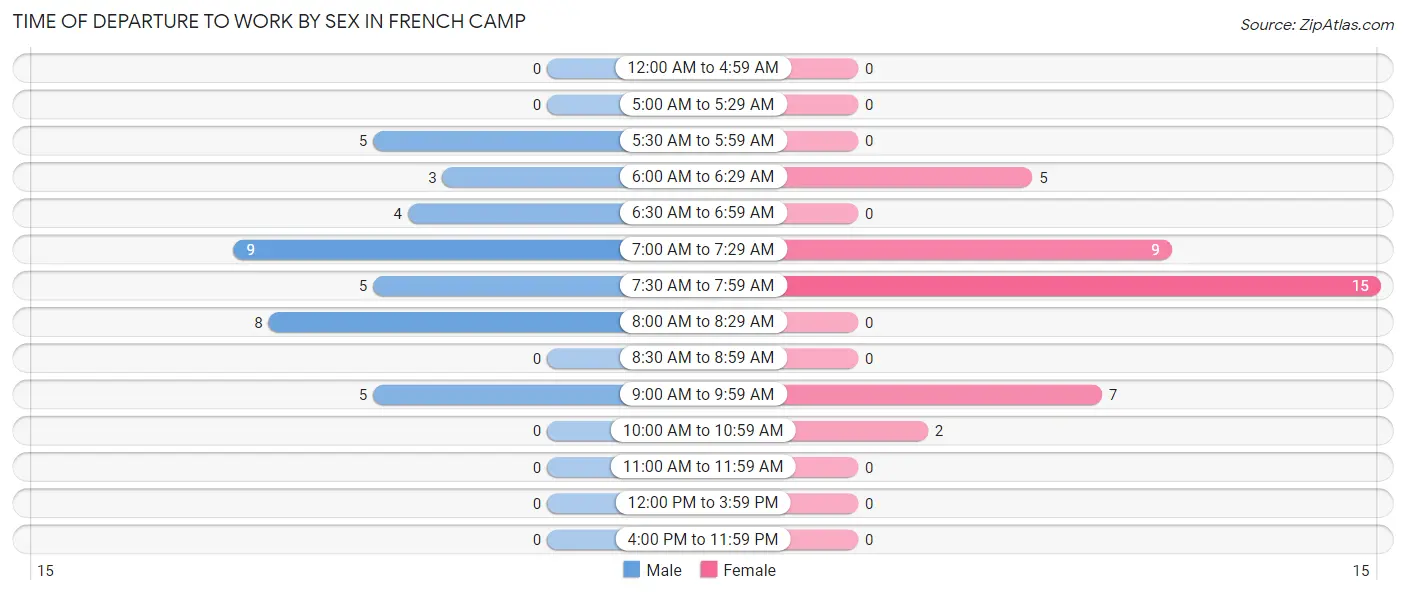
| Time of Departure | Male | Female |
| 12:00 AM to 4:59 AM | 0 (0.0%) | 0 (0.0%) |
| 5:00 AM to 5:29 AM | 0 (0.0%) | 0 (0.0%) |
| 5:30 AM to 5:59 AM | 5 (12.8%) | 0 (0.0%) |
| 6:00 AM to 6:29 AM | 3 (7.7%) | 5 (13.2%) |
| 6:30 AM to 6:59 AM | 4 (10.3%) | 0 (0.0%) |
| 7:00 AM to 7:29 AM | 9 (23.1%) | 9 (23.7%) |
| 7:30 AM to 7:59 AM | 5 (12.8%) | 15 (39.5%) |
| 8:00 AM to 8:29 AM | 8 (20.5%) | 0 (0.0%) |
| 8:30 AM to 8:59 AM | 0 (0.0%) | 0 (0.0%) |
| 9:00 AM to 9:59 AM | 5 (12.8%) | 7 (18.4%) |
| 10:00 AM to 10:59 AM | 0 (0.0%) | 2 (5.3%) |
| 11:00 AM to 11:59 AM | 0 (0.0%) | 0 (0.0%) |
| 12:00 PM to 3:59 PM | 0 (0.0%) | 0 (0.0%) |
| 4:00 PM to 11:59 PM | 0 (0.0%) | 0 (0.0%) |
| Total | 39 (100.0%) | 38 (100.0%) |
Housing Occupancy in French Camp
Occupancy by Ownership in French Camp
Of the total 73 dwellings in French Camp, owner-occupied units account for 43 (58.9%), while renter-occupied units make up 30 (41.1%).
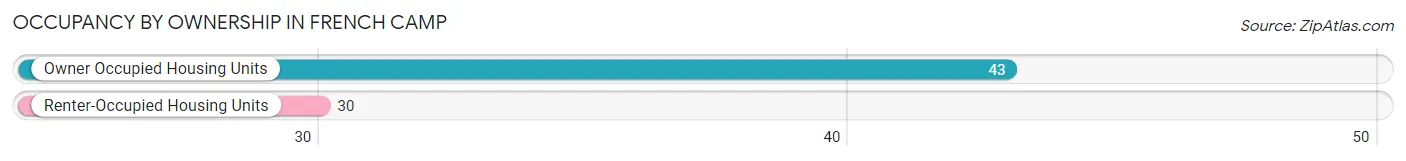
| Occupancy | # Housing Units | % Housing Units |
| Owner Occupied Housing Units | 43 | 58.9% |
| Renter-Occupied Housing Units | 30 | 41.1% |
| Total Occupied Housing Units | 73 | 100.0% |
Occupancy by Household Size in French Camp
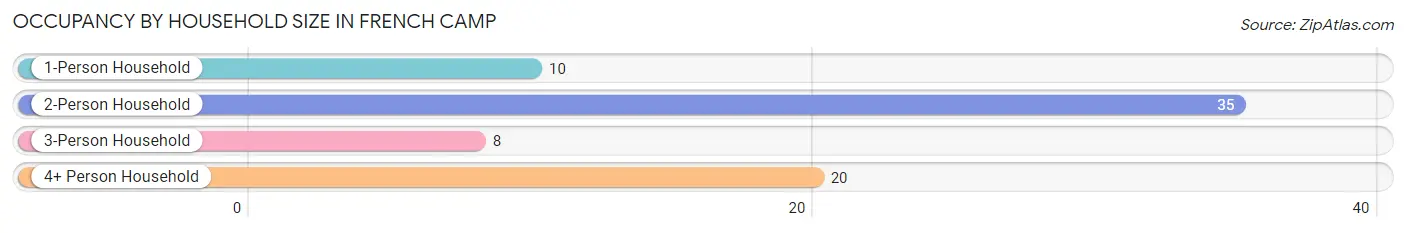
| Household Size | # Housing Units | % Housing Units |
| 1-Person Household | 10 | 13.7% |
| 2-Person Household | 35 | 47.9% |
| 3-Person Household | 8 | 11.0% |
| 4+ Person Household | 20 | 27.4% |
| Total Housing Units | 73 | 100.0% |
Occupancy by Ownership by Household Size in French Camp
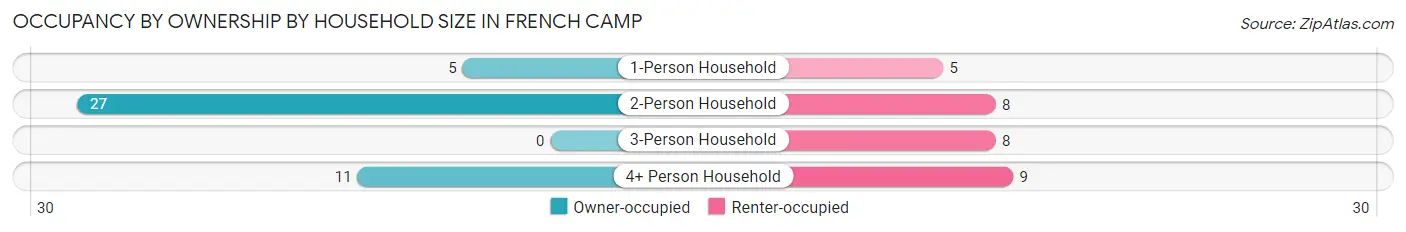
| Household Size | Owner-occupied | Renter-occupied |
| 1-Person Household | 5 (50.0%) | 5 (50.0%) |
| 2-Person Household | 27 (77.1%) | 8 (22.9%) |
| 3-Person Household | 0 (0.0%) | 8 (100.0%) |
| 4+ Person Household | 11 (55.0%) | 9 (45.0%) |
| Total Housing Units | 43 (58.9%) | 30 (41.1%) |
Occupancy by Educational Attainment in French Camp
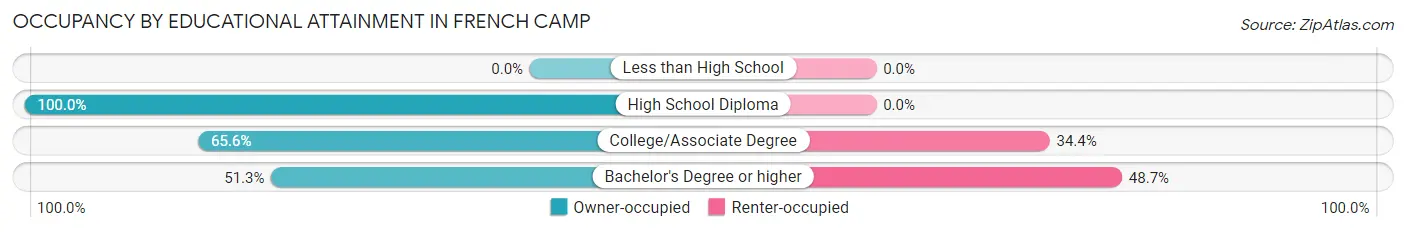
| Household Size | Owner-occupied | Renter-occupied |
| Less than High School | 0 (0.0%) | 0 (0.0%) |
| High School Diploma | 2 (100.0%) | 0 (0.0%) |
| College/Associate Degree | 21 (65.6%) | 11 (34.4%) |
| Bachelor's Degree or higher | 20 (51.3%) | 19 (48.7%) |
Occupancy by Age of Householder in French Camp
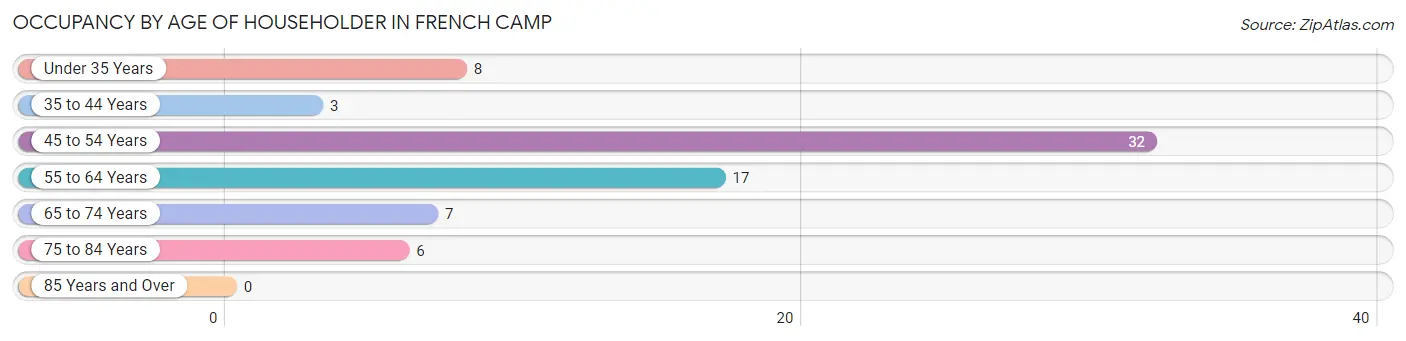
| Age Bracket | # Households | % Households |
| Under 35 Years | 8 | 11.0% |
| 35 to 44 Years | 3 | 4.1% |
| 45 to 54 Years | 32 | 43.8% |
| 55 to 64 Years | 17 | 23.3% |
| 65 to 74 Years | 7 | 9.6% |
| 75 to 84 Years | 6 | 8.2% |
| 85 Years and Over | 0 | 0.0% |
| Total | 73 | 100.0% |
Housing Finances in French Camp
Median Income by Occupancy in French Camp
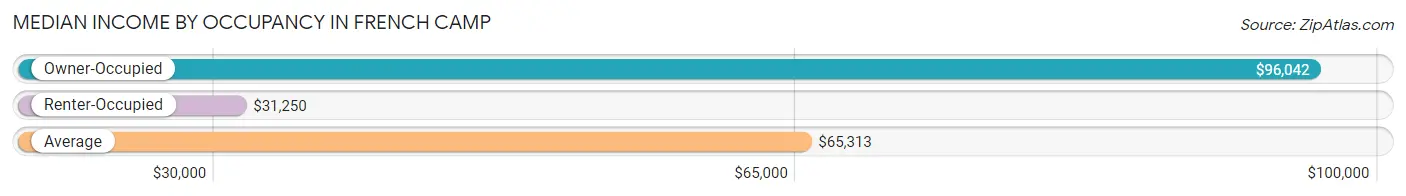
| Occupancy Type | # Households | Median Income |
| Owner-Occupied | 43 (58.9%) | $96,042 |
| Renter-Occupied | 30 (41.1%) | $31,250 |
| Average | 73 (100.0%) | $65,313 |
Occupancy by Householder Income Bracket in French Camp
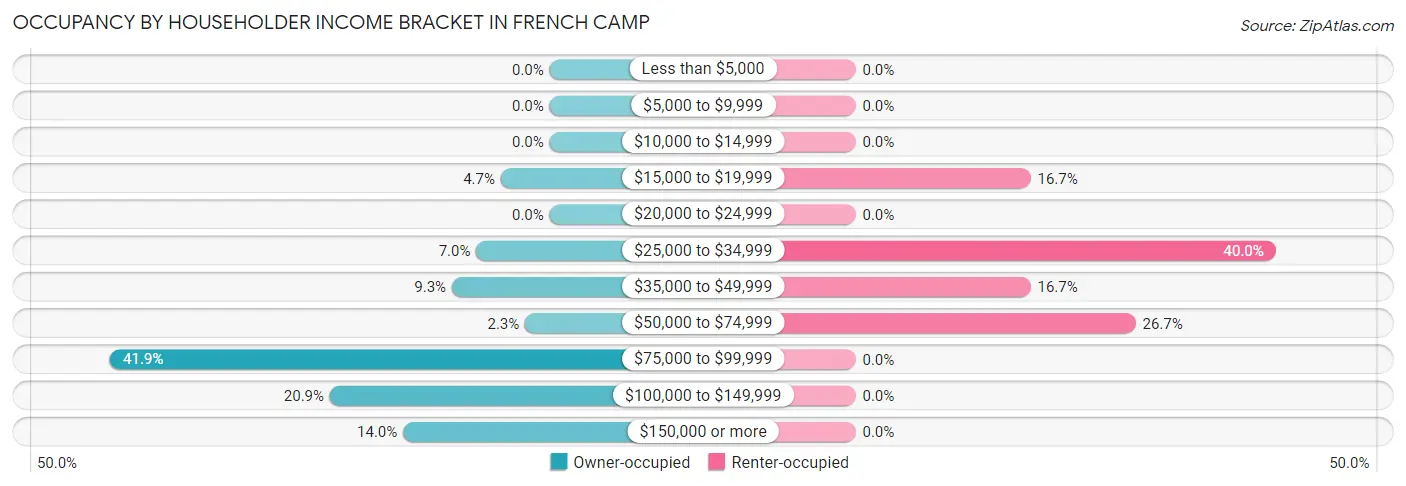
| Income Bracket | Owner-occupied | Renter-occupied |
| Less than $5,000 | 0 (0.0%) | 0 (0.0%) |
| $5,000 to $9,999 | 0 (0.0%) | 0 (0.0%) |
| $10,000 to $14,999 | 0 (0.0%) | 0 (0.0%) |
| $15,000 to $19,999 | 2 (4.6%) | 5 (16.7%) |
| $20,000 to $24,999 | 0 (0.0%) | 0 (0.0%) |
| $25,000 to $34,999 | 3 (7.0%) | 12 (40.0%) |
| $35,000 to $49,999 | 4 (9.3%) | 5 (16.7%) |
| $50,000 to $74,999 | 1 (2.3%) | 8 (26.7%) |
| $75,000 to $99,999 | 18 (41.9%) | 0 (0.0%) |
| $100,000 to $149,999 | 9 (20.9%) | 0 (0.0%) |
| $150,000 or more | 6 (14.0%) | 0 (0.0%) |
| Total | 43 (100.0%) | 30 (100.0%) |
Monthly Housing Cost Tiers in French Camp
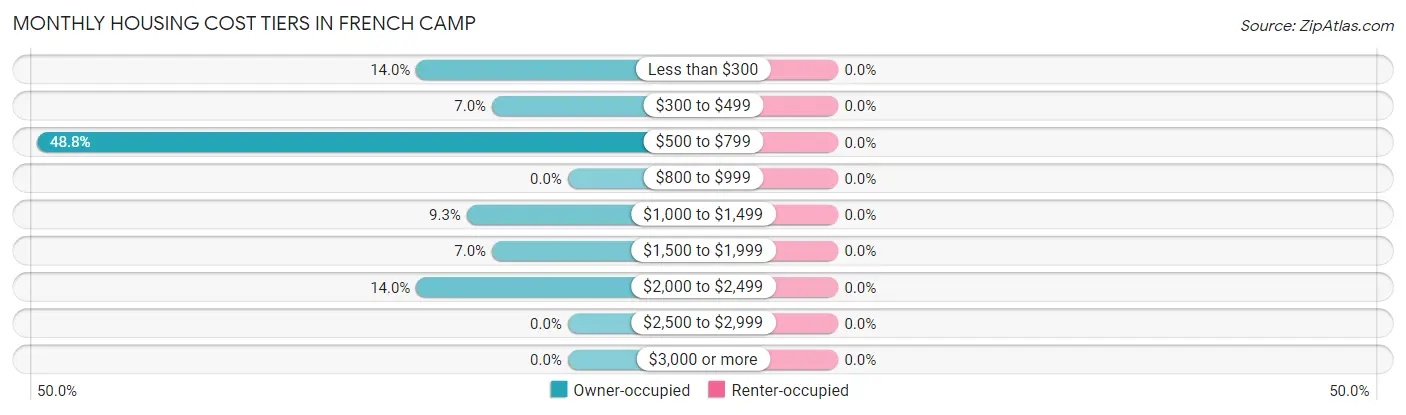
| Monthly Cost | Owner-occupied | Renter-occupied |
| Less than $300 | 6 (14.0%) | 0 (0.0%) |
| $300 to $499 | 3 (7.0%) | 0 (0.0%) |
| $500 to $799 | 21 (48.8%) | 0 (0.0%) |
| $800 to $999 | 0 (0.0%) | 0 (0.0%) |
| $1,000 to $1,499 | 4 (9.3%) | 0 (0.0%) |
| $1,500 to $1,999 | 3 (7.0%) | 0 (0.0%) |
| $2,000 to $2,499 | 6 (14.0%) | 0 (0.0%) |
| $2,500 to $2,999 | 0 (0.0%) | 0 (0.0%) |
| $3,000 or more | 0 (0.0%) | 0 (0.0%) |
| Total | 43 (100.0%) | 30 (100.0%) |
Physical Housing Characteristics in French Camp
Housing Structures in French Camp
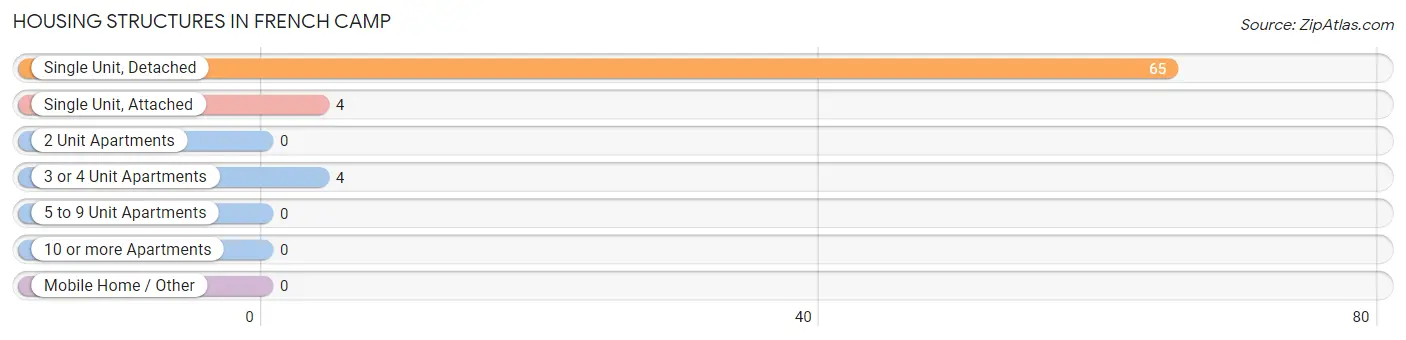
| Structure Type | # Housing Units | % Housing Units |
| Single Unit, Detached | 65 | 89.0% |
| Single Unit, Attached | 4 | 5.5% |
| 2 Unit Apartments | 0 | 0.0% |
| 3 or 4 Unit Apartments | 4 | 5.5% |
| 5 to 9 Unit Apartments | 0 | 0.0% |
| 10 or more Apartments | 0 | 0.0% |
| Mobile Home / Other | 0 | 0.0% |
| Total | 73 | 100.0% |
Housing Structures by Occupancy in French Camp
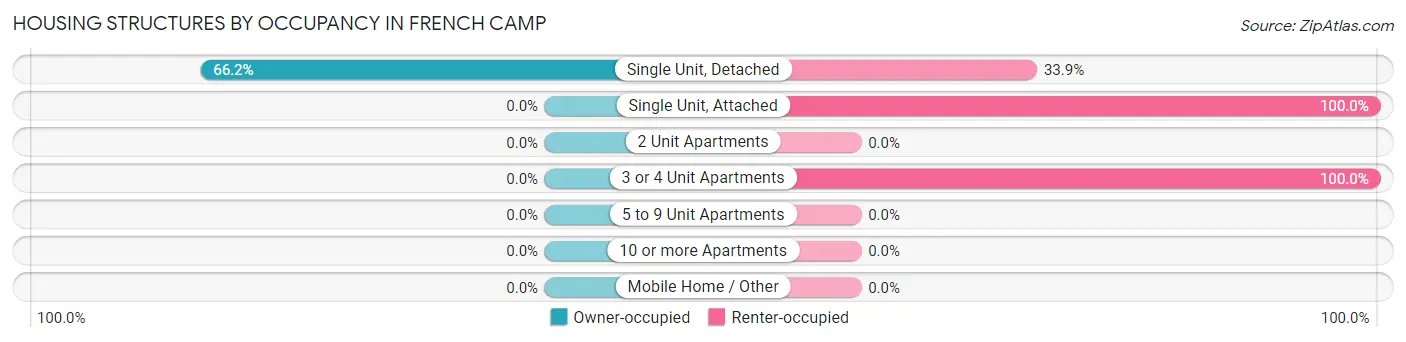
| Structure Type | Owner-occupied | Renter-occupied |
| Single Unit, Detached | 43 (66.1%) | 22 (33.9%) |
| Single Unit, Attached | 0 (0.0%) | 4 (100.0%) |
| 2 Unit Apartments | 0 (0.0%) | 0 (0.0%) |
| 3 or 4 Unit Apartments | 0 (0.0%) | 4 (100.0%) |
| 5 to 9 Unit Apartments | 0 (0.0%) | 0 (0.0%) |
| 10 or more Apartments | 0 (0.0%) | 0 (0.0%) |
| Mobile Home / Other | 0 (0.0%) | 0 (0.0%) |
| Total | 43 (58.9%) | 30 (41.1%) |
Housing Structures by Number of Rooms in French Camp
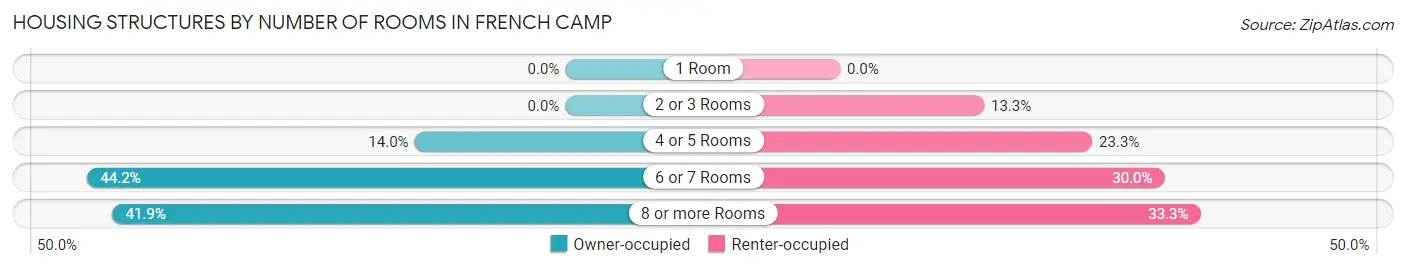
| Number of Rooms | Owner-occupied | Renter-occupied |
| 1 Room | 0 (0.0%) | 0 (0.0%) |
| 2 or 3 Rooms | 0 (0.0%) | 4 (13.3%) |
| 4 or 5 Rooms | 6 (14.0%) | 7 (23.3%) |
| 6 or 7 Rooms | 19 (44.2%) | 9 (30.0%) |
| 8 or more Rooms | 18 (41.9%) | 10 (33.3%) |
| Total | 43 (100.0%) | 30 (100.0%) |
Housing Structure by Heating Type in French Camp
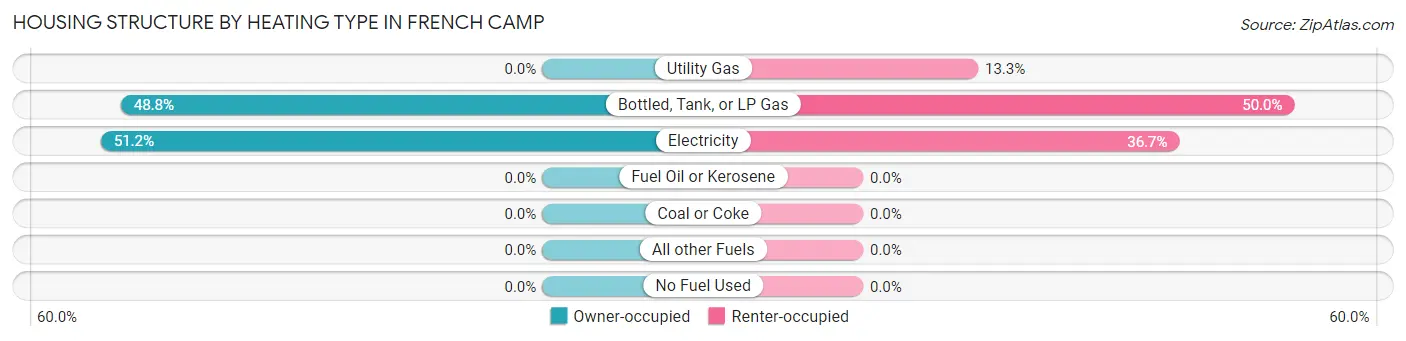
| Heating Type | Owner-occupied | Renter-occupied |
| Utility Gas | 0 (0.0%) | 4 (13.3%) |
| Bottled, Tank, or LP Gas | 21 (48.8%) | 15 (50.0%) |
| Electricity | 22 (51.2%) | 11 (36.7%) |
| Fuel Oil or Kerosene | 0 (0.0%) | 0 (0.0%) |
| Coal or Coke | 0 (0.0%) | 0 (0.0%) |
| All other Fuels | 0 (0.0%) | 0 (0.0%) |
| No Fuel Used | 0 (0.0%) | 0 (0.0%) |
| Total | 43 (100.0%) | 30 (100.0%) |
Household Vehicle Usage in French Camp
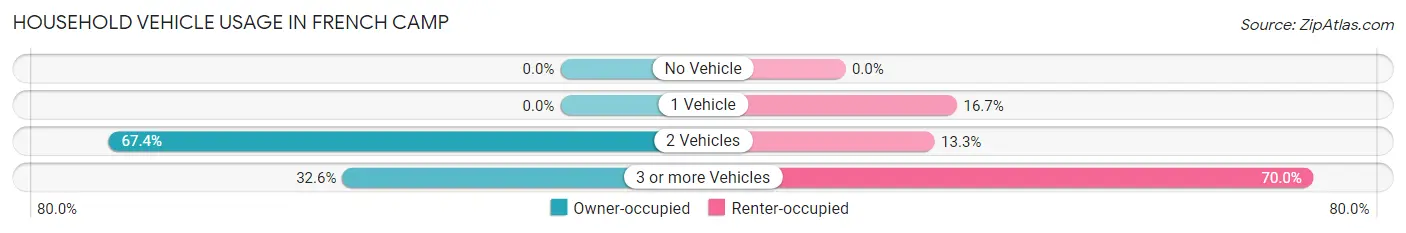
| Vehicles per Household | Owner-occupied | Renter-occupied |
| No Vehicle | 0 (0.0%) | 0 (0.0%) |
| 1 Vehicle | 0 (0.0%) | 5 (16.7%) |
| 2 Vehicles | 29 (67.4%) | 4 (13.3%) |
| 3 or more Vehicles | 14 (32.6%) | 21 (70.0%) |
| Total | 43 (100.0%) | 30 (100.0%) |
Real Estate & Mortgages in French Camp
Real Estate and Mortgage Overview in French Camp
| Characteristic | Without Mortgage | With Mortgage |
| Housing Units | 28 | 15 |
| Median Property Value | $283,300 | $316,700 |
| Median Household Income | $94,167 | $2 |
| Monthly Housing Costs | $609 | $0 |
| Real Estate Taxes | - | - |
Property Value by Mortgage Status in French Camp
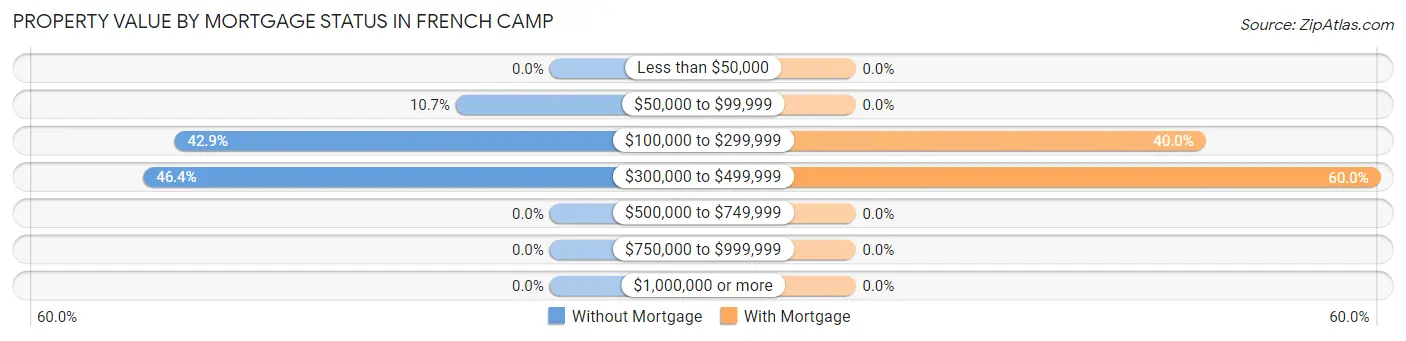
| Property Value | Without Mortgage | With Mortgage |
| Less than $50,000 | 0 (0.0%) | 0 (0.0%) |
| $50,000 to $99,999 | 3 (10.7%) | 0 (0.0%) |
| $100,000 to $299,999 | 12 (42.9%) | 6 (40.0%) |
| $300,000 to $499,999 | 13 (46.4%) | 9 (60.0%) |
| $500,000 to $749,999 | 0 (0.0%) | 0 (0.0%) |
| $750,000 to $999,999 | 0 (0.0%) | 0 (0.0%) |
| $1,000,000 or more | 0 (0.0%) | 0 (0.0%) |
| Total | 28 (100.0%) | 15 (100.0%) |
Household Income by Mortgage Status in French Camp
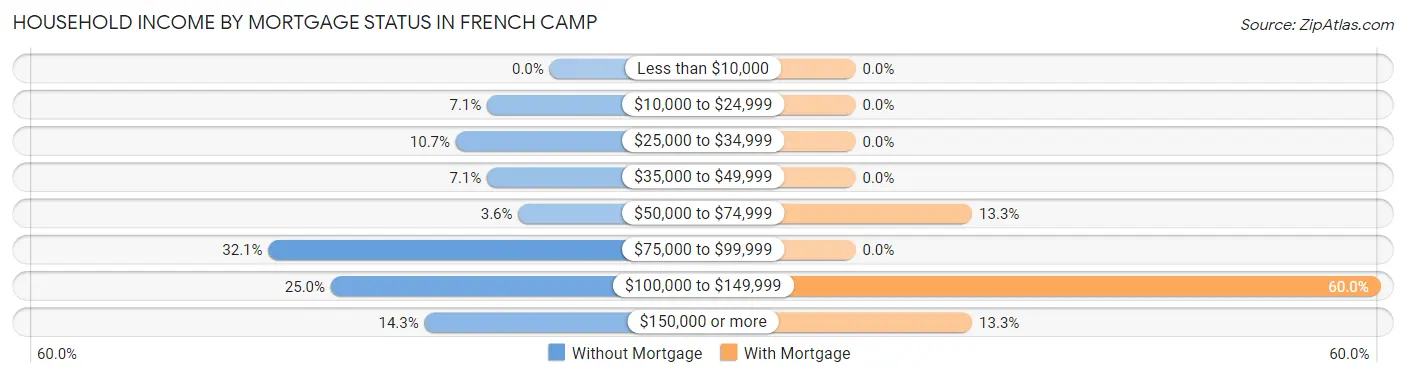
| Household Income | Without Mortgage | With Mortgage |
| Less than $10,000 | 0 (0.0%) | 0 (0.0%) |
| $10,000 to $24,999 | 2 (7.1%) | 0 (0.0%) |
| $25,000 to $34,999 | 3 (10.7%) | 0 (0.0%) |
| $35,000 to $49,999 | 2 (7.1%) | 0 (0.0%) |
| $50,000 to $74,999 | 1 (3.6%) | 2 (13.3%) |
| $75,000 to $99,999 | 9 (32.1%) | 0 (0.0%) |
| $100,000 to $149,999 | 7 (25.0%) | 9 (60.0%) |
| $150,000 or more | 4 (14.3%) | 2 (13.3%) |
| Total | 28 (100.0%) | 15 (100.0%) |
Property Value to Household Income Ratio in French Camp
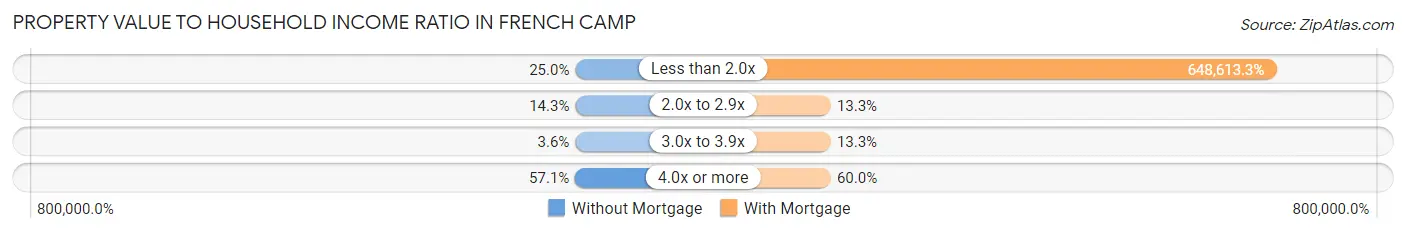
| Value-to-Income Ratio | Without Mortgage | With Mortgage |
| Less than 2.0x | 7 (25.0%) | 97,292 (648,613.3%) |
| 2.0x to 2.9x | 4 (14.3%) | 2 (13.3%) |
| 3.0x to 3.9x | 1 (3.6%) | 2 (13.3%) |
| 4.0x or more | 16 (57.1%) | 9 (60.0%) |
| Total | 28 (100.0%) | 15 (100.0%) |
Real Estate Taxes by Mortgage Status in French Camp
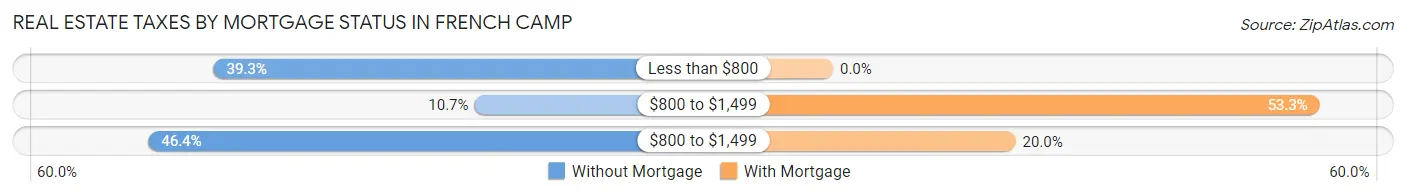
| Property Taxes | Without Mortgage | With Mortgage |
| Less than $800 | 11 (39.3%) | 0 (0.0%) |
| $800 to $1,499 | 3 (10.7%) | 8 (53.3%) |
| $800 to $1,499 | 13 (46.4%) | 3 (20.0%) |
| Total | 28 (100.0%) | 15 (100.0%) |
Health & Disability in French Camp
Health Insurance Coverage by Age in French Camp
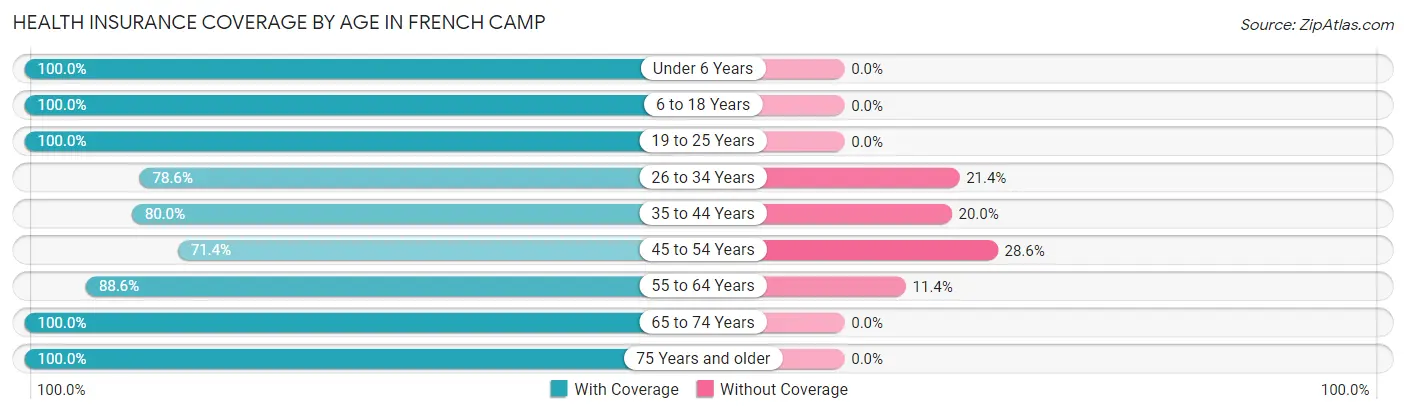
| Age Bracket | With Coverage | Without Coverage |
| Under 6 Years | 6 (100.0%) | 0 (0.0%) |
| 6 to 18 Years | 44 (100.0%) | 0 (0.0%) |
| 19 to 25 Years | 23 (100.0%) | 0 (0.0%) |
| 26 to 34 Years | 11 (78.6%) | 3 (21.4%) |
| 35 to 44 Years | 16 (80.0%) | 4 (20.0%) |
| 45 to 54 Years | 45 (71.4%) | 18 (28.6%) |
| 55 to 64 Years | 31 (88.6%) | 4 (11.4%) |
| 65 to 74 Years | 14 (100.0%) | 0 (0.0%) |
| 75 Years and older | 8 (100.0%) | 0 (0.0%) |
| Total | 198 (87.2%) | 29 (12.8%) |
Health Insurance Coverage by Citizenship Status in French Camp
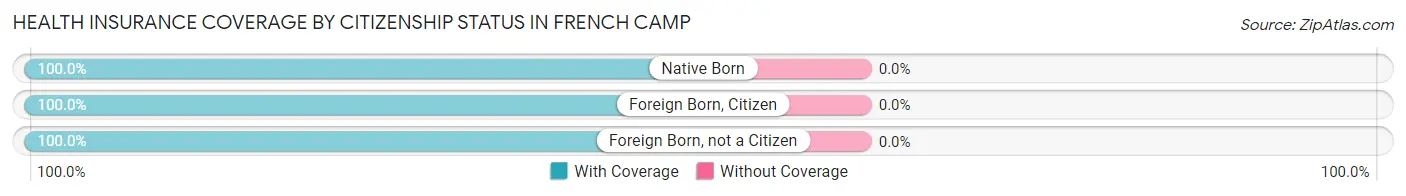
| Citizenship Status | With Coverage | Without Coverage |
| Native Born | 6 (100.0%) | 0 (0.0%) |
| Foreign Born, Citizen | 44 (100.0%) | 0 (0.0%) |
| Foreign Born, not a Citizen | 23 (100.0%) | 0 (0.0%) |
Health Insurance Coverage by Household Income in French Camp
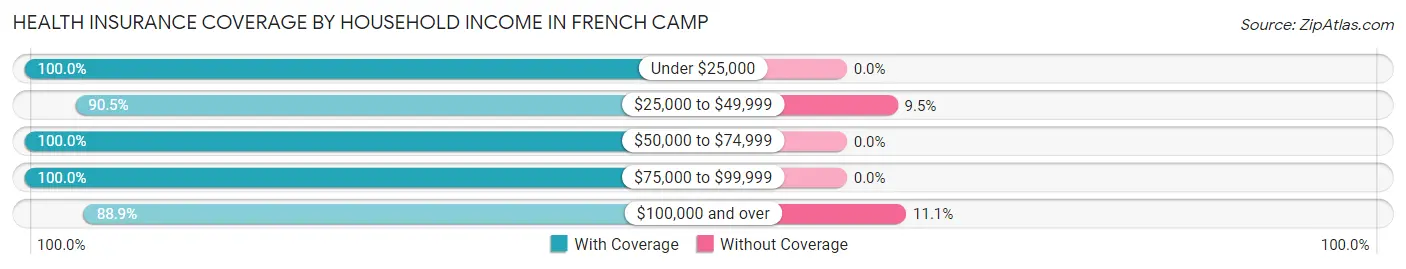
| Household Income | With Coverage | Without Coverage |
| Under $25,000 | 7 (100.0%) | 0 (0.0%) |
| $25,000 to $49,999 | 57 (90.5%) | 6 (9.5%) |
| $50,000 to $74,999 | 22 (100.0%) | 0 (0.0%) |
| $75,000 to $99,999 | 53 (100.0%) | 0 (0.0%) |
| $100,000 and over | 32 (88.9%) | 4 (11.1%) |
Public vs Private Health Insurance Coverage by Age in French Camp
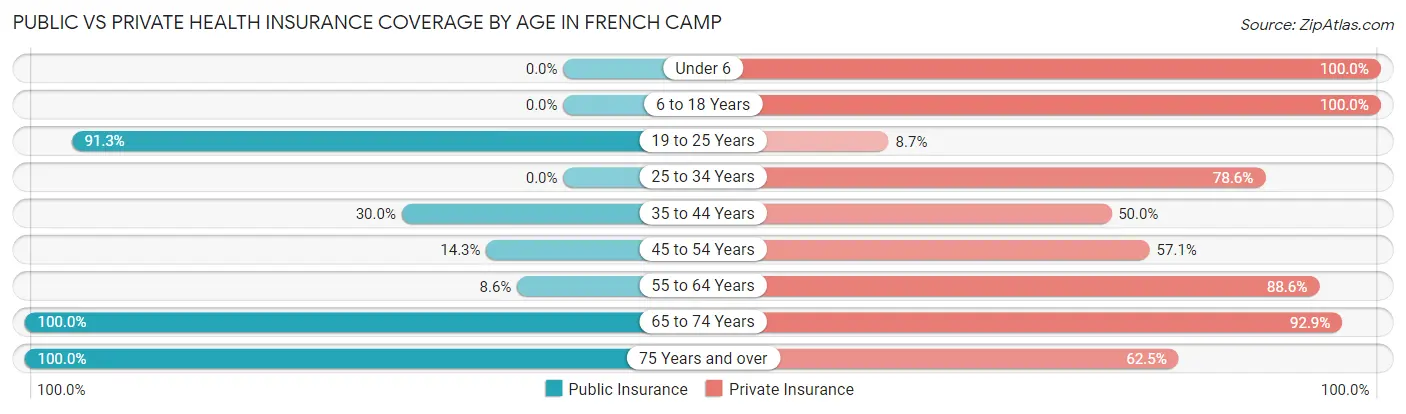
| Age Bracket | Public Insurance | Private Insurance |
| Under 6 | 0 (0.0%) | 6 (100.0%) |
| 6 to 18 Years | 0 (0.0%) | 44 (100.0%) |
| 19 to 25 Years | 21 (91.3%) | 2 (8.7%) |
| 25 to 34 Years | 0 (0.0%) | 11 (78.6%) |
| 35 to 44 Years | 6 (30.0%) | 10 (50.0%) |
| 45 to 54 Years | 9 (14.3%) | 36 (57.1%) |
| 55 to 64 Years | 3 (8.6%) | 31 (88.6%) |
| 65 to 74 Years | 14 (100.0%) | 13 (92.9%) |
| 75 Years and over | 8 (100.0%) | 5 (62.5%) |
| Total | 61 (26.9%) | 158 (69.6%) |
Disability Status by Sex by Age in French Camp
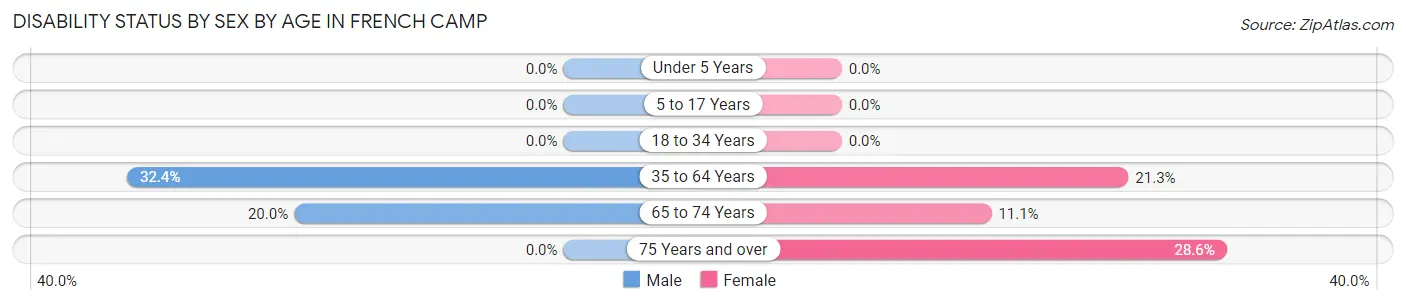
| Age Bracket | Male | Female |
| Under 5 Years | 0 (0.0%) | 0 (0.0%) |
| 5 to 17 Years | 0 (0.0%) | 0 (0.0%) |
| 18 to 34 Years | 0 (0.0%) | 0 (0.0%) |
| 35 to 64 Years | 23 (32.4%) | 10 (21.3%) |
| 65 to 74 Years | 1 (20.0%) | 1 (11.1%) |
| 75 Years and over | 0 (0.0%) | 2 (28.6%) |
Disability Class by Sex by Age in French Camp
Disability Class: Hearing Difficulty
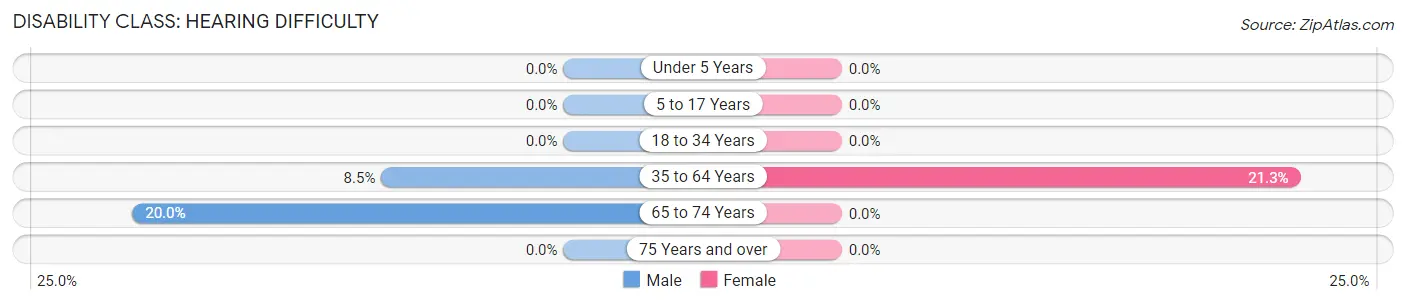
| Age Bracket | Male | Female |
| Under 5 Years | 0 (0.0%) | 0 (0.0%) |
| 5 to 17 Years | 0 (0.0%) | 0 (0.0%) |
| 18 to 34 Years | 0 (0.0%) | 0 (0.0%) |
| 35 to 64 Years | 6 (8.5%) | 10 (21.3%) |
| 65 to 74 Years | 1 (20.0%) | 0 (0.0%) |
| 75 Years and over | 0 (0.0%) | 0 (0.0%) |
Disability Class: Vision Difficulty
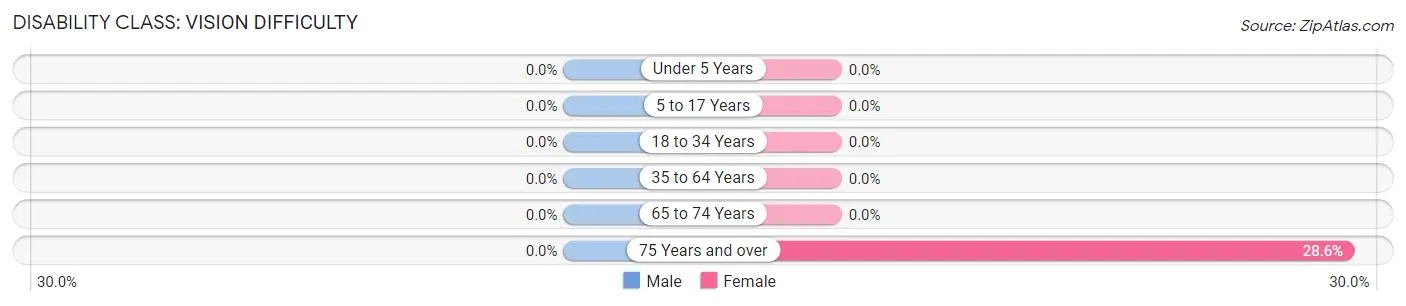
| Age Bracket | Male | Female |
| Under 5 Years | 0 (0.0%) | 0 (0.0%) |
| 5 to 17 Years | 0 (0.0%) | 0 (0.0%) |
| 18 to 34 Years | 0 (0.0%) | 0 (0.0%) |
| 35 to 64 Years | 0 (0.0%) | 0 (0.0%) |
| 65 to 74 Years | 0 (0.0%) | 0 (0.0%) |
| 75 Years and over | 0 (0.0%) | 2 (28.6%) |
Disability Class: Cognitive Difficulty
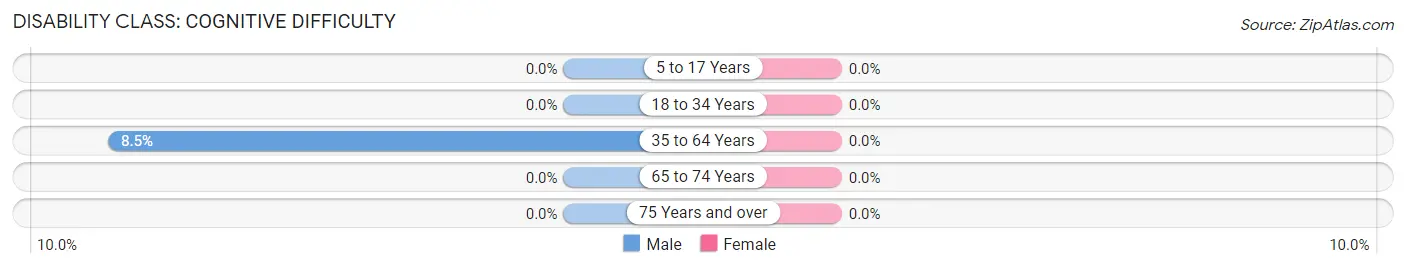
| Age Bracket | Male | Female |
| 5 to 17 Years | 0 (0.0%) | 0 (0.0%) |
| 18 to 34 Years | 0 (0.0%) | 0 (0.0%) |
| 35 to 64 Years | 6 (8.5%) | 0 (0.0%) |
| 65 to 74 Years | 0 (0.0%) | 0 (0.0%) |
| 75 Years and over | 0 (0.0%) | 0 (0.0%) |
Disability Class: Ambulatory Difficulty
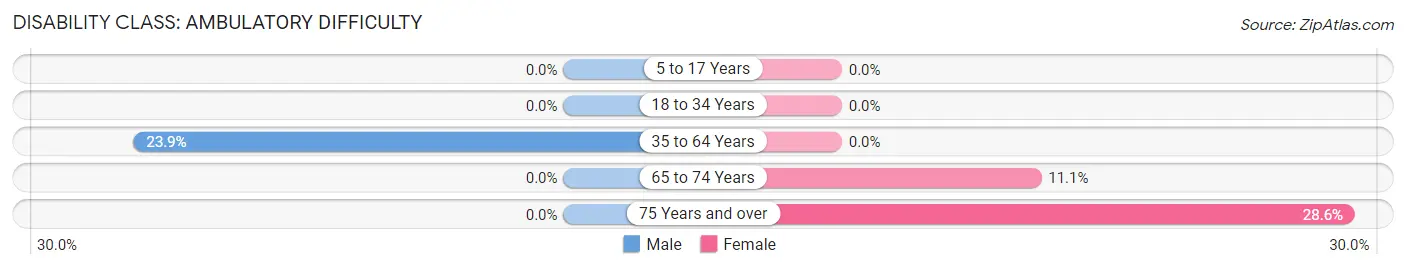
| Age Bracket | Male | Female |
| 5 to 17 Years | 0 (0.0%) | 0 (0.0%) |
| 18 to 34 Years | 0 (0.0%) | 0 (0.0%) |
| 35 to 64 Years | 17 (23.9%) | 0 (0.0%) |
| 65 to 74 Years | 0 (0.0%) | 1 (11.1%) |
| 75 Years and over | 0 (0.0%) | 2 (28.6%) |
Disability Class: Self-Care Difficulty
| Age Bracket | Male | Female |
| 5 to 17 Years | 0 (0.0%) | 0 (0.0%) |
| 18 to 34 Years | 0 (0.0%) | 0 (0.0%) |
| 35 to 64 Years | 17 (23.9%) | 0 (0.0%) |
| 65 to 74 Years | 0 (0.0%) | 0 (0.0%) |
| 75 Years and over | 0 (0.0%) | 0 (0.0%) |
Technology Access in French Camp
Computing Device Access in French Camp
| Device Type | # Households | % Households |
| Desktop or Laptop | 60 | 82.2% |
| Smartphone | 70 | 95.9% |
| Tablet | 60 | 82.2% |
| No Computing Device | 2 | 2.7% |
| Total | 73 | 100.0% |
Internet Access in French Camp
| Internet Type | # Households | % Households |
| Dial-Up Internet | 0 | 0.0% |
| Broadband Home | 45 | 61.6% |
| Cellular Data Only | 14 | 19.2% |
| Satellite Internet | 0 | 0.0% |
| No Internet | 8 | 11.0% |
| Total | 73 | 100.0% |
French Camp Summary
History
French Camp is a small town located in Choctaw County, Mississippi. It is situated on the banks of the Tombigbee River, about 20 miles south of the state capital of Jackson. The town was founded in 1810 by French settlers who had come to the area to establish a trading post. The town was named after the French settlers, and it has remained a small, rural community ever since.
The town was an important stop on the Natchez Trace, a historic road that connected the Mississippi River to the Gulf of Mexico. The Natchez Trace was used by Native Americans, settlers, and traders for centuries, and it was an important part of the early development of the region.
During the Civil War, French Camp was the site of a Confederate camp. The town was also the site of a major battle in 1864, when Union forces attempted to capture the town. The Union forces were unsuccessful, and the town remained in Confederate hands until the end of the war.
Geography
French Camp is located in the southeastern corner of Choctaw County, Mississippi. It is situated on the banks of the Tombigbee River, about 20 miles south of the state capital of Jackson. The town is surrounded by rolling hills and forests, and it is located in the heart of the Mississippi Delta.
The climate in French Camp is humid and subtropical, with hot summers and mild winters. The average annual temperature is around 70 degrees Fahrenheit, and the average annual precipitation is around 50 inches.
Economy
The economy of French Camp is largely based on agriculture. The town is home to several large farms, and the surrounding area is known for its cotton, soybeans, and corn production. The town also has a small manufacturing sector, with several small factories producing furniture, clothing, and other goods.
The town is also home to several small businesses, including restaurants, stores, and other services. The town is also home to a small airport, which serves the surrounding area.
Demographics
As of the 2010 census, the population of French Camp was 1,845. The town is predominantly white, with a small African American population. The median household income is around $30,000, and the median home value is around $90,000.
The town is served by the Choctaw County School District, which includes two elementary schools, one middle school, and one high school. The town is also home to a branch of the East Mississippi Community College.
Conclusion
French Camp is a small, rural town located in Choctaw County, Mississippi. It was founded in 1810 by French settlers, and it has remained a small, rural community ever since. The town is situated on the banks of the Tombigbee River, and it is surrounded by rolling hills and forests. The economy of French Camp is largely based on agriculture, and the town is home to several small businesses. As of the 2010 census, the population of French Camp was 1,845. The town is served by the Choctaw County School District, and it is home to a branch of the East Mississippi Community College.
Common Questions
What is Per Capita Income in French Camp?
Per Capita income in French Camp is $23,574.
What is the Median Family Income in French Camp?
Median Family Income in French Camp is $64,688.
What is the Median Household income in French Camp?
Median Household Income in French Camp is $65,313.
What is Income or Wage Gap in French Camp?
Income or Wage Gap in French Camp is 39.9%.
Women in French Camp earn 60.1 cents for every dollar earned by a man.
What is Inequality or Gini Index in French Camp?
Inequality or Gini Index in French Camp is 0.34.
What is the Total Population of French Camp?
Total Population of French Camp is 247.
What is the Total Male Population of French Camp?
Total Male Population of French Camp is 140.
What is the Total Female Population of French Camp?
Total Female Population of French Camp is 107.
What is the Ratio of Males per 100 Females in French Camp?
There are 130.84 Males per 100 Females in French Camp.
What is the Ratio of Females per 100 Males in French Camp?
There are 76.43 Females per 100 Males in French Camp.
What is the Median Population Age in French Camp?
Median Population Age in French Camp is 44.1 Years.
What is the Average Family Size in French Camp
Average Family Size in French Camp is 2.5 People.
What is the Average Household Size in French Camp
Average Household Size in French Camp is 2.5 People.
How Large is the Labor Force in French Camp?
There are 92 People in the Labor Forcein in French Camp.
What is the Percentage of People in the Labor Force in French Camp?
45.8% of People are in the Labor Force in French Camp.
What is the Unemployment Rate in French Camp?
Unemployment Rate in French Camp is 2.2%.