Helena, MS Map & Demographics
Helena Map
Helena Overview
$48,212
PER CAPITA INCOME
$98,398
AVG FAMILY INCOME
$98,281
AVG HOUSEHOLD INCOME
0.33
INEQUALITY / GINI INDEX
692
TOTAL POPULATION
395
MALE POPULATION
297
FEMALE POPULATION
133.00
MALES / 100 FEMALES
75.19
FEMALES / 100 MALES
61.6
MEDIAN AGE
2.3
AVG FAMILY SIZE
2.3
AVG HOUSEHOLD SIZE
385
LABOR FORCE [ PEOPLE ]
57.3%
PERCENT IN LABOR FORCE
1.3%
UNEMPLOYMENT RATE
Income in Helena
Income Overview in Helena
Per Capita Income in Helena is $48,212, while median incomes of families and households are $98,398 and $98,281 respectively.
| Characteristic | Number | Measure |
| Per Capita Income | 692 | $48,212 |
| Median Family Income | 297 | $98,398 |
| Mean Family Income | 297 | $104,353 |
| Median Household Income | 300 | $98,281 |
| Mean Household Income | 300 | $104,039 |
| Income Deficit | 297 | $0 |
| Wage / Income Gap (%) | 692 | 0.00% |
| Wage / Income Gap ($) | 692 | 100.00¢ per $1 |
| Gini / Inequality Index | 692 | 0.33 |
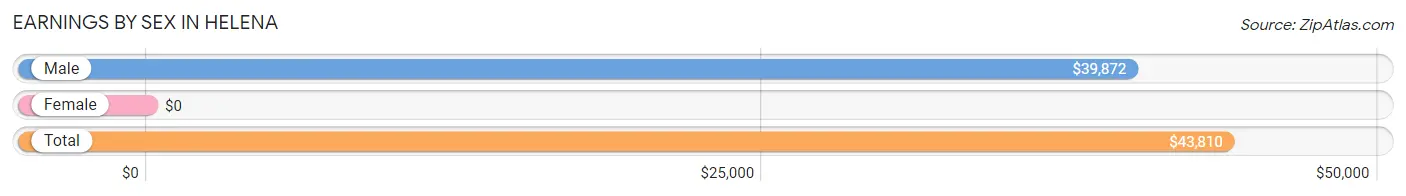
Earnings by Sex in Helena
| Sex | Number | Average Earnings |
| Male | 297 (66.0%) | $39,872 |
| Female | 153 (34.0%) | $0 |
| Total | 450 (100.0%) | $43,810 |
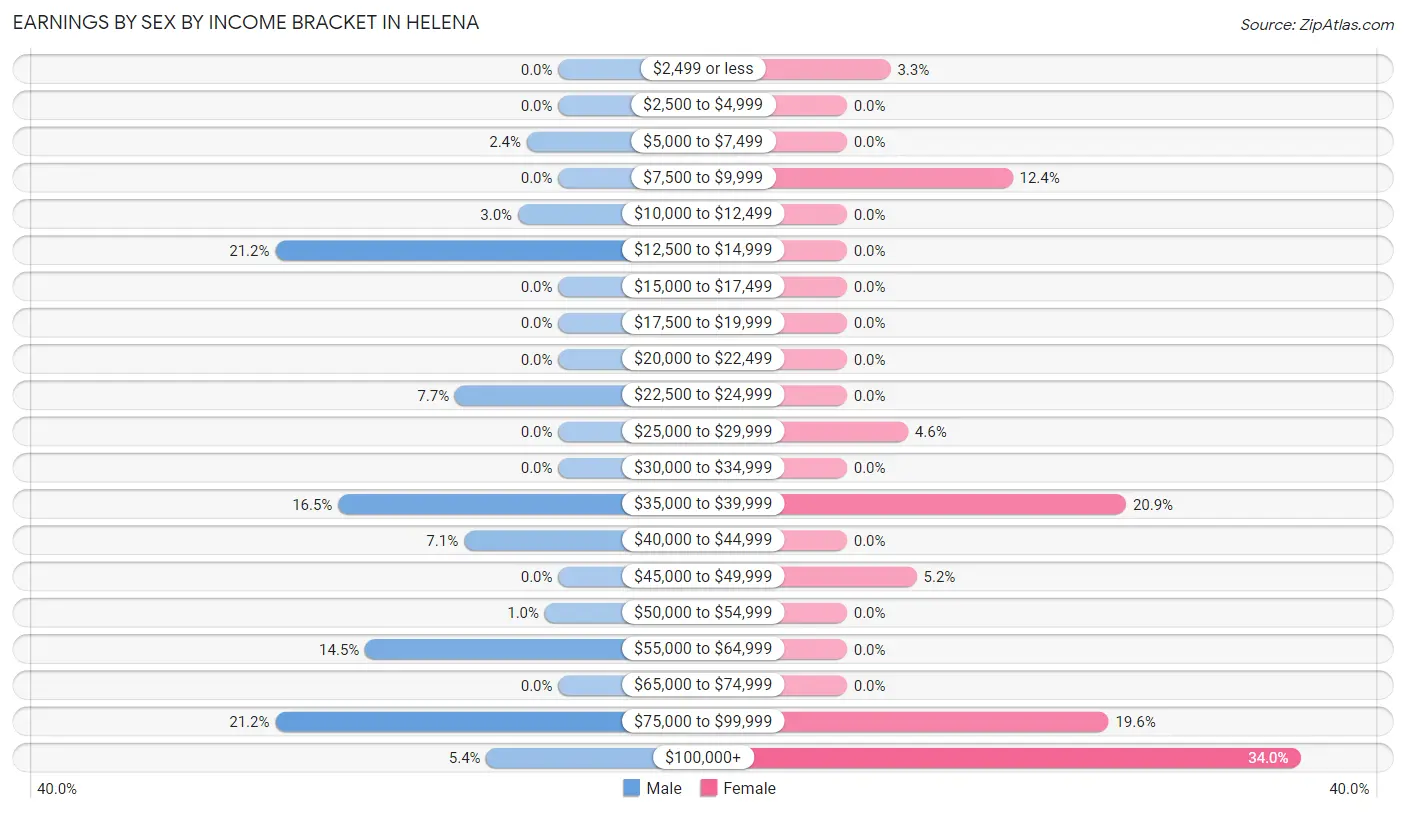
Earnings by Sex by Income Bracket in Helena
The most common earnings brackets in Helena are $12,500 to $14,999 for men (63 | 21.2%) and $100,000+ for women (52 | 34.0%).
| Income | Male | Female |
| $2,499 or less | 0 (0.0%) | 5 (3.3%) |
| $2,500 to $4,999 | 0 (0.0%) | 0 (0.0%) |
| $5,000 to $7,499 | 7 (2.4%) | 0 (0.0%) |
| $7,500 to $9,999 | 0 (0.0%) | 19 (12.4%) |
| $10,000 to $12,499 | 9 (3.0%) | 0 (0.0%) |
| $12,500 to $14,999 | 63 (21.2%) | 0 (0.0%) |
| $15,000 to $17,499 | 0 (0.0%) | 0 (0.0%) |
| $17,500 to $19,999 | 0 (0.0%) | 0 (0.0%) |
| $20,000 to $22,499 | 0 (0.0%) | 0 (0.0%) |
| $22,500 to $24,999 | 23 (7.7%) | 0 (0.0%) |
| $25,000 to $29,999 | 0 (0.0%) | 7 (4.6%) |
| $30,000 to $34,999 | 0 (0.0%) | 0 (0.0%) |
| $35,000 to $39,999 | 49 (16.5%) | 32 (20.9%) |
| $40,000 to $44,999 | 21 (7.1%) | 0 (0.0%) |
| $45,000 to $49,999 | 0 (0.0%) | 8 (5.2%) |
| $50,000 to $54,999 | 3 (1.0%) | 0 (0.0%) |
| $55,000 to $64,999 | 43 (14.5%) | 0 (0.0%) |
| $65,000 to $74,999 | 0 (0.0%) | 0 (0.0%) |
| $75,000 to $99,999 | 63 (21.2%) | 30 (19.6%) |
| $100,000+ | 16 (5.4%) | 52 (34.0%) |
| Total | 297 (100.0%) | 153 (100.0%) |
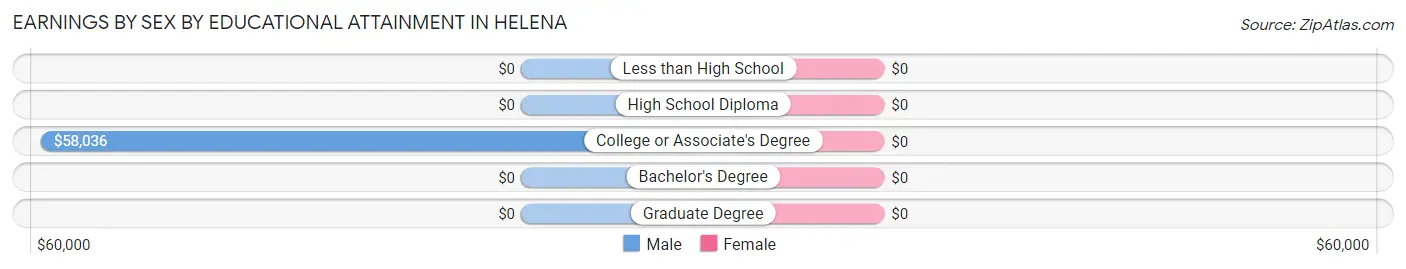
Earnings by Sex by Educational Attainment in Helena
| Educational Attainment | Male Income | Female Income |
| Less than High School | - | - |
| High School Diploma | - | - |
| College or Associate's Degree | $58,036 | $0 |
| Bachelor's Degree | - | - |
| Graduate Degree | - | - |
| Total | $39,872 | $0 |
Family Income in Helena
Family Income Brackets in Helena
According to the Helena family income data, there are 67 families falling into the $150,000 to $199,999 income range, which is the most common income bracket and makes up 22.6% of all families.
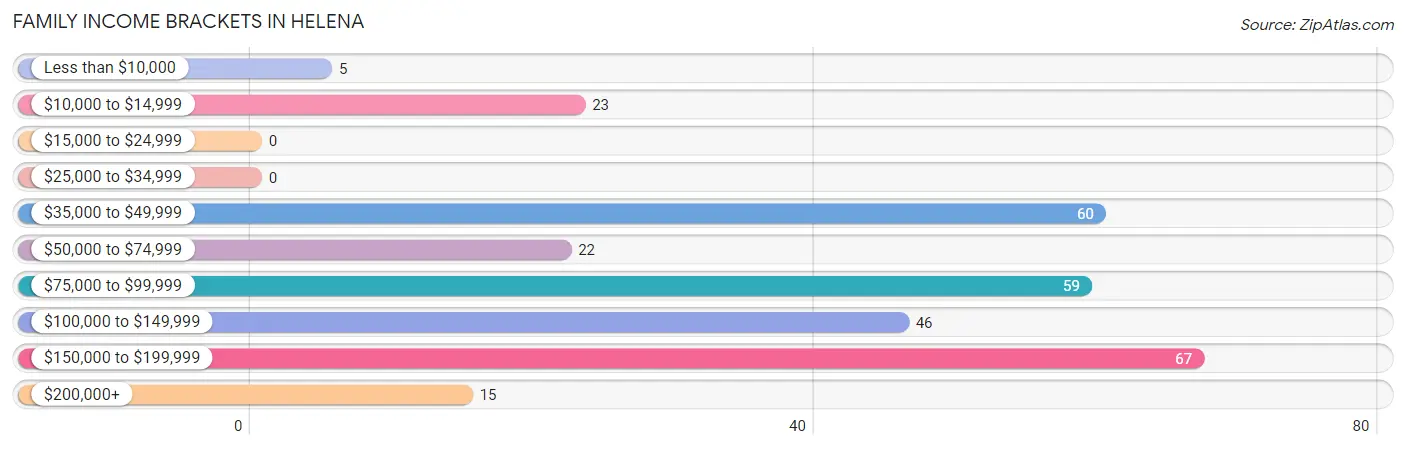
| Income Bracket | # Families | % Families |
| Less than $10,000 | 5 | 1.7% |
| $10,000 to $14,999 | 23 | 7.7% |
| $15,000 to $24,999 | 0 | 0.0% |
| $25,000 to $34,999 | 0 | 0.0% |
| $35,000 to $49,999 | 60 | 20.2% |
| $50,000 to $74,999 | 22 | 7.4% |
| $75,000 to $99,999 | 59 | 19.9% |
| $100,000 to $149,999 | 46 | 15.5% |
| $150,000 to $199,999 | 67 | 22.6% |
| $200,000+ | 15 | 5.1% |
Family Income by Famaliy Size in Helena
2-person families (267 | 89.9%) account for the highest median family income in Helena with $98,398 per family, while 2-person families (267 | 89.9%) have the highest median income of $49,199 per family member.
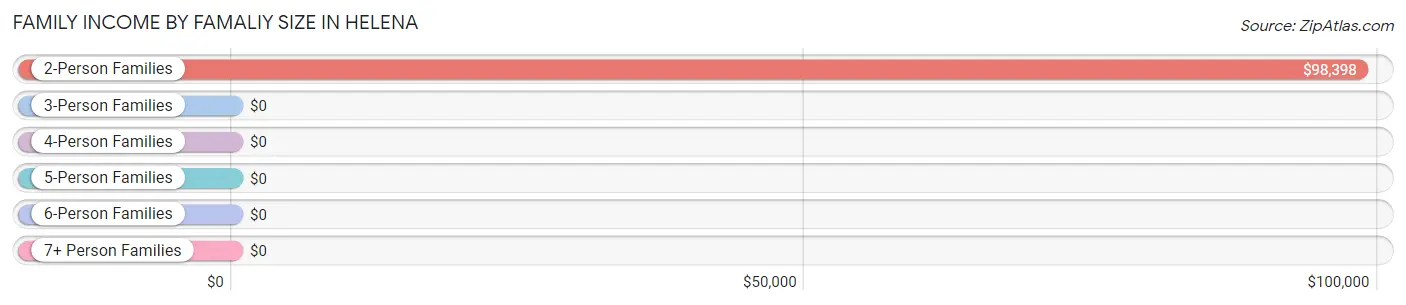
| Income Bracket | # Families | Median Income |
| 2-Person Families | 267 (89.9%) | $98,398 |
| 3-Person Families | 30 (10.1%) | $0 |
| 4-Person Families | 0 (0.0%) | $0 |
| 5-Person Families | 0 (0.0%) | $0 |
| 6-Person Families | 0 (0.0%) | $0 |
| 7+ Person Families | 0 (0.0%) | $0 |
| Total | 297 (100.0%) | $98,398 |
Family Income by Number of Earners in Helena
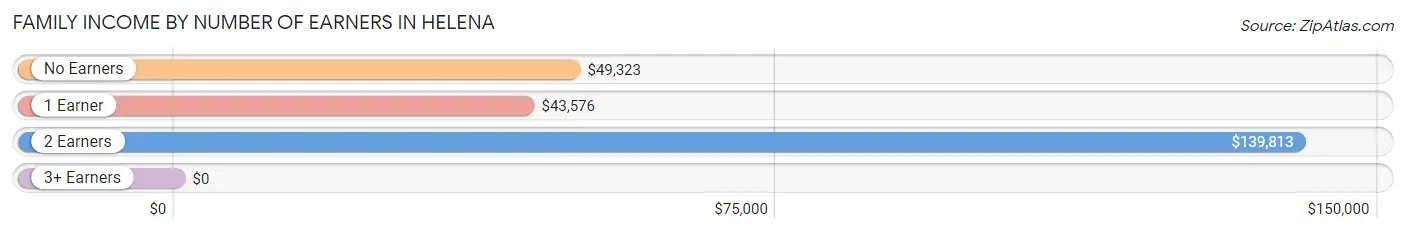
| Number of Earners | # Families | Median Income |
| No Earners | 81 (27.3%) | $49,323 |
| 1 Earner | 41 (13.8%) | $43,576 |
| 2 Earners | 167 (56.2%) | $139,813 |
| 3+ Earners | 8 (2.7%) | $0 |
| Total | 297 (100.0%) | $98,398 |
Household Income in Helena
Household Income Brackets in Helena
With 67 households falling in the category, the $150,000 to $199,999 income range is the most frequent in Helena, accounting for 22.3% of all households.
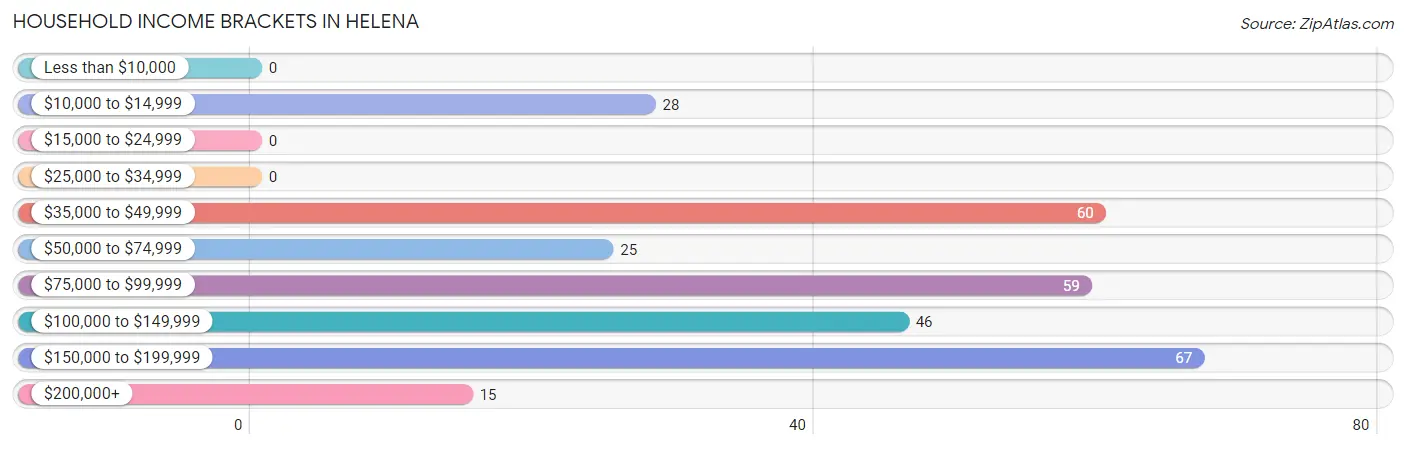
| Income Bracket | # Households | % Households |
| Less than $10,000 | 0 | 0.0% |
| $10,000 to $14,999 | 28 | 9.3% |
| $15,000 to $24,999 | 0 | 0.0% |
| $25,000 to $34,999 | 0 | 0.0% |
| $35,000 to $49,999 | 60 | 20.0% |
| $50,000 to $74,999 | 25 | 8.3% |
| $75,000 to $99,999 | 59 | 19.7% |
| $100,000 to $149,999 | 46 | 15.3% |
| $150,000 to $199,999 | 67 | 22.3% |
| $200,000+ | 15 | 5.0% |
Household Income by Householder Age in Helena
The median household income in Helena is $98,281, with the highest median household income of $157,583 found in the 45 to 64 years age bracket for the primary householder. A total of 163 households (54.3%) fall into this category. Meanwhile, the 15 to 24 years age bracket for the primary householder has the lowest median household income of $0, with 5 households (1.7%) in this group.
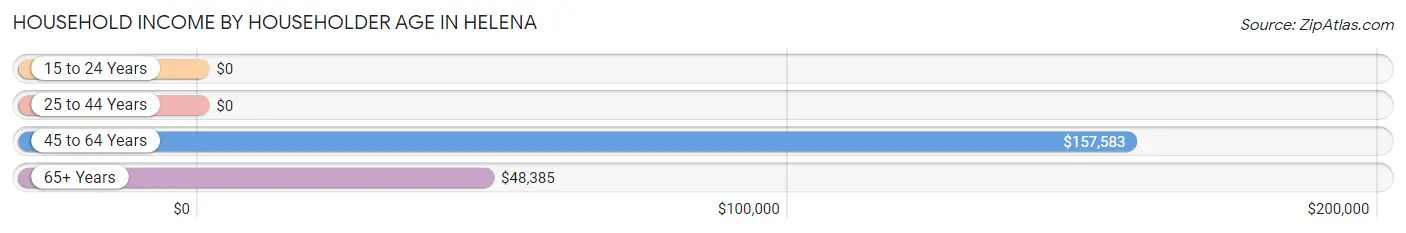
| Income Bracket | # Households | Median Income |
| 15 to 24 Years | 5 (1.7%) | $0 |
| 25 to 44 Years | 33 (11.0%) | $0 |
| 45 to 64 Years | 163 (54.3%) | $157,583 |
| 65+ Years | 99 (33.0%) | $48,385 |
| Total | 300 (100.0%) | $98,281 |
Poverty in Helena
Income Below Poverty by Sex and Age in Helena
With 8.6% poverty level for males and 10.0% for females among the residents of Helena, under 5 year old males and 18 to 24 year old females are the most vulnerable to poverty, with 6 males (46.2%) and 5 females (100.0%) in their respective age groups living below the poverty level.
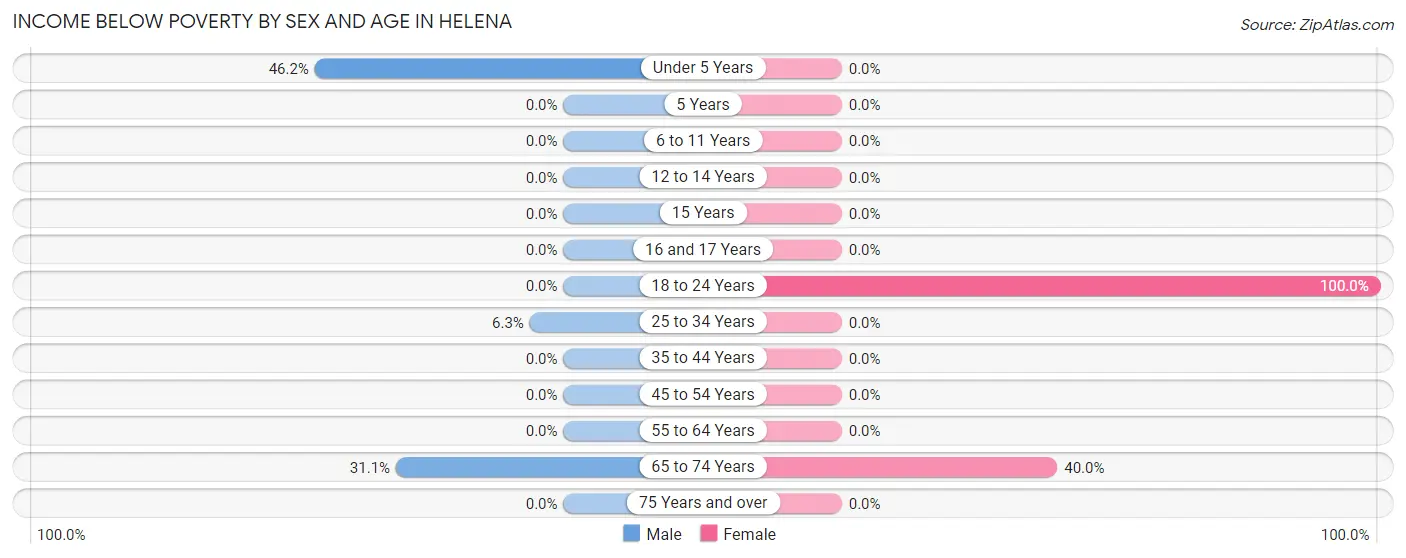
| Age Bracket | Male | Female |
| Under 5 Years | 6 (46.2%) | 0 (0.0%) |
| 5 Years | 0 (0.0%) | 0 (0.0%) |
| 6 to 11 Years | 0 (0.0%) | 0 (0.0%) |
| 12 to 14 Years | 0 (0.0%) | 0 (0.0%) |
| 15 Years | 0 (0.0%) | 0 (0.0%) |
| 16 and 17 Years | 0 (0.0%) | 0 (0.0%) |
| 18 to 24 Years | 0 (0.0%) | 5 (100.0%) |
| 25 to 34 Years | 5 (6.2%) | 0 (0.0%) |
| 35 to 44 Years | 0 (0.0%) | 0 (0.0%) |
| 45 to 54 Years | 0 (0.0%) | 0 (0.0%) |
| 55 to 64 Years | 0 (0.0%) | 0 (0.0%) |
| 65 to 74 Years | 23 (31.1%) | 24 (40.0%) |
| 75 Years and over | 0 (0.0%) | 0 (0.0%) |
| Total | 34 (8.6%) | 29 (10.0%) |
Income Above Poverty by Sex and Age in Helena
According to the poverty statistics in Helena, males aged 35 to 44 years and females aged 35 to 44 years are the age groups that are most secure financially, with 100.0% of males and 100.0% of females in these age groups living above the poverty line.
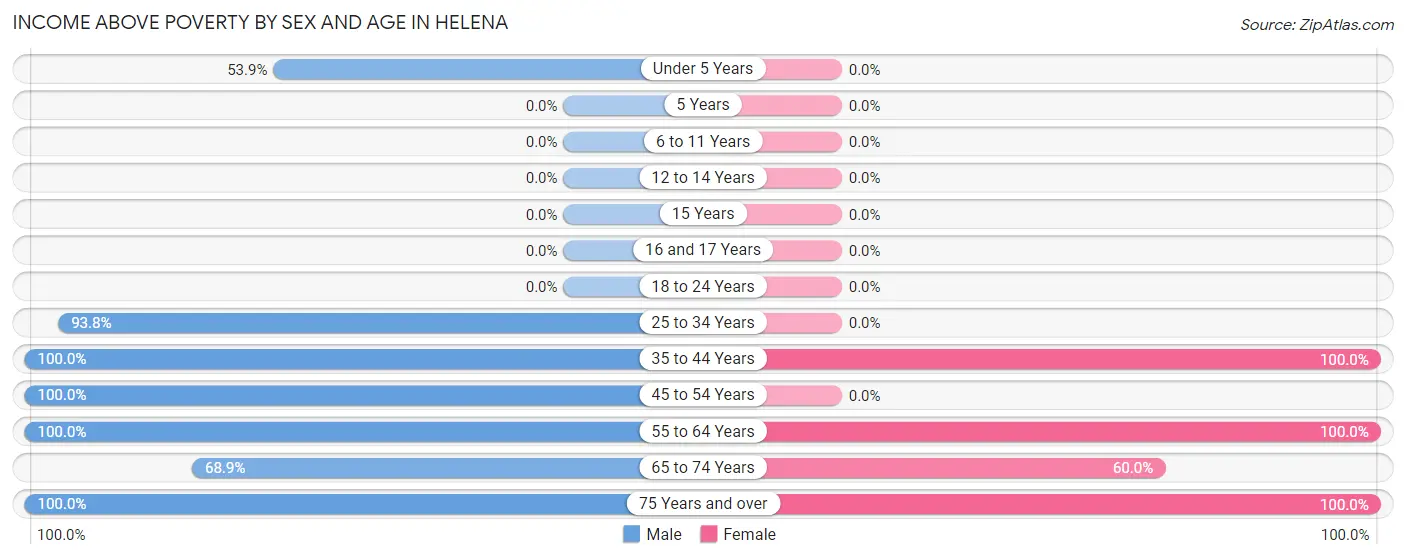
| Age Bracket | Male | Female |
| Under 5 Years | 7 (53.8%) | 0 (0.0%) |
| 5 Years | 0 (0.0%) | 0 (0.0%) |
| 6 to 11 Years | 0 (0.0%) | 0 (0.0%) |
| 12 to 14 Years | 0 (0.0%) | 0 (0.0%) |
| 15 Years | 0 (0.0%) | 0 (0.0%) |
| 16 and 17 Years | 0 (0.0%) | 0 (0.0%) |
| 18 to 24 Years | 0 (0.0%) | 0 (0.0%) |
| 25 to 34 Years | 75 (93.8%) | 0 (0.0%) |
| 35 to 44 Years | 16 (100.0%) | 7 (100.0%) |
| 45 to 54 Years | 3 (100.0%) | 0 (0.0%) |
| 55 to 64 Years | 191 (100.0%) | 167 (100.0%) |
| 65 to 74 Years | 51 (68.9%) | 36 (60.0%) |
| 75 Years and over | 18 (100.0%) | 51 (100.0%) |
| Total | 361 (91.4%) | 261 (90.0%) |
Income Below Poverty Among Married-Couple Families in Helena
The poverty statistics for married-couple families in Helena show that 8.4% or 23 of the total 274 families live below the poverty line. Families with no children have the highest poverty rate of 8.6%, comprising of 23 families. On the other hand, families with 1 or 2 children have the lowest poverty rate of 0.0%, which includes 0 families.
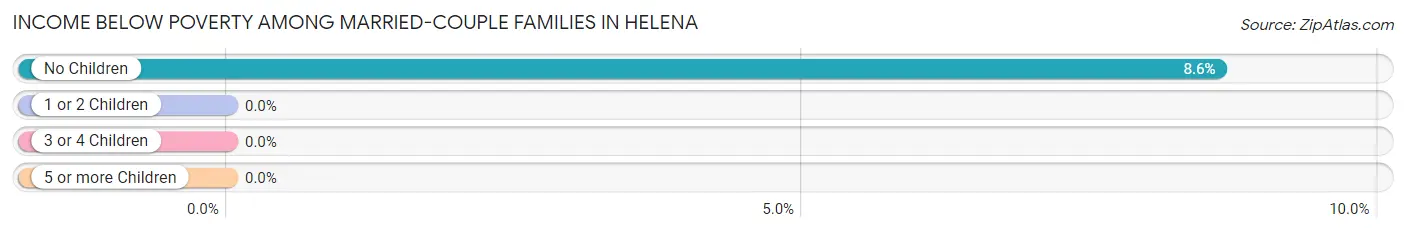
| Children | Above Poverty | Below Poverty |
| No Children | 244 (91.4%) | 23 (8.6%) |
| 1 or 2 Children | 7 (100.0%) | 0 (0.0%) |
| 3 or 4 Children | 0 (0.0%) | 0 (0.0%) |
| 5 or more Children | 0 (0.0%) | 0 (0.0%) |
| Total | 251 (91.6%) | 23 (8.4%) |
Income Below Poverty Among Single-Parent Households in Helena
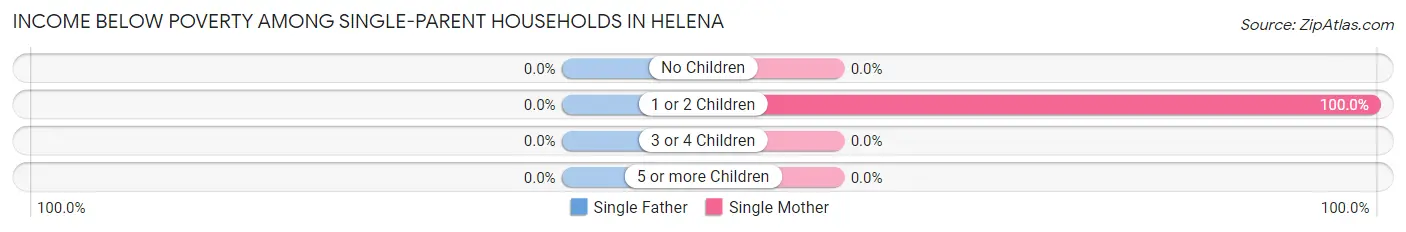
| Children | Single Father | Single Mother |
| No Children | 0 (0.0%) | 0 (0.0%) |
| 1 or 2 Children | 0 (0.0%) | 5 (100.0%) |
| 3 or 4 Children | 0 (0.0%) | 0 (0.0%) |
| 5 or more Children | 0 (0.0%) | 0 (0.0%) |
| Total | 0 (0.0%) | 5 (21.7%) |
Income Below Poverty Among Married-Couple vs Single-Parent Households in Helena
The poverty data for Helena shows that 23 of the married-couple family households (8.4%) and 5 of the single-parent households (21.7%) are living below the poverty level. Within the married-couple family households, those with no children have the highest poverty rate, with 23 households (8.6%) falling below the poverty line. Among the single-parent households, those with 1 or 2 children have the highest poverty rate, with 5 household (100.0%) living below poverty.
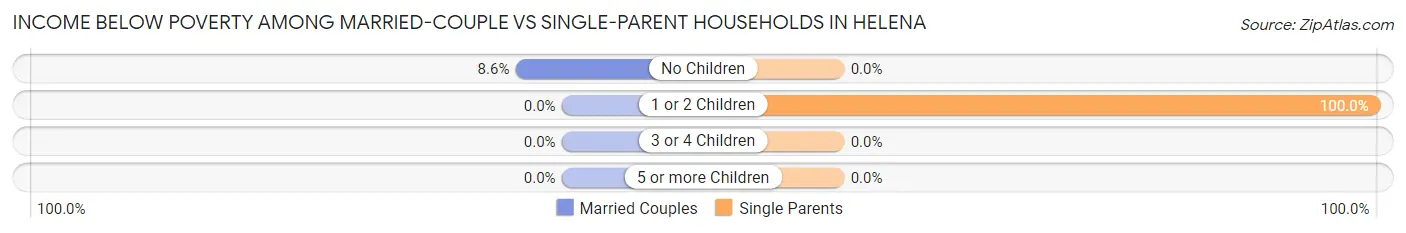
| Children | Married-Couple Families | Single-Parent Households |
| No Children | 23 (8.6%) | 0 (0.0%) |
| 1 or 2 Children | 0 (0.0%) | 5 (100.0%) |
| 3 or 4 Children | 0 (0.0%) | 0 (0.0%) |
| 5 or more Children | 0 (0.0%) | 0 (0.0%) |
| Total | 23 (8.4%) | 5 (21.7%) |
Race in Helena
The most populous races in Helena are White / Caucasian (681 | 98.4%), Asian (8 | 1.2%), and Two or more Races (3 | 0.4%).
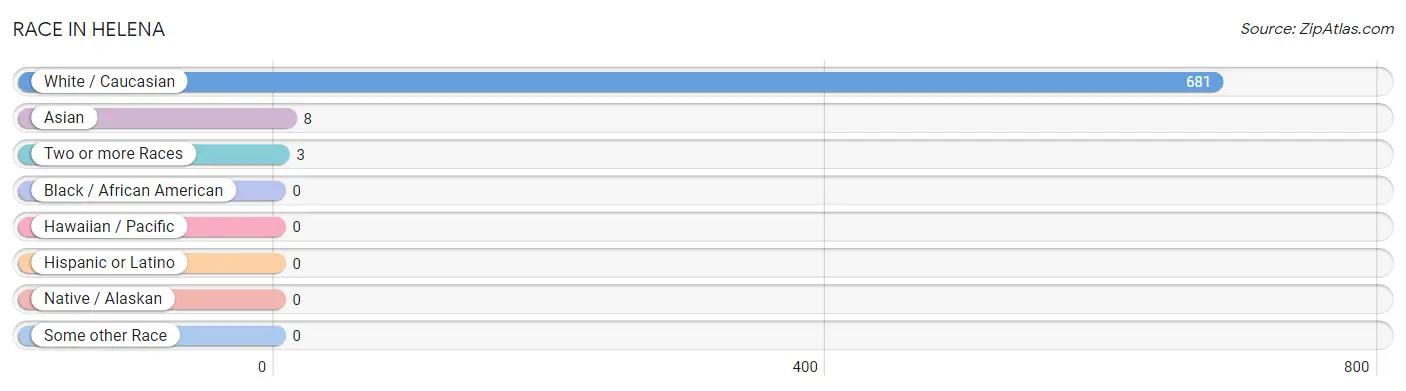
| Race | # Population | % Population |
| Asian | 8 | 1.2% |
| Black / African American | 0 | 0.0% |
| Hawaiian / Pacific | 0 | 0.0% |
| Hispanic or Latino | 0 | 0.0% |
| Native / Alaskan | 0 | 0.0% |
| White / Caucasian | 681 | 98.4% |
| Two or more Races | 3 | 0.4% |
| Some other Race | 0 | 0.0% |
| Total | 692 | 100.0% |
Ancestry in Helena
The most populous ancestries reported in Helena are English (88 | 12.7%), American (65 | 9.4%), Irish (33 | 4.8%), German (26 | 3.8%), and Scottish (14 | 2.0%), together accounting for 32.7% of all Helena residents.
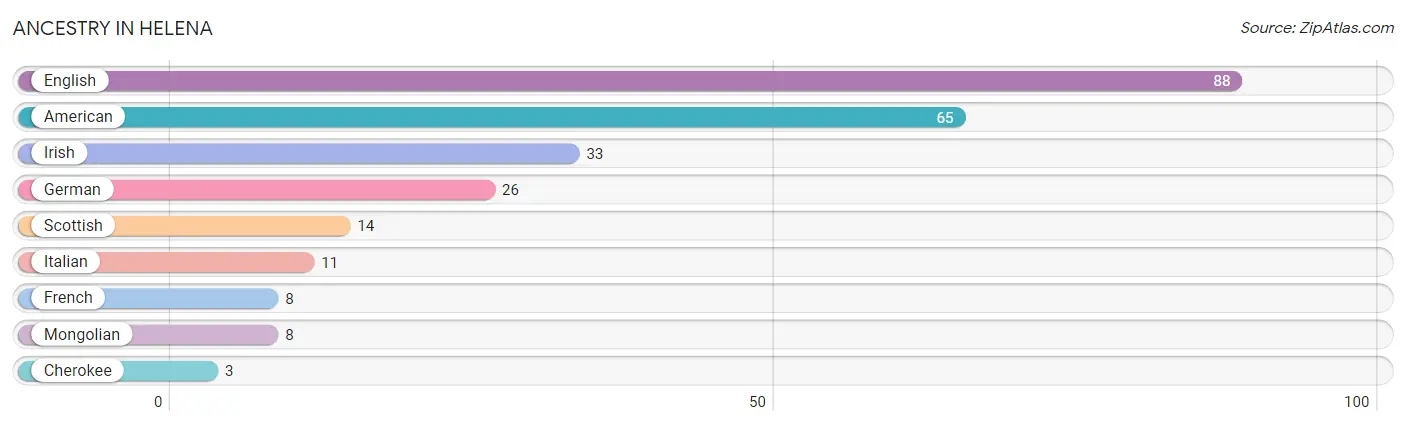
| Ancestry | # Population | % Population |
| American | 65 | 9.4% |
| Cherokee | 3 | 0.4% |
| English | 88 | 12.7% |
| French | 8 | 1.2% |
| German | 26 | 3.8% |
| Irish | 33 | 4.8% |
| Italian | 11 | 1.6% |
| Mongolian | 8 | 1.2% |
| Scottish | 14 | 2.0% | View All 9 Rows |
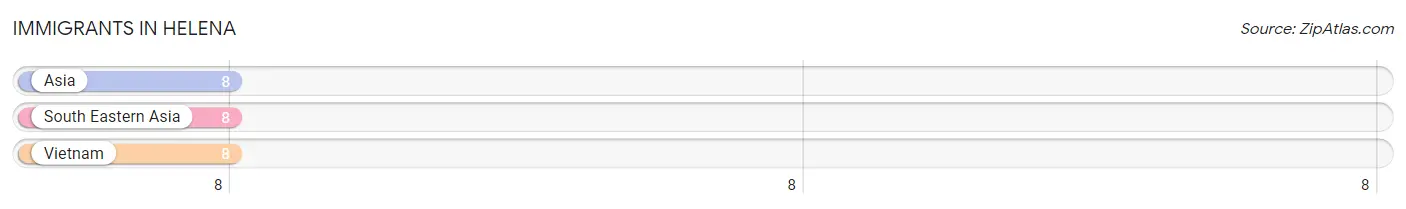
Immigrants in Helena
The most numerous immigrant groups reported in Helena came from Asia (8 | 1.2%), South Eastern Asia (8 | 1.2%), and Vietnam (8 | 1.2%), together accounting for 3.5% of all Helena residents.
| Immigration Origin | # Population | % Population |
| Asia | 8 | 1.2% |
| South Eastern Asia | 8 | 1.2% |
| Vietnam | 8 | 1.2% | View All 3 Rows |
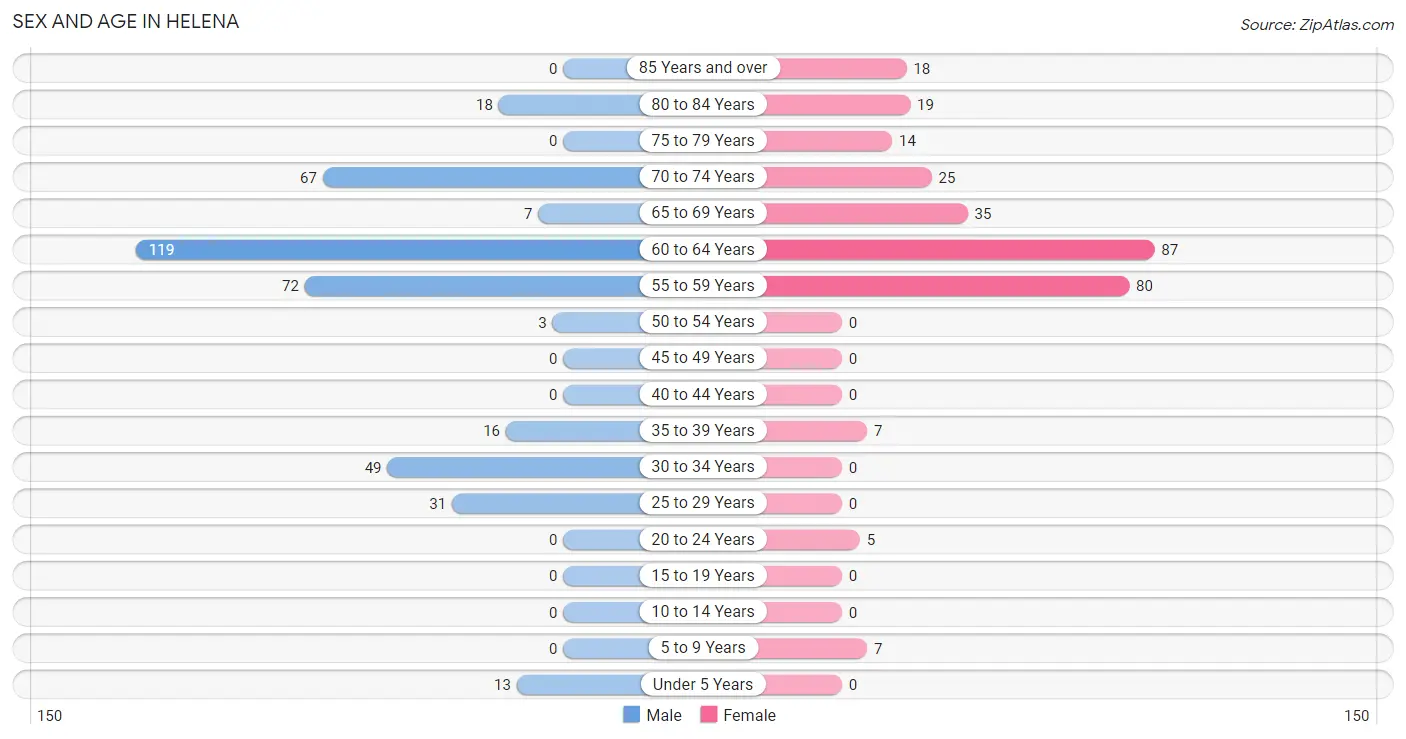
Sex and Age in Helena
Sex and Age in Helena
The most populous age groups in Helena are 60 to 64 Years (119 | 30.1%) for men and 60 to 64 Years (87 | 29.3%) for women.
| Age Bracket | Male | Female |
| Under 5 Years | 13 (3.3%) | 0 (0.0%) |
| 5 to 9 Years | 0 (0.0%) | 7 (2.4%) |
| 10 to 14 Years | 0 (0.0%) | 0 (0.0%) |
| 15 to 19 Years | 0 (0.0%) | 0 (0.0%) |
| 20 to 24 Years | 0 (0.0%) | 5 (1.7%) |
| 25 to 29 Years | 31 (7.9%) | 0 (0.0%) |
| 30 to 34 Years | 49 (12.4%) | 0 (0.0%) |
| 35 to 39 Years | 16 (4.1%) | 7 (2.4%) |
| 40 to 44 Years | 0 (0.0%) | 0 (0.0%) |
| 45 to 49 Years | 0 (0.0%) | 0 (0.0%) |
| 50 to 54 Years | 3 (0.8%) | 0 (0.0%) |
| 55 to 59 Years | 72 (18.2%) | 80 (26.9%) |
| 60 to 64 Years | 119 (30.1%) | 87 (29.3%) |
| 65 to 69 Years | 7 (1.8%) | 35 (11.8%) |
| 70 to 74 Years | 67 (17.0%) | 25 (8.4%) |
| 75 to 79 Years | 0 (0.0%) | 14 (4.7%) |
| 80 to 84 Years | 18 (4.6%) | 19 (6.4%) |
| 85 Years and over | 0 (0.0%) | 18 (6.1%) |
| Total | 395 (100.0%) | 297 (100.0%) |
Families and Households in Helena
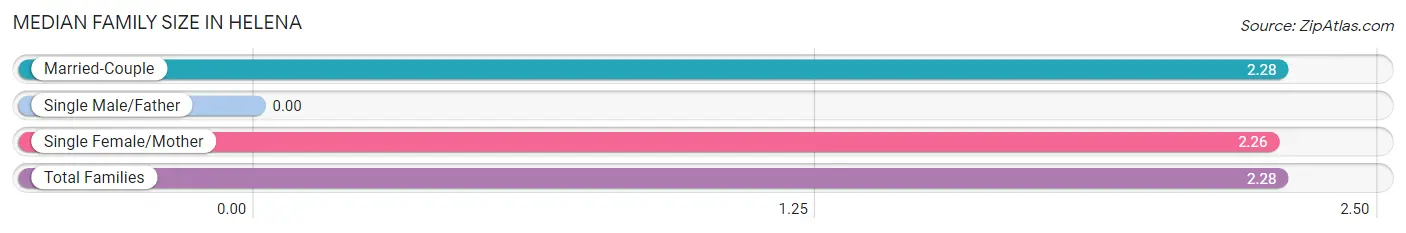
Median Family Size in Helena
| Family Type | # Families | Family Size |
| Married-Couple | 274 (92.3%) | 2.28 |
| Single Male/Father | 0 (0.0%) | - |
| Single Female/Mother | 23 (7.7%) | 2.26 |
| Total Families | 297 (100.0%) | 2.28 |
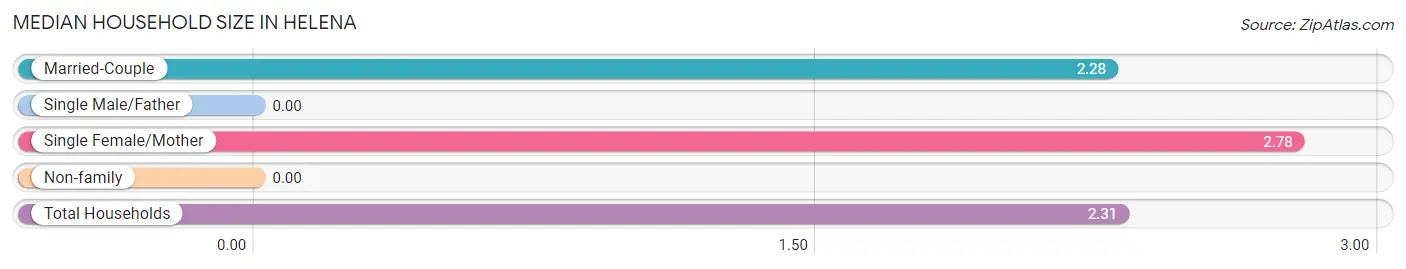
Median Household Size in Helena
| Household Type | # Households | Household Size |
| Married-Couple | 274 (91.3%) | 2.28 |
| Single Male/Father | 0 (0.0%) | - |
| Single Female/Mother | 23 (7.7%) | 2.78 |
| Non-family | 3 (1.0%) | - |
| Total Households | 300 (100.0%) | 2.31 |
Household Size by Marriage Status in Helena
Out of a total of 300 households in Helena, 297 (99.0%) are family households, while 3 (1.0%) are nonfamily households. The most numerous type of family households are 2-person households, comprising 262, and the most common type of nonfamily households are 1-person households, comprising 3.
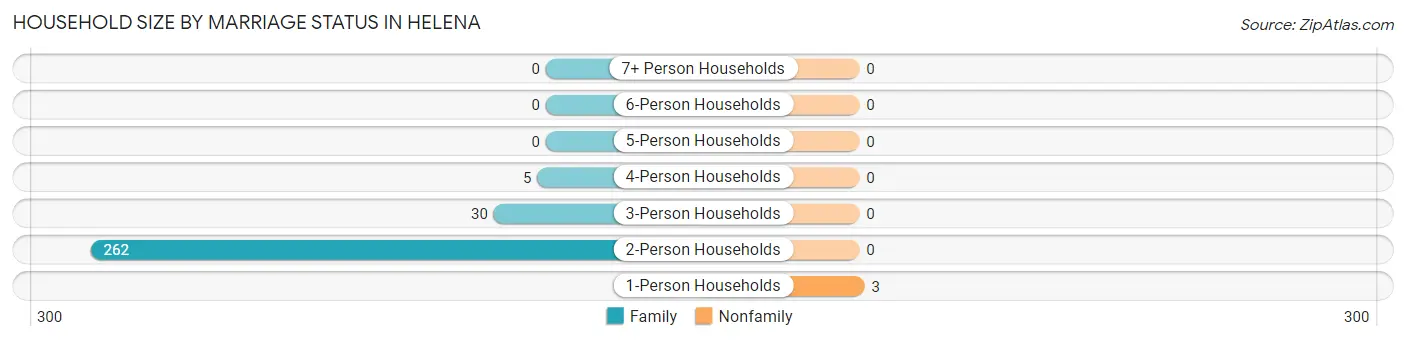
| Household Size | Family Households | Nonfamily Households |
| 1-Person Households | - | 3 (1.0%) |
| 2-Person Households | 262 (87.3%) | 0 (0.0%) |
| 3-Person Households | 30 (10.0%) | 0 (0.0%) |
| 4-Person Households | 5 (1.7%) | 0 (0.0%) |
| 5-Person Households | 0 (0.0%) | 0 (0.0%) |
| 6-Person Households | 0 (0.0%) | 0 (0.0%) |
| 7+ Person Households | 0 (0.0%) | 0 (0.0%) |
| Total | 297 (99.0%) | 3 (1.0%) |
Female Fertility in Helena
Fertility by Age in Helena
Average fertility rate in Helena is 417.0 births per 1,000 women. Women in the age bracket of 20 to 34 years have the highest fertility rate with 1,000.0 births per 1,000 women. Women in the age bracket of 20 to 34 years acount for 100.0% of all women with births.
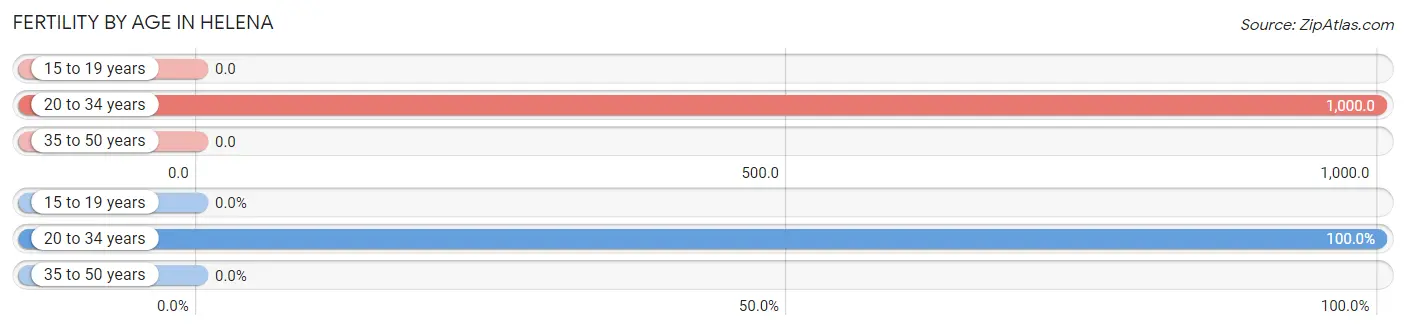
| Age Bracket | Women with Births | Births / 1,000 Women |
| 15 to 19 years | 0 (0.0%) | 0.0 |
| 20 to 34 years | 5 (100.0%) | 1,000.0 |
| 35 to 50 years | 0 (0.0%) | 0.0 |
| Total | 5 (100.0%) | 417.0 |
Fertility by Age by Marriage Status in Helena
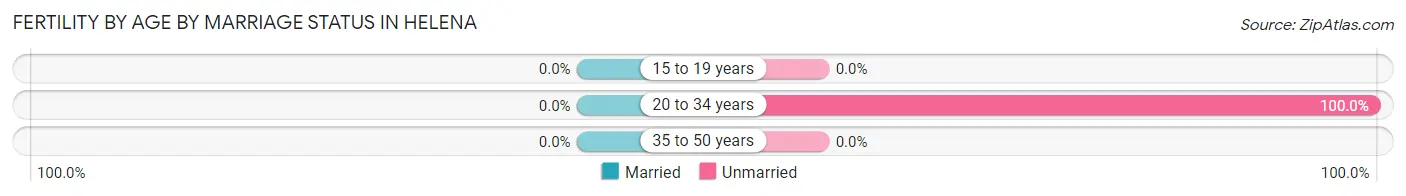
| Age Bracket | Married | Unmarried |
| 15 to 19 years | 0 (0.0%) | 0 (0.0%) |
| 20 to 34 years | 0 (0.0%) | 5 (100.0%) |
| 35 to 50 years | 0 (0.0%) | 0 (0.0%) |
| Total | 0 (0.0%) | 5 (100.0%) |
Fertility by Education in Helena
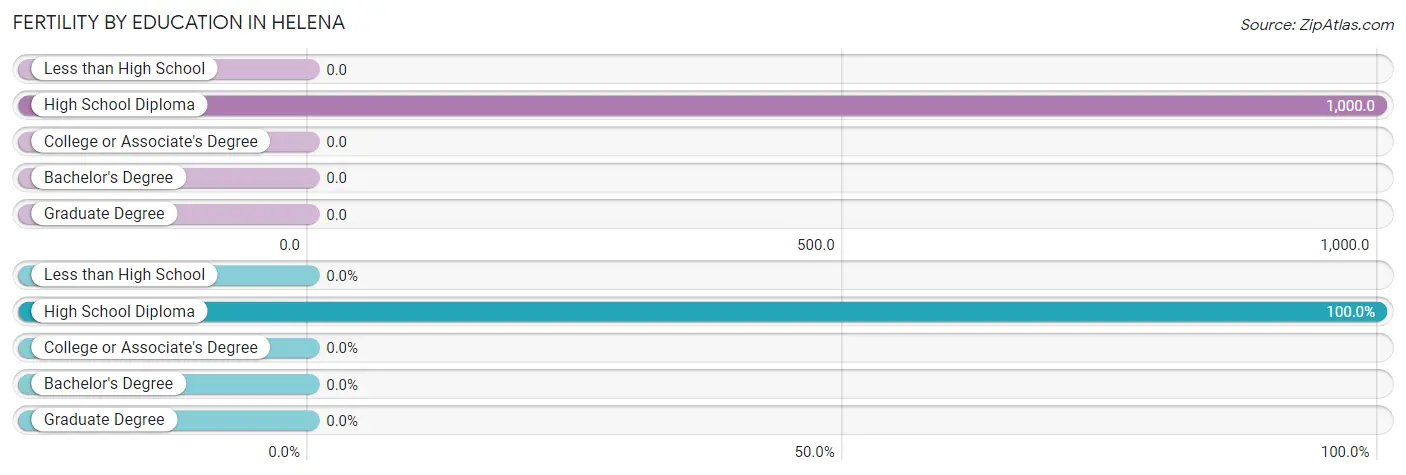
| Educational Attainment | Women with Births | Births / 1,000 Women |
| Less than High School | 0 (0.0%) | 0.0 |
| High School Diploma | 5 (100.0%) | 1,000.0 |
| College or Associate's Degree | 0 (0.0%) | 0.0 |
| Bachelor's Degree | 0 (0.0%) | 0.0 |
| Graduate Degree | 0 (0.0%) | 0.0 |
| Total | 5 (100.0%) | 417.0 |
Fertility by Education by Marriage Status in Helena
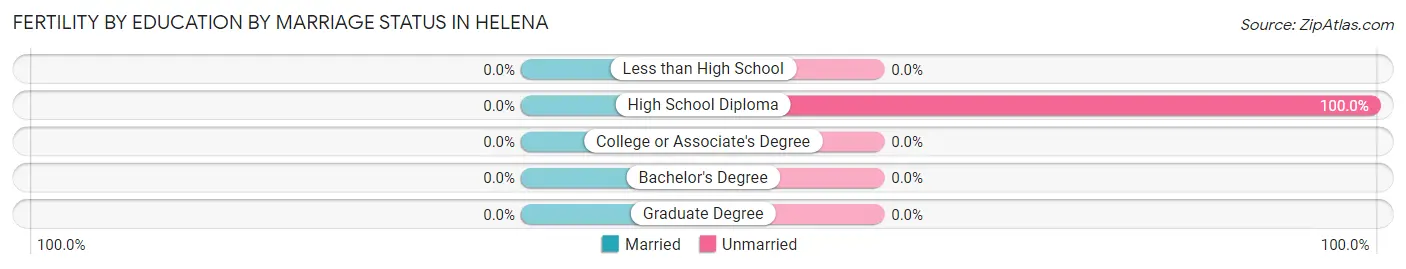
| Educational Attainment | Married | Unmarried |
| Less than High School | 0 (0.0%) | 0 (0.0%) |
| High School Diploma | 0 (0.0%) | 5 (100.0%) |
| College or Associate's Degree | 0 (0.0%) | 0 (0.0%) |
| Bachelor's Degree | 0 (0.0%) | 0 (0.0%) |
| Graduate Degree | 0 (0.0%) | 0 (0.0%) |
| Total | 0 (0.0%) | 5 (100.0%) |
Employment Characteristics in Helena
Employment by Class of Employer in Helena
Among the 380 employed individuals in Helena, private company employees (227 | 59.7%), state government employees (56 | 14.7%), and federal government employees (40 | 10.5%) make up the most common classes of employment.
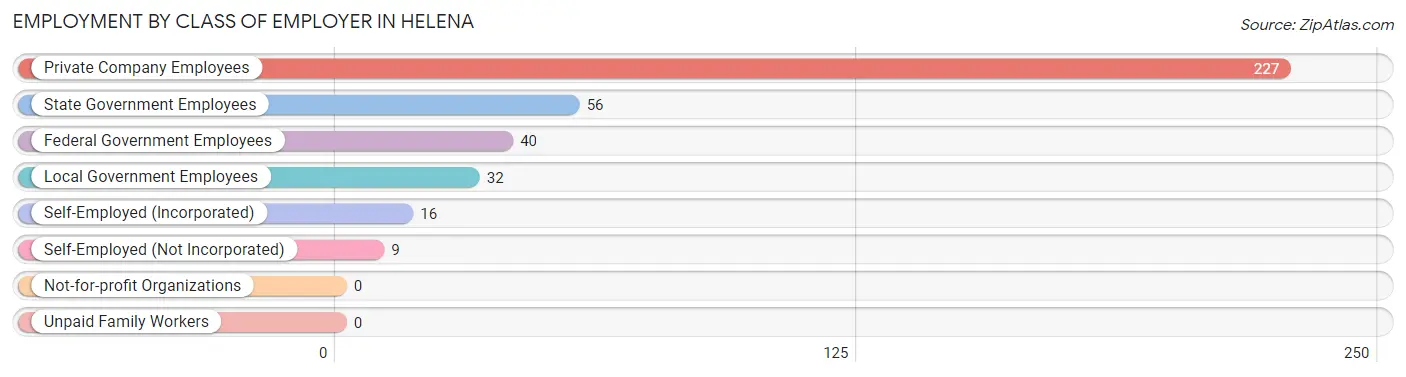
| Employer Class | # Employees | % Employees |
| Private Company Employees | 227 | 59.7% |
| Self-Employed (Incorporated) | 16 | 4.2% |
| Self-Employed (Not Incorporated) | 9 | 2.4% |
| Not-for-profit Organizations | 0 | 0.0% |
| Local Government Employees | 32 | 8.4% |
| State Government Employees | 56 | 14.7% |
| Federal Government Employees | 40 | 10.5% |
| Unpaid Family Workers | 0 | 0.0% |
| Total | 380 | 100.0% |
Employment Status by Age in Helena
According to the labor force statistics for Helena, out of the total population over 16 years of age (672), 57.3% or 385 individuals are in the labor force, with 1.3% or 5 of them unemployed. The age group with the highest labor force participation rate is 20 to 24 years, with 100.0% or 5 individuals in the labor force. Within the labor force, the 20 to 24 years age range has the highest percentage of unemployed individuals, with 100.0% or 5 of them being unemployed.
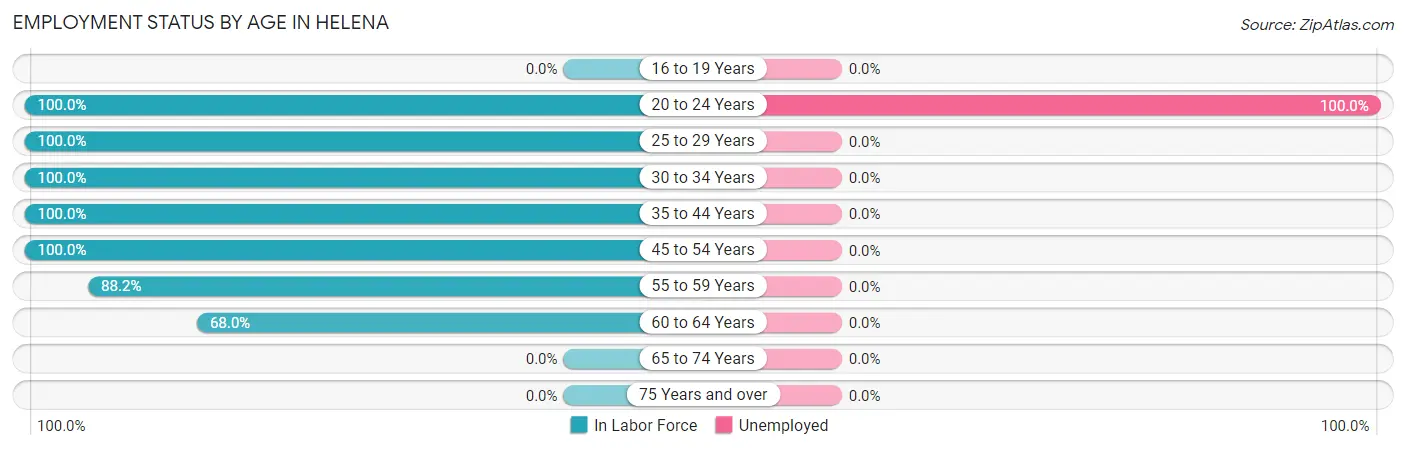
| Age Bracket | In Labor Force | Unemployed |
| 16 to 19 Years | 0 (0.0%) | 0 (0.0%) |
| 20 to 24 Years | 5 (100.0%) | 5 (100.0%) |
| 25 to 29 Years | 31 (100.0%) | 0 (0.0%) |
| 30 to 34 Years | 49 (100.0%) | 0 (0.0%) |
| 35 to 44 Years | 23 (100.0%) | 0 (0.0%) |
| 45 to 54 Years | 3 (100.0%) | 0 (0.0%) |
| 55 to 59 Years | 134 (88.2%) | 0 (0.0%) |
| 60 to 64 Years | 140 (68.0%) | 0 (0.0%) |
| 65 to 74 Years | 0 (0.0%) | 0 (0.0%) |
| 75 Years and over | 0 (0.0%) | 0 (0.0%) |
| Total | 385 (57.3%) | 5 (1.3%) |
Employment Status by Educational Attainment in Helena
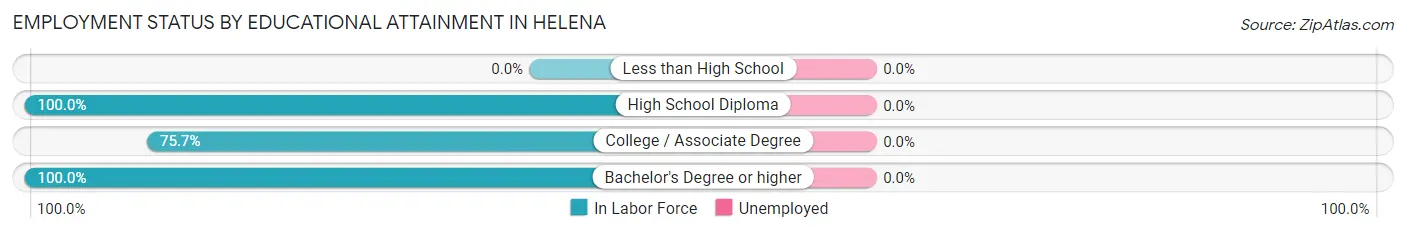
| Educational Attainment | In Labor Force | Unemployed |
| Less than High School | 0 (0.0%) | 0 (0.0%) |
| High School Diploma | 89 (100.0%) | 0 (0.0%) |
| College / Associate Degree | 261 (75.7%) | 0 (0.0%) |
| Bachelor's Degree or higher | 30 (100.0%) | 0 (0.0%) |
| Total | 380 (81.9%) | 0 (0.0%) |
Employment Occupations by Sex in Helena
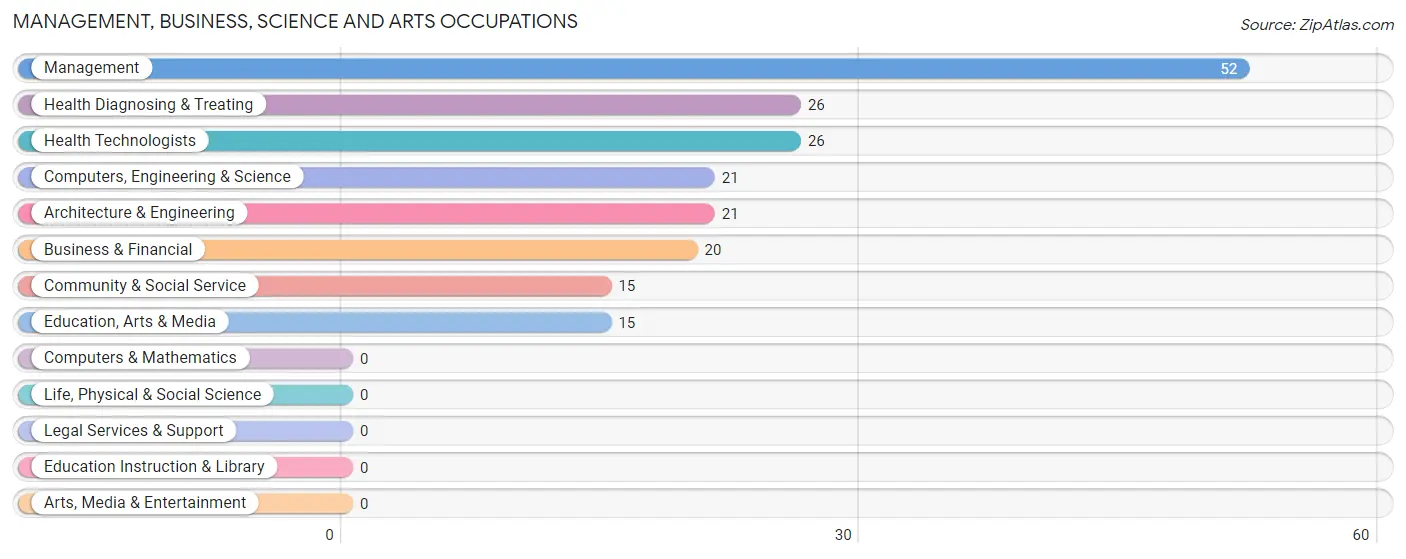
Management, Business, Science and Arts Occupations
The most common Management, Business, Science and Arts occupations in Helena are Management (52 | 13.7%), Health Diagnosing & Treating (26 | 6.8%), Health Technologists (26 | 6.8%), Computers, Engineering & Science (21 | 5.5%), and Architecture & Engineering (21 | 5.5%).
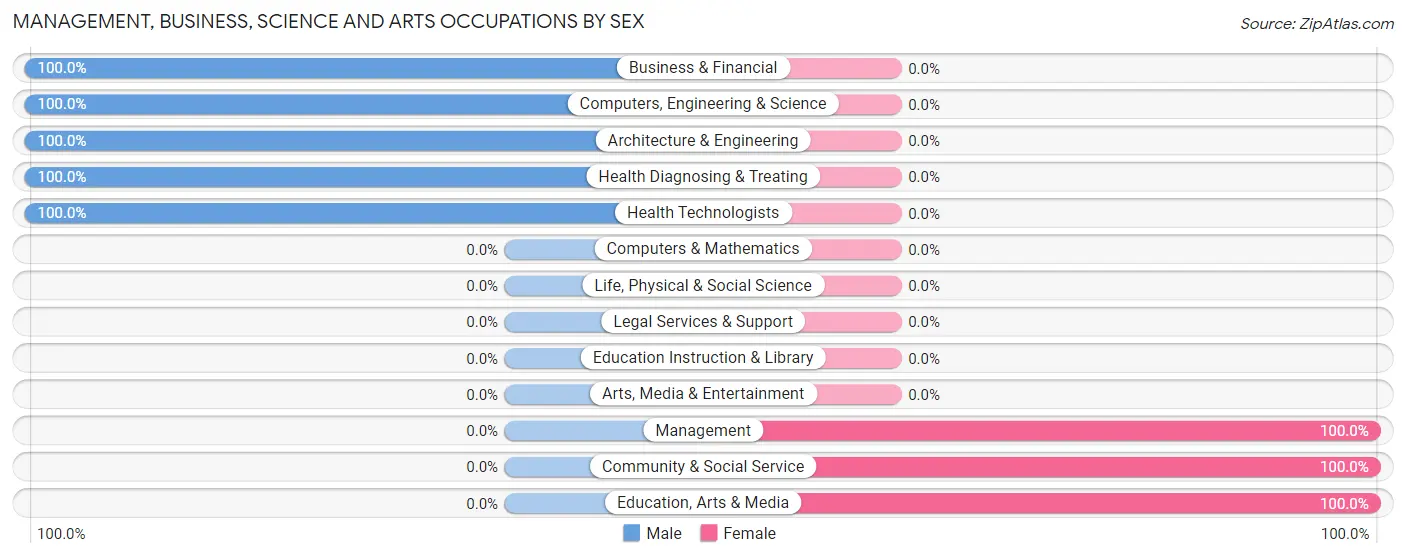
Management, Business, Science and Arts Occupations by Sex
Within the Management, Business, Science and Arts occupations in Helena, the most male-oriented occupations are Business & Financial (100.0%), Computers, Engineering & Science (100.0%), and Architecture & Engineering (100.0%), while the most female-oriented occupations are Management (100.0%), Community & Social Service (100.0%), and Education, Arts & Media (100.0%).
| Occupation | Male | Female |
| Management | 0 (0.0%) | 52 (100.0%) |
| Business & Financial | 20 (100.0%) | 0 (0.0%) |
| Computers, Engineering & Science | 21 (100.0%) | 0 (0.0%) |
| Computers & Mathematics | 0 (0.0%) | 0 (0.0%) |
| Architecture & Engineering | 21 (100.0%) | 0 (0.0%) |
| Life, Physical & Social Science | 0 (0.0%) | 0 (0.0%) |
| Community & Social Service | 0 (0.0%) | 15 (100.0%) |
| Education, Arts & Media | 0 (0.0%) | 15 (100.0%) |
| Legal Services & Support | 0 (0.0%) | 0 (0.0%) |
| Education Instruction & Library | 0 (0.0%) | 0 (0.0%) |
| Arts, Media & Entertainment | 0 (0.0%) | 0 (0.0%) |
| Health Diagnosing & Treating | 26 (100.0%) | 0 (0.0%) |
| Health Technologists | 26 (100.0%) | 0 (0.0%) |
| Total (Category) | 67 (50.0%) | 67 (50.0%) |
| Total (Overall) | 232 (61.1%) | 148 (39.0%) |
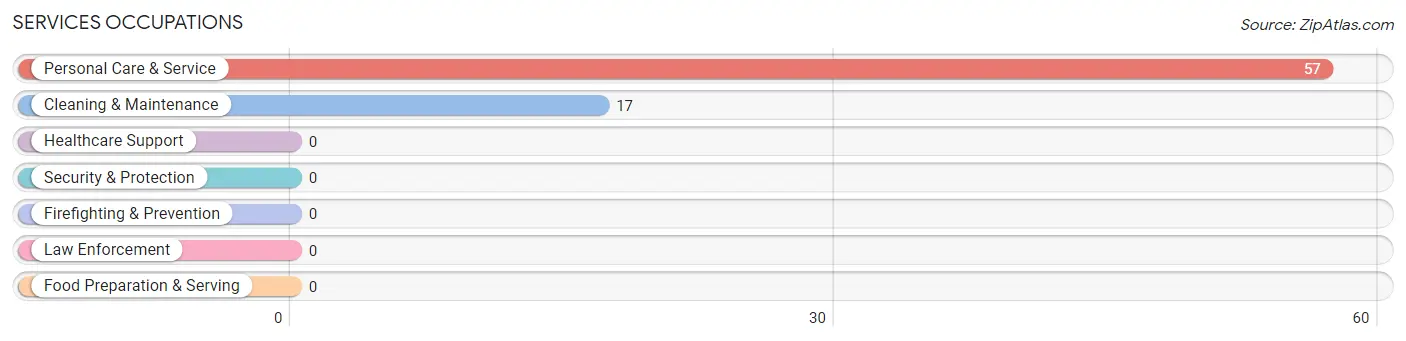
Services Occupations
The most common Services occupations in Helena are Personal Care & Service (57 | 15.0%), and Cleaning & Maintenance (17 | 4.5%).
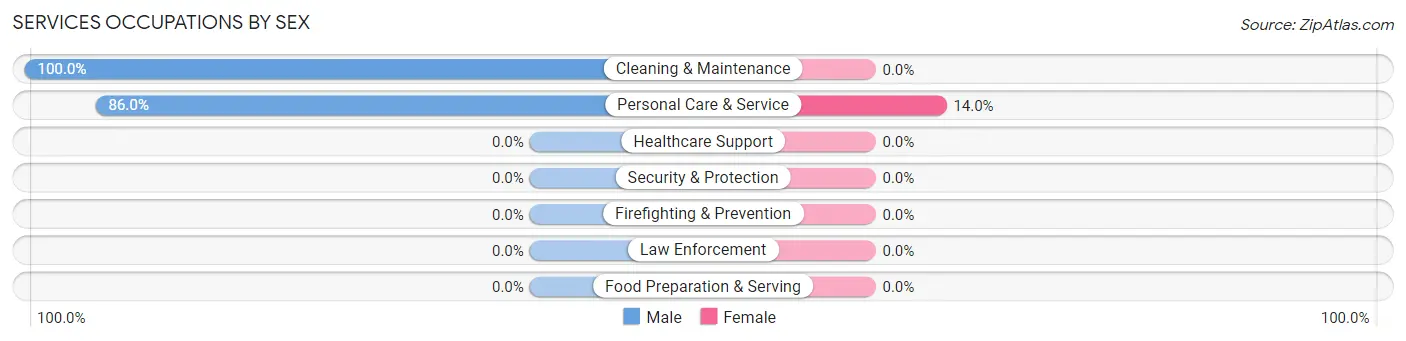
Services Occupations by Sex
| Occupation | Male | Female |
| Healthcare Support | 0 (0.0%) | 0 (0.0%) |
| Security & Protection | 0 (0.0%) | 0 (0.0%) |
| Firefighting & Prevention | 0 (0.0%) | 0 (0.0%) |
| Law Enforcement | 0 (0.0%) | 0 (0.0%) |
| Food Preparation & Serving | 0 (0.0%) | 0 (0.0%) |
| Cleaning & Maintenance | 17 (100.0%) | 0 (0.0%) |
| Personal Care & Service | 49 (86.0%) | 8 (14.0%) |
| Total (Category) | 66 (89.2%) | 8 (10.8%) |
| Total (Overall) | 232 (61.1%) | 148 (39.0%) |
Sales and Office Occupations
The most common Sales and Office occupations in Helena are Office & Administration (54 | 14.2%), and Sales & Related (16 | 4.2%).
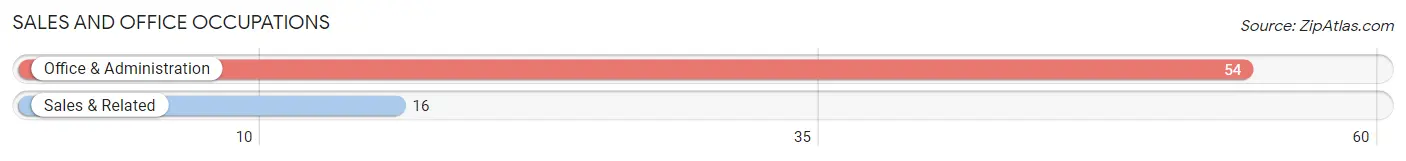
Sales and Office Occupations by Sex

| Occupation | Male | Female |
| Sales & Related | 16 (100.0%) | 0 (0.0%) |
| Office & Administration | 0 (0.0%) | 54 (100.0%) |
| Total (Category) | 16 (22.9%) | 54 (77.1%) |
| Total (Overall) | 232 (61.1%) | 148 (39.0%) |
Natural Resources, Construction and Maintenance Occupations
The most common Natural Resources, Construction and Maintenance occupations in Helena are Construction & Extraction (52 | 13.7%), and Installation, Maintenance & Repair (31 | 8.2%).
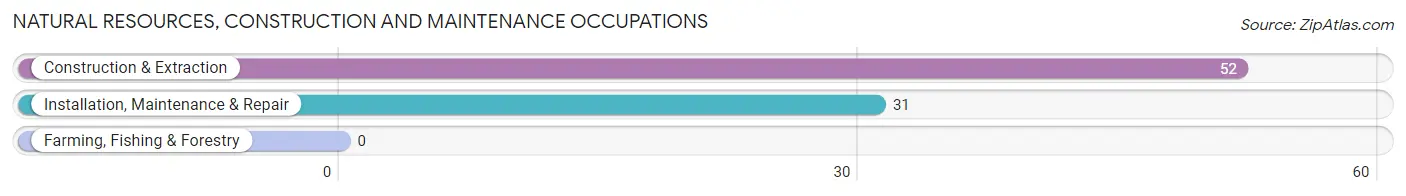
Natural Resources, Construction and Maintenance Occupations by Sex
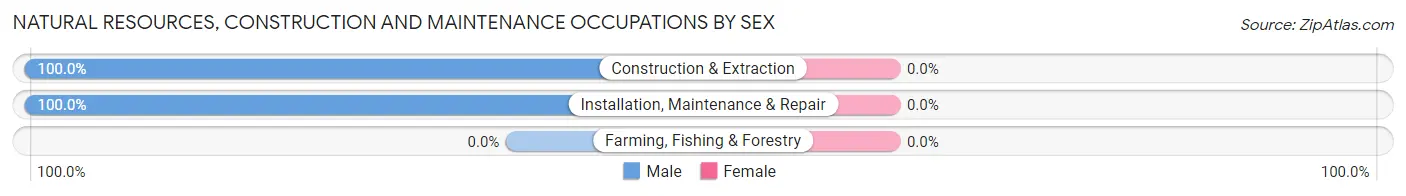
| Occupation | Male | Female |
| Farming, Fishing & Forestry | 0 (0.0%) | 0 (0.0%) |
| Construction & Extraction | 52 (100.0%) | 0 (0.0%) |
| Installation, Maintenance & Repair | 31 (100.0%) | 0 (0.0%) |
| Total (Category) | 83 (100.0%) | 0 (0.0%) |
| Total (Overall) | 232 (61.1%) | 148 (39.0%) |
Production, Transportation and Moving Occupations
The most common Production, Transportation and Moving occupations in Helena are , and Production (19 | 5.0%).
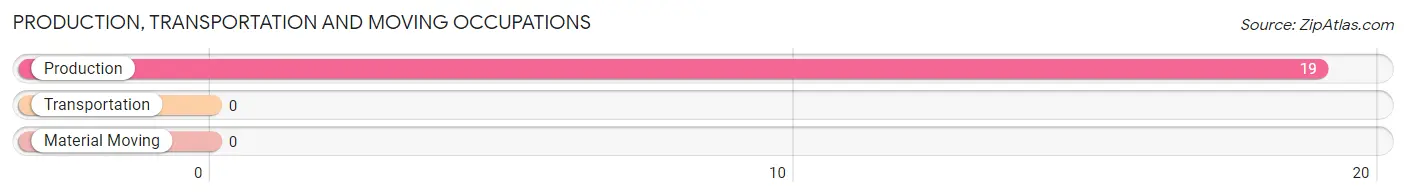
Production, Transportation and Moving Occupations by Sex
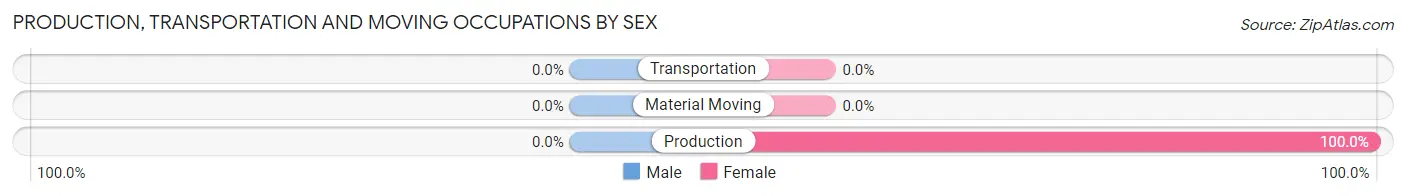
| Occupation | Male | Female |
| Production | 0 (0.0%) | 19 (100.0%) |
| Transportation | 0 (0.0%) | 0 (0.0%) |
| Material Moving | 0 (0.0%) | 0 (0.0%) |
| Total (Category) | 0 (0.0%) | 19 (100.0%) |
| Total (Overall) | 232 (61.1%) | 148 (39.0%) |
Employment Industries by Sex in Helena
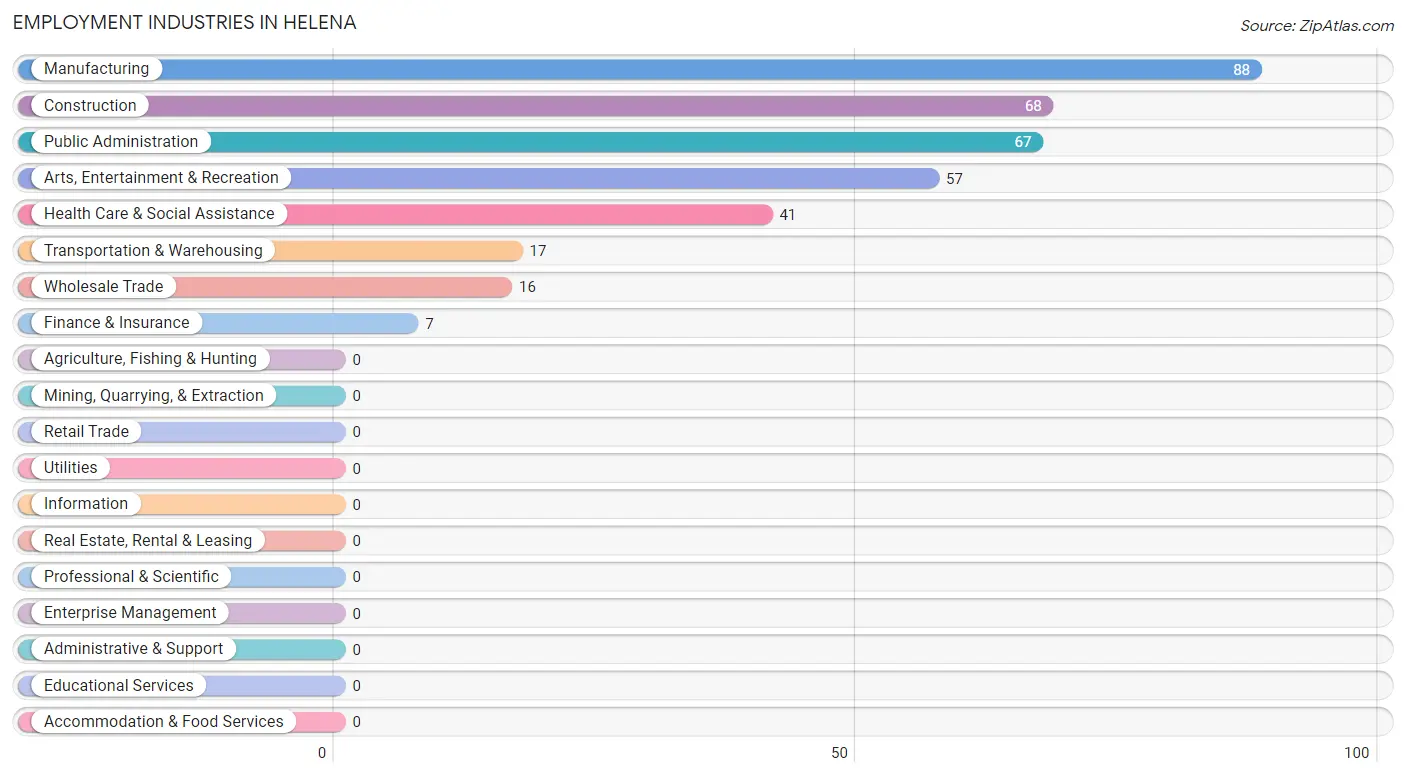
Employment Industries in Helena
The major employment industries in Helena include Manufacturing (88 | 23.2%), Construction (68 | 17.9%), Public Administration (67 | 17.6%), Arts, Entertainment & Recreation (57 | 15.0%), and Health Care & Social Assistance (41 | 10.8%).
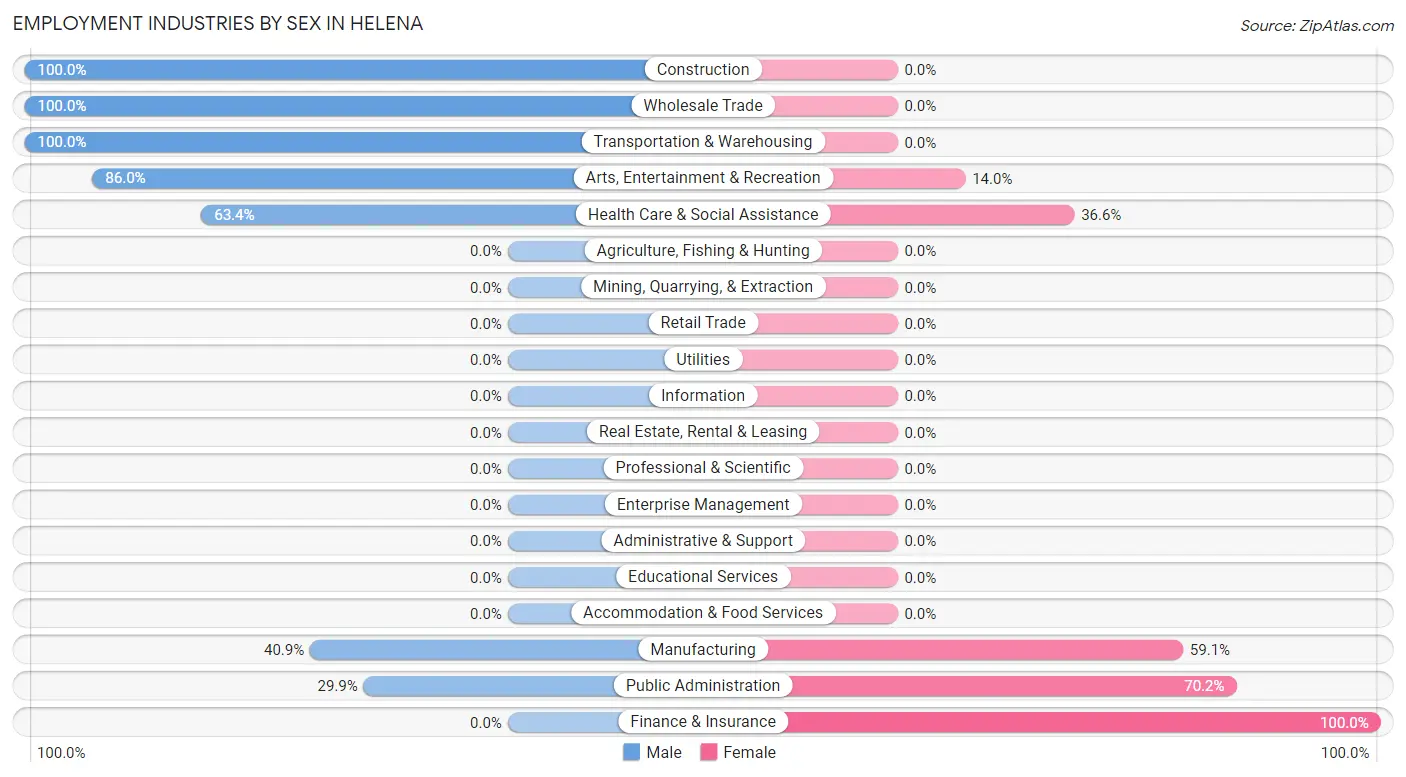
Employment Industries by Sex in Helena
The Helena industries that see more men than women are Construction (100.0%), Wholesale Trade (100.0%), and Transportation & Warehousing (100.0%), whereas the industries that tend to have a higher number of women are Finance & Insurance (100.0%), Public Administration (70.2%), and Manufacturing (59.1%).
| Industry | Male | Female |
| Agriculture, Fishing & Hunting | 0 (0.0%) | 0 (0.0%) |
| Mining, Quarrying, & Extraction | 0 (0.0%) | 0 (0.0%) |
| Construction | 68 (100.0%) | 0 (0.0%) |
| Manufacturing | 36 (40.9%) | 52 (59.1%) |
| Wholesale Trade | 16 (100.0%) | 0 (0.0%) |
| Retail Trade | 0 (0.0%) | 0 (0.0%) |
| Transportation & Warehousing | 17 (100.0%) | 0 (0.0%) |
| Utilities | 0 (0.0%) | 0 (0.0%) |
| Information | 0 (0.0%) | 0 (0.0%) |
| Finance & Insurance | 0 (0.0%) | 7 (100.0%) |
| Real Estate, Rental & Leasing | 0 (0.0%) | 0 (0.0%) |
| Professional & Scientific | 0 (0.0%) | 0 (0.0%) |
| Enterprise Management | 0 (0.0%) | 0 (0.0%) |
| Administrative & Support | 0 (0.0%) | 0 (0.0%) |
| Educational Services | 0 (0.0%) | 0 (0.0%) |
| Health Care & Social Assistance | 26 (63.4%) | 15 (36.6%) |
| Arts, Entertainment & Recreation | 49 (86.0%) | 8 (14.0%) |
| Accommodation & Food Services | 0 (0.0%) | 0 (0.0%) |
| Public Administration | 20 (29.8%) | 47 (70.2%) |
| Total | 232 (61.1%) | 148 (39.0%) |
Education in Helena
School Enrollment in Helena
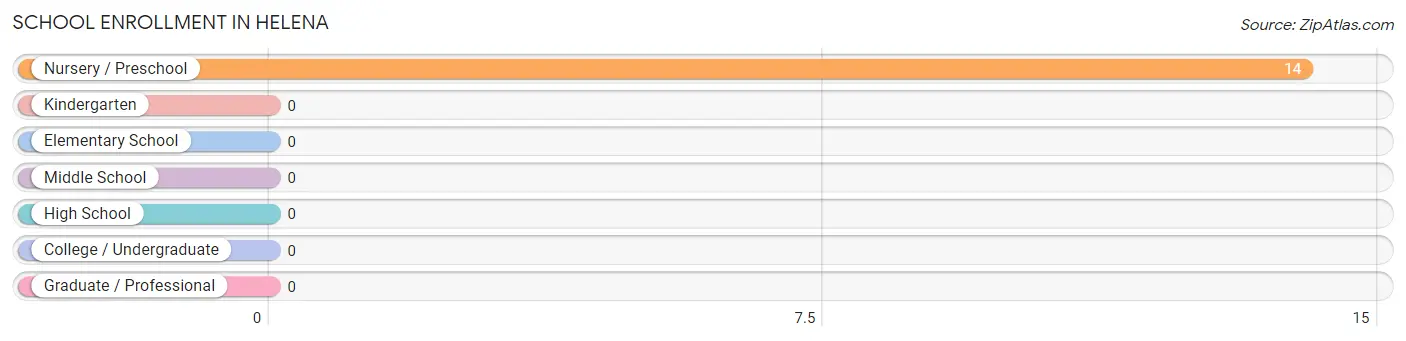
| School Level | # Students | % Students |
| Nursery / Preschool | 14 | 100.0% |
| Kindergarten | 0 | 0.0% |
| Elementary School | 0 | 0.0% |
| Middle School | 0 | 0.0% |
| High School | 0 | 0.0% |
| College / Undergraduate | 0 | 0.0% |
| Graduate / Professional | 0 | 0.0% |
| Total | 14 | 100.0% |
School Enrollment by Age by Funding Source in Helena
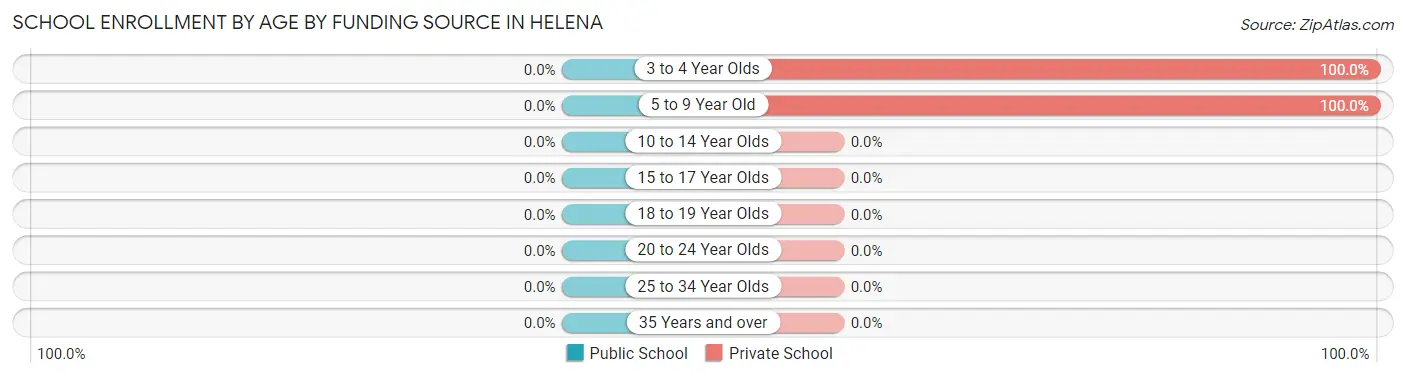
| Age Bracket | Public School | Private School |
| 3 to 4 Year Olds | 0 (0.0%) | 7 (100.0%) |
| 5 to 9 Year Old | 0 (0.0%) | 7 (100.0%) |
| 10 to 14 Year Olds | 0 (0.0%) | 0 (0.0%) |
| 15 to 17 Year Olds | 0 (0.0%) | 0 (0.0%) |
| 18 to 19 Year Olds | 0 (0.0%) | 0 (0.0%) |
| 20 to 24 Year Olds | 0 (0.0%) | 0 (0.0%) |
| 25 to 34 Year Olds | 0 (0.0%) | 0 (0.0%) |
| 35 Years and over | 0 (0.0%) | 0 (0.0%) |
| Total | 0 (0.0%) | 14 (100.0%) |
Educational Attainment by Field of Study in Helena
Business (15 | 50.0%), and arts & humanities (15 | 50.0%) are the most common fields of study among 30 individuals in Helena who have obtained a bachelor's degree or higher.
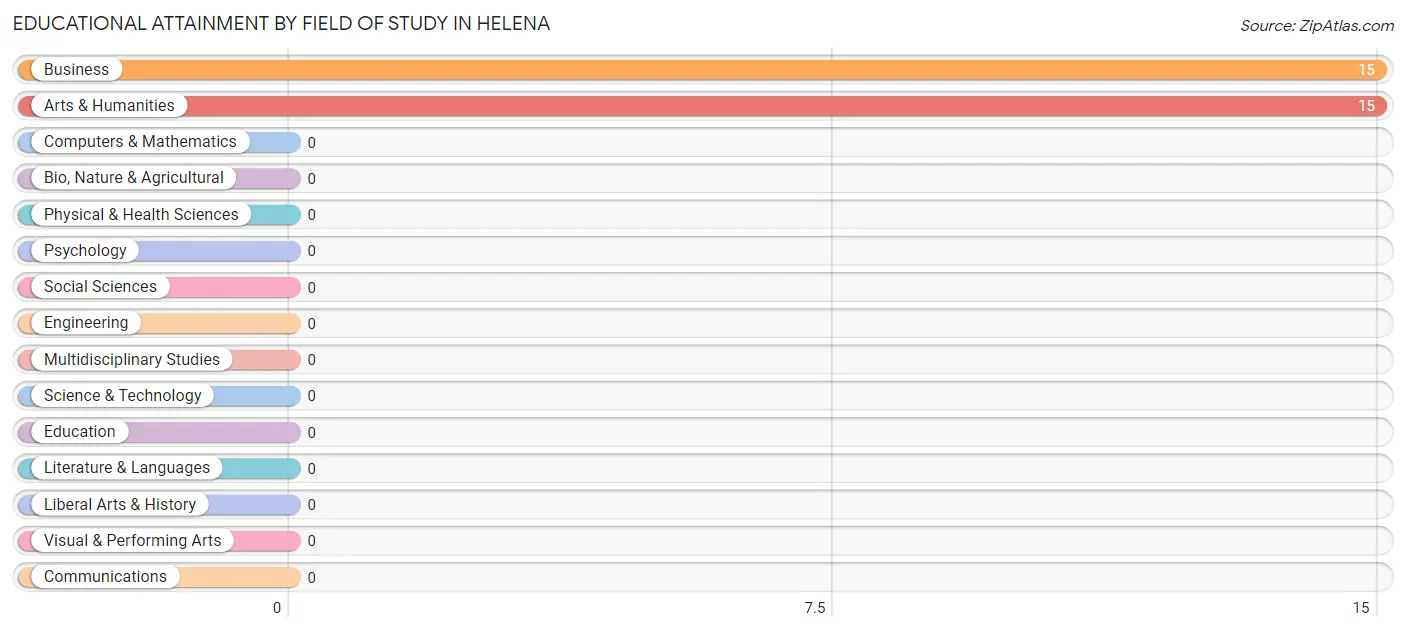
| Field of Study | # Graduates | % Graduates |
| Computers & Mathematics | 0 | 0.0% |
| Bio, Nature & Agricultural | 0 | 0.0% |
| Physical & Health Sciences | 0 | 0.0% |
| Psychology | 0 | 0.0% |
| Social Sciences | 0 | 0.0% |
| Engineering | 0 | 0.0% |
| Multidisciplinary Studies | 0 | 0.0% |
| Science & Technology | 0 | 0.0% |
| Business | 15 | 50.0% |
| Education | 0 | 0.0% |
| Literature & Languages | 0 | 0.0% |
| Liberal Arts & History | 0 | 0.0% |
| Visual & Performing Arts | 0 | 0.0% |
| Communications | 0 | 0.0% |
| Arts & Humanities | 15 | 50.0% |
| Total | 30 | 100.0% |
Transportation & Commute in Helena
Vehicle Availability by Sex in Helena
The most prevalent vehicle ownership categories in Helena are males with 2 vehicles (124, accounting for 53.4%) and females with 2 vehicles (0, making up 83.8%).
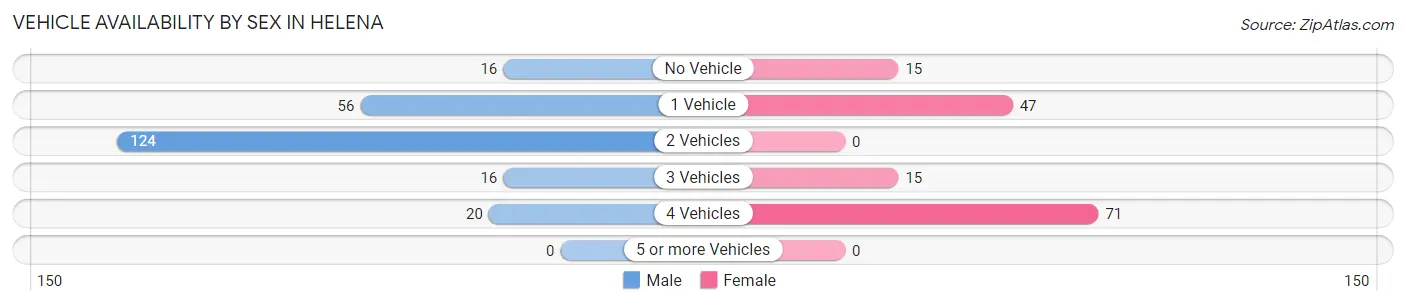
| Vehicles Available | Male | Female |
| No Vehicle | 16 (6.9%) | 15 (10.1%) |
| 1 Vehicle | 56 (24.1%) | 47 (31.8%) |
| 2 Vehicles | 124 (53.4%) | 0 (0.0%) |
| 3 Vehicles | 16 (6.9%) | 15 (10.1%) |
| 4 Vehicles | 20 (8.6%) | 71 (48.0%) |
| 5 or more Vehicles | 0 (0.0%) | 0 (0.0%) |
| Total | 232 (100.0%) | 148 (100.0%) |
Commute Time in Helena
The most frequently occuring commute durations in Helena are 15 to 19 minutes (119 commuters, 33.6%), 45 to 59 minutes (52 commuters, 14.7%), and less than 5 minutes (45 commuters, 12.7%).
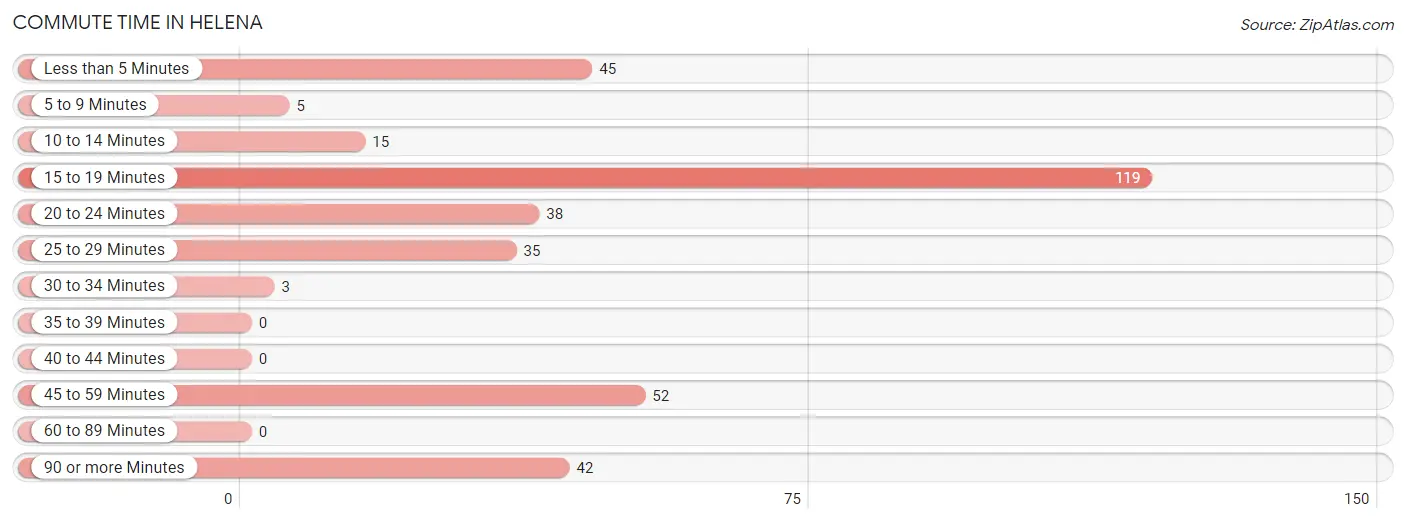
| Commute Time | # Commuters | % Commuters |
| Less than 5 Minutes | 45 | 12.7% |
| 5 to 9 Minutes | 5 | 1.4% |
| 10 to 14 Minutes | 15 | 4.2% |
| 15 to 19 Minutes | 119 | 33.6% |
| 20 to 24 Minutes | 38 | 10.7% |
| 25 to 29 Minutes | 35 | 9.9% |
| 30 to 34 Minutes | 3 | 0.9% |
| 35 to 39 Minutes | 0 | 0.0% |
| 40 to 44 Minutes | 0 | 0.0% |
| 45 to 59 Minutes | 52 | 14.7% |
| 60 to 89 Minutes | 0 | 0.0% |
| 90 or more Minutes | 42 | 11.9% |
Commute Time by Sex in Helena
The most common commute times in Helena are 15 to 19 minutes (87 commuters, 42.2%) for males and 45 to 59 minutes (52 commuters, 35.1%) for females.
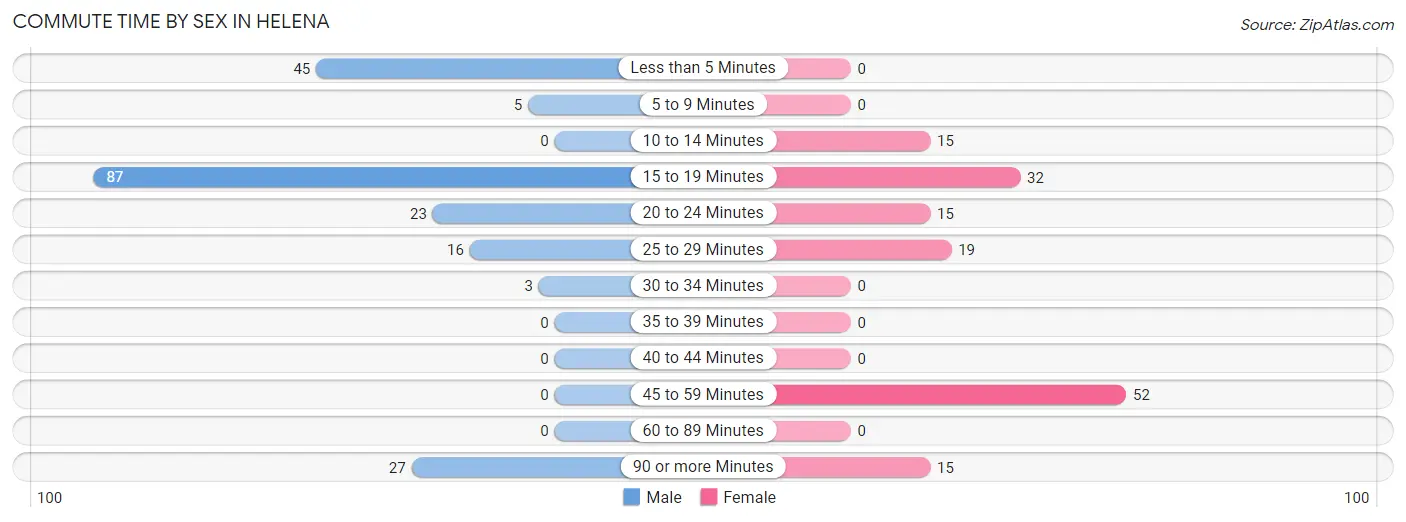
| Commute Time | Male | Female |
| Less than 5 Minutes | 45 (21.8%) | 0 (0.0%) |
| 5 to 9 Minutes | 5 (2.4%) | 0 (0.0%) |
| 10 to 14 Minutes | 0 (0.0%) | 15 (10.1%) |
| 15 to 19 Minutes | 87 (42.2%) | 32 (21.6%) |
| 20 to 24 Minutes | 23 (11.2%) | 15 (10.1%) |
| 25 to 29 Minutes | 16 (7.8%) | 19 (12.8%) |
| 30 to 34 Minutes | 3 (1.5%) | 0 (0.0%) |
| 35 to 39 Minutes | 0 (0.0%) | 0 (0.0%) |
| 40 to 44 Minutes | 0 (0.0%) | 0 (0.0%) |
| 45 to 59 Minutes | 0 (0.0%) | 52 (35.1%) |
| 60 to 89 Minutes | 0 (0.0%) | 0 (0.0%) |
| 90 or more Minutes | 27 (13.1%) | 15 (10.1%) |
Time of Departure to Work by Sex in Helena
The most frequent times of departure to work in Helena are 6:30 AM to 6:59 AM (72, 34.9%) for males and 7:30 AM to 7:59 AM (92, 62.2%) for females.
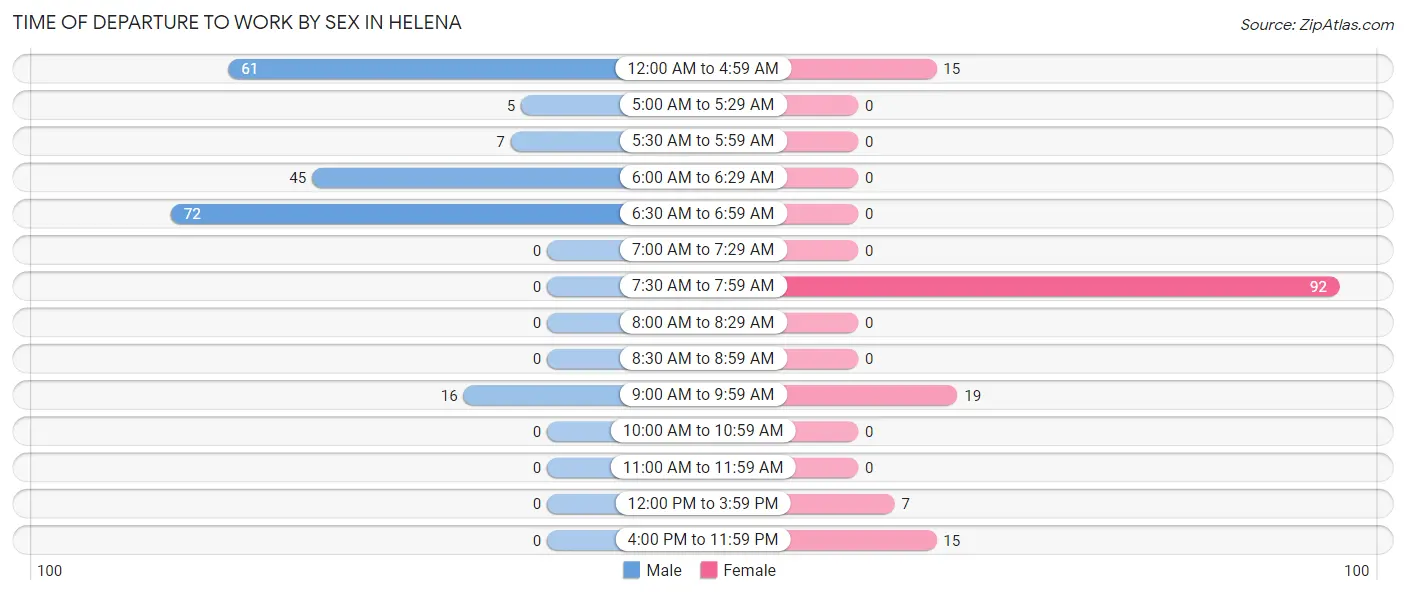
| Time of Departure | Male | Female |
| 12:00 AM to 4:59 AM | 61 (29.6%) | 15 (10.1%) |
| 5:00 AM to 5:29 AM | 5 (2.4%) | 0 (0.0%) |
| 5:30 AM to 5:59 AM | 7 (3.4%) | 0 (0.0%) |
| 6:00 AM to 6:29 AM | 45 (21.8%) | 0 (0.0%) |
| 6:30 AM to 6:59 AM | 72 (34.9%) | 0 (0.0%) |
| 7:00 AM to 7:29 AM | 0 (0.0%) | 0 (0.0%) |
| 7:30 AM to 7:59 AM | 0 (0.0%) | 92 (62.2%) |
| 8:00 AM to 8:29 AM | 0 (0.0%) | 0 (0.0%) |
| 8:30 AM to 8:59 AM | 0 (0.0%) | 0 (0.0%) |
| 9:00 AM to 9:59 AM | 16 (7.8%) | 19 (12.8%) |
| 10:00 AM to 10:59 AM | 0 (0.0%) | 0 (0.0%) |
| 11:00 AM to 11:59 AM | 0 (0.0%) | 0 (0.0%) |
| 12:00 PM to 3:59 PM | 0 (0.0%) | 7 (4.7%) |
| 4:00 PM to 11:59 PM | 0 (0.0%) | 15 (10.1%) |
| Total | 206 (100.0%) | 148 (100.0%) |
Housing Occupancy in Helena
Occupancy by Ownership in Helena
Of the total 300 dwellings in Helena, owner-occupied units account for 295 (98.3%), while renter-occupied units make up 5 (1.7%).
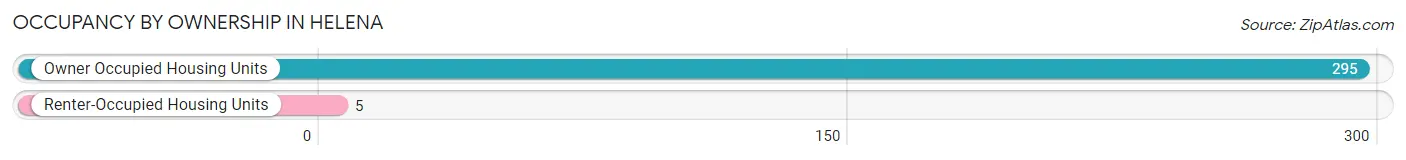
| Occupancy | # Housing Units | % Housing Units |
| Owner Occupied Housing Units | 295 | 98.3% |
| Renter-Occupied Housing Units | 5 | 1.7% |
| Total Occupied Housing Units | 300 | 100.0% |
Occupancy by Household Size in Helena
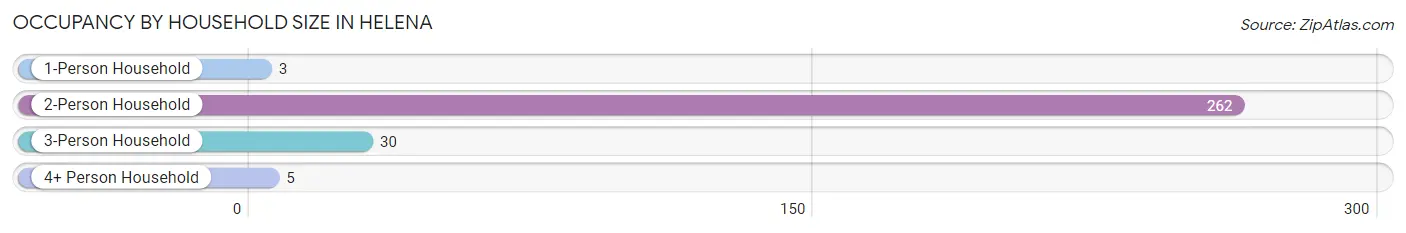
| Household Size | # Housing Units | % Housing Units |
| 1-Person Household | 3 | 1.0% |
| 2-Person Household | 262 | 87.3% |
| 3-Person Household | 30 | 10.0% |
| 4+ Person Household | 5 | 1.7% |
| Total Housing Units | 300 | 100.0% |
Occupancy by Ownership by Household Size in Helena
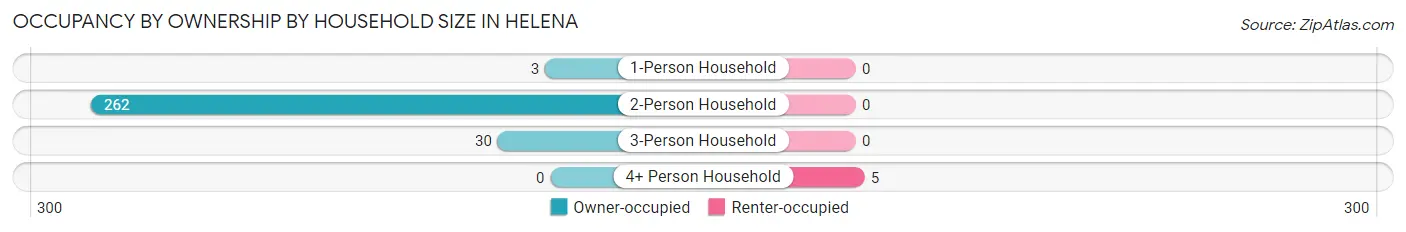
| Household Size | Owner-occupied | Renter-occupied |
| 1-Person Household | 3 (100.0%) | 0 (0.0%) |
| 2-Person Household | 262 (100.0%) | 0 (0.0%) |
| 3-Person Household | 30 (100.0%) | 0 (0.0%) |
| 4+ Person Household | 0 (0.0%) | 5 (100.0%) |
| Total Housing Units | 295 (98.3%) | 5 (1.7%) |
Occupancy by Educational Attainment in Helena
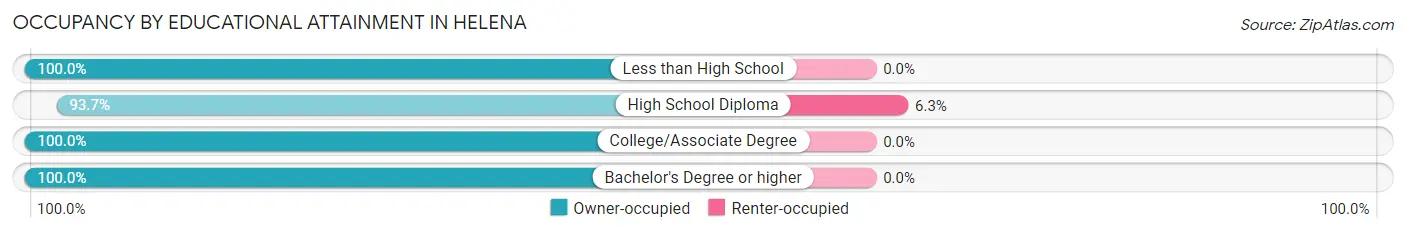
| Household Size | Owner-occupied | Renter-occupied |
| Less than High School | 18 (100.0%) | 0 (0.0%) |
| High School Diploma | 74 (93.7%) | 5 (6.3%) |
| College/Associate Degree | 173 (100.0%) | 0 (0.0%) |
| Bachelor's Degree or higher | 30 (100.0%) | 0 (0.0%) |
Occupancy by Age of Householder in Helena
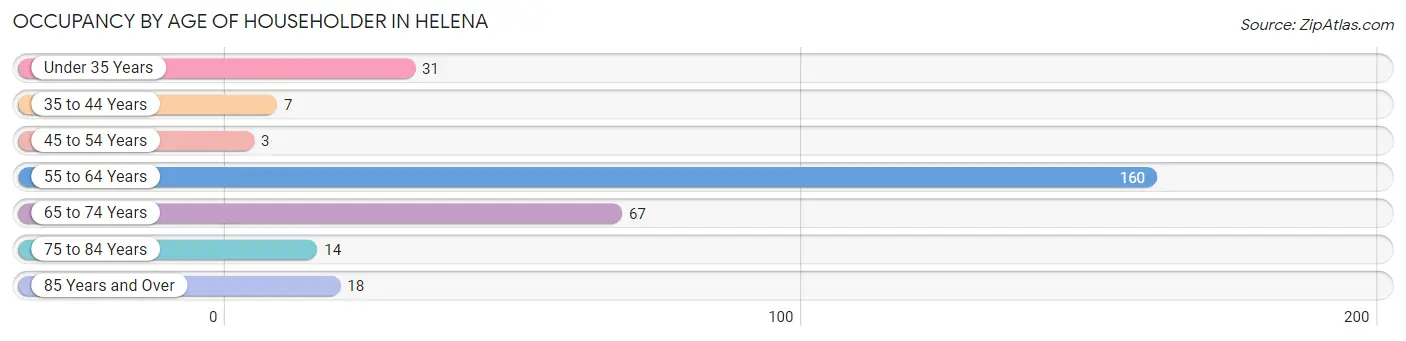
| Age Bracket | # Households | % Households |
| Under 35 Years | 31 | 10.3% |
| 35 to 44 Years | 7 | 2.3% |
| 45 to 54 Years | 3 | 1.0% |
| 55 to 64 Years | 160 | 53.3% |
| 65 to 74 Years | 67 | 22.3% |
| 75 to 84 Years | 14 | 4.7% |
| 85 Years and Over | 18 | 6.0% |
| Total | 300 | 100.0% |
Housing Finances in Helena
Median Income by Occupancy in Helena
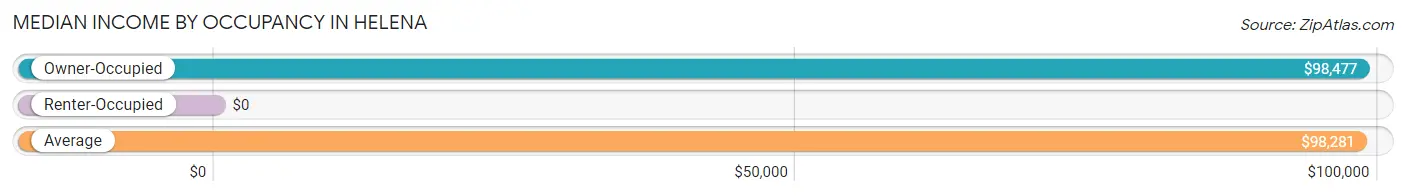
| Occupancy Type | # Households | Median Income |
| Owner-Occupied | 295 (98.3%) | $98,477 |
| Renter-Occupied | 5 (1.7%) | $0 |
| Average | 300 (100.0%) | $98,281 |
Occupancy by Householder Income Bracket in Helena
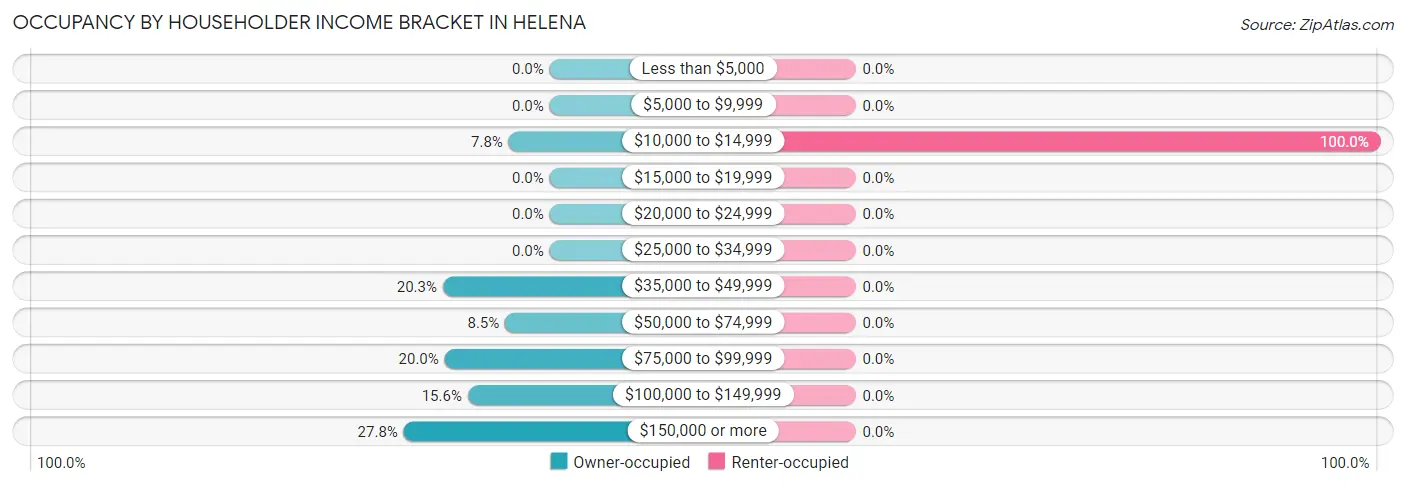
| Income Bracket | Owner-occupied | Renter-occupied |
| Less than $5,000 | 0 (0.0%) | 0 (0.0%) |
| $5,000 to $9,999 | 0 (0.0%) | 0 (0.0%) |
| $10,000 to $14,999 | 23 (7.8%) | 5 (100.0%) |
| $15,000 to $19,999 | 0 (0.0%) | 0 (0.0%) |
| $20,000 to $24,999 | 0 (0.0%) | 0 (0.0%) |
| $25,000 to $34,999 | 0 (0.0%) | 0 (0.0%) |
| $35,000 to $49,999 | 60 (20.3%) | 0 (0.0%) |
| $50,000 to $74,999 | 25 (8.5%) | 0 (0.0%) |
| $75,000 to $99,999 | 59 (20.0%) | 0 (0.0%) |
| $100,000 to $149,999 | 46 (15.6%) | 0 (0.0%) |
| $150,000 or more | 82 (27.8%) | 0 (0.0%) |
| Total | 295 (100.0%) | 5 (100.0%) |
Monthly Housing Cost Tiers in Helena
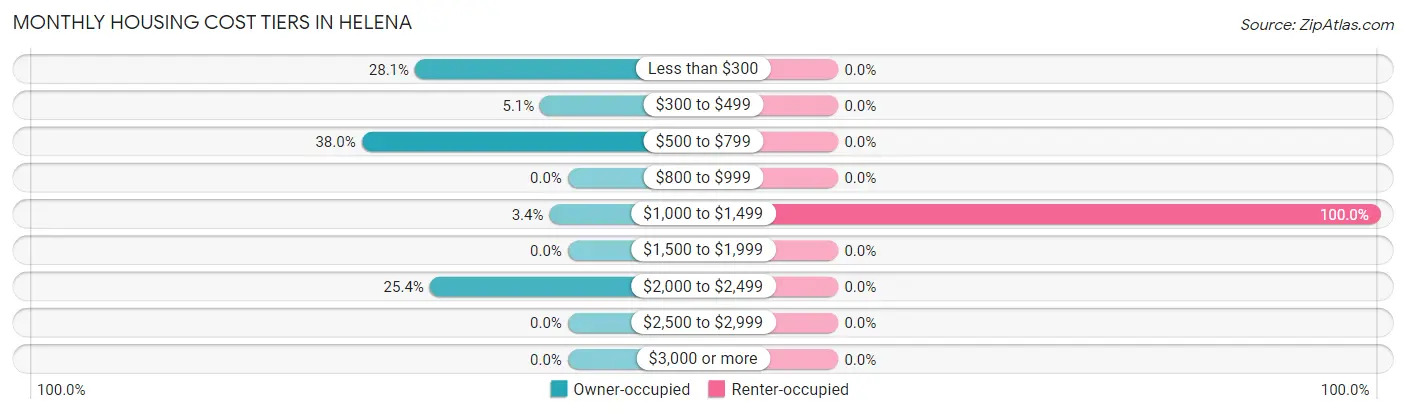
| Monthly Cost | Owner-occupied | Renter-occupied |
| Less than $300 | 83 (28.1%) | 0 (0.0%) |
| $300 to $499 | 15 (5.1%) | 0 (0.0%) |
| $500 to $799 | 112 (38.0%) | 0 (0.0%) |
| $800 to $999 | 0 (0.0%) | 0 (0.0%) |
| $1,000 to $1,499 | 10 (3.4%) | 5 (100.0%) |
| $1,500 to $1,999 | 0 (0.0%) | 0 (0.0%) |
| $2,000 to $2,499 | 75 (25.4%) | 0 (0.0%) |
| $2,500 to $2,999 | 0 (0.0%) | 0 (0.0%) |
| $3,000 or more | 0 (0.0%) | 0 (0.0%) |
| Total | 295 (100.0%) | 5 (100.0%) |
Physical Housing Characteristics in Helena
Housing Structures in Helena
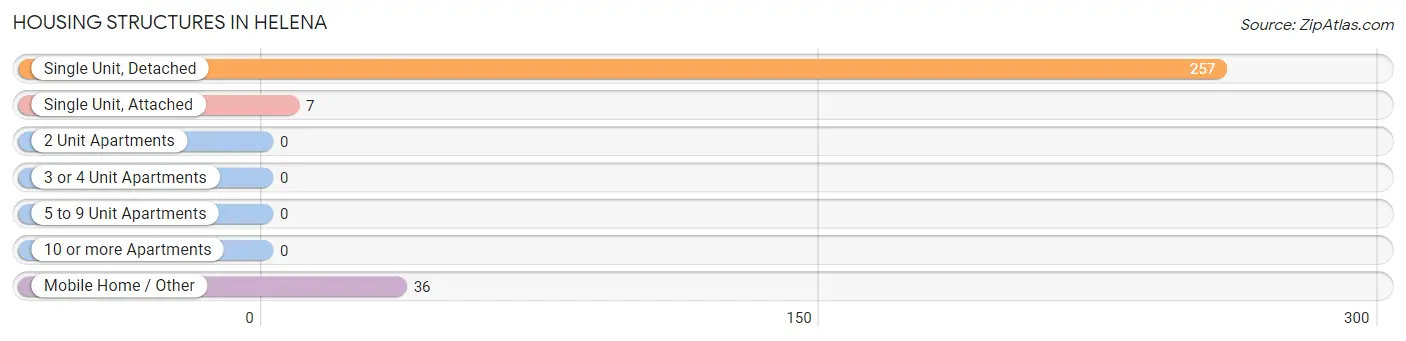
| Structure Type | # Housing Units | % Housing Units |
| Single Unit, Detached | 257 | 85.7% |
| Single Unit, Attached | 7 | 2.3% |
| 2 Unit Apartments | 0 | 0.0% |
| 3 or 4 Unit Apartments | 0 | 0.0% |
| 5 to 9 Unit Apartments | 0 | 0.0% |
| 10 or more Apartments | 0 | 0.0% |
| Mobile Home / Other | 36 | 12.0% |
| Total | 300 | 100.0% |
Housing Structures by Occupancy in Helena
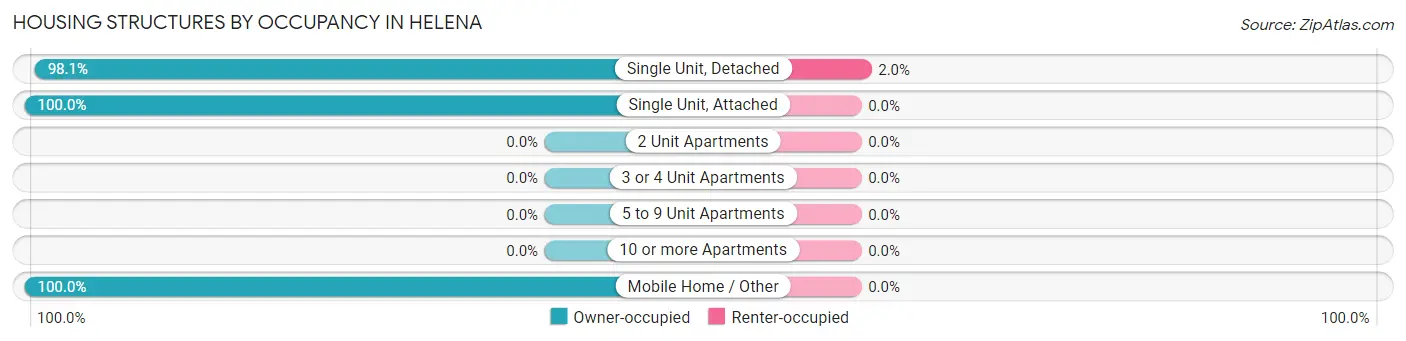
| Structure Type | Owner-occupied | Renter-occupied |
| Single Unit, Detached | 252 (98.1%) | 5 (1.9%) |
| Single Unit, Attached | 7 (100.0%) | 0 (0.0%) |
| 2 Unit Apartments | 0 (0.0%) | 0 (0.0%) |
| 3 or 4 Unit Apartments | 0 (0.0%) | 0 (0.0%) |
| 5 to 9 Unit Apartments | 0 (0.0%) | 0 (0.0%) |
| 10 or more Apartments | 0 (0.0%) | 0 (0.0%) |
| Mobile Home / Other | 36 (100.0%) | 0 (0.0%) |
| Total | 295 (98.3%) | 5 (1.7%) |
Housing Structures by Number of Rooms in Helena
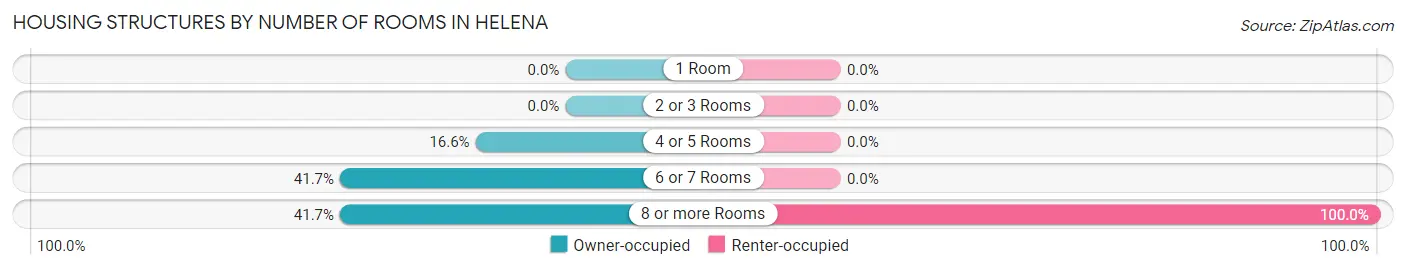
| Number of Rooms | Owner-occupied | Renter-occupied |
| 1 Room | 0 (0.0%) | 0 (0.0%) |
| 2 or 3 Rooms | 0 (0.0%) | 0 (0.0%) |
| 4 or 5 Rooms | 49 (16.6%) | 0 (0.0%) |
| 6 or 7 Rooms | 123 (41.7%) | 0 (0.0%) |
| 8 or more Rooms | 123 (41.7%) | 5 (100.0%) |
| Total | 295 (100.0%) | 5 (100.0%) |
Housing Structure by Heating Type in Helena
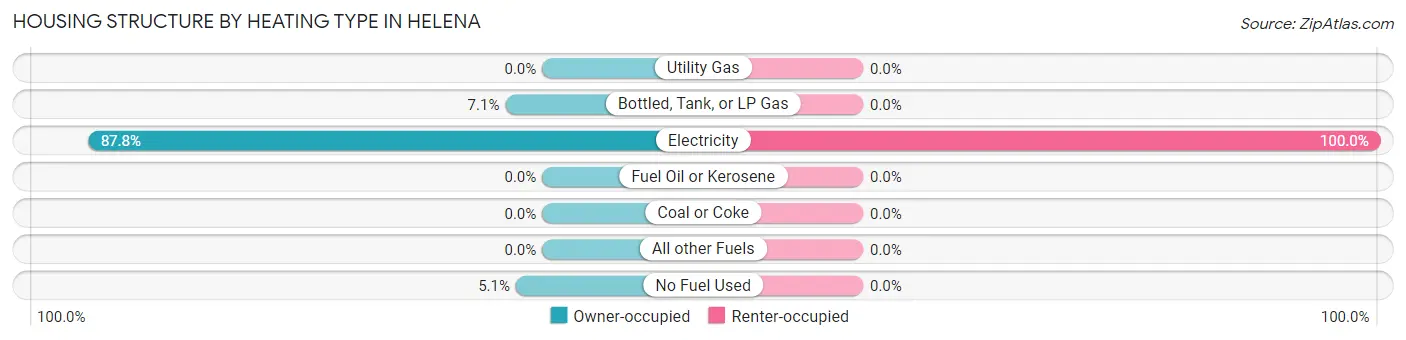
| Heating Type | Owner-occupied | Renter-occupied |
| Utility Gas | 0 (0.0%) | 0 (0.0%) |
| Bottled, Tank, or LP Gas | 21 (7.1%) | 0 (0.0%) |
| Electricity | 259 (87.8%) | 5 (100.0%) |
| Fuel Oil or Kerosene | 0 (0.0%) | 0 (0.0%) |
| Coal or Coke | 0 (0.0%) | 0 (0.0%) |
| All other Fuels | 0 (0.0%) | 0 (0.0%) |
| No Fuel Used | 15 (5.1%) | 0 (0.0%) |
| Total | 295 (100.0%) | 5 (100.0%) |
Household Vehicle Usage in Helena
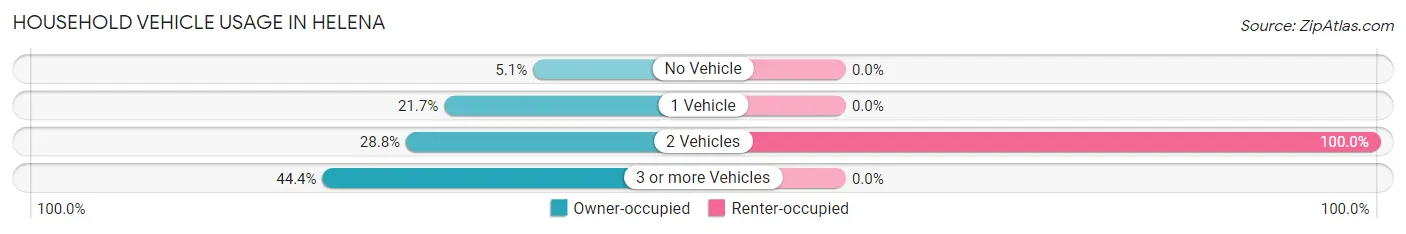
| Vehicles per Household | Owner-occupied | Renter-occupied |
| No Vehicle | 15 (5.1%) | 0 (0.0%) |
| 1 Vehicle | 64 (21.7%) | 0 (0.0%) |
| 2 Vehicles | 85 (28.8%) | 5 (100.0%) |
| 3 or more Vehicles | 131 (44.4%) | 0 (0.0%) |
| Total | 295 (100.0%) | 5 (100.0%) |
Real Estate & Mortgages in Helena
Real Estate and Mortgage Overview in Helena
| Characteristic | Without Mortgage | With Mortgage |
| Housing Units | 213 | 82 |
| Median Property Value | $104,300 | $321,200 |
| Median Household Income | $97,617 | $52 |
| Monthly Housing Costs | $513 | $0 |
| Real Estate Taxes | $2,261 | $23 |
Property Value by Mortgage Status in Helena
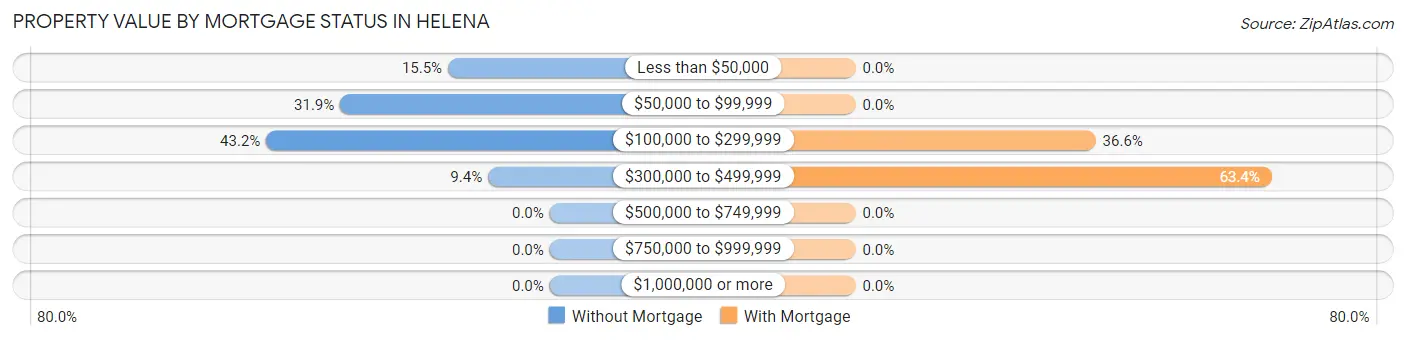
| Property Value | Without Mortgage | With Mortgage |
| Less than $50,000 | 33 (15.5%) | 0 (0.0%) |
| $50,000 to $99,999 | 68 (31.9%) | 0 (0.0%) |
| $100,000 to $299,999 | 92 (43.2%) | 30 (36.6%) |
| $300,000 to $499,999 | 20 (9.4%) | 52 (63.4%) |
| $500,000 to $749,999 | 0 (0.0%) | 0 (0.0%) |
| $750,000 to $999,999 | 0 (0.0%) | 0 (0.0%) |
| $1,000,000 or more | 0 (0.0%) | 0 (0.0%) |
| Total | 213 (100.0%) | 82 (100.0%) |
Household Income by Mortgage Status in Helena
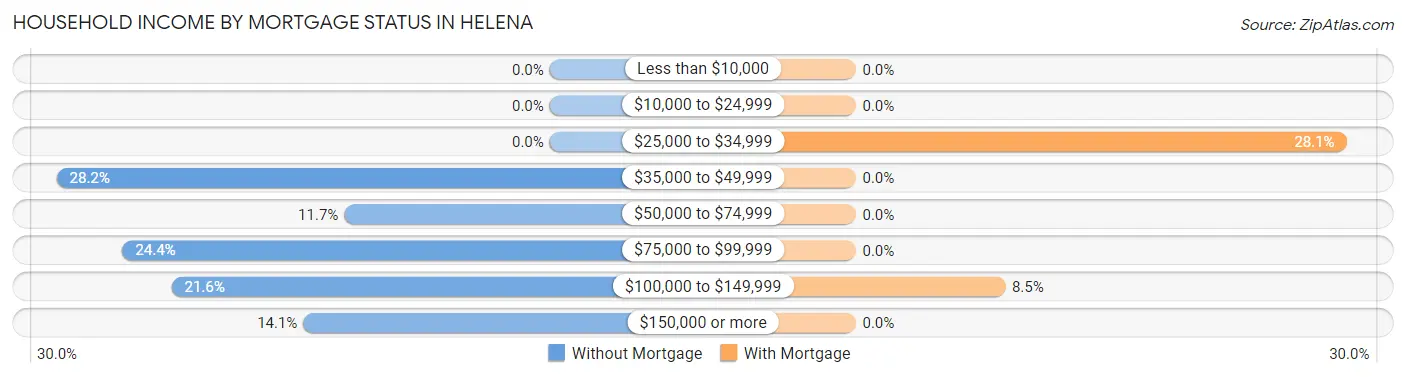
| Household Income | Without Mortgage | With Mortgage |
| Less than $10,000 | 0 (0.0%) | 0 (0.0%) |
| $10,000 to $24,999 | 0 (0.0%) | 0 (0.0%) |
| $25,000 to $34,999 | 0 (0.0%) | 23 (28.1%) |
| $35,000 to $49,999 | 60 (28.2%) | 0 (0.0%) |
| $50,000 to $74,999 | 25 (11.7%) | 0 (0.0%) |
| $75,000 to $99,999 | 52 (24.4%) | 0 (0.0%) |
| $100,000 to $149,999 | 46 (21.6%) | 7 (8.5%) |
| $150,000 or more | 30 (14.1%) | 0 (0.0%) |
| Total | 213 (100.0%) | 82 (100.0%) |
Property Value to Household Income Ratio in Helena
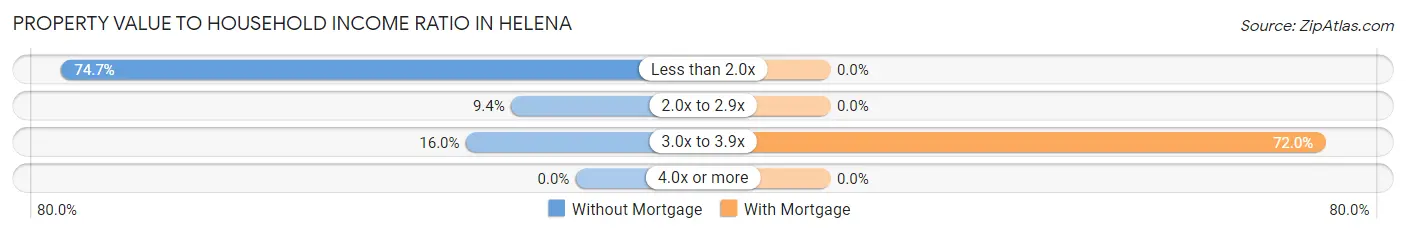
| Value-to-Income Ratio | Without Mortgage | With Mortgage |
| Less than 2.0x | 159 (74.7%) | 0 (0.0%) |
| 2.0x to 2.9x | 20 (9.4%) | 0 (0.0%) |
| 3.0x to 3.9x | 34 (16.0%) | 59 (72.0%) |
| 4.0x or more | 0 (0.0%) | 0 (0.0%) |
| Total | 213 (100.0%) | 82 (100.0%) |
Real Estate Taxes by Mortgage Status in Helena
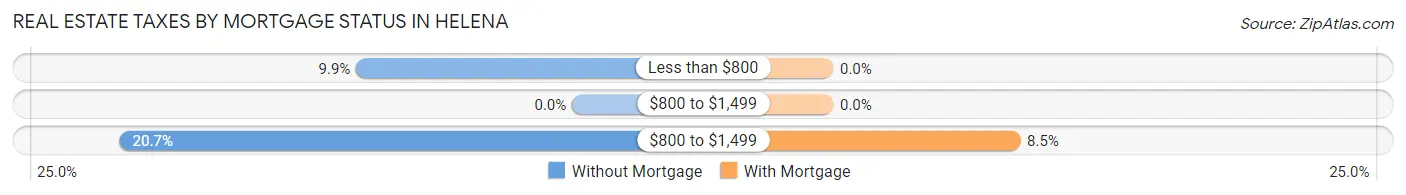
| Property Taxes | Without Mortgage | With Mortgage |
| Less than $800 | 21 (9.9%) | 0 (0.0%) |
| $800 to $1,499 | 0 (0.0%) | 0 (0.0%) |
| $800 to $1,499 | 44 (20.7%) | 7 (8.5%) |
| Total | 213 (100.0%) | 82 (100.0%) |
Health & Disability in Helena
Health Insurance Coverage by Age in Helena
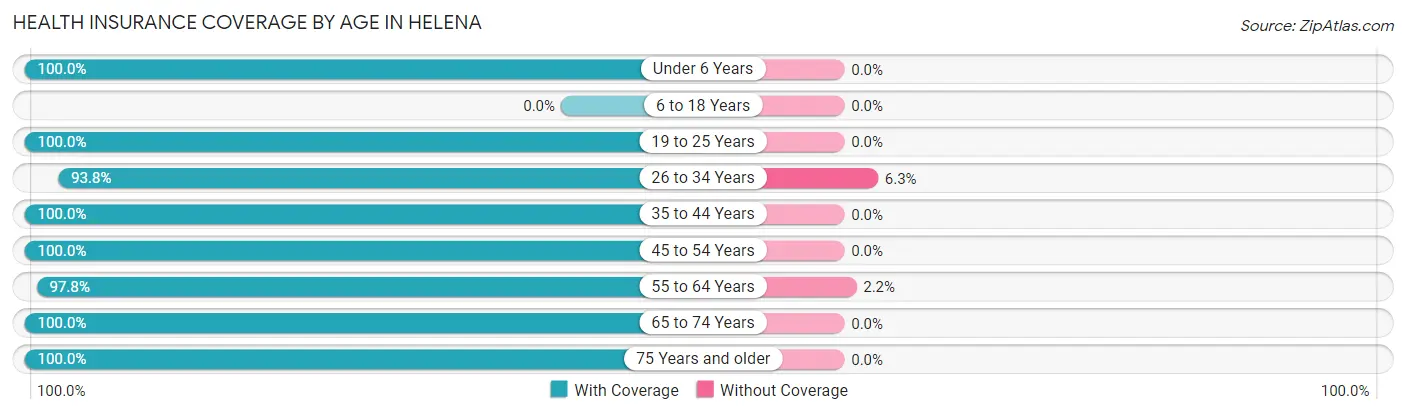
| Age Bracket | With Coverage | Without Coverage |
| Under 6 Years | 20 (100.0%) | 0 (0.0%) |
| 6 to 18 Years | 0 (0.0%) | 0 (0.0%) |
| 19 to 25 Years | 5 (100.0%) | 0 (0.0%) |
| 26 to 34 Years | 75 (93.8%) | 5 (6.2%) |
| 35 to 44 Years | 23 (100.0%) | 0 (0.0%) |
| 45 to 54 Years | 3 (100.0%) | 0 (0.0%) |
| 55 to 64 Years | 350 (97.8%) | 8 (2.2%) |
| 65 to 74 Years | 134 (100.0%) | 0 (0.0%) |
| 75 Years and older | 69 (100.0%) | 0 (0.0%) |
| Total | 679 (98.1%) | 13 (1.9%) |
Health Insurance Coverage by Citizenship Status in Helena
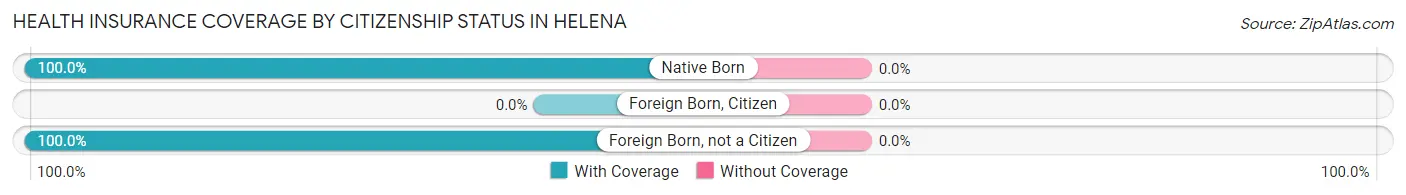
| Citizenship Status | With Coverage | Without Coverage |
| Native Born | 20 (100.0%) | 0 (0.0%) |
| Foreign Born, Citizen | 0 (0.0%) | 0 (0.0%) |
| Foreign Born, not a Citizen | 5 (100.0%) | 0 (0.0%) |
Health Insurance Coverage by Household Income in Helena
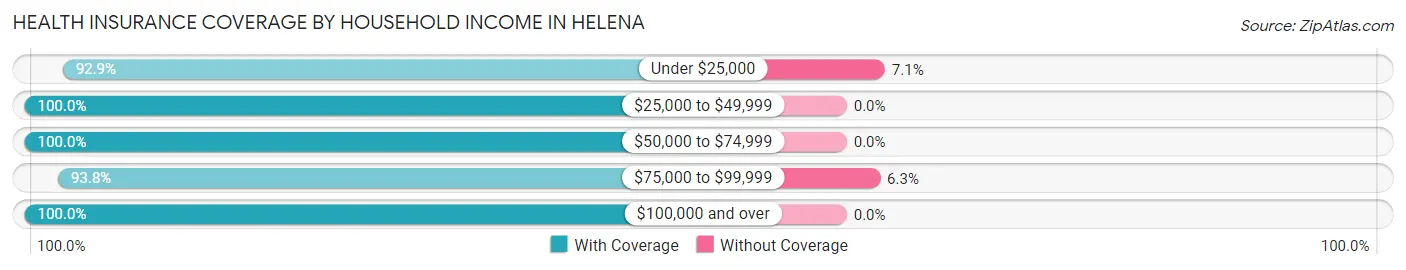
| Household Income | With Coverage | Without Coverage |
| Under $25,000 | 65 (92.9%) | 5 (7.1%) |
| $25,000 to $49,999 | 129 (100.0%) | 0 (0.0%) |
| $50,000 to $74,999 | 59 (100.0%) | 0 (0.0%) |
| $75,000 to $99,999 | 120 (93.8%) | 8 (6.2%) |
| $100,000 and over | 306 (100.0%) | 0 (0.0%) |
Public vs Private Health Insurance Coverage by Age in Helena
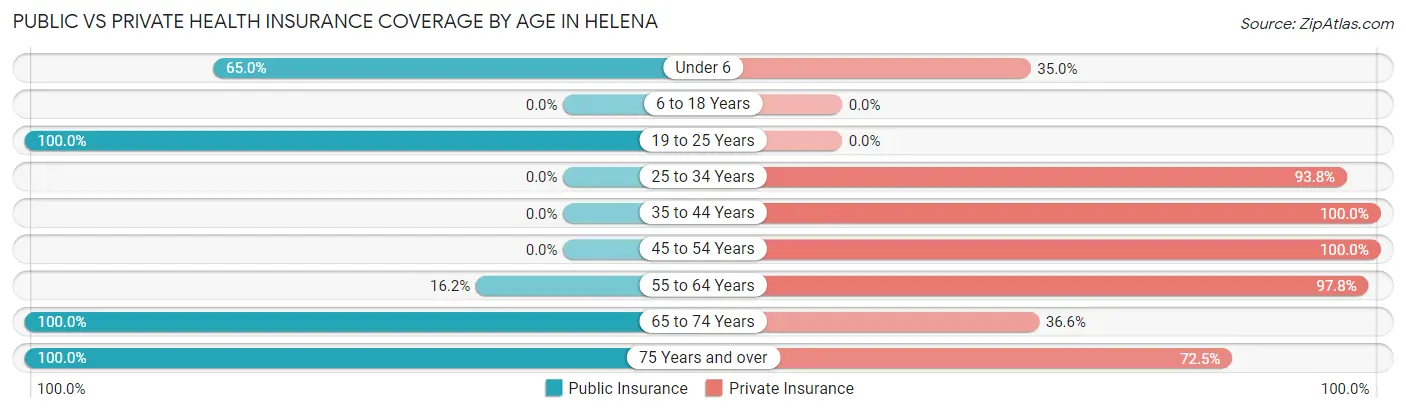
| Age Bracket | Public Insurance | Private Insurance |
| Under 6 | 13 (65.0%) | 7 (35.0%) |
| 6 to 18 Years | 0 (0.0%) | 0 (0.0%) |
| 19 to 25 Years | 5 (100.0%) | 0 (0.0%) |
| 25 to 34 Years | 0 (0.0%) | 75 (93.8%) |
| 35 to 44 Years | 0 (0.0%) | 23 (100.0%) |
| 45 to 54 Years | 0 (0.0%) | 3 (100.0%) |
| 55 to 64 Years | 58 (16.2%) | 350 (97.8%) |
| 65 to 74 Years | 134 (100.0%) | 49 (36.6%) |
| 75 Years and over | 69 (100.0%) | 50 (72.5%) |
| Total | 279 (40.3%) | 557 (80.5%) |
Disability Status by Sex by Age in Helena
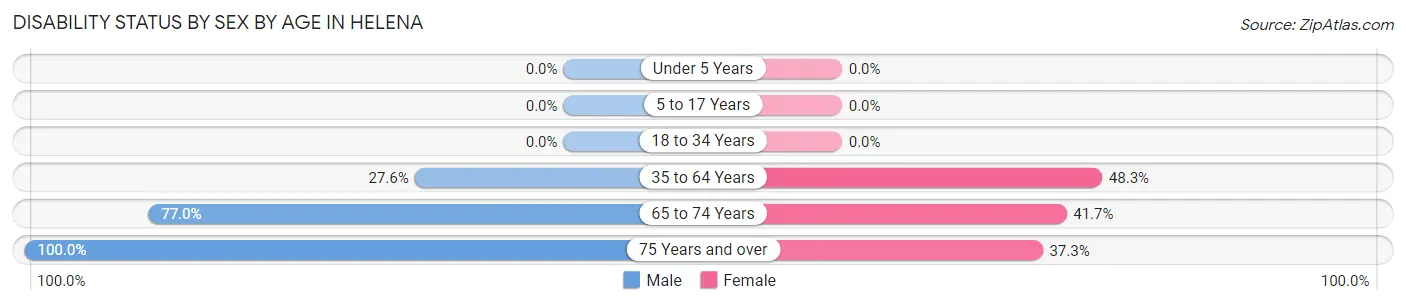
| Age Bracket | Male | Female |
| Under 5 Years | 0 (0.0%) | 0 (0.0%) |
| 5 to 17 Years | 0 (0.0%) | 0 (0.0%) |
| 18 to 34 Years | 0 (0.0%) | 0 (0.0%) |
| 35 to 64 Years | 58 (27.6%) | 84 (48.3%) |
| 65 to 74 Years | 57 (77.0%) | 25 (41.7%) |
| 75 Years and over | 18 (100.0%) | 19 (37.2%) |
Disability Class by Sex by Age in Helena
Disability Class: Hearing Difficulty
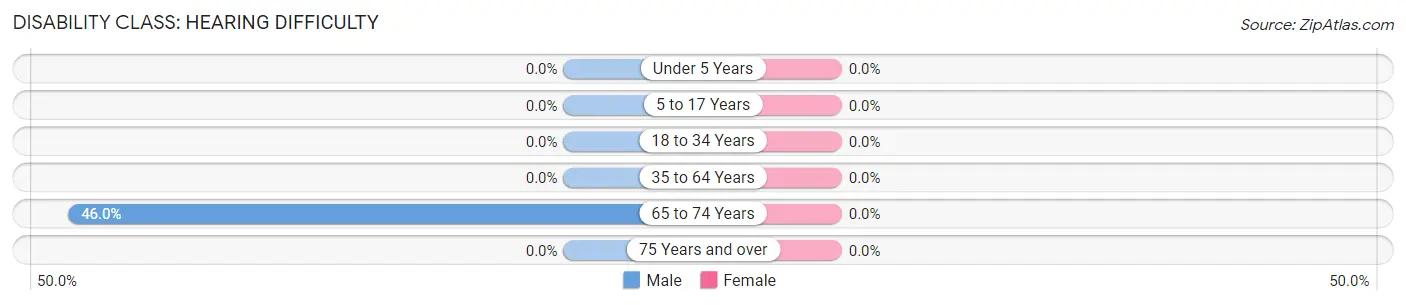
| Age Bracket | Male | Female |
| Under 5 Years | 0 (0.0%) | 0 (0.0%) |
| 5 to 17 Years | 0 (0.0%) | 0 (0.0%) |
| 18 to 34 Years | 0 (0.0%) | 0 (0.0%) |
| 35 to 64 Years | 0 (0.0%) | 0 (0.0%) |
| 65 to 74 Years | 34 (46.0%) | 0 (0.0%) |
| 75 Years and over | 0 (0.0%) | 0 (0.0%) |
Disability Class: Vision Difficulty
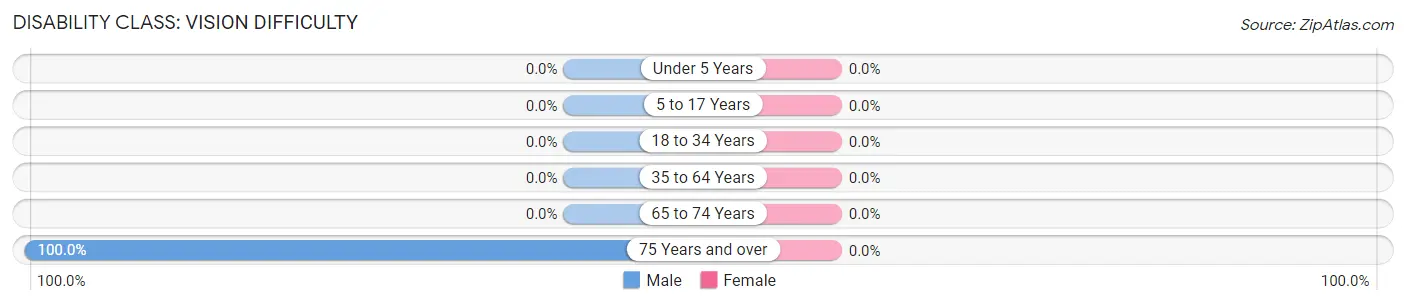
| Age Bracket | Male | Female |
| Under 5 Years | 0 (0.0%) | 0 (0.0%) |
| 5 to 17 Years | 0 (0.0%) | 0 (0.0%) |
| 18 to 34 Years | 0 (0.0%) | 0 (0.0%) |
| 35 to 64 Years | 0 (0.0%) | 0 (0.0%) |
| 65 to 74 Years | 0 (0.0%) | 0 (0.0%) |
| 75 Years and over | 18 (100.0%) | 0 (0.0%) |
Disability Class: Cognitive Difficulty
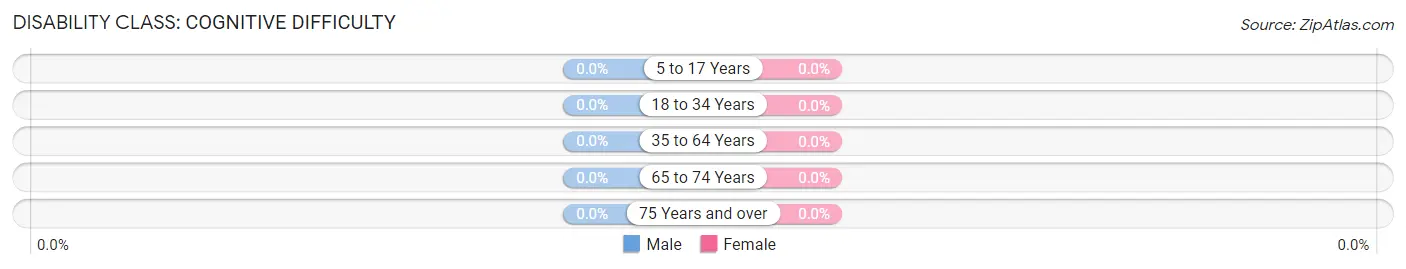
| Age Bracket | Male | Female |
| 5 to 17 Years | 0 (0.0%) | 0 (0.0%) |
| 18 to 34 Years | 0 (0.0%) | 0 (0.0%) |
| 35 to 64 Years | 0 (0.0%) | 0 (0.0%) |
| 65 to 74 Years | 0 (0.0%) | 0 (0.0%) |
| 75 Years and over | 0 (0.0%) | 0 (0.0%) |
Disability Class: Ambulatory Difficulty
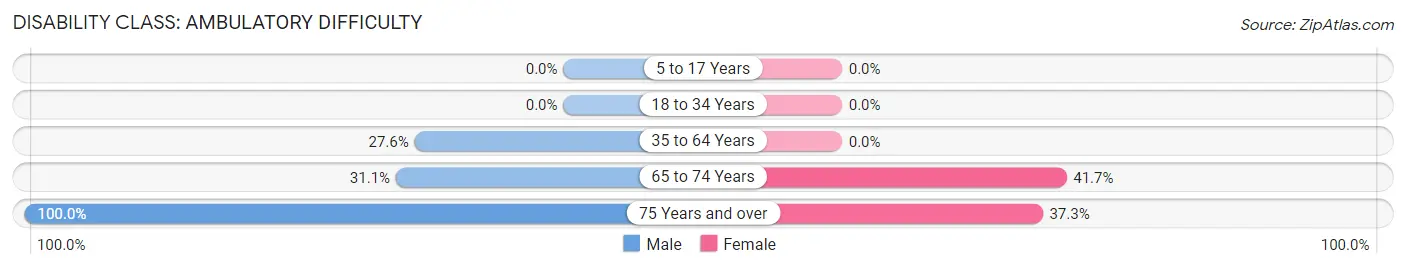
| Age Bracket | Male | Female |
| 5 to 17 Years | 0 (0.0%) | 0 (0.0%) |
| 18 to 34 Years | 0 (0.0%) | 0 (0.0%) |
| 35 to 64 Years | 58 (27.6%) | 0 (0.0%) |
| 65 to 74 Years | 23 (31.1%) | 25 (41.7%) |
| 75 Years and over | 18 (100.0%) | 19 (37.2%) |
Disability Class: Self-Care Difficulty
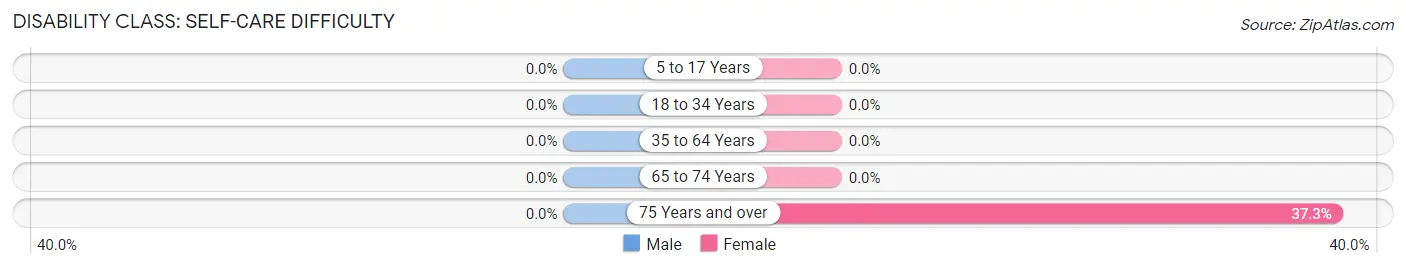
| Age Bracket | Male | Female |
| 5 to 17 Years | 0 (0.0%) | 0 (0.0%) |
| 18 to 34 Years | 0 (0.0%) | 0 (0.0%) |
| 35 to 64 Years | 0 (0.0%) | 0 (0.0%) |
| 65 to 74 Years | 0 (0.0%) | 0 (0.0%) |
| 75 Years and over | 0 (0.0%) | 19 (37.2%) |
Technology Access in Helena
Computing Device Access in Helena
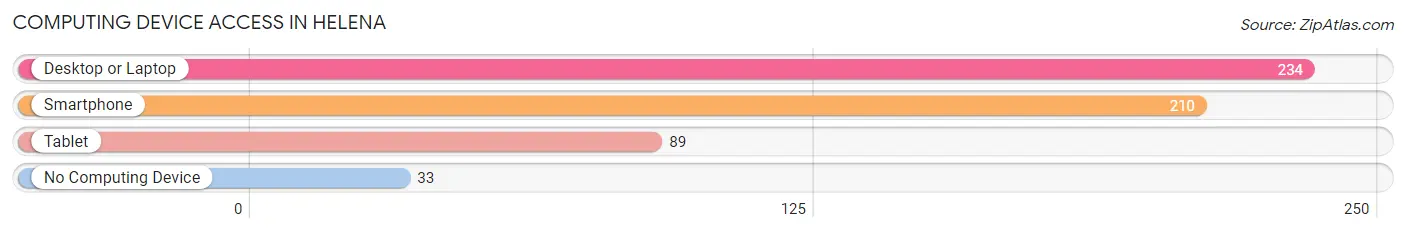
| Device Type | # Households | % Households |
| Desktop or Laptop | 234 | 78.0% |
| Smartphone | 210 | 70.0% |
| Tablet | 89 | 29.7% |
| No Computing Device | 33 | 11.0% |
| Total | 300 | 100.0% |
Internet Access in Helena
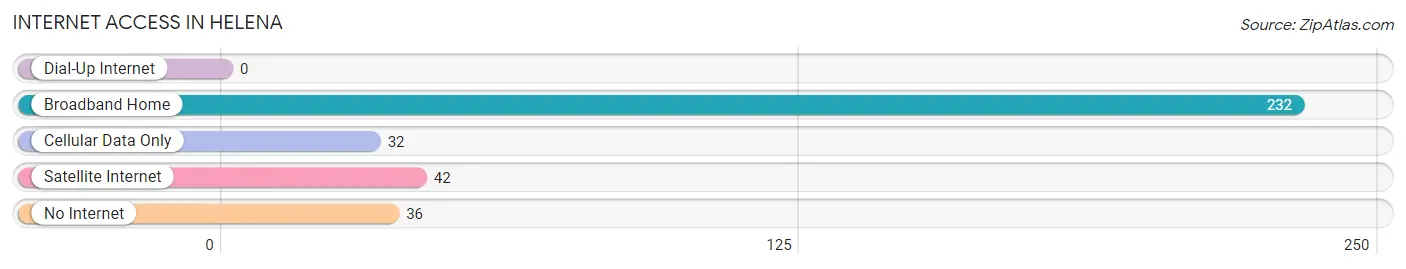
| Internet Type | # Households | % Households |
| Dial-Up Internet | 0 | 0.0% |
| Broadband Home | 232 | 77.3% |
| Cellular Data Only | 32 | 10.7% |
| Satellite Internet | 42 | 14.0% |
| No Internet | 36 | 12.0% |
| Total | 300 | 100.0% |
Helena Summary
Helena is a city located in the state of Mississippi, in the United States of America. It is the county seat of Phillips County and is located in the Mississippi Delta region. Helena is situated on the banks of the Mississippi River, and is part of the larger metropolitan area of Memphis, Tennessee. The city has a population of approximately 16,000 people, and is the largest city in Phillips County.
History
The area that is now Helena was first settled by Native Americans, who were drawn to the area due to its fertile soil and abundant resources. The first European settlers arrived in the area in the early 1800s, and the city of Helena was officially founded in 1833. The city was named after the daughter of the first settler, John D. Martin.
Helena quickly grew into an important port city, as it was located at the confluence of the Mississippi and St. Francis Rivers. The city was a major hub for the cotton trade, and was also a major center for the steamboat industry. During the Civil War, Helena was the site of several battles, and the city was occupied by Union forces in 1862.
After the war, Helena continued to grow and prosper, and by the early 1900s, it had become a major center for the lumber industry. The city also became a major center for the blues music scene, and was home to several influential blues musicians, including Robert Johnson and Muddy Waters.
Geography
Helena is located in the Mississippi Delta region, and is situated on the banks of the Mississippi River. The city is located in the northwest corner of Phillips County, and is bordered by the cities of West Helena and Marvell. The city has a total area of 8.3 square miles, and has an elevation of approximately 200 feet.
The climate in Helena is classified as humid subtropical, with hot, humid summers and mild winters. The average annual temperature is around 64 degrees Fahrenheit, and the average annual precipitation is around 48 inches.
Economy
The economy of Helena is largely based on agriculture, with cotton, soybeans, and rice being the main crops. The city is also home to several manufacturing companies, including a paper mill and a furniture factory. The city is also home to several retail stores, restaurants, and other businesses.
Demographics
As of the 2010 census, Helena had a population of 16,312 people. The racial makeup of the city was 57.3% African American, 37.2% White, 0.3% Native American, 0.2% Asian, 0.1% Pacific Islander, and 4.9% from other races. The median household income was $25,945, and the median family income was $31,919. The per capita income was $14,945.
Helena is home to several churches, including the First Baptist Church, the First United Methodist Church, and the St. Mary's Catholic Church. The city is also home to several schools, including the Helena-West Helena School District, the Phillips County School District, and the University of Arkansas at Helena.
Common Questions
What is Per Capita Income in Helena?
Per Capita income in Helena is $48,212.
What is the Median Family Income in Helena?
Median Family Income in Helena is $98,398.
What is the Median Household income in Helena?
Median Household Income in Helena is $98,281.
What is Inequality or Gini Index in Helena?
Inequality or Gini Index in Helena is 0.33.
What is the Total Population of Helena?
Total Population of Helena is 692.
What is the Total Male Population of Helena?
Total Male Population of Helena is 395.
What is the Total Female Population of Helena?
Total Female Population of Helena is 297.
What is the Ratio of Males per 100 Females in Helena?
There are 133.00 Males per 100 Females in Helena.
What is the Ratio of Females per 100 Males in Helena?
There are 75.19 Females per 100 Males in Helena.
What is the Median Population Age in Helena?
Median Population Age in Helena is 61.6 Years.
What is the Average Family Size in Helena
Average Family Size in Helena is 2.3 People.
What is the Average Household Size in Helena
Average Household Size in Helena is 2.3 People.
How Large is the Labor Force in Helena?
There are 385 People in the Labor Forcein in Helena.
What is the Percentage of People in the Labor Force in Helena?
57.3% of People are in the Labor Force in Helena.
What is the Unemployment Rate in Helena?
Unemployment Rate in Helena is 1.3%.