Flowood, MS Map & Demographics
Flowood Map
Flowood Overview
$42,248
PER CAPITA INCOME
$114,526
AVG FAMILY INCOME
$89,144
AVG HOUSEHOLD INCOME
31.2%
WAGE / INCOME GAP [ % ]
68.8¢/ $1
WAGE / INCOME GAP [ $ ]
$18,179
FAMILY INCOME DEFICIT
0.42
INEQUALITY / GINI INDEX
10,204
TOTAL POPULATION
4,477
MALE POPULATION
5,727
FEMALE POPULATION
78.17
MALES / 100 FEMALES
127.92
FEMALES / 100 MALES
35.4
MEDIAN AGE
3.0
AVG FAMILY SIZE
2.5
AVG HOUSEHOLD SIZE
5,507
LABOR FORCE [ PEOPLE ]
71.4%
PERCENT IN LABOR FORCE
4.6%
UNEMPLOYMENT RATE
Flowood Zip Codes
Flowood Area Codes
Income in Flowood
Income Overview in Flowood
Per Capita Income in Flowood is $42,248, while median incomes of families and households are $114,526 and $89,144 respectively.
| Characteristic | Number | Measure |
| Per Capita Income | 10,204 | $42,248 |
| Median Family Income | 2,723 | $114,526 |
| Mean Family Income | 2,723 | $127,713 |
| Median Household Income | 4,073 | $89,144 |
| Mean Household Income | 4,073 | $104,368 |
| Income Deficit | 2,723 | $18,179 |
| Wage / Income Gap (%) | 10,204 | 31.21% |
| Wage / Income Gap ($) | 10,204 | 68.79¢ per $1 |
| Gini / Inequality Index | 10,204 | 0.42 |
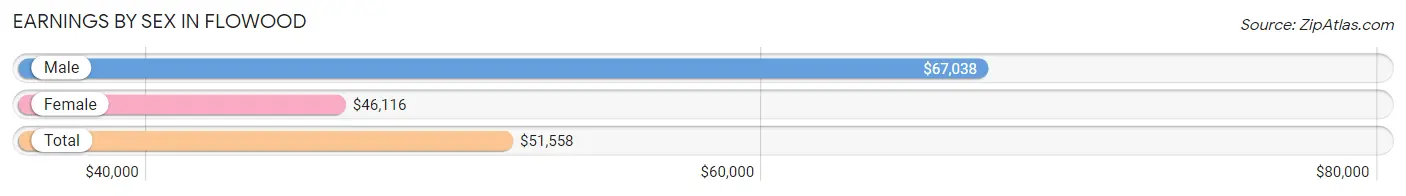
Earnings by Sex in Flowood
Average Earnings in Flowood are $51,558, $67,038 for men and $46,116 for women, a difference of 31.2%.
| Sex | Number | Average Earnings |
| Male | 2,969 (52.4%) | $67,038 |
| Female | 2,700 (47.6%) | $46,116 |
| Total | 5,669 (100.0%) | $51,558 |
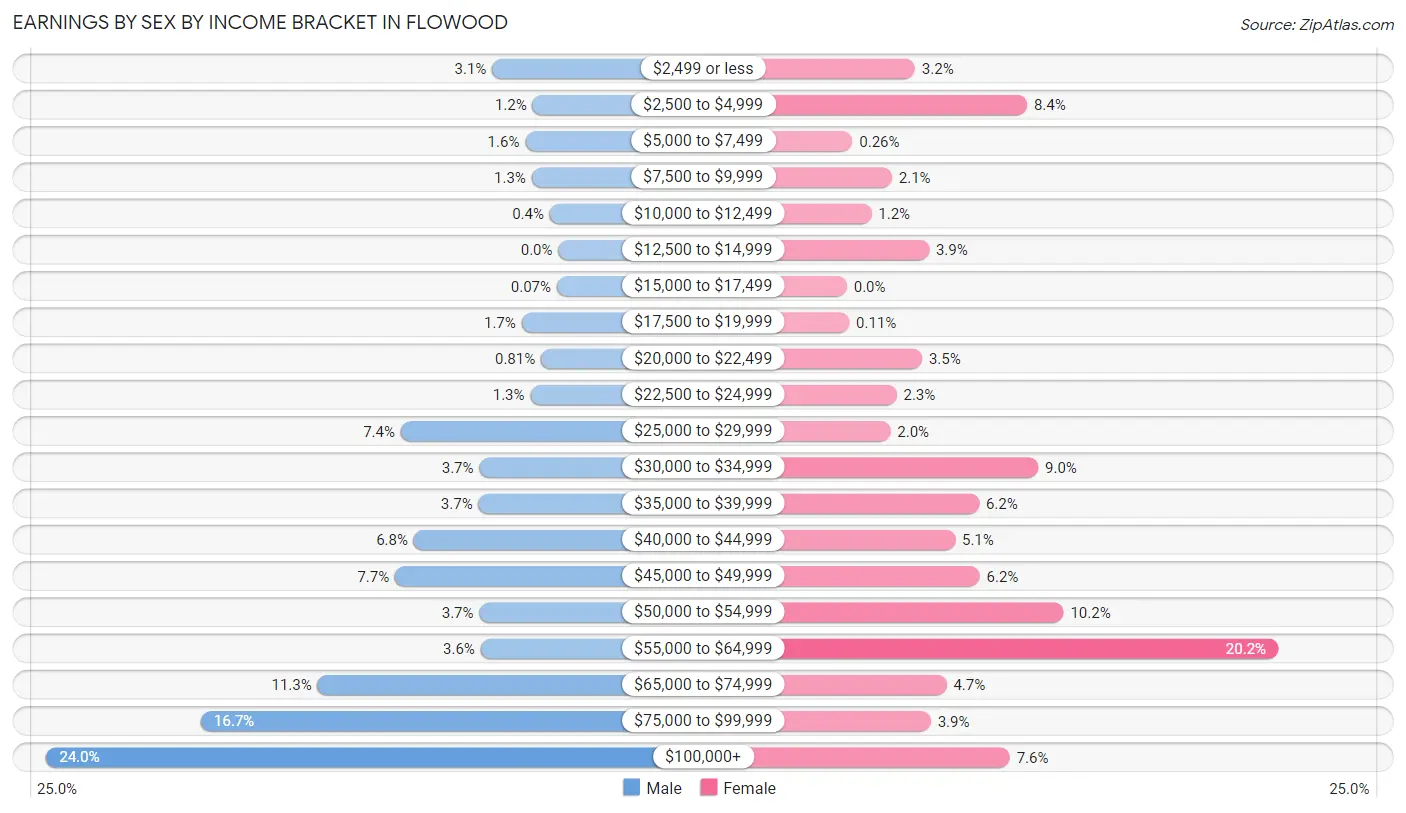
Earnings by Sex by Income Bracket in Flowood
The most common earnings brackets in Flowood are $100,000+ for men (712 | 24.0%) and $55,000 to $64,999 for women (545 | 20.2%).
| Income | Male | Female |
| $2,499 or less | 92 (3.1%) | 86 (3.2%) |
| $2,500 to $4,999 | 36 (1.2%) | 228 (8.4%) |
| $5,000 to $7,499 | 46 (1.5%) | 7 (0.3%) |
| $7,500 to $9,999 | 37 (1.3%) | 57 (2.1%) |
| $10,000 to $12,499 | 12 (0.4%) | 31 (1.1%) |
| $12,500 to $14,999 | 0 (0.0%) | 104 (3.8%) |
| $15,000 to $17,499 | 2 (0.1%) | 0 (0.0%) |
| $17,500 to $19,999 | 51 (1.7%) | 3 (0.1%) |
| $20,000 to $22,499 | 24 (0.8%) | 95 (3.5%) |
| $22,500 to $24,999 | 39 (1.3%) | 63 (2.3%) |
| $25,000 to $29,999 | 219 (7.4%) | 55 (2.0%) |
| $30,000 to $34,999 | 110 (3.7%) | 242 (9.0%) |
| $35,000 to $39,999 | 111 (3.7%) | 167 (6.2%) |
| $40,000 to $44,999 | 201 (6.8%) | 137 (5.1%) |
| $45,000 to $49,999 | 227 (7.6%) | 168 (6.2%) |
| $50,000 to $54,999 | 110 (3.7%) | 274 (10.2%) |
| $55,000 to $64,999 | 108 (3.6%) | 545 (20.2%) |
| $65,000 to $74,999 | 335 (11.3%) | 126 (4.7%) |
| $75,000 to $99,999 | 497 (16.7%) | 106 (3.9%) |
| $100,000+ | 712 (24.0%) | 206 (7.6%) |
| Total | 2,969 (100.0%) | 2,700 (100.0%) |
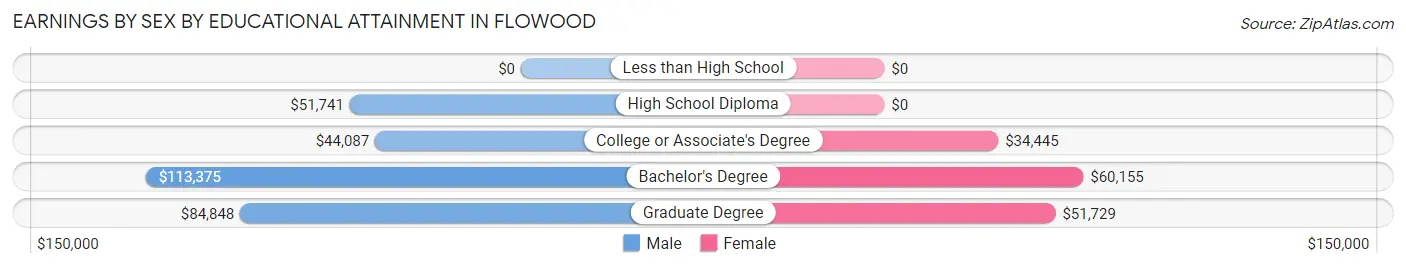
Earnings by Sex by Educational Attainment in Flowood
Average earnings in Flowood are $70,660 for men and $47,138 for women, a difference of 33.3%. Men with an educational attainment of bachelor's degree enjoy the highest average annual earnings of $113,375, while those with college or associate's degree education earn the least with $44,087. Women with an educational attainment of bachelor's degree earn the most with the average annual earnings of $60,155, while those with college or associate's degree education have the smallest earnings of $34,445.
| Educational Attainment | Male Income | Female Income |
| Less than High School | - | - |
| High School Diploma | $51,741 | $0 |
| College or Associate's Degree | $44,087 | $34,445 |
| Bachelor's Degree | $113,375 | $60,155 |
| Graduate Degree | $84,848 | $51,729 |
| Total | $70,660 | $47,138 |
Family Income in Flowood
Family Income Brackets in Flowood
According to the Flowood family income data, there are 713 families falling into the $100,000 to $149,999 income range, which is the most common income bracket and makes up 26.2% of all families. Conversely, the $15,000 to $24,999 income bracket is the least frequent group with only 22 families (0.8%) belonging to this category.
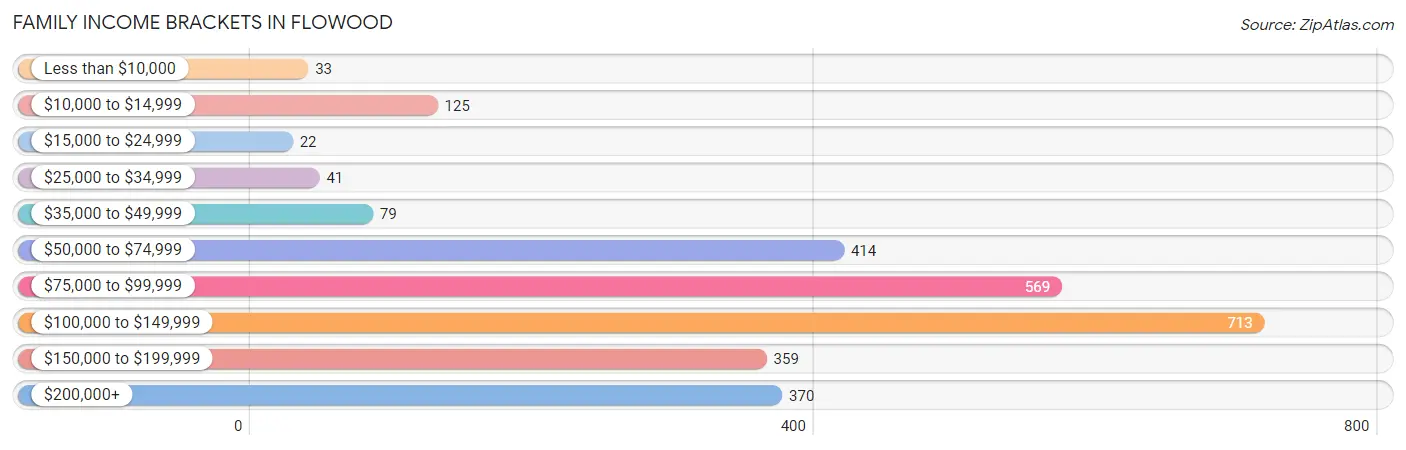
| Income Bracket | # Families | % Families |
| Less than $10,000 | 33 | 1.2% |
| $10,000 to $14,999 | 125 | 4.6% |
| $15,000 to $24,999 | 22 | 0.8% |
| $25,000 to $34,999 | 41 | 1.5% |
| $35,000 to $49,999 | 79 | 2.9% |
| $50,000 to $74,999 | 414 | 15.2% |
| $75,000 to $99,999 | 569 | 20.9% |
| $100,000 to $149,999 | 713 | 26.2% |
| $150,000 to $199,999 | 359 | 13.2% |
| $200,000+ | 370 | 13.6% |
Family Income by Famaliy Size in Flowood
5-person families (96 | 3.5%) account for the highest median family income in Flowood with $189,569 per family, while 2-person families (1,409 | 51.7%) have the highest median income of $63,107 per family member.
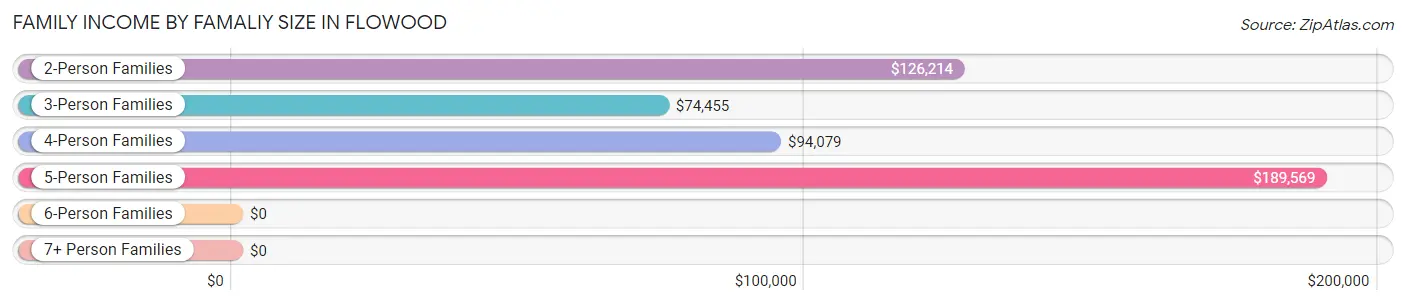
| Income Bracket | # Families | Median Income |
| 2-Person Families | 1,409 (51.7%) | $126,214 |
| 3-Person Families | 380 (14.0%) | $74,455 |
| 4-Person Families | 694 (25.5%) | $94,079 |
| 5-Person Families | 96 (3.5%) | $189,569 |
| 6-Person Families | 124 (4.5%) | $0 |
| 7+ Person Families | 20 (0.7%) | $0 |
| Total | 2,723 (100.0%) | $114,526 |
Family Income by Number of Earners in Flowood
The median family income in Flowood is $114,526, with families comprising 3+ earners (74) having the highest median family income of $174,024, while families with no earners (128) have the lowest median family income of $72,750, accounting for 2.7% and 4.7% of families, respectively.
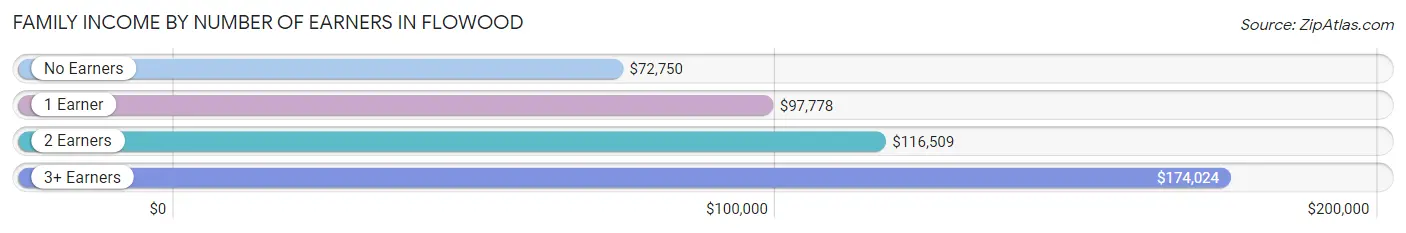
| Number of Earners | # Families | Median Income |
| No Earners | 128 (4.7%) | $72,750 |
| 1 Earner | 932 (34.2%) | $97,778 |
| 2 Earners | 1,589 (58.4%) | $116,509 |
| 3+ Earners | 74 (2.7%) | $174,024 |
| Total | 2,723 (100.0%) | $114,526 |
Household Income in Flowood
Household Income Brackets in Flowood
With 806 households falling in the category, the $100,000 to $149,999 income range is the most frequent in Flowood, accounting for 19.8% of all households. In contrast, only 167 households (4.1%) fall into the $15,000 to $24,999 income bracket, making it the least populous group.
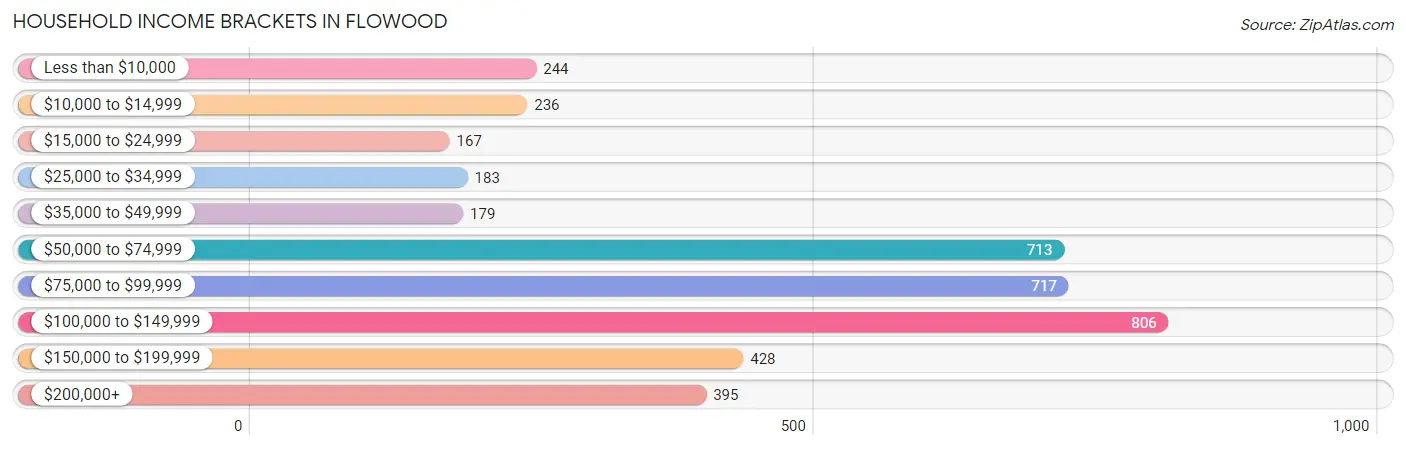
| Income Bracket | # Households | % Households |
| Less than $10,000 | 244 | 6.0% |
| $10,000 to $14,999 | 236 | 5.8% |
| $15,000 to $24,999 | 167 | 4.1% |
| $25,000 to $34,999 | 183 | 4.5% |
| $35,000 to $49,999 | 179 | 4.4% |
| $50,000 to $74,999 | 713 | 17.5% |
| $75,000 to $99,999 | 717 | 17.6% |
| $100,000 to $149,999 | 806 | 19.8% |
| $150,000 to $199,999 | 428 | 10.5% |
| $200,000+ | 395 | 9.7% |
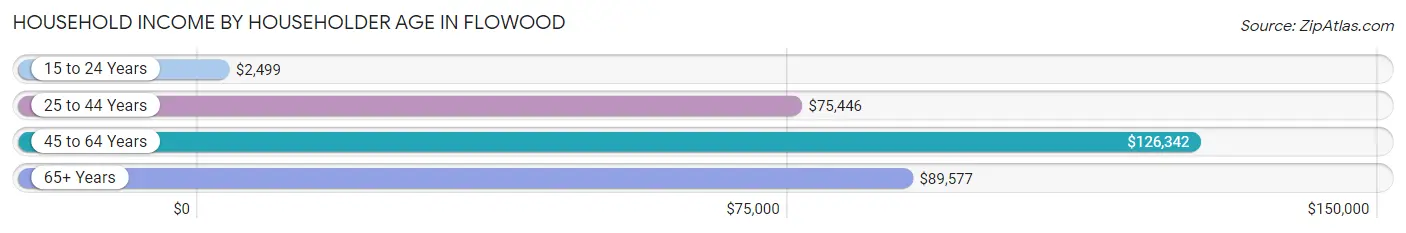
Household Income by Householder Age in Flowood
The median household income in Flowood is $89,144, with the highest median household income of $126,342 found in the 45 to 64 years age bracket for the primary householder. A total of 1,441 households (35.4%) fall into this category. Meanwhile, the 15 to 24 years age bracket for the primary householder has the lowest median household income of $2,499, with 219 households (5.4%) in this group.
| Income Bracket | # Households | Median Income |
| 15 to 24 Years | 219 (5.4%) | $2,499 |
| 25 to 44 Years | 1,633 (40.1%) | $75,446 |
| 45 to 64 Years | 1,441 (35.4%) | $126,342 |
| 65+ Years | 780 (19.2%) | $89,577 |
| Total | 4,073 (100.0%) | $89,144 |
Poverty in Flowood
Income Below Poverty by Sex and Age in Flowood
With 11.1% poverty level for males and 19.2% for females among the residents of Flowood, 5 year old males and 5 year old females are the most vulnerable to poverty, with 28 males (49.1%) and 106 females (89.8%) in their respective age groups living below the poverty level.
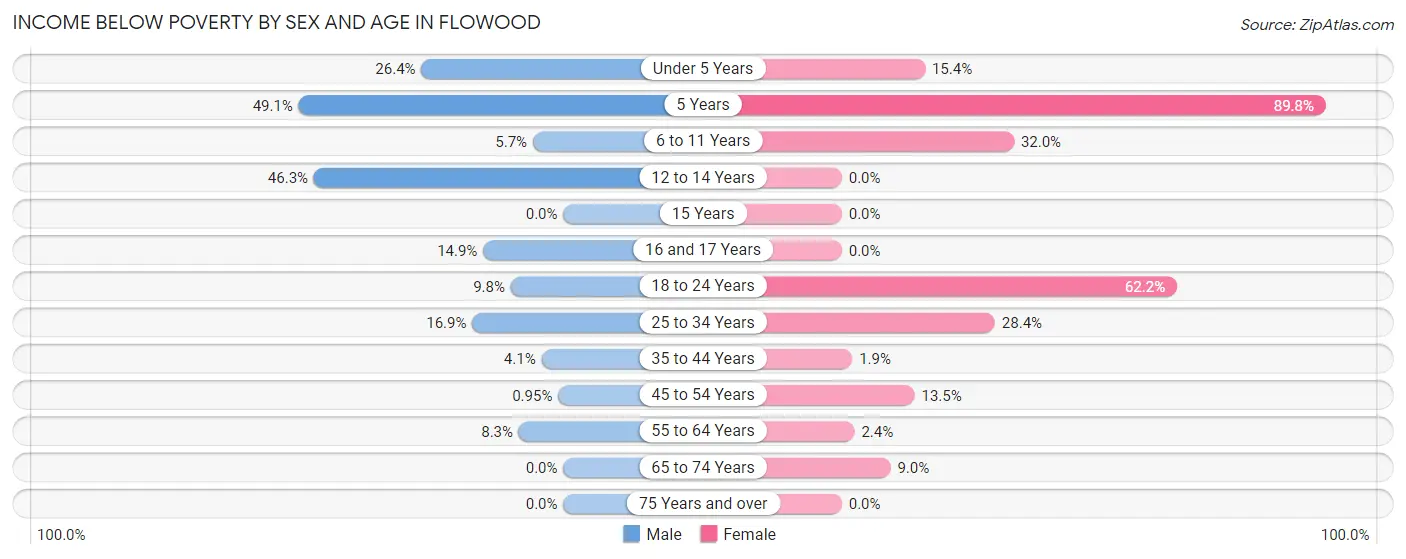
| Age Bracket | Male | Female |
| Under 5 Years | 132 (26.4%) | 42 (15.4%) |
| 5 Years | 28 (49.1%) | 106 (89.8%) |
| 6 to 11 Years | 14 (5.7%) | 255 (32.0%) |
| 12 to 14 Years | 75 (46.3%) | 0 (0.0%) |
| 15 Years | 0 (0.0%) | 0 (0.0%) |
| 16 and 17 Years | 18 (14.9%) | 0 (0.0%) |
| 18 to 24 Years | 20 (9.8%) | 270 (62.2%) |
| 25 to 34 Years | 134 (16.9%) | 249 (28.4%) |
| 35 to 44 Years | 28 (4.1%) | 15 (1.9%) |
| 45 to 54 Years | 8 (0.9%) | 83 (13.5%) |
| 55 to 64 Years | 37 (8.3%) | 16 (2.4%) |
| 65 to 74 Years | 0 (0.0%) | 44 (9.0%) |
| 75 Years and over | 0 (0.0%) | 0 (0.0%) |
| Total | 494 (11.1%) | 1,080 (19.2%) |
Income Above Poverty by Sex and Age in Flowood
According to the poverty statistics in Flowood, males aged 15 years and females aged 12 to 14 years are the age groups that are most secure financially, with 100.0% of males and 100.0% of females in these age groups living above the poverty line.
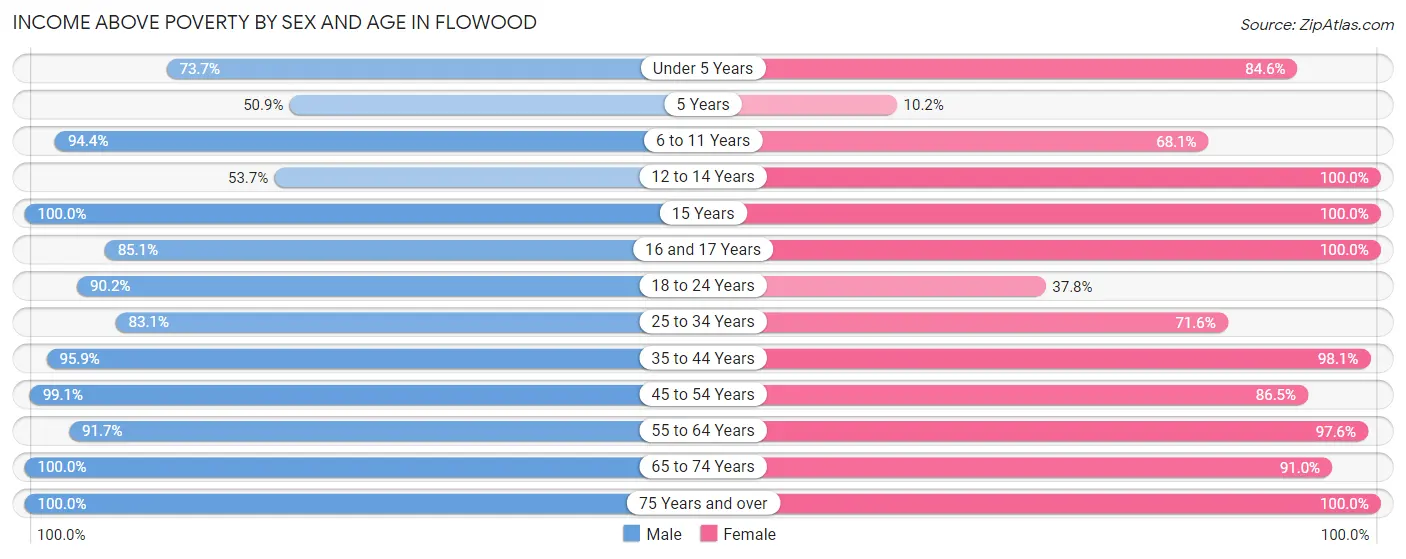
| Age Bracket | Male | Female |
| Under 5 Years | 369 (73.7%) | 230 (84.6%) |
| 5 Years | 29 (50.9%) | 12 (10.2%) |
| 6 to 11 Years | 234 (94.4%) | 543 (68.0%) |
| 12 to 14 Years | 87 (53.7%) | 285 (100.0%) |
| 15 Years | 23 (100.0%) | 27 (100.0%) |
| 16 and 17 Years | 103 (85.1%) | 18 (100.0%) |
| 18 to 24 Years | 185 (90.2%) | 164 (37.8%) |
| 25 to 34 Years | 659 (83.1%) | 627 (71.6%) |
| 35 to 44 Years | 662 (95.9%) | 760 (98.1%) |
| 45 to 54 Years | 833 (99.1%) | 532 (86.5%) |
| 55 to 64 Years | 411 (91.7%) | 662 (97.6%) |
| 65 to 74 Years | 206 (100.0%) | 443 (91.0%) |
| 75 Years and over | 157 (100.0%) | 236 (100.0%) |
| Total | 3,958 (88.9%) | 4,539 (80.8%) |
Income Below Poverty Among Married-Couple Families in Flowood
| Children | Above Poverty | Below Poverty |
| No Children | 1,076 (100.0%) | 0 (0.0%) |
| 1 or 2 Children | 829 (100.0%) | 0 (0.0%) |
| 3 or 4 Children | 106 (100.0%) | 0 (0.0%) |
| 5 or more Children | 0 (0.0%) | 0 (0.0%) |
| Total | 2,011 (100.0%) | 0 (0.0%) |
Income Below Poverty Among Single-Parent Households in Flowood
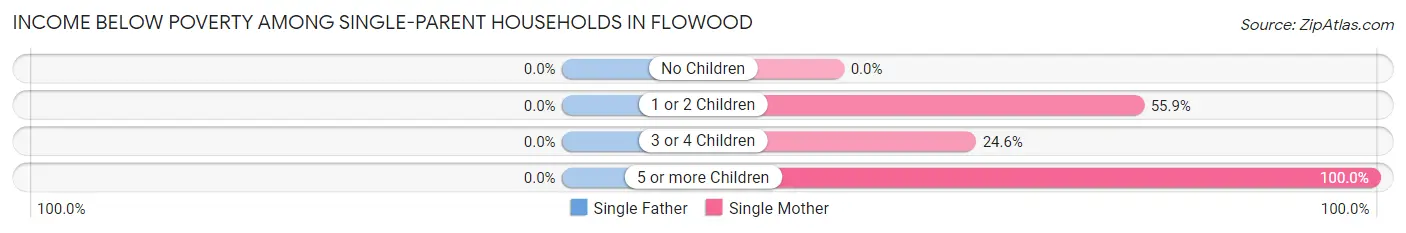
| Children | Single Father | Single Mother |
| No Children | 0 (0.0%) | 0 (0.0%) |
| 1 or 2 Children | 0 (0.0%) | 57 (55.9%) |
| 3 or 4 Children | 0 (0.0%) | 15 (24.6%) |
| 5 or more Children | 0 (0.0%) | 124 (100.0%) |
| Total | 0 (0.0%) | 196 (33.4%) |
Income Below Poverty Among Married-Couple vs Single-Parent Households in Flowood
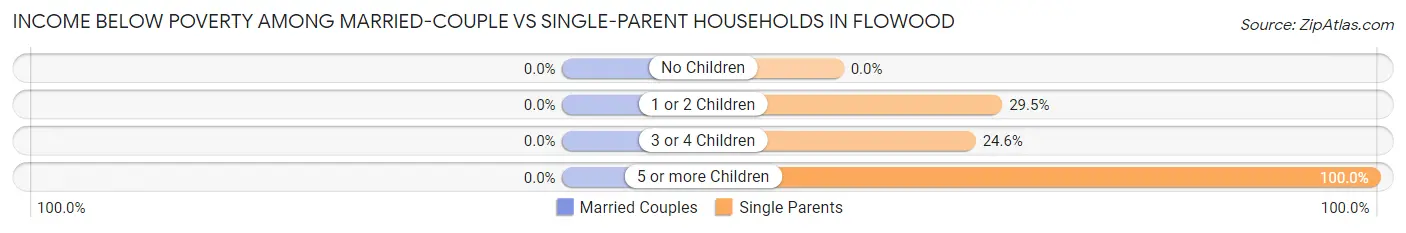
| Children | Married-Couple Families | Single-Parent Households |
| No Children | 0 (0.0%) | 0 (0.0%) |
| 1 or 2 Children | 0 (0.0%) | 57 (29.5%) |
| 3 or 4 Children | 0 (0.0%) | 15 (24.6%) |
| 5 or more Children | 0 (0.0%) | 124 (100.0%) |
| Total | 0 (0.0%) | 196 (27.5%) |
Race in Flowood
The most populous races in Flowood are White / Caucasian (6,574 | 64.4%), Black / African American (2,548 | 25.0%), and Asian (641 | 6.3%).
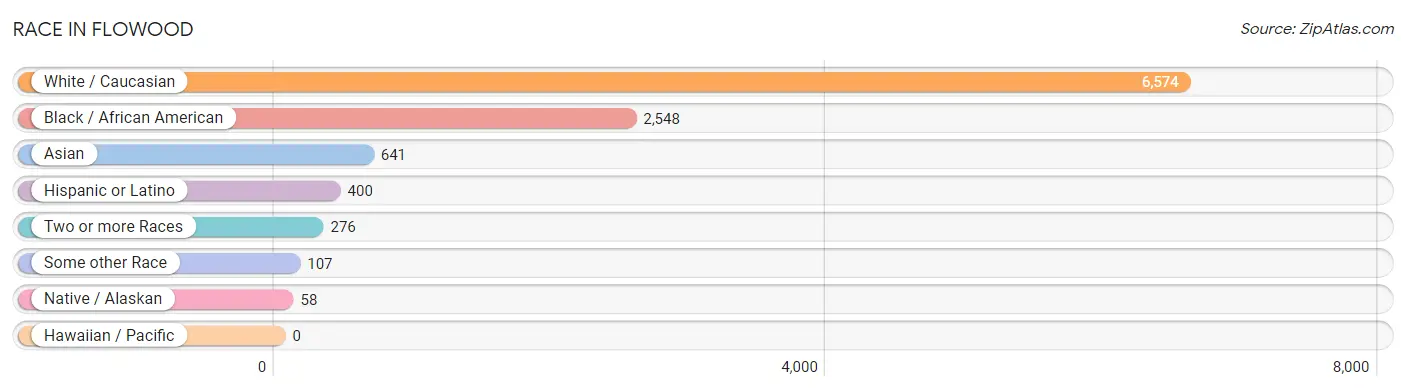
| Race | # Population | % Population |
| Asian | 641 | 6.3% |
| Black / African American | 2,548 | 25.0% |
| Hawaiian / Pacific | 0 | 0.0% |
| Hispanic or Latino | 400 | 3.9% |
| Native / Alaskan | 58 | 0.6% |
| White / Caucasian | 6,574 | 64.4% |
| Two or more Races | 276 | 2.7% |
| Some other Race | 107 | 1.1% |
| Total | 10,204 | 100.0% |
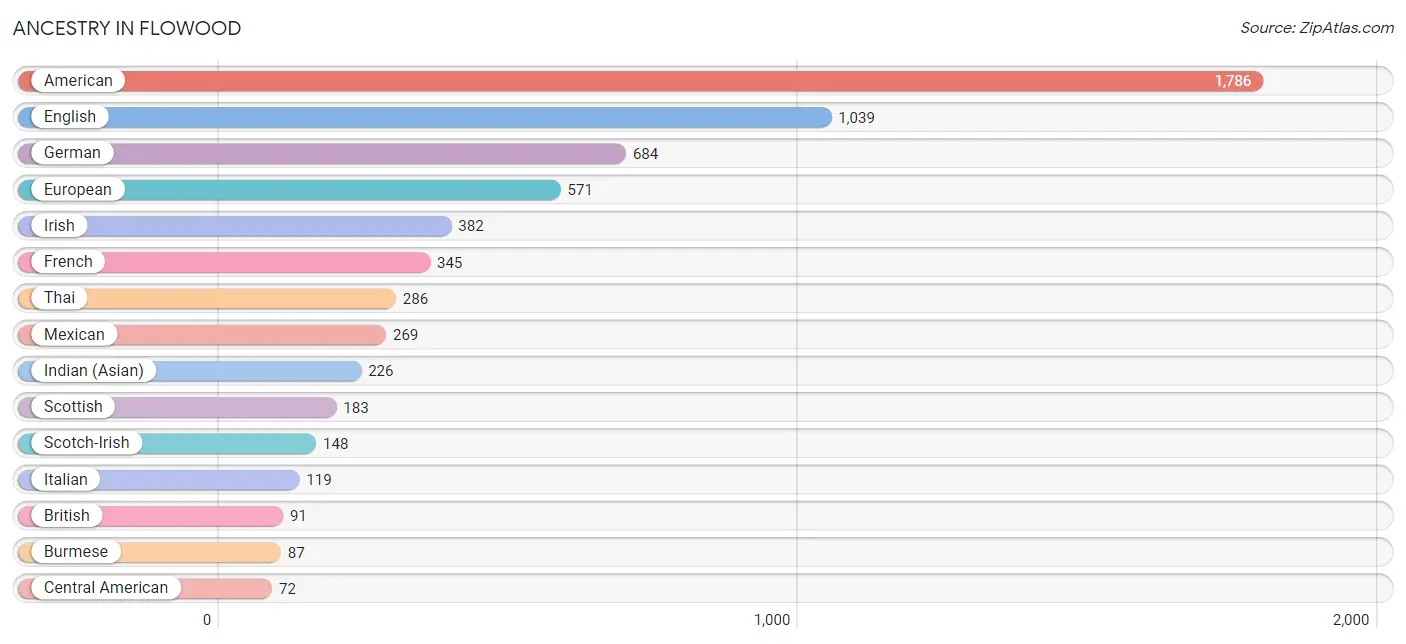
Ancestry in Flowood
The most populous ancestries reported in Flowood are American (1,786 | 17.5%), English (1,039 | 10.2%), German (684 | 6.7%), European (571 | 5.6%), and Irish (382 | 3.7%), together accounting for 43.7% of all Flowood residents.
| Ancestry | # Population | % Population |
| African | 7 | 0.1% |
| American | 1,786 | 17.5% |
| Arab | 26 | 0.3% |
| Bhutanese | 42 | 0.4% |
| British | 91 | 0.9% |
| Burmese | 87 | 0.9% |
| Cajun | 2 | 0.0% |
| Canadian | 47 | 0.5% |
| Central American | 72 | 0.7% |
| Cherokee | 9 | 0.1% |
| Colombian | 18 | 0.2% |
| Dutch | 4 | 0.0% |
| English | 1,039 | 10.2% |
| European | 571 | 5.6% |
| French | 345 | 3.4% |
| German | 684 | 6.7% |
| Greek | 38 | 0.4% |
| Guatemalan | 72 | 0.7% |
| Indian (Asian) | 226 | 2.2% |
| Irish | 382 | 3.7% |
| Italian | 119 | 1.2% |
| Korean | 6 | 0.1% |
| Mexican | 269 | 2.6% |
| Northern European | 30 | 0.3% |
| Palestinian | 26 | 0.3% |
| Polish | 46 | 0.4% |
| Portuguese | 9 | 0.1% |
| Puerto Rican | 7 | 0.1% |
| Russian | 42 | 0.4% |
| Scotch-Irish | 148 | 1.5% |
| Scottish | 183 | 1.8% |
| Sioux | 48 | 0.5% |
| South African | 7 | 0.1% |
| South American | 21 | 0.2% |
| Spanish | 31 | 0.3% |
| Sri Lankan | 32 | 0.3% |
| Subsaharan African | 14 | 0.1% |
| Swedish | 68 | 0.7% |
| Thai | 286 | 2.8% |
| Ukrainian | 36 | 0.4% |
| Venezuelan | 3 | 0.0% |
| Welsh | 32 | 0.3% | View All 42 Rows |
Immigrants in Flowood
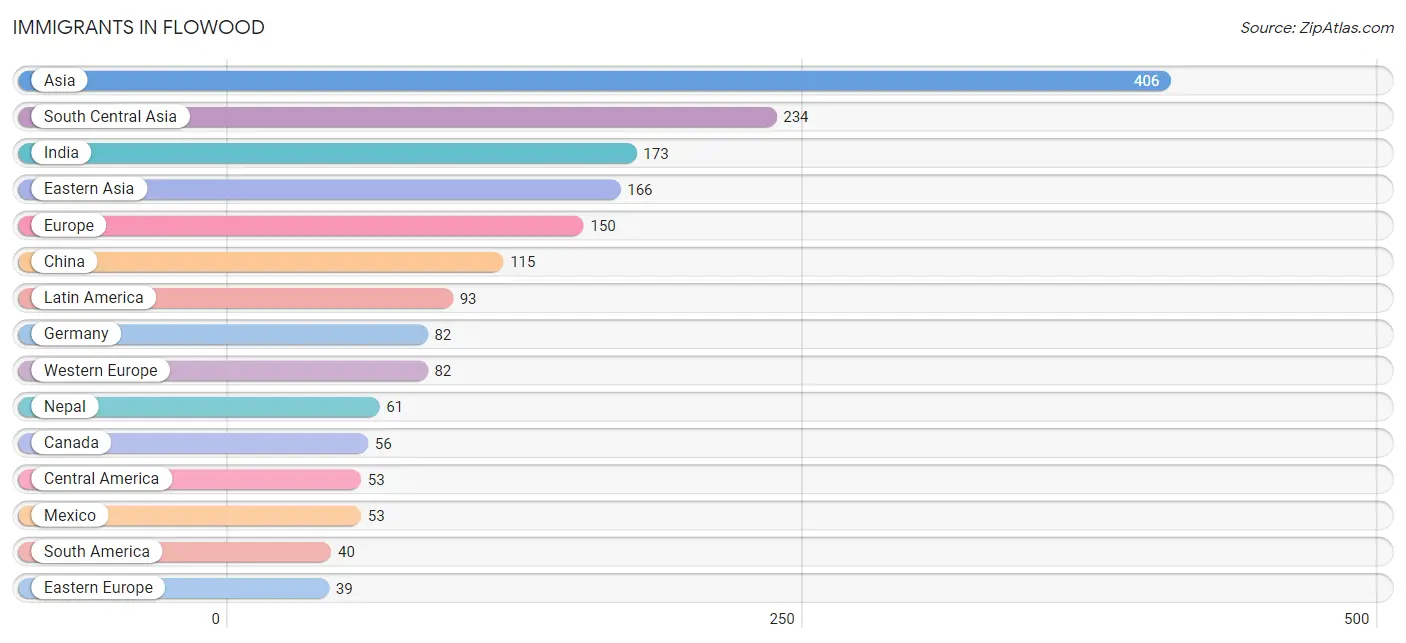
The most numerous immigrant groups reported in Flowood came from Asia (406 | 4.0%), South Central Asia (234 | 2.3%), India (173 | 1.7%), Eastern Asia (166 | 1.6%), and Europe (150 | 1.5%), together accounting for 11.1% of all Flowood residents.
| Immigration Origin | # Population | % Population |
| Africa | 7 | 0.1% |
| Asia | 406 | 4.0% |
| Brazil | 22 | 0.2% |
| Canada | 56 | 0.5% |
| Central America | 53 | 0.5% |
| China | 115 | 1.1% |
| Colombia | 18 | 0.2% |
| Eastern Asia | 166 | 1.6% |
| Eastern Europe | 39 | 0.4% |
| England | 29 | 0.3% |
| Europe | 150 | 1.5% |
| Germany | 82 | 0.8% |
| India | 173 | 1.7% |
| Japan | 13 | 0.1% |
| Korea | 38 | 0.4% |
| Latin America | 93 | 0.9% |
| Mexico | 53 | 0.5% |
| Nepal | 61 | 0.6% |
| Northern Europe | 29 | 0.3% |
| Philippines | 6 | 0.1% |
| Russia | 20 | 0.2% |
| South Africa | 7 | 0.1% |
| South America | 40 | 0.4% |
| South Central Asia | 234 | 2.3% |
| South Eastern Asia | 6 | 0.1% |
| Ukraine | 19 | 0.2% |
| Western Europe | 82 | 0.8% | View All 27 Rows |
Sex and Age in Flowood
Sex and Age in Flowood
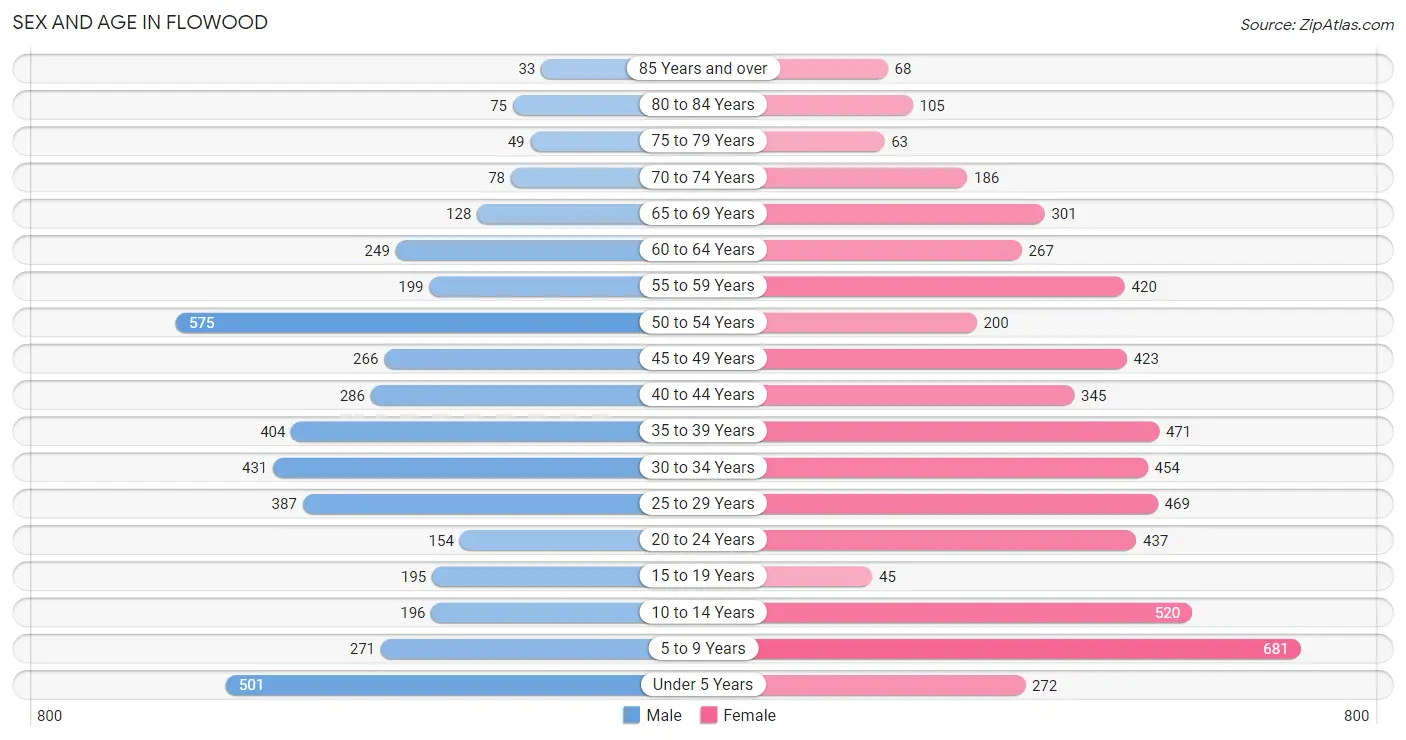
The most populous age groups in Flowood are 50 to 54 Years (575 | 12.8%) for men and 5 to 9 Years (681 | 11.9%) for women.
| Age Bracket | Male | Female |
| Under 5 Years | 501 (11.2%) | 272 (4.8%) |
| 5 to 9 Years | 271 (6.0%) | 681 (11.9%) |
| 10 to 14 Years | 196 (4.4%) | 520 (9.1%) |
| 15 to 19 Years | 195 (4.4%) | 45 (0.8%) |
| 20 to 24 Years | 154 (3.4%) | 437 (7.6%) |
| 25 to 29 Years | 387 (8.6%) | 469 (8.2%) |
| 30 to 34 Years | 431 (9.6%) | 454 (7.9%) |
| 35 to 39 Years | 404 (9.0%) | 471 (8.2%) |
| 40 to 44 Years | 286 (6.4%) | 345 (6.0%) |
| 45 to 49 Years | 266 (5.9%) | 423 (7.4%) |
| 50 to 54 Years | 575 (12.8%) | 200 (3.5%) |
| 55 to 59 Years | 199 (4.4%) | 420 (7.3%) |
| 60 to 64 Years | 249 (5.6%) | 267 (4.7%) |
| 65 to 69 Years | 128 (2.9%) | 301 (5.3%) |
| 70 to 74 Years | 78 (1.7%) | 186 (3.3%) |
| 75 to 79 Years | 49 (1.1%) | 63 (1.1%) |
| 80 to 84 Years | 75 (1.7%) | 105 (1.8%) |
| 85 Years and over | 33 (0.7%) | 68 (1.2%) |
| Total | 4,477 (100.0%) | 5,727 (100.0%) |
Families and Households in Flowood
Median Family Size in Flowood
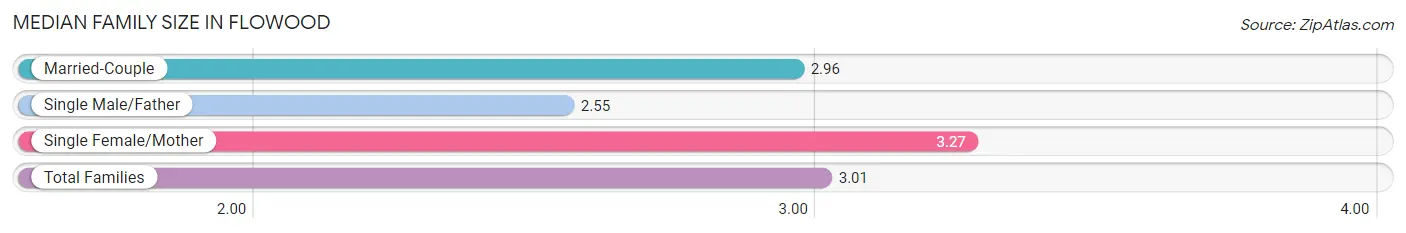
The median family size in Flowood is 3.01 persons per family, with single female/mother families (587 | 21.6%) accounting for the largest median family size of 3.27 persons per family. On the other hand, single male/father families (125 | 4.6%) represent the smallest median family size with 2.55 persons per family.
| Family Type | # Families | Family Size |
| Married-Couple | 2,011 (73.9%) | 2.96 |
| Single Male/Father | 125 (4.6%) | 2.55 |
| Single Female/Mother | 587 (21.6%) | 3.27 |
| Total Families | 2,723 (100.0%) | 3.01 |
Median Household Size in Flowood
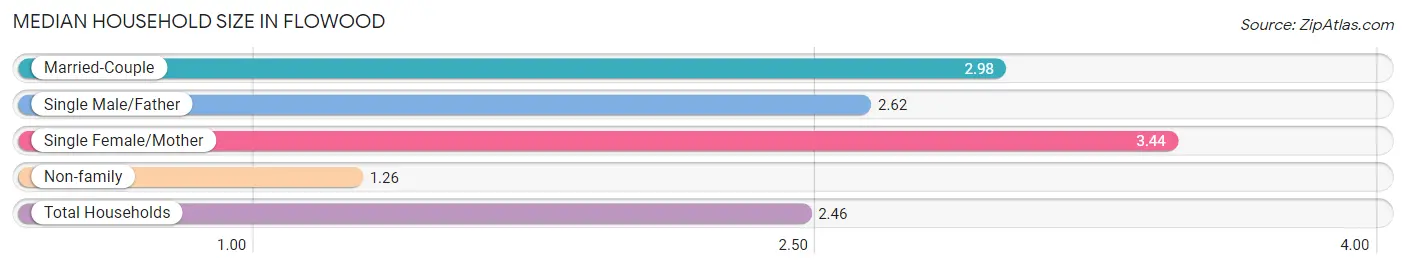
The median household size in Flowood is 2.46 persons per household, with single female/mother households (587 | 14.4%) accounting for the largest median household size of 3.44 persons per household. non-family households (1,350 | 33.2%) represent the smallest median household size with 1.26 persons per household.
| Household Type | # Households | Household Size |
| Married-Couple | 2,011 (49.4%) | 2.98 |
| Single Male/Father | 125 (3.1%) | 2.62 |
| Single Female/Mother | 587 (14.4%) | 3.44 |
| Non-family | 1,350 (33.2%) | 1.26 |
| Total Households | 4,073 (100.0%) | 2.46 |
Household Size by Marriage Status in Flowood
Out of a total of 4,073 households in Flowood, 2,723 (66.8%) are family households, while 1,350 (33.2%) are nonfamily households. The most numerous type of family households are 2-person households, comprising 1,376, and the most common type of nonfamily households are 1-person households, comprising 1,019.
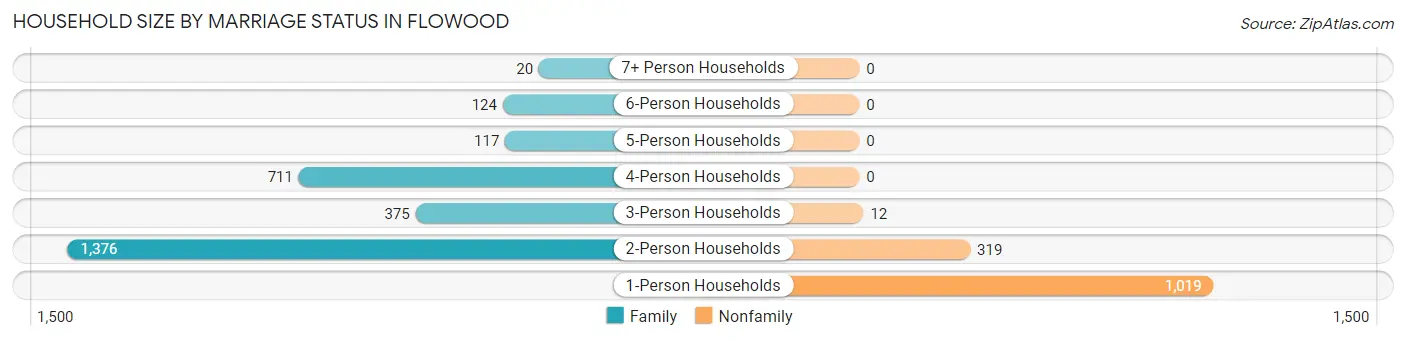
| Household Size | Family Households | Nonfamily Households |
| 1-Person Households | - | 1,019 (25.0%) |
| 2-Person Households | 1,376 (33.8%) | 319 (7.8%) |
| 3-Person Households | 375 (9.2%) | 12 (0.3%) |
| 4-Person Households | 711 (17.5%) | 0 (0.0%) |
| 5-Person Households | 117 (2.9%) | 0 (0.0%) |
| 6-Person Households | 124 (3.0%) | 0 (0.0%) |
| 7+ Person Households | 20 (0.5%) | 0 (0.0%) |
| Total | 2,723 (66.8%) | 1,350 (33.2%) |
Female Fertility in Flowood
Fertility by Age in Flowood
Average fertility rate in Flowood is 44.0 births per 1,000 women. Women in the age bracket of 15 to 19 years have the highest fertility rate with 156.0 births per 1,000 women. Women in the age bracket of 35 to 50 years acount for 63.9% of all women with births.
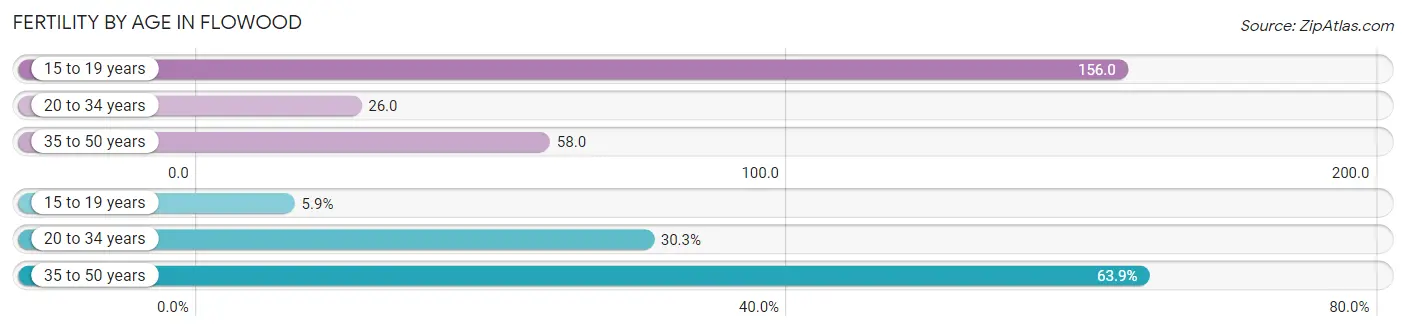
| Age Bracket | Women with Births | Births / 1,000 Women |
| 15 to 19 years | 7 (5.9%) | 156.0 |
| 20 to 34 years | 36 (30.2%) | 26.0 |
| 35 to 50 years | 76 (63.9%) | 58.0 |
| Total | 119 (100.0%) | 44.0 |
Fertility by Age by Marriage Status in Flowood
94.1% of women with births (119) in Flowood are married. The highest percentage of unmarried women with births falls into 15 to 19 years age bracket with 100.0% of them unmarried at the time of birth, while the lowest percentage of unmarried women with births belong to 20 to 34 years age bracket with 0.0% of them unmarried.
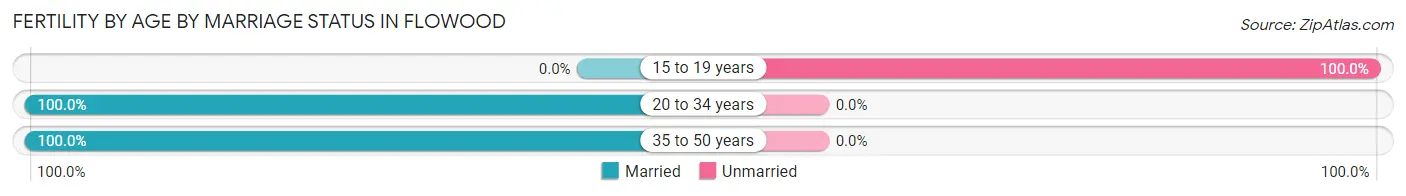
| Age Bracket | Married | Unmarried |
| 15 to 19 years | 0 (0.0%) | 7 (100.0%) |
| 20 to 34 years | 36 (100.0%) | 0 (0.0%) |
| 35 to 50 years | 76 (100.0%) | 0 (0.0%) |
| Total | 112 (94.1%) | 7 (5.9%) |
Fertility by Education in Flowood
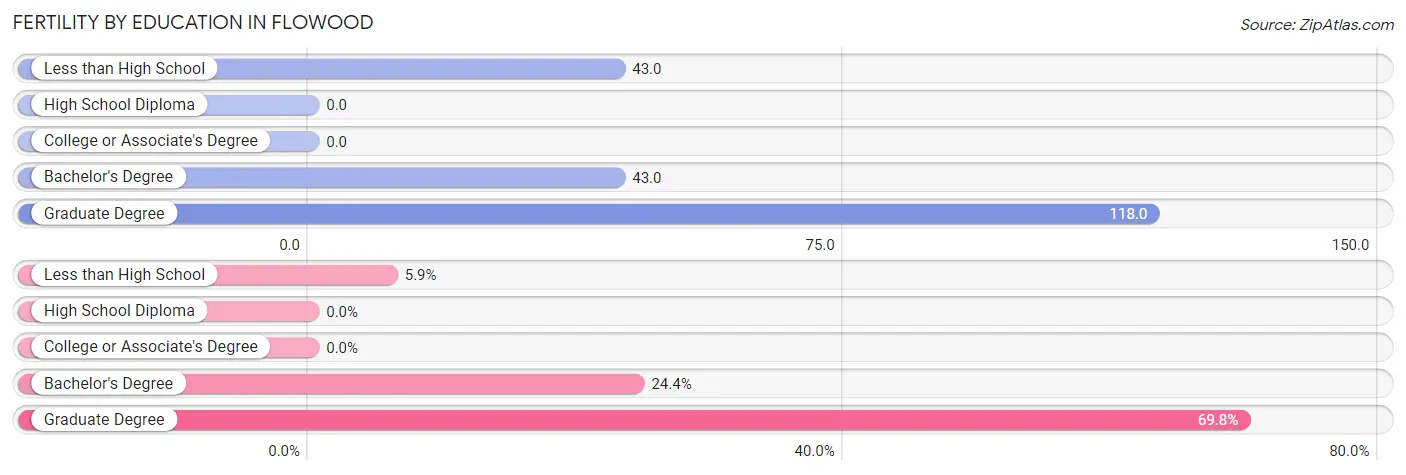
| Educational Attainment | Women with Births | Births / 1,000 Women |
| Less than High School | 7 (5.9%) | 43.0 |
| High School Diploma | 0 (0.0%) | 0.0 |
| College or Associate's Degree | 0 (0.0%) | 0.0 |
| Bachelor's Degree | 29 (24.4%) | 43.0 |
| Graduate Degree | 83 (69.8%) | 118.0 |
| Total | 119 (100.0%) | 44.0 |
Fertility by Education by Marriage Status in Flowood
5.9% of women with births in Flowood are unmarried. Women with the educational attainment of bachelor's degree are most likely to be married with 100.0% of them married at childbirth, while women with the educational attainment of less than high school are least likely to be married with 100.0% of them unmarried at childbirth.
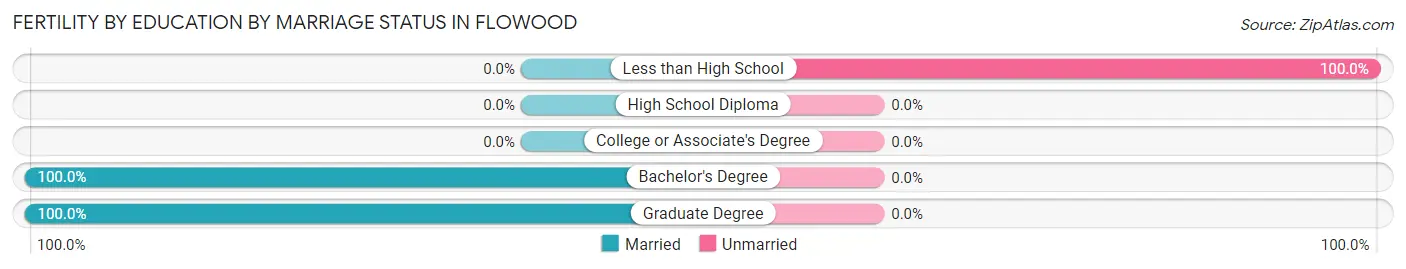
| Educational Attainment | Married | Unmarried |
| Less than High School | 0 (0.0%) | 7 (100.0%) |
| High School Diploma | 0 (0.0%) | 0 (0.0%) |
| College or Associate's Degree | 0 (0.0%) | 0 (0.0%) |
| Bachelor's Degree | 29 (100.0%) | 0 (0.0%) |
| Graduate Degree | 83 (100.0%) | 0 (0.0%) |
| Total | 112 (94.1%) | 7 (5.9%) |
Employment Characteristics in Flowood
Employment by Class of Employer in Flowood
Among the 5,224 employed individuals in Flowood, private company employees (2,760 | 52.8%), state government employees (996 | 19.1%), and federal government employees (435 | 8.3%) make up the most common classes of employment.
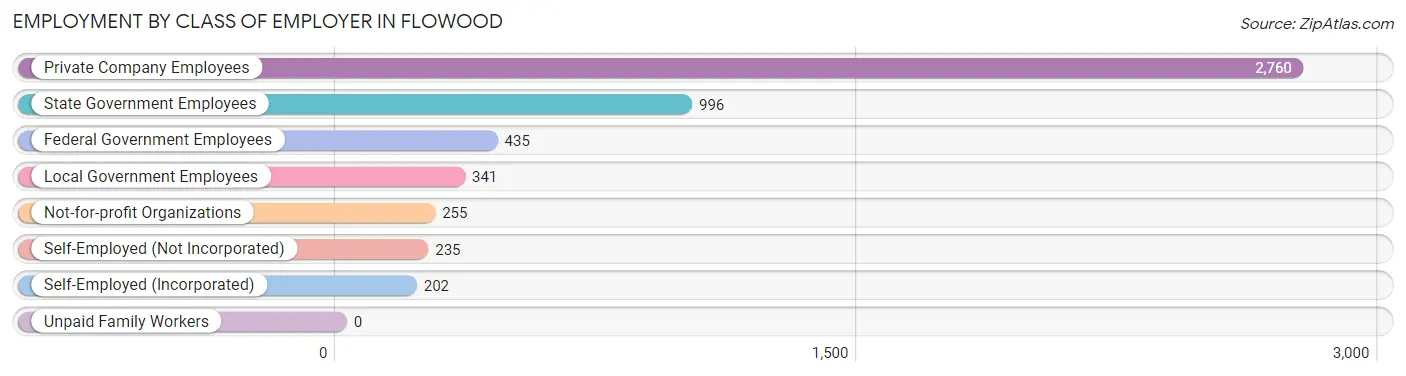
| Employer Class | # Employees | % Employees |
| Private Company Employees | 2,760 | 52.8% |
| Self-Employed (Incorporated) | 202 | 3.9% |
| Self-Employed (Not Incorporated) | 235 | 4.5% |
| Not-for-profit Organizations | 255 | 4.9% |
| Local Government Employees | 341 | 6.5% |
| State Government Employees | 996 | 19.1% |
| Federal Government Employees | 435 | 8.3% |
| Unpaid Family Workers | 0 | 0.0% |
| Total | 5,224 | 100.0% |
Employment Status by Age in Flowood
According to the labor force statistics for Flowood, out of the total population over 16 years of age (7,713), 71.4% or 5,507 individuals are in the labor force, with 4.6% or 253 of them unemployed. The age group with the highest labor force participation rate is 30 to 34 years, with 91.8% or 812 individuals in the labor force. Within the labor force, the 25 to 29 years age range has the highest percentage of unemployed individuals, with 20.5% or 138 of them being unemployed.
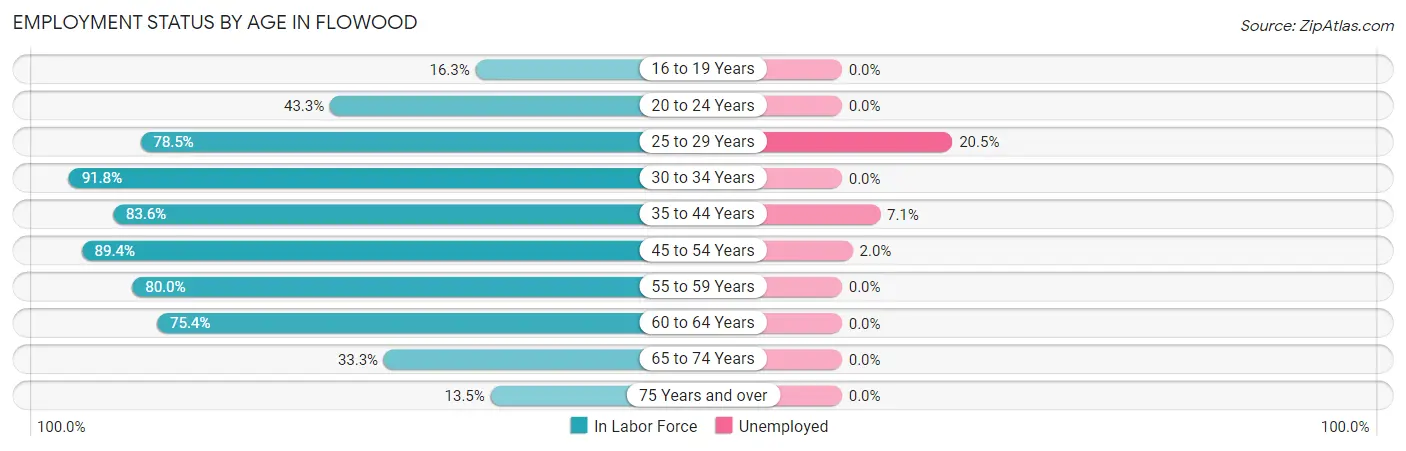
| Age Bracket | In Labor Force | Unemployed |
| 16 to 19 Years | 31 (16.3%) | 0 (0.0%) |
| 20 to 24 Years | 256 (43.3%) | 0 (0.0%) |
| 25 to 29 Years | 672 (78.5%) | 138 (20.5%) |
| 30 to 34 Years | 812 (91.8%) | 0 (0.0%) |
| 35 to 44 Years | 1,259 (83.6%) | 89 (7.1%) |
| 45 to 54 Years | 1,309 (89.4%) | 26 (2.0%) |
| 55 to 59 Years | 495 (80.0%) | 0 (0.0%) |
| 60 to 64 Years | 389 (75.4%) | 0 (0.0%) |
| 65 to 74 Years | 231 (33.3%) | 0 (0.0%) |
| 75 Years and over | 53 (13.5%) | 0 (0.0%) |
| Total | 5,507 (71.4%) | 253 (4.6%) |
Employment Status by Educational Attainment in Flowood
According to labor force statistics for Flowood, 84.4% of individuals (4,934) out of the total population between 25 and 64 years of age (5,846) are in the labor force, with 5.2% or 257 of them being unemployed. The group with the highest labor force participation rate are those with the educational attainment of college / associate degree, with 87.6% or 1,601 individuals in the labor force. Within the labor force, individuals with high school diploma education have the highest percentage of unemployment, with 7.0% or 44 of them being unemployed.
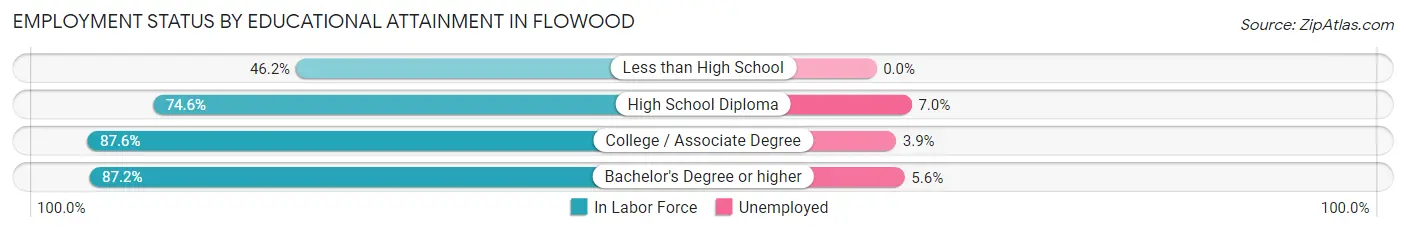
| Educational Attainment | In Labor Force | Unemployed |
| Less than High School | 72 (46.2%) | 0 (0.0%) |
| High School Diploma | 633 (74.6%) | 59 (7.0%) |
| College / Associate Degree | 1,601 (87.6%) | 71 (3.9%) |
| Bachelor's Degree or higher | 2,628 (87.2%) | 169 (5.6%) |
| Total | 4,934 (84.4%) | 304 (5.2%) |
Employment Occupations by Sex in Flowood
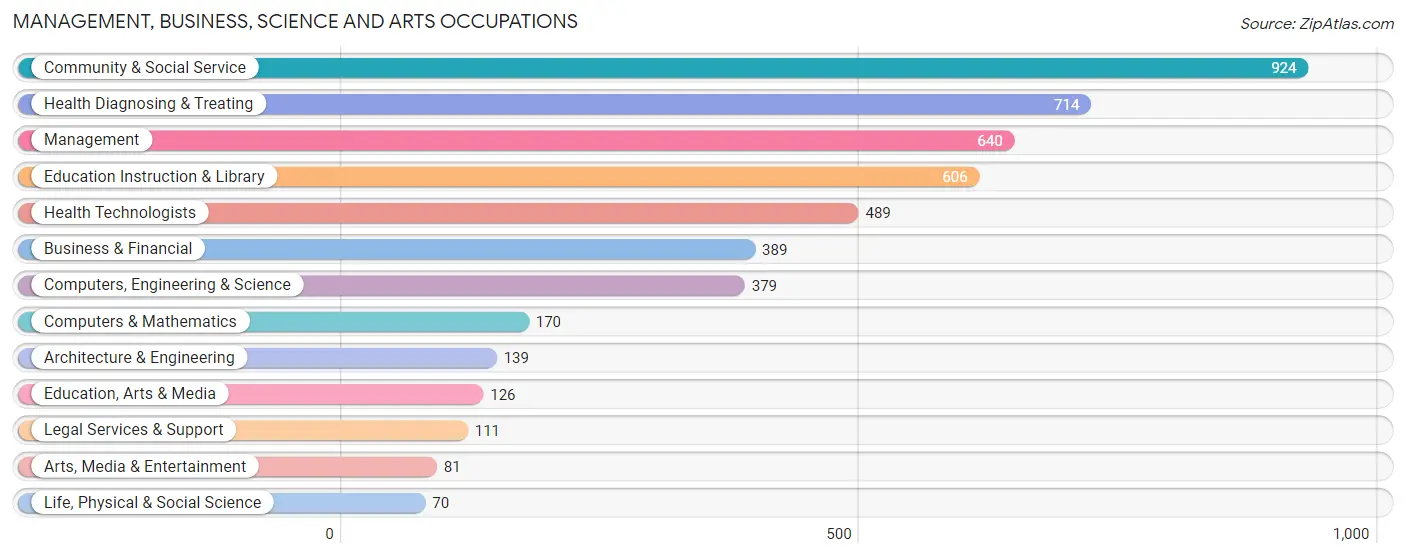
Management, Business, Science and Arts Occupations
The most common Management, Business, Science and Arts occupations in Flowood are Community & Social Service (924 | 17.7%), Health Diagnosing & Treating (714 | 13.7%), Management (640 | 12.3%), Education Instruction & Library (606 | 11.6%), and Health Technologists (489 | 9.4%).
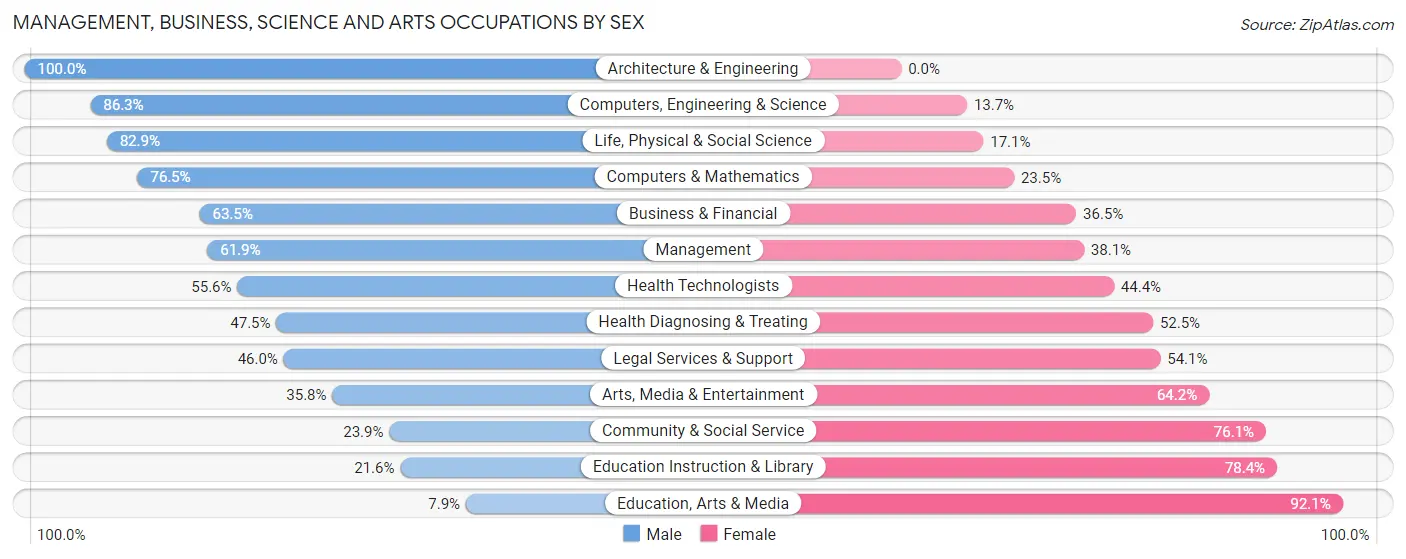
Management, Business, Science and Arts Occupations by Sex
Within the Management, Business, Science and Arts occupations in Flowood, the most male-oriented occupations are Architecture & Engineering (100.0%), Computers, Engineering & Science (86.3%), and Life, Physical & Social Science (82.9%), while the most female-oriented occupations are Education, Arts & Media (92.1%), Education Instruction & Library (78.4%), and Community & Social Service (76.1%).
| Occupation | Male | Female |
| Management | 396 (61.9%) | 244 (38.1%) |
| Business & Financial | 247 (63.5%) | 142 (36.5%) |
| Computers, Engineering & Science | 327 (86.3%) | 52 (13.7%) |
| Computers & Mathematics | 130 (76.5%) | 40 (23.5%) |
| Architecture & Engineering | 139 (100.0%) | 0 (0.0%) |
| Life, Physical & Social Science | 58 (82.9%) | 12 (17.1%) |
| Community & Social Service | 221 (23.9%) | 703 (76.1%) |
| Education, Arts & Media | 10 (7.9%) | 116 (92.1%) |
| Legal Services & Support | 51 (46.0%) | 60 (54.0%) |
| Education Instruction & Library | 131 (21.6%) | 475 (78.4%) |
| Arts, Media & Entertainment | 29 (35.8%) | 52 (64.2%) |
| Health Diagnosing & Treating | 339 (47.5%) | 375 (52.5%) |
| Health Technologists | 272 (55.6%) | 217 (44.4%) |
| Total (Category) | 1,530 (50.2%) | 1,516 (49.8%) |
| Total (Overall) | 2,804 (53.9%) | 2,402 (46.1%) |
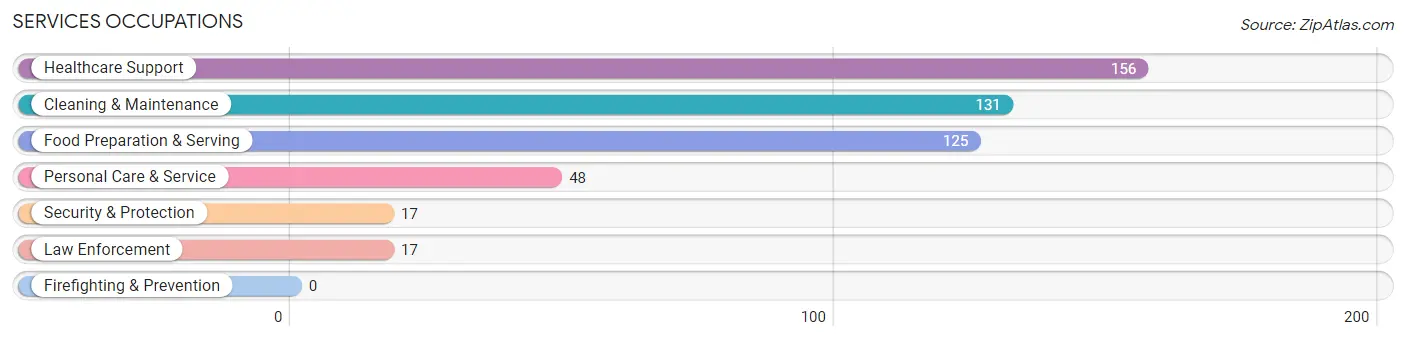
Services Occupations
The most common Services occupations in Flowood are Healthcare Support (156 | 3.0%), Cleaning & Maintenance (131 | 2.5%), Food Preparation & Serving (125 | 2.4%), Personal Care & Service (48 | 0.9%), and Security & Protection (17 | 0.3%).
Services Occupations by Sex
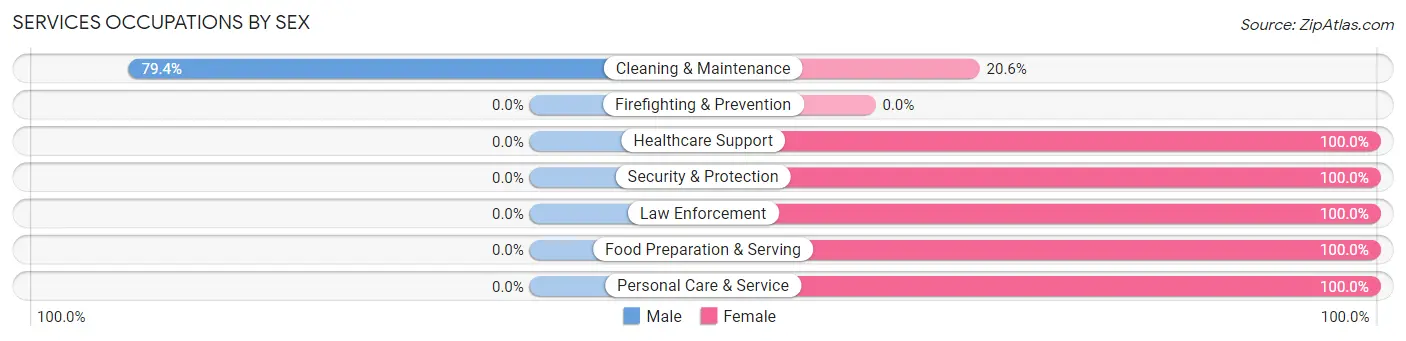
| Occupation | Male | Female |
| Healthcare Support | 0 (0.0%) | 156 (100.0%) |
| Security & Protection | 0 (0.0%) | 17 (100.0%) |
| Firefighting & Prevention | 0 (0.0%) | 0 (0.0%) |
| Law Enforcement | 0 (0.0%) | 17 (100.0%) |
| Food Preparation & Serving | 0 (0.0%) | 125 (100.0%) |
| Cleaning & Maintenance | 104 (79.4%) | 27 (20.6%) |
| Personal Care & Service | 0 (0.0%) | 48 (100.0%) |
| Total (Category) | 104 (21.8%) | 373 (78.2%) |
| Total (Overall) | 2,804 (53.9%) | 2,402 (46.1%) |
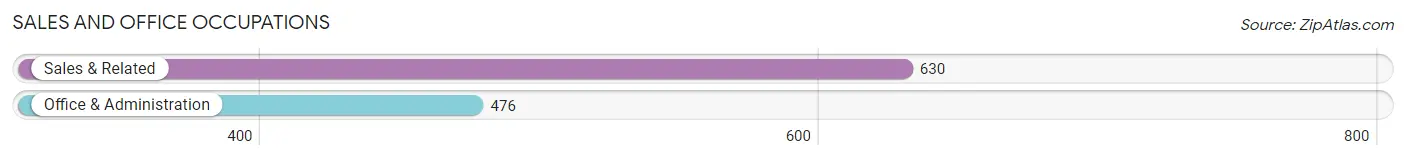
Sales and Office Occupations
The most common Sales and Office occupations in Flowood are Sales & Related (630 | 12.1%), and Office & Administration (476 | 9.1%).
Sales and Office Occupations by Sex
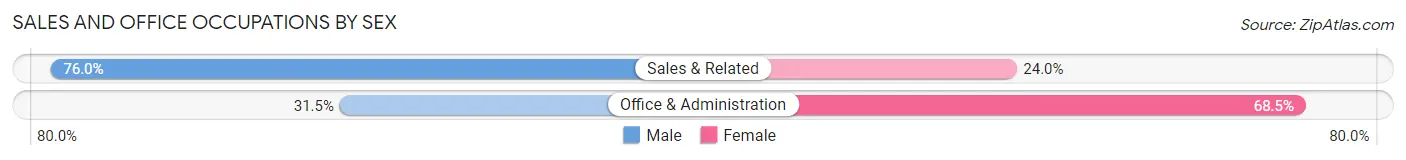
| Occupation | Male | Female |
| Sales & Related | 479 (76.0%) | 151 (24.0%) |
| Office & Administration | 150 (31.5%) | 326 (68.5%) |
| Total (Category) | 629 (56.9%) | 477 (43.1%) |
| Total (Overall) | 2,804 (53.9%) | 2,402 (46.1%) |
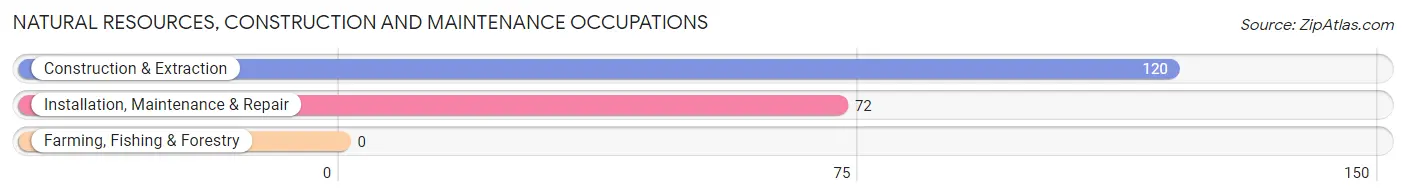
Natural Resources, Construction and Maintenance Occupations
The most common Natural Resources, Construction and Maintenance occupations in Flowood are Construction & Extraction (120 | 2.3%), and Installation, Maintenance & Repair (72 | 1.4%).
Natural Resources, Construction and Maintenance Occupations by Sex
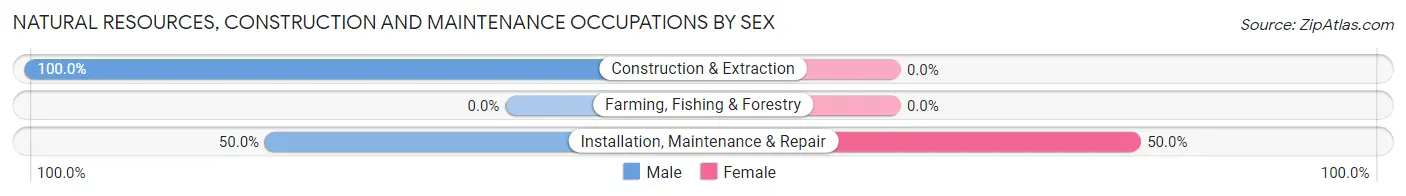
| Occupation | Male | Female |
| Farming, Fishing & Forestry | 0 (0.0%) | 0 (0.0%) |
| Construction & Extraction | 120 (100.0%) | 0 (0.0%) |
| Installation, Maintenance & Repair | 36 (50.0%) | 36 (50.0%) |
| Total (Category) | 156 (81.2%) | 36 (18.8%) |
| Total (Overall) | 2,804 (53.9%) | 2,402 (46.1%) |
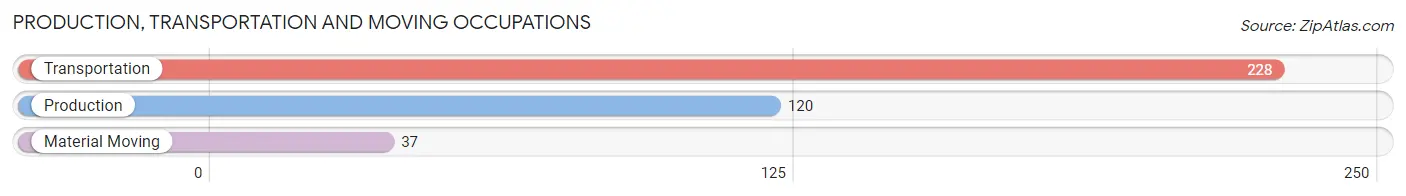
Production, Transportation and Moving Occupations
The most common Production, Transportation and Moving occupations in Flowood are Transportation (228 | 4.4%), Production (120 | 2.3%), and Material Moving (37 | 0.7%).
Production, Transportation and Moving Occupations by Sex
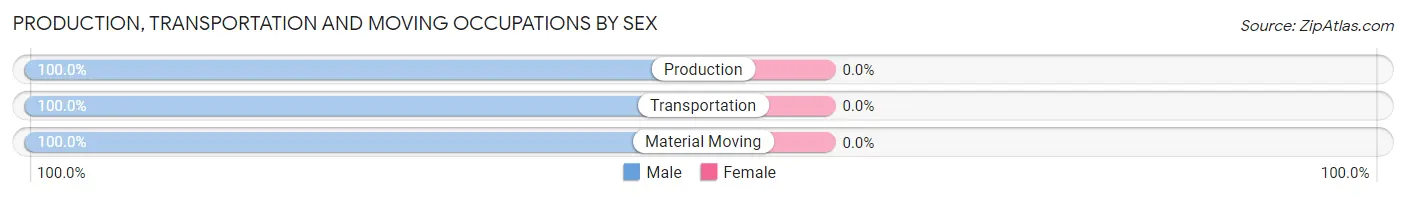
| Occupation | Male | Female |
| Production | 120 (100.0%) | 0 (0.0%) |
| Transportation | 228 (100.0%) | 0 (0.0%) |
| Material Moving | 37 (100.0%) | 0 (0.0%) |
| Total (Category) | 385 (100.0%) | 0 (0.0%) |
| Total (Overall) | 2,804 (53.9%) | 2,402 (46.1%) |
Employment Industries by Sex in Flowood
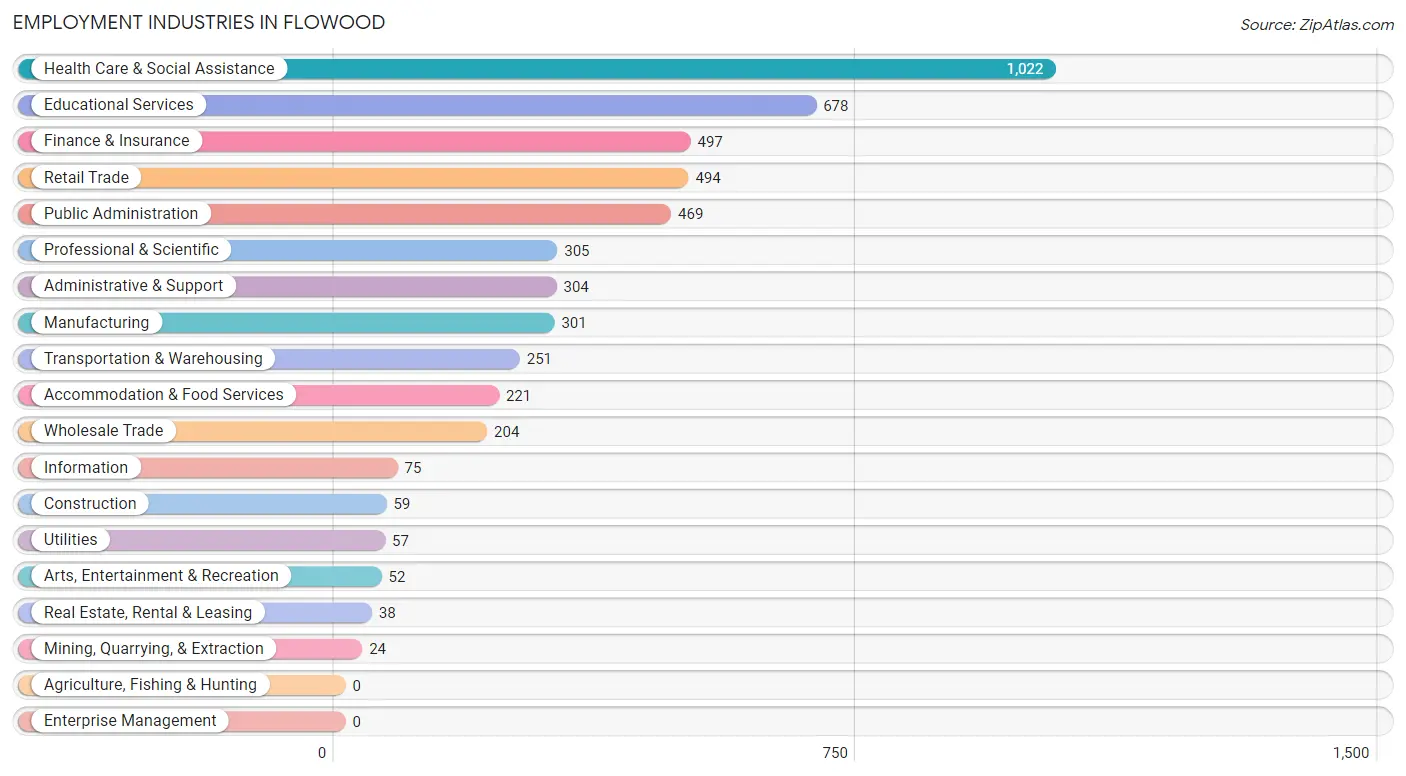
Employment Industries in Flowood
The major employment industries in Flowood include Health Care & Social Assistance (1,022 | 19.6%), Educational Services (678 | 13.0%), Finance & Insurance (497 | 9.6%), Retail Trade (494 | 9.5%), and Public Administration (469 | 9.0%).
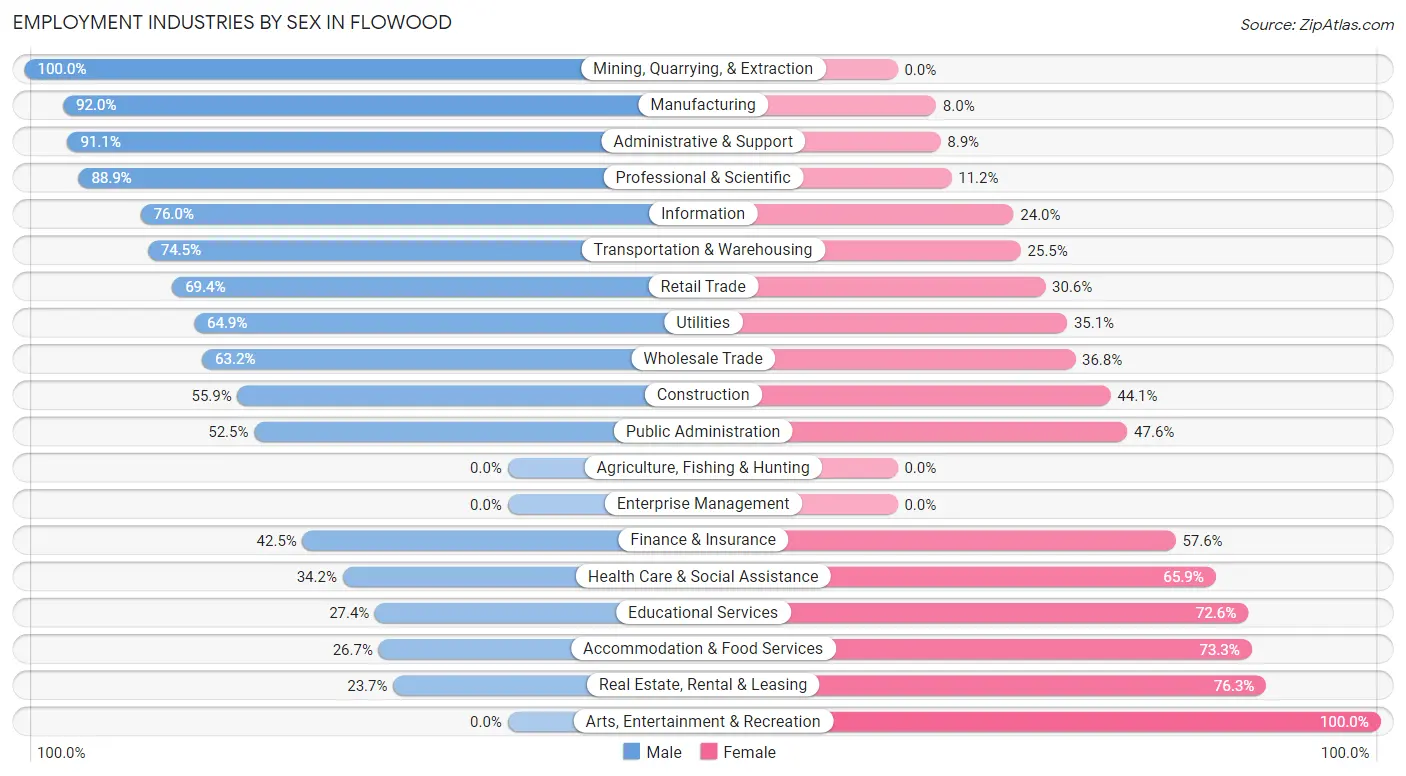
Employment Industries by Sex in Flowood
The Flowood industries that see more men than women are Mining, Quarrying, & Extraction (100.0%), Manufacturing (92.0%), and Administrative & Support (91.1%), whereas the industries that tend to have a higher number of women are Arts, Entertainment & Recreation (100.0%), Real Estate, Rental & Leasing (76.3%), and Accommodation & Food Services (73.3%).
| Industry | Male | Female |
| Agriculture, Fishing & Hunting | 0 (0.0%) | 0 (0.0%) |
| Mining, Quarrying, & Extraction | 24 (100.0%) | 0 (0.0%) |
| Construction | 33 (55.9%) | 26 (44.1%) |
| Manufacturing | 277 (92.0%) | 24 (8.0%) |
| Wholesale Trade | 129 (63.2%) | 75 (36.8%) |
| Retail Trade | 343 (69.4%) | 151 (30.6%) |
| Transportation & Warehousing | 187 (74.5%) | 64 (25.5%) |
| Utilities | 37 (64.9%) | 20 (35.1%) |
| Information | 57 (76.0%) | 18 (24.0%) |
| Finance & Insurance | 211 (42.4%) | 286 (57.6%) |
| Real Estate, Rental & Leasing | 9 (23.7%) | 29 (76.3%) |
| Professional & Scientific | 271 (88.8%) | 34 (11.2%) |
| Enterprise Management | 0 (0.0%) | 0 (0.0%) |
| Administrative & Support | 277 (91.1%) | 27 (8.9%) |
| Educational Services | 186 (27.4%) | 492 (72.6%) |
| Health Care & Social Assistance | 349 (34.2%) | 673 (65.8%) |
| Arts, Entertainment & Recreation | 0 (0.0%) | 52 (100.0%) |
| Accommodation & Food Services | 59 (26.7%) | 162 (73.3%) |
| Public Administration | 246 (52.4%) | 223 (47.5%) |
| Total | 2,804 (53.9%) | 2,402 (46.1%) |
Education in Flowood
School Enrollment in Flowood
The most common levels of schooling among the 2,994 students in Flowood are elementary school (879 | 29.4%), middle school (688 | 23.0%), and college / undergraduate (540 | 18.0%).
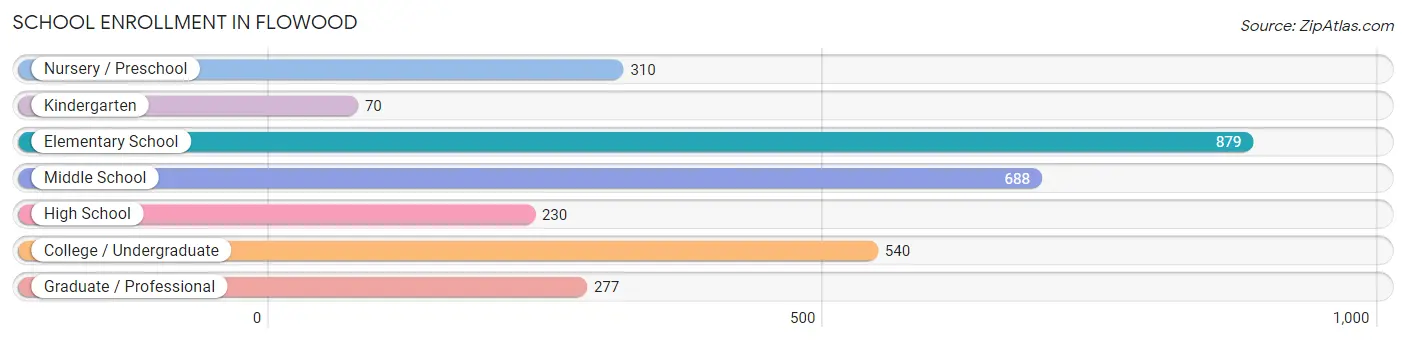
| School Level | # Students | % Students |
| Nursery / Preschool | 310 | 10.3% |
| Kindergarten | 70 | 2.3% |
| Elementary School | 879 | 29.4% |
| Middle School | 688 | 23.0% |
| High School | 230 | 7.7% |
| College / Undergraduate | 540 | 18.0% |
| Graduate / Professional | 277 | 9.2% |
| Total | 2,994 | 100.0% |
School Enrollment by Age by Funding Source in Flowood
Out of a total of 2,994 students who are enrolled in schools in Flowood, 1,081 (36.1%) attend a private institution, while the remaining 1,913 (63.9%) are enrolled in public schools. The age group of 3 to 4 year olds has the highest likelihood of being enrolled in private schools, with 180 (64.5% in the age bracket) enrolled. Conversely, the age group of 20 to 24 year olds has the lowest likelihood of being enrolled in a private school, with 388 (100.0% in the age bracket) attending a public institution.
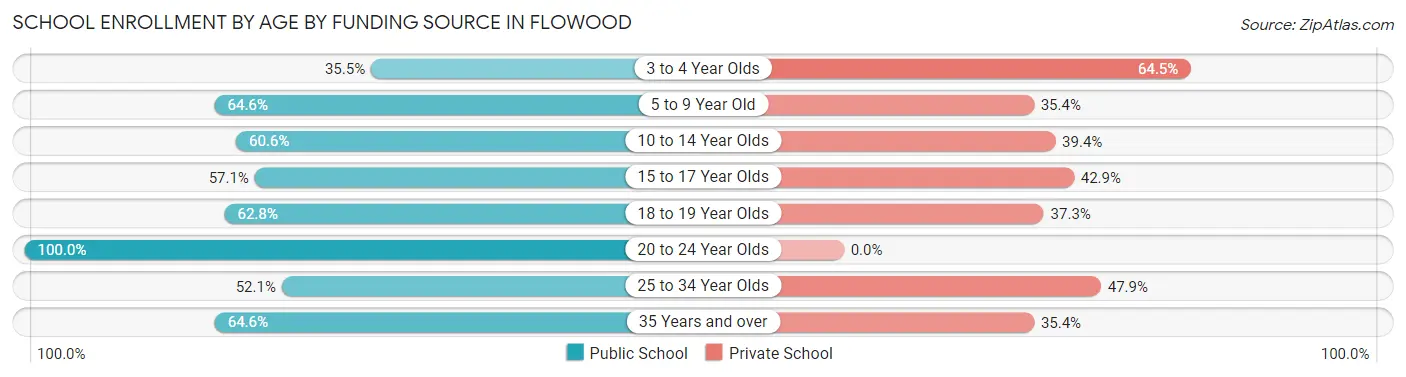
| Age Bracket | Public School | Private School |
| 3 to 4 Year Olds | 99 (35.5%) | 180 (64.5%) |
| 5 to 9 Year Old | 615 (64.6%) | 337 (35.4%) |
| 10 to 14 Year Olds | 434 (60.6%) | 282 (39.4%) |
| 15 to 17 Year Olds | 108 (57.1%) | 81 (42.9%) |
| 18 to 19 Year Olds | 32 (62.7%) | 19 (37.2%) |
| 20 to 24 Year Olds | 388 (100.0%) | 0 (0.0%) |
| 25 to 34 Year Olds | 136 (52.1%) | 125 (47.9%) |
| 35 Years and over | 102 (64.6%) | 56 (35.4%) |
| Total | 1,913 (63.9%) | 1,081 (36.1%) |
Educational Attainment by Field of Study in Flowood
Science & technology (731 | 18.7%), business (690 | 17.6%), bio, nature & agricultural (442 | 11.3%), arts & humanities (420 | 10.7%), and education (392 | 10.0%) are the most common fields of study among 3,913 individuals in Flowood who have obtained a bachelor's degree or higher.
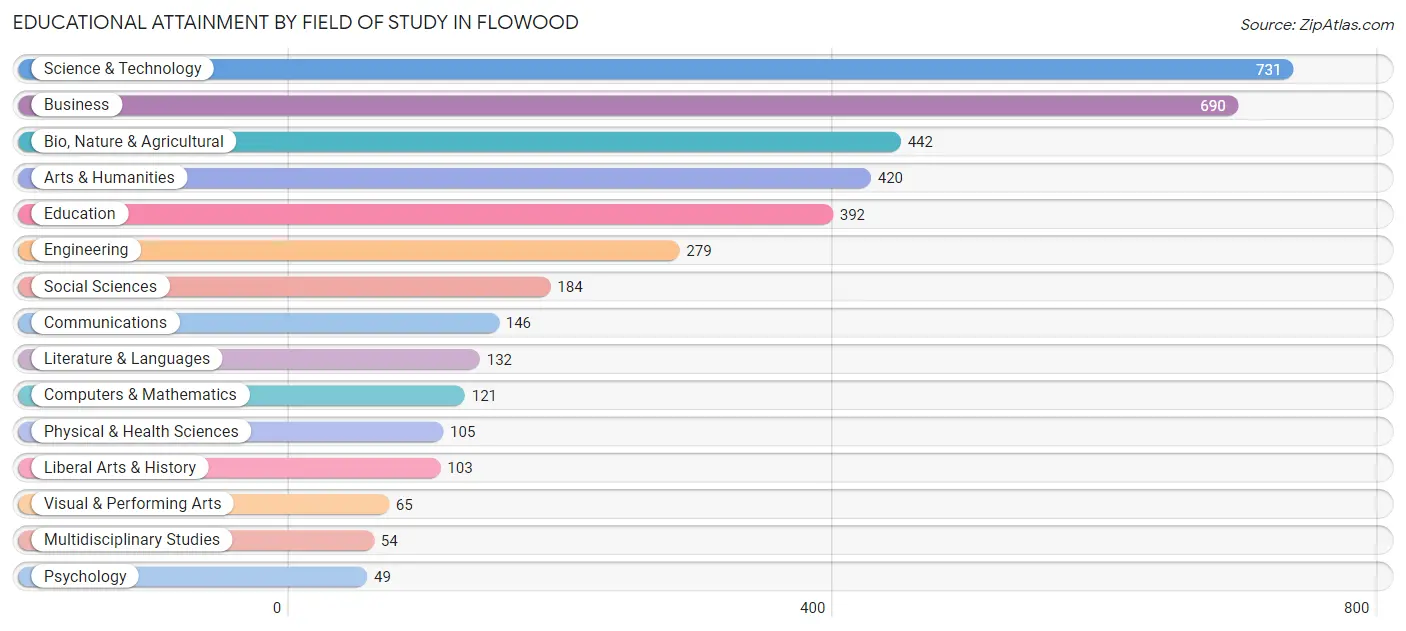
| Field of Study | # Graduates | % Graduates |
| Computers & Mathematics | 121 | 3.1% |
| Bio, Nature & Agricultural | 442 | 11.3% |
| Physical & Health Sciences | 105 | 2.7% |
| Psychology | 49 | 1.3% |
| Social Sciences | 184 | 4.7% |
| Engineering | 279 | 7.1% |
| Multidisciplinary Studies | 54 | 1.4% |
| Science & Technology | 731 | 18.7% |
| Business | 690 | 17.6% |
| Education | 392 | 10.0% |
| Literature & Languages | 132 | 3.4% |
| Liberal Arts & History | 103 | 2.6% |
| Visual & Performing Arts | 65 | 1.7% |
| Communications | 146 | 3.7% |
| Arts & Humanities | 420 | 10.7% |
| Total | 3,913 | 100.0% |
Transportation & Commute in Flowood
Vehicle Availability by Sex in Flowood
The most prevalent vehicle ownership categories in Flowood are males with 2 vehicles (1,607, accounting for 56.7%) and females with 2 vehicles (1,214, making up 67.3%).
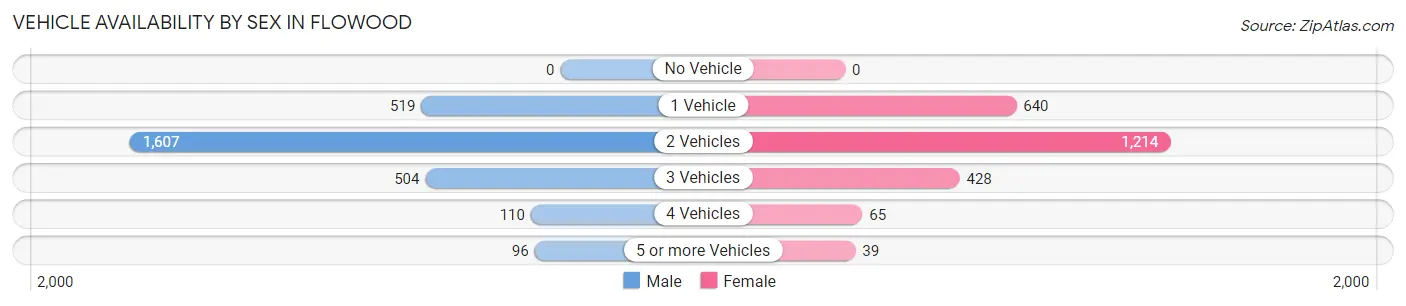
| Vehicles Available | Male | Female |
| No Vehicle | 0 (0.0%) | 0 (0.0%) |
| 1 Vehicle | 519 (18.3%) | 640 (26.8%) |
| 2 Vehicles | 1,607 (56.7%) | 1,214 (50.9%) |
| 3 Vehicles | 504 (17.8%) | 428 (17.9%) |
| 4 Vehicles | 110 (3.9%) | 65 (2.7%) |
| 5 or more Vehicles | 96 (3.4%) | 39 (1.6%) |
| Total | 2,836 (100.0%) | 2,386 (100.0%) |
Commute Time in Flowood
The most frequently occuring commute durations in Flowood are 30 to 34 minutes (873 commuters, 18.1%), 20 to 24 minutes (848 commuters, 17.6%), and 15 to 19 minutes (750 commuters, 15.6%).
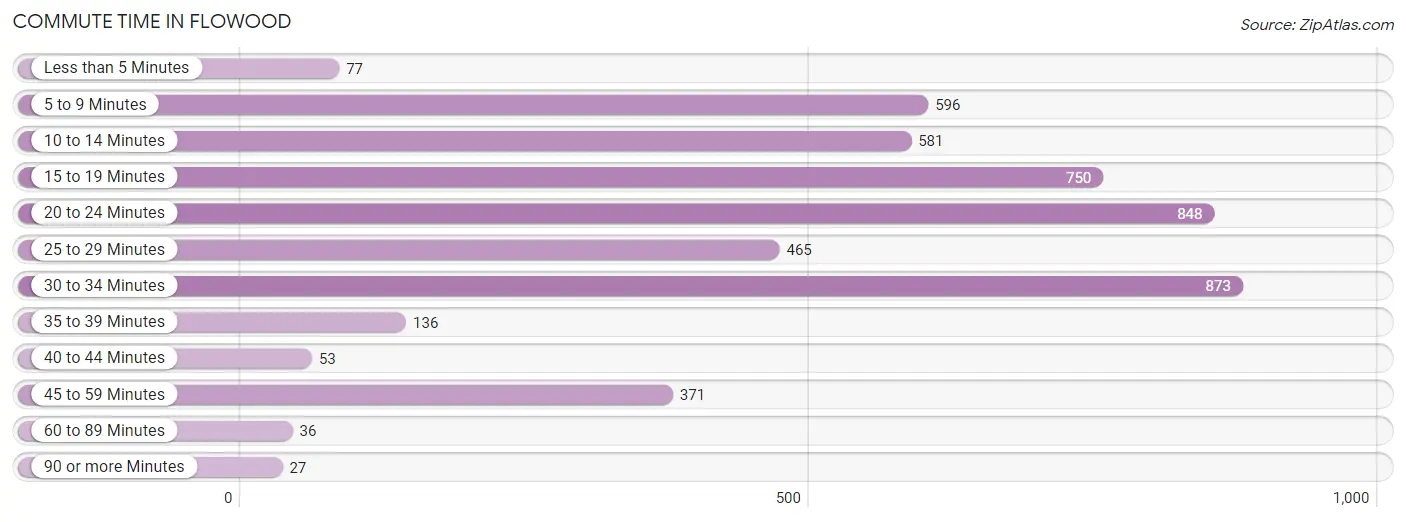
| Commute Time | # Commuters | % Commuters |
| Less than 5 Minutes | 77 | 1.6% |
| 5 to 9 Minutes | 596 | 12.4% |
| 10 to 14 Minutes | 581 | 12.1% |
| 15 to 19 Minutes | 750 | 15.6% |
| 20 to 24 Minutes | 848 | 17.6% |
| 25 to 29 Minutes | 465 | 9.7% |
| 30 to 34 Minutes | 873 | 18.1% |
| 35 to 39 Minutes | 136 | 2.8% |
| 40 to 44 Minutes | 53 | 1.1% |
| 45 to 59 Minutes | 371 | 7.7% |
| 60 to 89 Minutes | 36 | 0.7% |
| 90 or more Minutes | 27 | 0.6% |
Commute Time by Sex in Flowood
The most common commute times in Flowood are 15 to 19 minutes (615 commuters, 24.2%) for males and 30 to 34 minutes (475 commuters, 20.9%) for females.
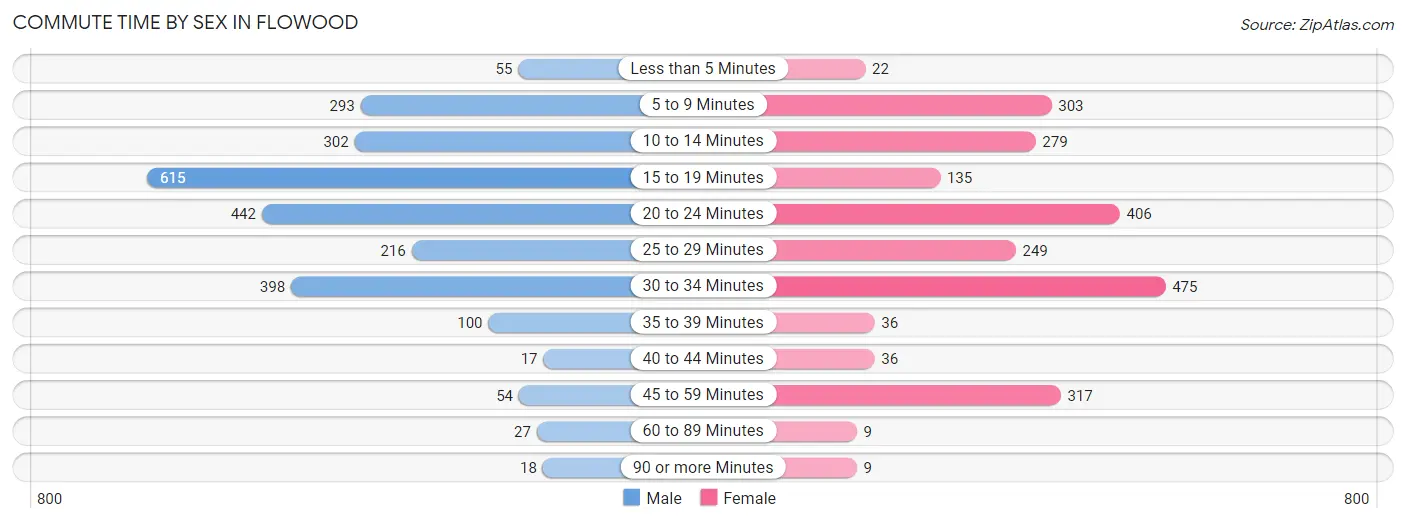
| Commute Time | Male | Female |
| Less than 5 Minutes | 55 (2.2%) | 22 (1.0%) |
| 5 to 9 Minutes | 293 (11.6%) | 303 (13.3%) |
| 10 to 14 Minutes | 302 (11.9%) | 279 (12.3%) |
| 15 to 19 Minutes | 615 (24.2%) | 135 (5.9%) |
| 20 to 24 Minutes | 442 (17.4%) | 406 (17.8%) |
| 25 to 29 Minutes | 216 (8.5%) | 249 (10.9%) |
| 30 to 34 Minutes | 398 (15.7%) | 475 (20.9%) |
| 35 to 39 Minutes | 100 (3.9%) | 36 (1.6%) |
| 40 to 44 Minutes | 17 (0.7%) | 36 (1.6%) |
| 45 to 59 Minutes | 54 (2.1%) | 317 (13.9%) |
| 60 to 89 Minutes | 27 (1.1%) | 9 (0.4%) |
| 90 or more Minutes | 18 (0.7%) | 9 (0.4%) |
Time of Departure to Work by Sex in Flowood
The most frequent times of departure to work in Flowood are 6:30 AM to 6:59 AM (651, 25.7%) for males and 7:00 AM to 7:29 AM (825, 36.2%) for females.
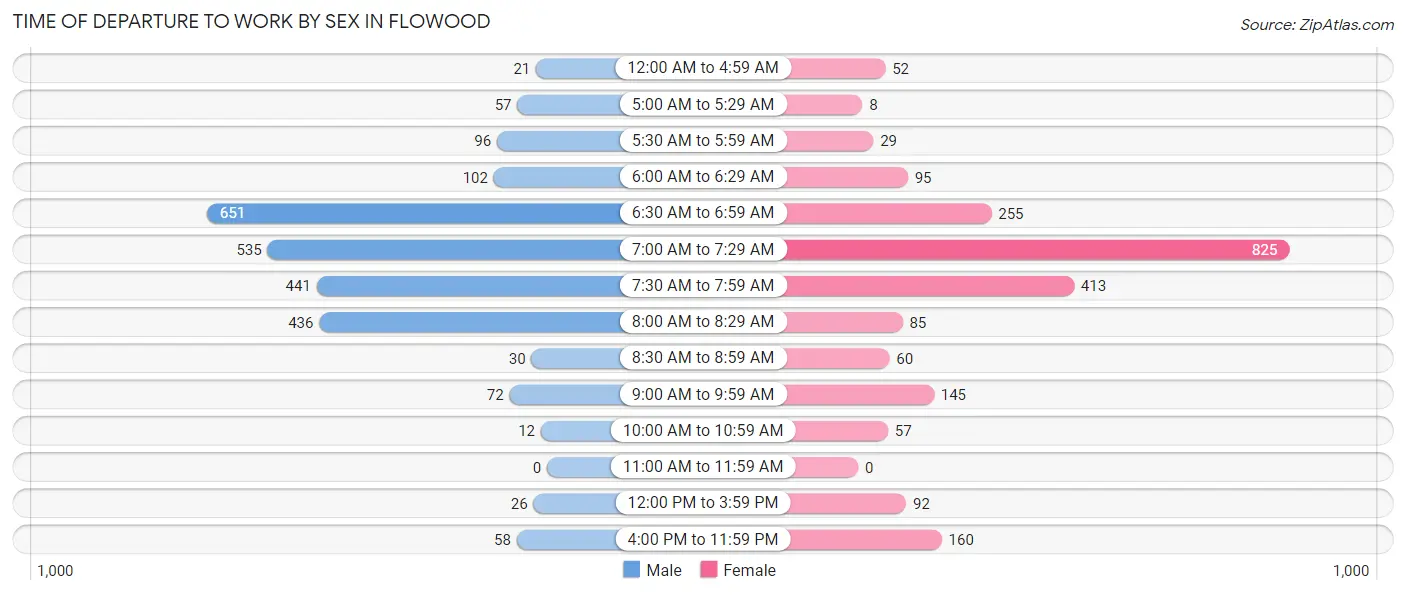
| Time of Departure | Male | Female |
| 12:00 AM to 4:59 AM | 21 (0.8%) | 52 (2.3%) |
| 5:00 AM to 5:29 AM | 57 (2.2%) | 8 (0.4%) |
| 5:30 AM to 5:59 AM | 96 (3.8%) | 29 (1.3%) |
| 6:00 AM to 6:29 AM | 102 (4.0%) | 95 (4.2%) |
| 6:30 AM to 6:59 AM | 651 (25.7%) | 255 (11.2%) |
| 7:00 AM to 7:29 AM | 535 (21.1%) | 825 (36.2%) |
| 7:30 AM to 7:59 AM | 441 (17.4%) | 413 (18.1%) |
| 8:00 AM to 8:29 AM | 436 (17.2%) | 85 (3.7%) |
| 8:30 AM to 8:59 AM | 30 (1.2%) | 60 (2.6%) |
| 9:00 AM to 9:59 AM | 72 (2.8%) | 145 (6.4%) |
| 10:00 AM to 10:59 AM | 12 (0.5%) | 57 (2.5%) |
| 11:00 AM to 11:59 AM | 0 (0.0%) | 0 (0.0%) |
| 12:00 PM to 3:59 PM | 26 (1.0%) | 92 (4.0%) |
| 4:00 PM to 11:59 PM | 58 (2.3%) | 160 (7.0%) |
| Total | 2,537 (100.0%) | 2,276 (100.0%) |
Housing Occupancy in Flowood
Occupancy by Ownership in Flowood
Of the total 4,073 dwellings in Flowood, owner-occupied units account for 2,164 (53.1%), while renter-occupied units make up 1,909 (46.9%).
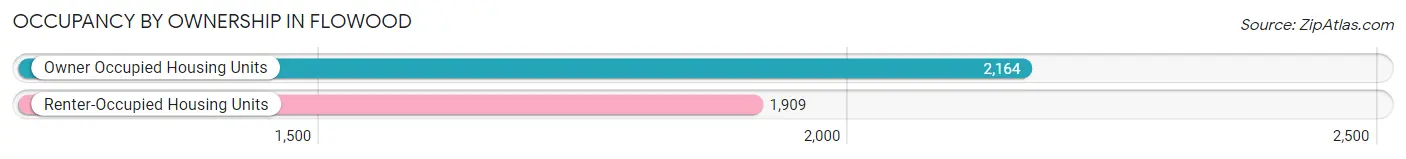
| Occupancy | # Housing Units | % Housing Units |
| Owner Occupied Housing Units | 2,164 | 53.1% |
| Renter-Occupied Housing Units | 1,909 | 46.9% |
| Total Occupied Housing Units | 4,073 | 100.0% |
Occupancy by Household Size in Flowood
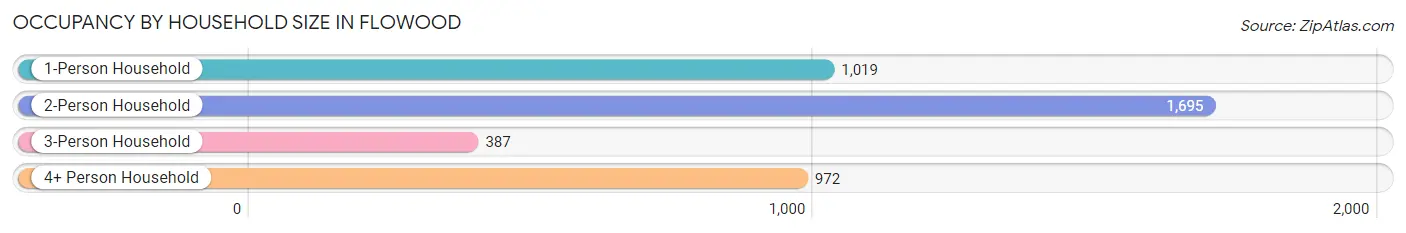
| Household Size | # Housing Units | % Housing Units |
| 1-Person Household | 1,019 | 25.0% |
| 2-Person Household | 1,695 | 41.6% |
| 3-Person Household | 387 | 9.5% |
| 4+ Person Household | 972 | 23.9% |
| Total Housing Units | 4,073 | 100.0% |
Occupancy by Ownership by Household Size in Flowood
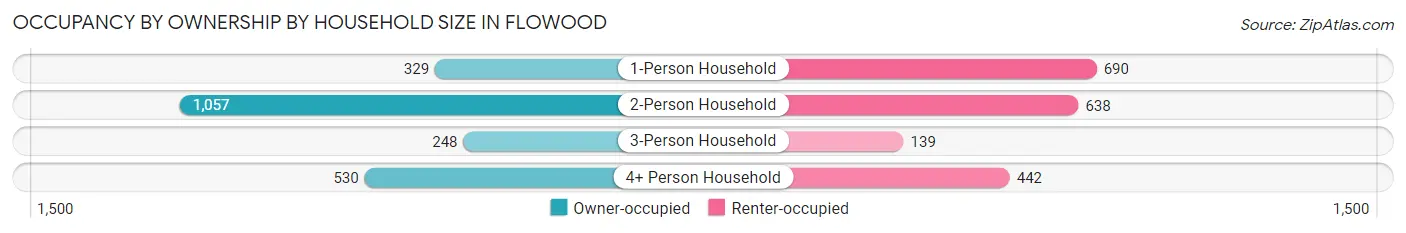
| Household Size | Owner-occupied | Renter-occupied |
| 1-Person Household | 329 (32.3%) | 690 (67.7%) |
| 2-Person Household | 1,057 (62.4%) | 638 (37.6%) |
| 3-Person Household | 248 (64.1%) | 139 (35.9%) |
| 4+ Person Household | 530 (54.5%) | 442 (45.5%) |
| Total Housing Units | 2,164 (53.1%) | 1,909 (46.9%) |
Occupancy by Educational Attainment in Flowood
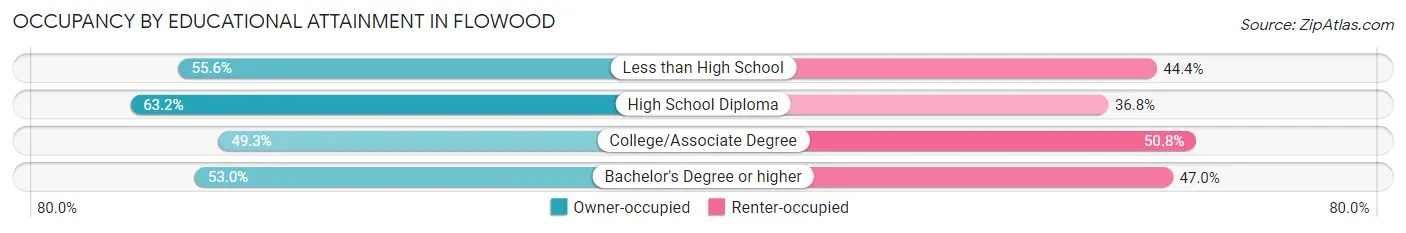
| Household Size | Owner-occupied | Renter-occupied |
| Less than High School | 90 (55.6%) | 72 (44.4%) |
| High School Diploma | 258 (63.2%) | 150 (36.8%) |
| College/Associate Degree | 527 (49.2%) | 543 (50.7%) |
| Bachelor's Degree or higher | 1,289 (53.0%) | 1,144 (47.0%) |
Occupancy by Age of Householder in Flowood
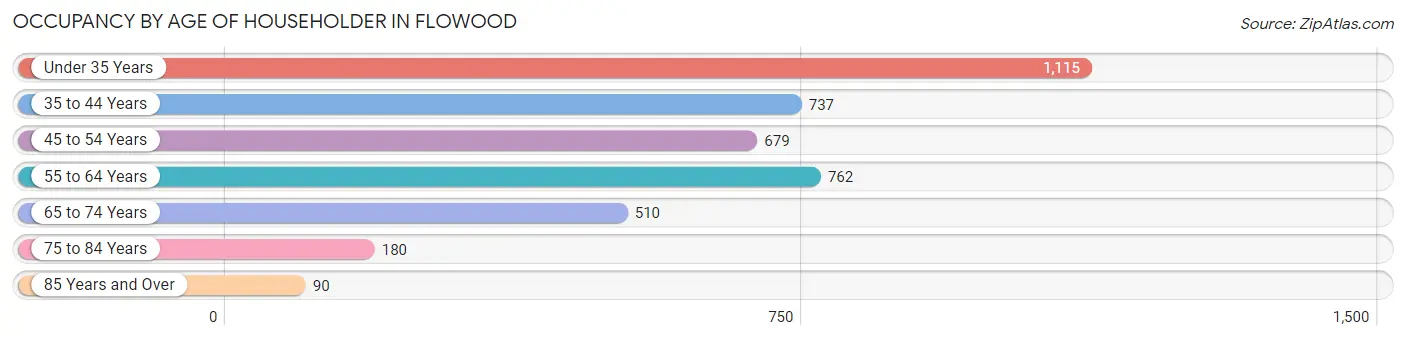
| Age Bracket | # Households | % Households |
| Under 35 Years | 1,115 | 27.4% |
| 35 to 44 Years | 737 | 18.1% |
| 45 to 54 Years | 679 | 16.7% |
| 55 to 64 Years | 762 | 18.7% |
| 65 to 74 Years | 510 | 12.5% |
| 75 to 84 Years | 180 | 4.4% |
| 85 Years and Over | 90 | 2.2% |
| Total | 4,073 | 100.0% |
Housing Finances in Flowood
Median Income by Occupancy in Flowood
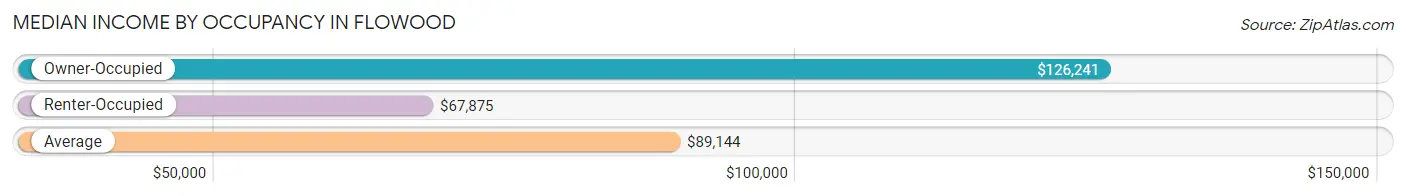
| Occupancy Type | # Households | Median Income |
| Owner-Occupied | 2,164 (53.1%) | $126,241 |
| Renter-Occupied | 1,909 (46.9%) | $67,875 |
| Average | 4,073 (100.0%) | $89,144 |
Occupancy by Householder Income Bracket in Flowood
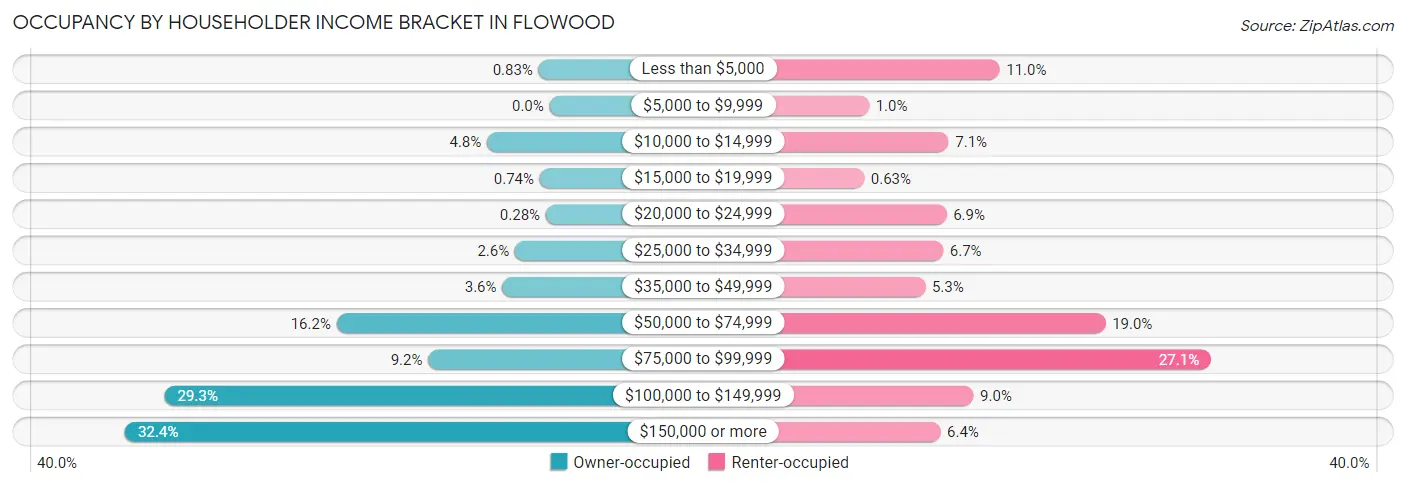
| Income Bracket | Owner-occupied | Renter-occupied |
| Less than $5,000 | 18 (0.8%) | 209 (11.0%) |
| $5,000 to $9,999 | 0 (0.0%) | 19 (1.0%) |
| $10,000 to $14,999 | 103 (4.8%) | 135 (7.1%) |
| $15,000 to $19,999 | 16 (0.7%) | 12 (0.6%) |
| $20,000 to $24,999 | 6 (0.3%) | 132 (6.9%) |
| $25,000 to $34,999 | 57 (2.6%) | 127 (6.7%) |
| $35,000 to $49,999 | 78 (3.6%) | 101 (5.3%) |
| $50,000 to $74,999 | 351 (16.2%) | 363 (19.0%) |
| $75,000 to $99,999 | 200 (9.2%) | 517 (27.1%) |
| $100,000 to $149,999 | 635 (29.3%) | 171 (9.0%) |
| $150,000 or more | 700 (32.4%) | 123 (6.4%) |
| Total | 2,164 (100.0%) | 1,909 (100.0%) |
Monthly Housing Cost Tiers in Flowood
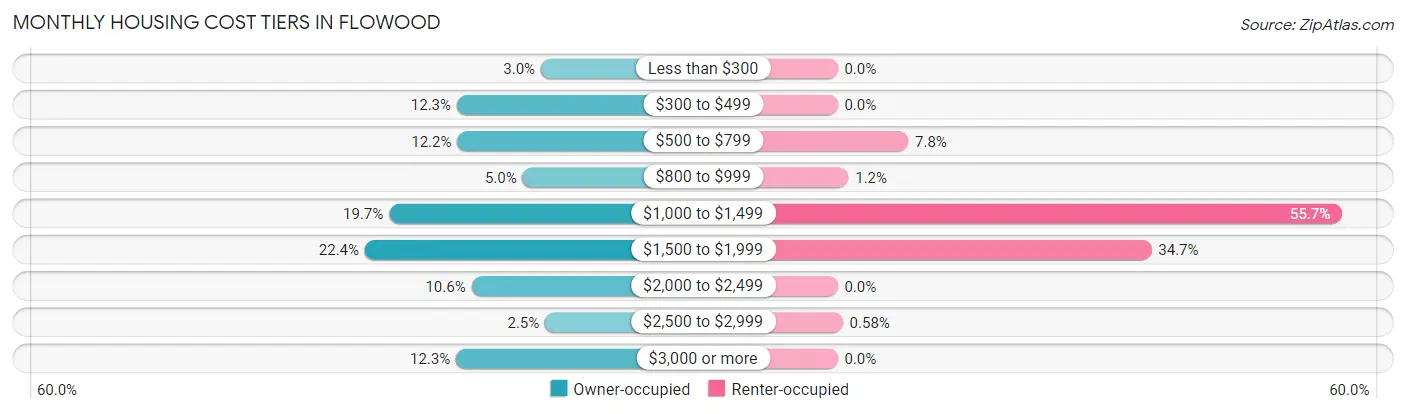
| Monthly Cost | Owner-occupied | Renter-occupied |
| Less than $300 | 64 (3.0%) | 0 (0.0%) |
| $300 to $499 | 265 (12.2%) | 0 (0.0%) |
| $500 to $799 | 264 (12.2%) | 149 (7.8%) |
| $800 to $999 | 108 (5.0%) | 23 (1.2%) |
| $1,000 to $1,499 | 427 (19.7%) | 1,064 (55.7%) |
| $1,500 to $1,999 | 485 (22.4%) | 662 (34.7%) |
| $2,000 to $2,499 | 230 (10.6%) | 0 (0.0%) |
| $2,500 to $2,999 | 54 (2.5%) | 11 (0.6%) |
| $3,000 or more | 267 (12.3%) | 0 (0.0%) |
| Total | 2,164 (100.0%) | 1,909 (100.0%) |
Physical Housing Characteristics in Flowood
Housing Structures in Flowood
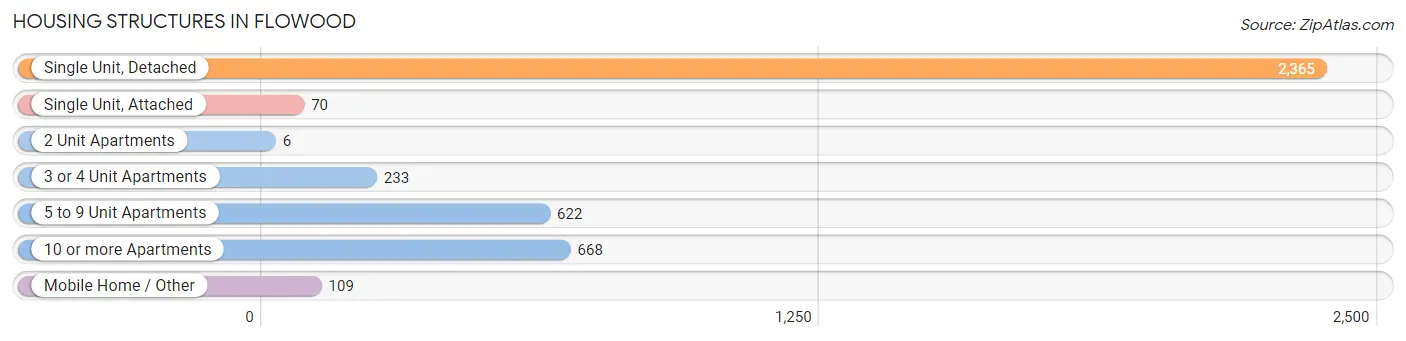
| Structure Type | # Housing Units | % Housing Units |
| Single Unit, Detached | 2,365 | 58.1% |
| Single Unit, Attached | 70 | 1.7% |
| 2 Unit Apartments | 6 | 0.2% |
| 3 or 4 Unit Apartments | 233 | 5.7% |
| 5 to 9 Unit Apartments | 622 | 15.3% |
| 10 or more Apartments | 668 | 16.4% |
| Mobile Home / Other | 109 | 2.7% |
| Total | 4,073 | 100.0% |
Housing Structures by Occupancy in Flowood
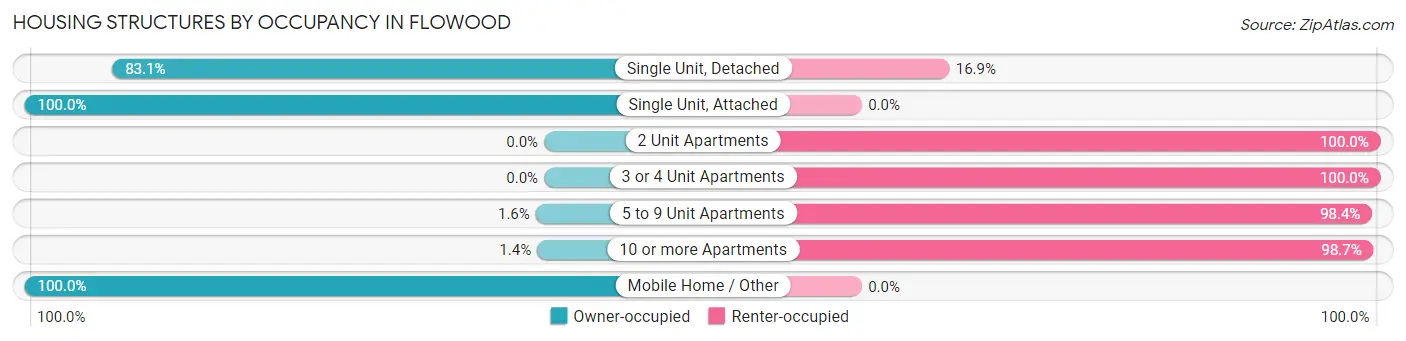
| Structure Type | Owner-occupied | Renter-occupied |
| Single Unit, Detached | 1,966 (83.1%) | 399 (16.9%) |
| Single Unit, Attached | 70 (100.0%) | 0 (0.0%) |
| 2 Unit Apartments | 0 (0.0%) | 6 (100.0%) |
| 3 or 4 Unit Apartments | 0 (0.0%) | 233 (100.0%) |
| 5 to 9 Unit Apartments | 10 (1.6%) | 612 (98.4%) |
| 10 or more Apartments | 9 (1.3%) | 659 (98.7%) |
| Mobile Home / Other | 109 (100.0%) | 0 (0.0%) |
| Total | 2,164 (53.1%) | 1,909 (46.9%) |
Housing Structures by Number of Rooms in Flowood
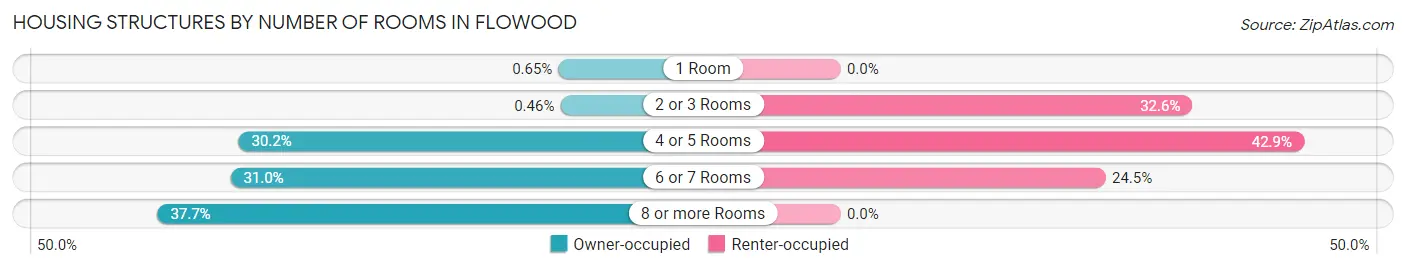
| Number of Rooms | Owner-occupied | Renter-occupied |
| 1 Room | 14 (0.6%) | 0 (0.0%) |
| 2 or 3 Rooms | 10 (0.5%) | 622 (32.6%) |
| 4 or 5 Rooms | 654 (30.2%) | 819 (42.9%) |
| 6 or 7 Rooms | 670 (31.0%) | 468 (24.5%) |
| 8 or more Rooms | 816 (37.7%) | 0 (0.0%) |
| Total | 2,164 (100.0%) | 1,909 (100.0%) |
Housing Structure by Heating Type in Flowood
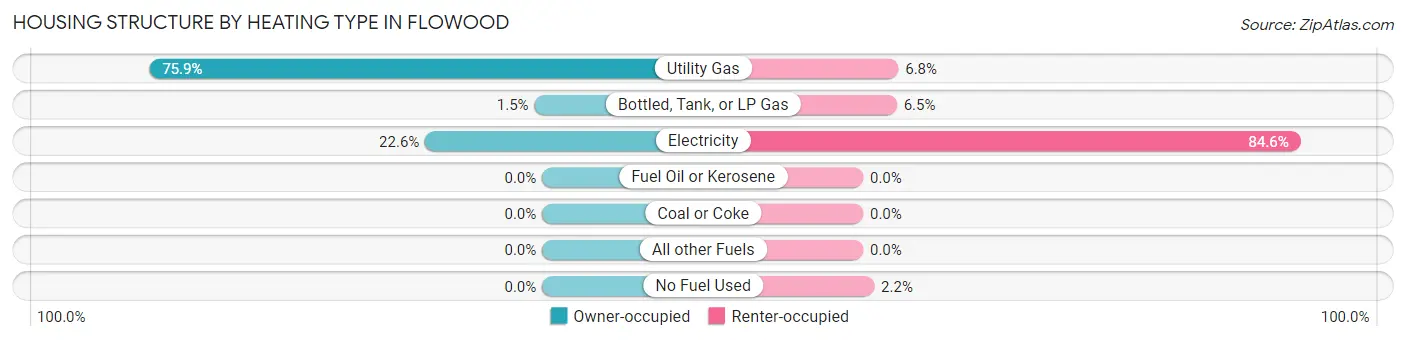
| Heating Type | Owner-occupied | Renter-occupied |
| Utility Gas | 1,643 (75.9%) | 130 (6.8%) |
| Bottled, Tank, or LP Gas | 32 (1.5%) | 124 (6.5%) |
| Electricity | 489 (22.6%) | 1,614 (84.6%) |
| Fuel Oil or Kerosene | 0 (0.0%) | 0 (0.0%) |
| Coal or Coke | 0 (0.0%) | 0 (0.0%) |
| All other Fuels | 0 (0.0%) | 0 (0.0%) |
| No Fuel Used | 0 (0.0%) | 41 (2.1%) |
| Total | 2,164 (100.0%) | 1,909 (100.0%) |
Household Vehicle Usage in Flowood
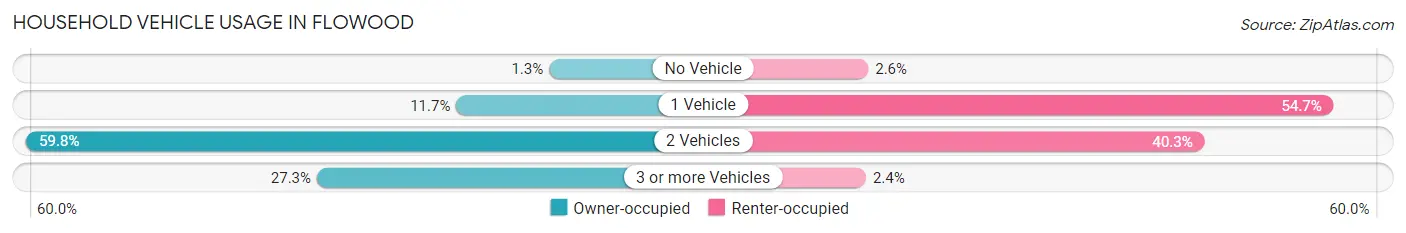
| Vehicles per Household | Owner-occupied | Renter-occupied |
| No Vehicle | 27 (1.3%) | 50 (2.6%) |
| 1 Vehicle | 252 (11.7%) | 1,045 (54.7%) |
| 2 Vehicles | 1,295 (59.8%) | 769 (40.3%) |
| 3 or more Vehicles | 590 (27.3%) | 45 (2.4%) |
| Total | 2,164 (100.0%) | 1,909 (100.0%) |
Real Estate & Mortgages in Flowood
Real Estate and Mortgage Overview in Flowood
| Characteristic | Without Mortgage | With Mortgage |
| Housing Units | 664 | 1,500 |
| Median Property Value | $228,200 | $275,600 |
| Median Household Income | $113,793 | $464 |
| Monthly Housing Costs | $507 | $267 |
| Real Estate Taxes | $1,406 | $47 |
Property Value by Mortgage Status in Flowood
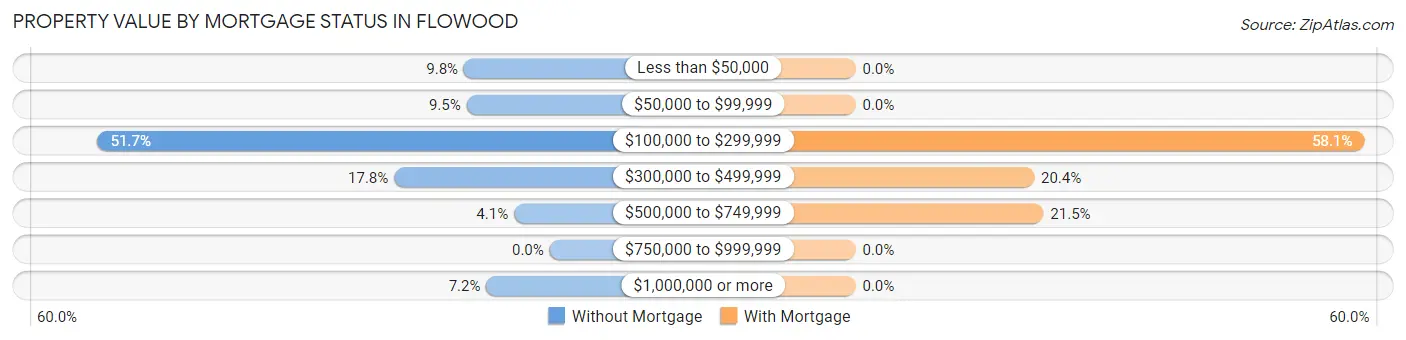
| Property Value | Without Mortgage | With Mortgage |
| Less than $50,000 | 65 (9.8%) | 0 (0.0%) |
| $50,000 to $99,999 | 63 (9.5%) | 0 (0.0%) |
| $100,000 to $299,999 | 343 (51.7%) | 872 (58.1%) |
| $300,000 to $499,999 | 118 (17.8%) | 306 (20.4%) |
| $500,000 to $749,999 | 27 (4.1%) | 322 (21.5%) |
| $750,000 to $999,999 | 0 (0.0%) | 0 (0.0%) |
| $1,000,000 or more | 48 (7.2%) | 0 (0.0%) |
| Total | 664 (100.0%) | 1,500 (100.0%) |
Household Income by Mortgage Status in Flowood
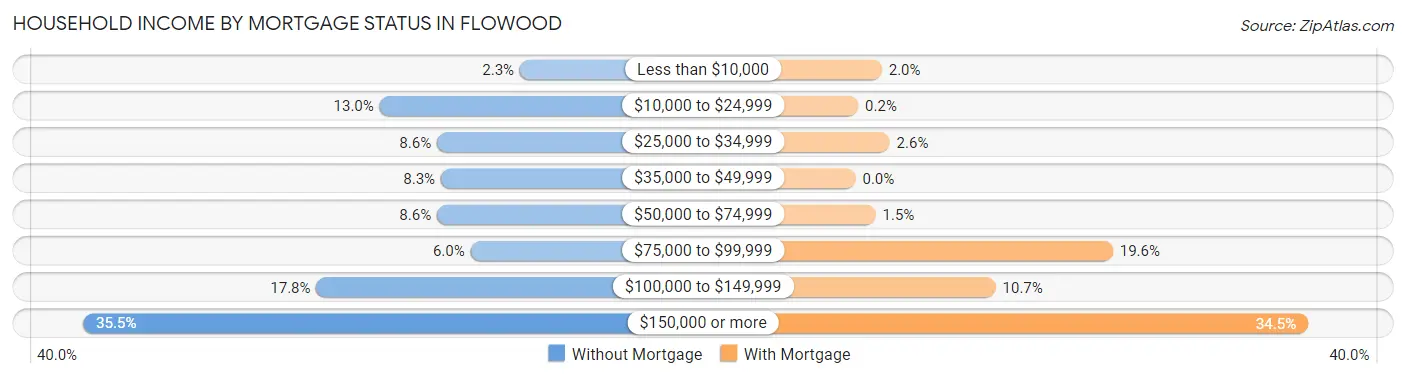
| Household Income | Without Mortgage | With Mortgage |
| Less than $10,000 | 15 (2.3%) | 30 (2.0%) |
| $10,000 to $24,999 | 86 (13.0%) | 3 (0.2%) |
| $25,000 to $34,999 | 57 (8.6%) | 39 (2.6%) |
| $35,000 to $49,999 | 55 (8.3%) | 0 (0.0%) |
| $50,000 to $74,999 | 57 (8.6%) | 23 (1.5%) |
| $75,000 to $99,999 | 40 (6.0%) | 294 (19.6%) |
| $100,000 to $149,999 | 118 (17.8%) | 160 (10.7%) |
| $150,000 or more | 236 (35.5%) | 517 (34.5%) |
| Total | 664 (100.0%) | 1,500 (100.0%) |
Property Value to Household Income Ratio in Flowood
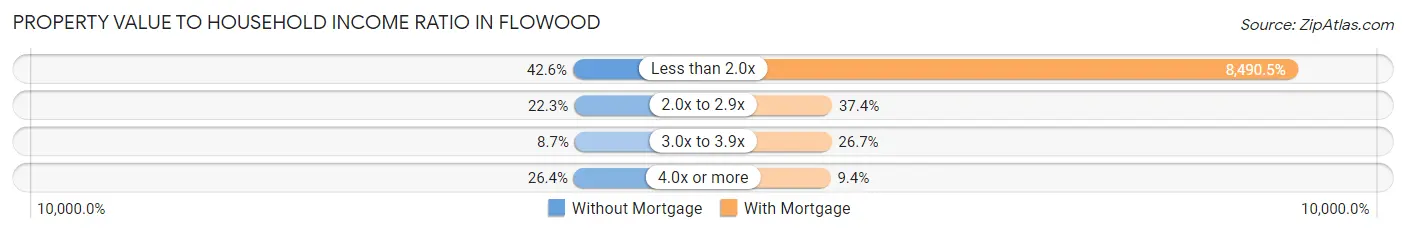
| Value-to-Income Ratio | Without Mortgage | With Mortgage |
| Less than 2.0x | 283 (42.6%) | 127,357 (8,490.5%) |
| 2.0x to 2.9x | 148 (22.3%) | 561 (37.4%) |
| 3.0x to 3.9x | 58 (8.7%) | 400 (26.7%) |
| 4.0x or more | 175 (26.4%) | 141 (9.4%) |
| Total | 664 (100.0%) | 1,500 (100.0%) |
Real Estate Taxes by Mortgage Status in Flowood
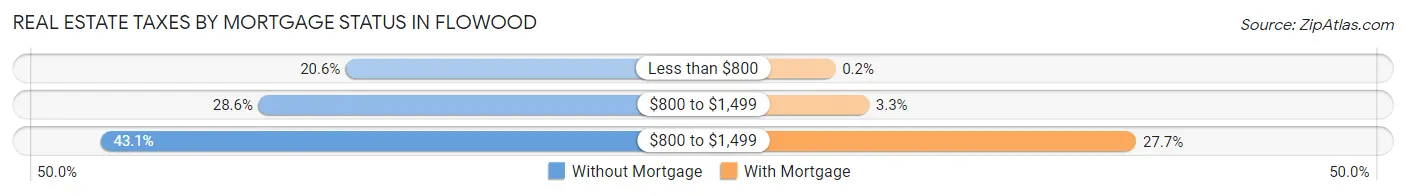
| Property Taxes | Without Mortgage | With Mortgage |
| Less than $800 | 137 (20.6%) | 3 (0.2%) |
| $800 to $1,499 | 190 (28.6%) | 49 (3.3%) |
| $800 to $1,499 | 286 (43.1%) | 415 (27.7%) |
| Total | 664 (100.0%) | 1,500 (100.0%) |
Health & Disability in Flowood
Health Insurance Coverage by Age in Flowood
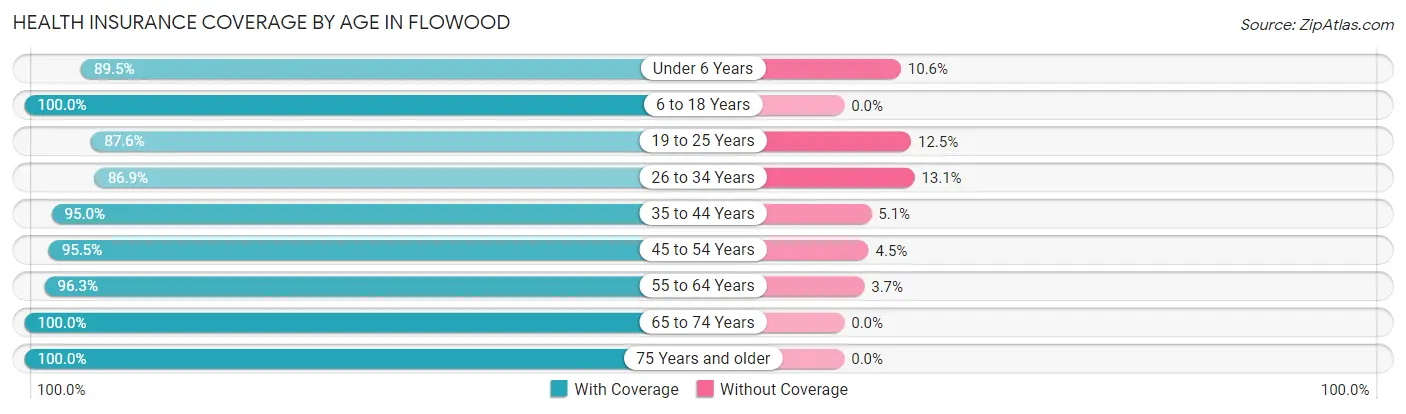
| Age Bracket | With Coverage | Without Coverage |
| Under 6 Years | 848 (89.4%) | 100 (10.5%) |
| 6 to 18 Years | 1,706 (100.0%) | 0 (0.0%) |
| 19 to 25 Years | 612 (87.5%) | 87 (12.4%) |
| 26 to 34 Years | 1,336 (86.9%) | 201 (13.1%) |
| 35 to 44 Years | 1,391 (95.0%) | 74 (5.1%) |
| 45 to 54 Years | 1,390 (95.5%) | 66 (4.5%) |
| 55 to 64 Years | 1,084 (96.3%) | 42 (3.7%) |
| 65 to 74 Years | 693 (100.0%) | 0 (0.0%) |
| 75 Years and older | 393 (100.0%) | 0 (0.0%) |
| Total | 9,453 (94.3%) | 570 (5.7%) |
Health Insurance Coverage by Citizenship Status in Flowood
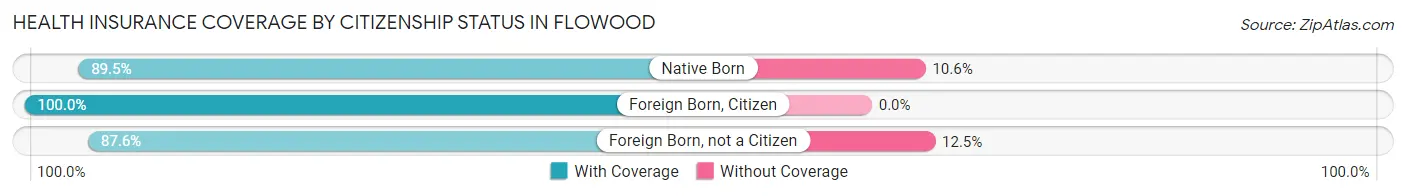
| Citizenship Status | With Coverage | Without Coverage |
| Native Born | 848 (89.4%) | 100 (10.5%) |
| Foreign Born, Citizen | 1,706 (100.0%) | 0 (0.0%) |
| Foreign Born, not a Citizen | 612 (87.5%) | 87 (12.4%) |
Health Insurance Coverage by Household Income in Flowood
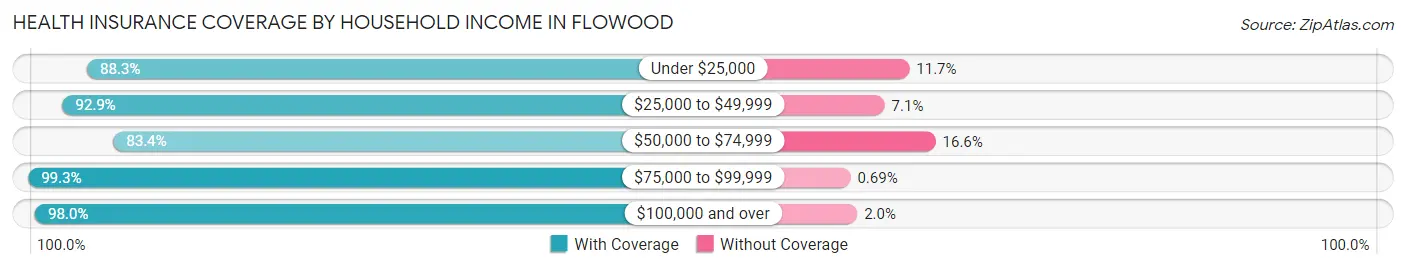
| Household Income | With Coverage | Without Coverage |
| Under $25,000 | 1,273 (88.3%) | 169 (11.7%) |
| $25,000 to $49,999 | 603 (92.9%) | 46 (7.1%) |
| $50,000 to $74,999 | 1,272 (83.4%) | 254 (16.6%) |
| $75,000 to $99,999 | 1,869 (99.3%) | 13 (0.7%) |
| $100,000 and over | 4,393 (98.0%) | 88 (2.0%) |
Public vs Private Health Insurance Coverage by Age in Flowood
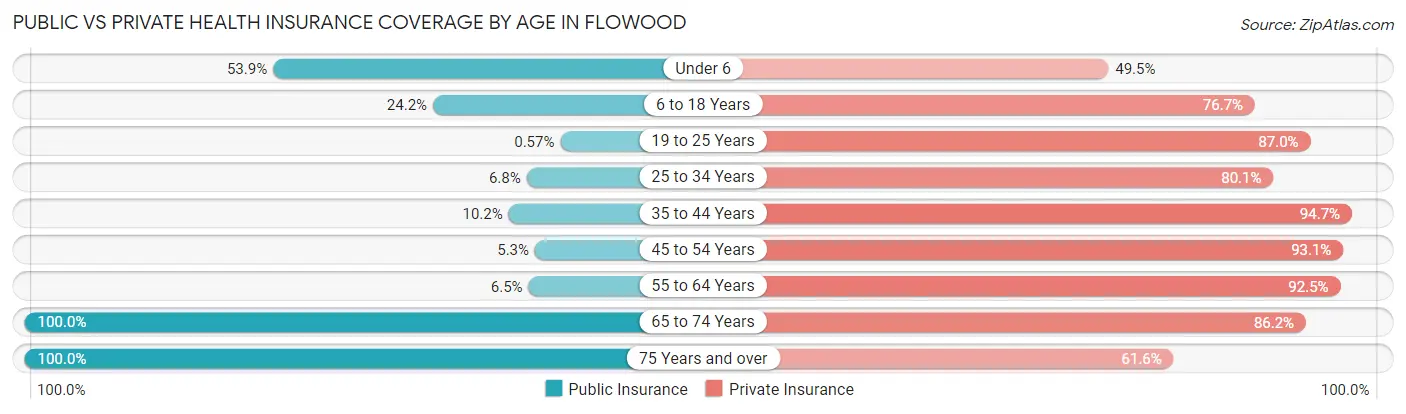
| Age Bracket | Public Insurance | Private Insurance |
| Under 6 | 511 (53.9%) | 469 (49.5%) |
| 6 to 18 Years | 413 (24.2%) | 1,308 (76.7%) |
| 19 to 25 Years | 4 (0.6%) | 608 (87.0%) |
| 25 to 34 Years | 105 (6.8%) | 1,231 (80.1%) |
| 35 to 44 Years | 149 (10.2%) | 1,387 (94.7%) |
| 45 to 54 Years | 77 (5.3%) | 1,355 (93.1%) |
| 55 to 64 Years | 73 (6.5%) | 1,042 (92.5%) |
| 65 to 74 Years | 693 (100.0%) | 597 (86.2%) |
| 75 Years and over | 393 (100.0%) | 242 (61.6%) |
| Total | 2,418 (24.1%) | 8,239 (82.2%) |
Disability Status by Sex by Age in Flowood
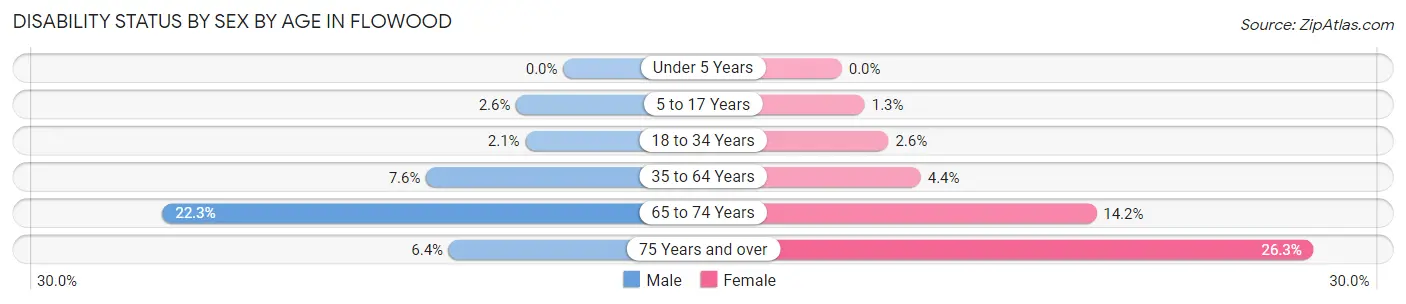
| Age Bracket | Male | Female |
| Under 5 Years | 0 (0.0%) | 0 (0.0%) |
| 5 to 17 Years | 16 (2.6%) | 16 (1.3%) |
| 18 to 34 Years | 20 (2.1%) | 34 (2.6%) |
| 35 to 64 Years | 151 (7.6%) | 91 (4.4%) |
| 65 to 74 Years | 46 (22.3%) | 69 (14.2%) |
| 75 Years and over | 10 (6.4%) | 62 (26.3%) |
Disability Class by Sex by Age in Flowood
Disability Class: Hearing Difficulty
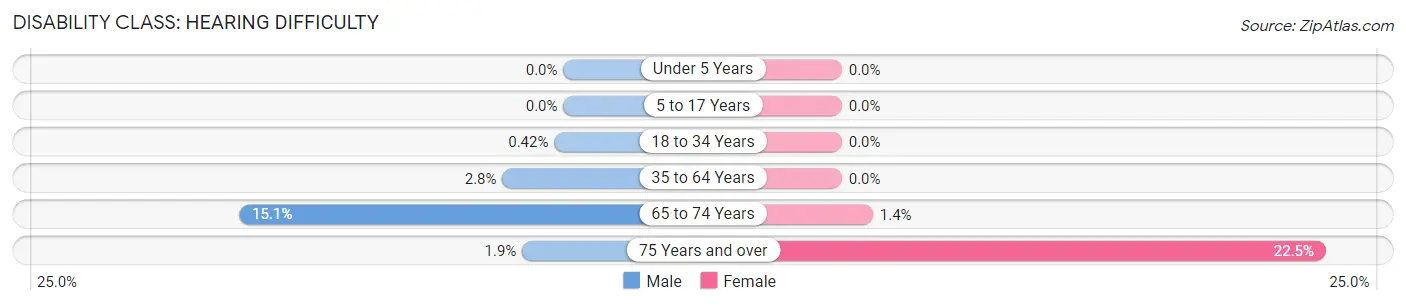
| Age Bracket | Male | Female |
| Under 5 Years | 0 (0.0%) | 0 (0.0%) |
| 5 to 17 Years | 0 (0.0%) | 0 (0.0%) |
| 18 to 34 Years | 4 (0.4%) | 0 (0.0%) |
| 35 to 64 Years | 56 (2.8%) | 0 (0.0%) |
| 65 to 74 Years | 31 (15.0%) | 7 (1.4%) |
| 75 Years and over | 3 (1.9%) | 53 (22.5%) |
Disability Class: Vision Difficulty
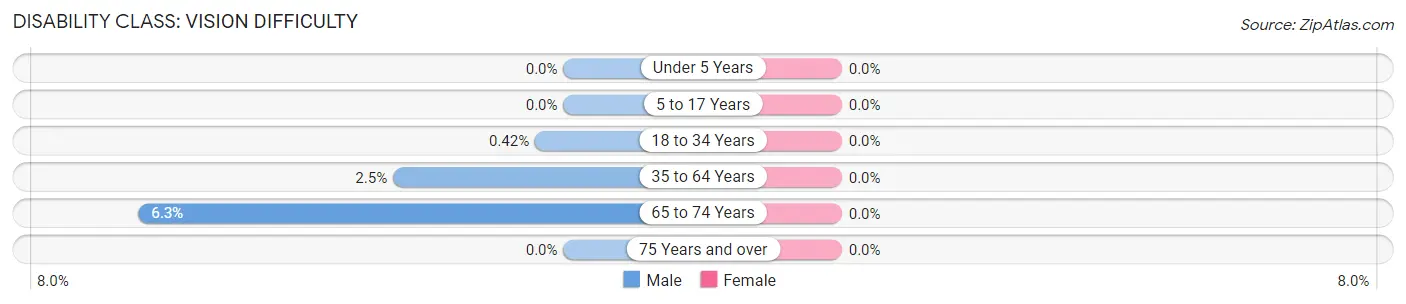
| Age Bracket | Male | Female |
| Under 5 Years | 0 (0.0%) | 0 (0.0%) |
| 5 to 17 Years | 0 (0.0%) | 0 (0.0%) |
| 18 to 34 Years | 4 (0.4%) | 0 (0.0%) |
| 35 to 64 Years | 50 (2.5%) | 0 (0.0%) |
| 65 to 74 Years | 13 (6.3%) | 0 (0.0%) |
| 75 Years and over | 0 (0.0%) | 0 (0.0%) |
Disability Class: Cognitive Difficulty
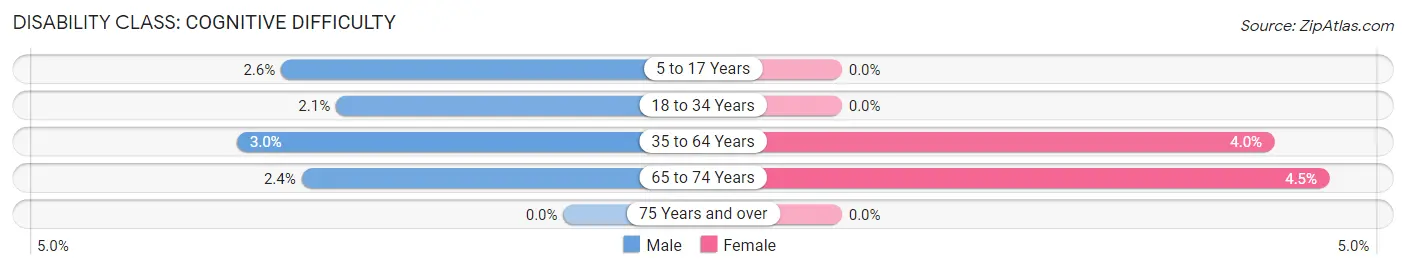
| Age Bracket | Male | Female |
| 5 to 17 Years | 16 (2.6%) | 0 (0.0%) |
| 18 to 34 Years | 20 (2.1%) | 0 (0.0%) |
| 35 to 64 Years | 60 (3.0%) | 83 (4.0%) |
| 65 to 74 Years | 5 (2.4%) | 22 (4.5%) |
| 75 Years and over | 0 (0.0%) | 0 (0.0%) |
Disability Class: Ambulatory Difficulty
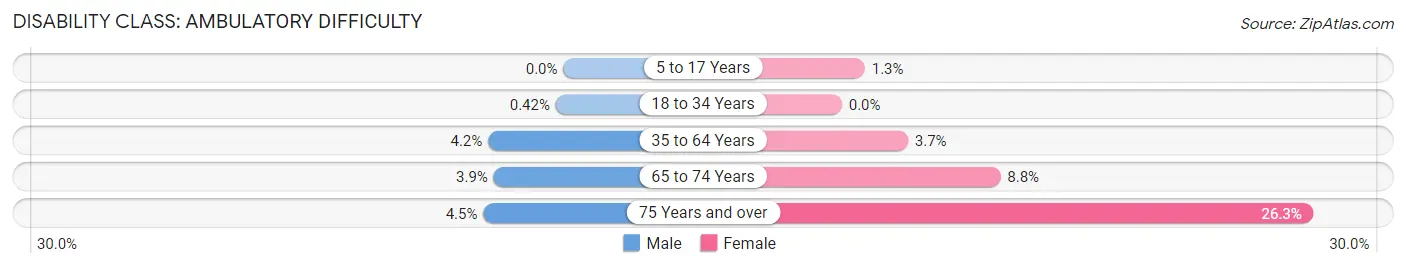
| Age Bracket | Male | Female |
| 5 to 17 Years | 0 (0.0%) | 16 (1.3%) |
| 18 to 34 Years | 4 (0.4%) | 0 (0.0%) |
| 35 to 64 Years | 83 (4.2%) | 76 (3.7%) |
| 65 to 74 Years | 8 (3.9%) | 43 (8.8%) |
| 75 Years and over | 7 (4.5%) | 62 (26.3%) |
Disability Class: Self-Care Difficulty
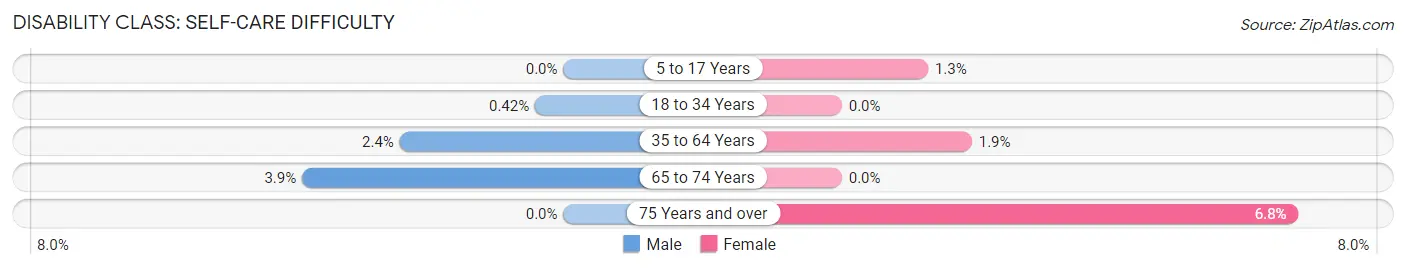
| Age Bracket | Male | Female |
| 5 to 17 Years | 0 (0.0%) | 16 (1.3%) |
| 18 to 34 Years | 4 (0.4%) | 0 (0.0%) |
| 35 to 64 Years | 48 (2.4%) | 40 (1.9%) |
| 65 to 74 Years | 8 (3.9%) | 0 (0.0%) |
| 75 Years and over | 0 (0.0%) | 16 (6.8%) |
Technology Access in Flowood
Computing Device Access in Flowood
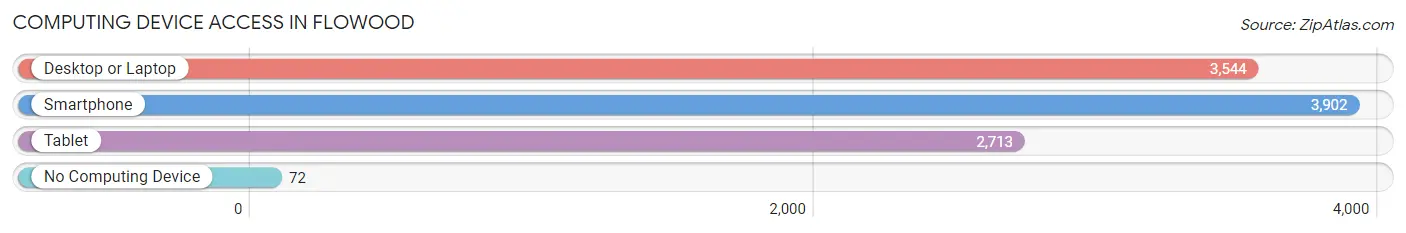
| Device Type | # Households | % Households |
| Desktop or Laptop | 3,544 | 87.0% |
| Smartphone | 3,902 | 95.8% |
| Tablet | 2,713 | 66.6% |
| No Computing Device | 72 | 1.8% |
| Total | 4,073 | 100.0% |
Internet Access in Flowood
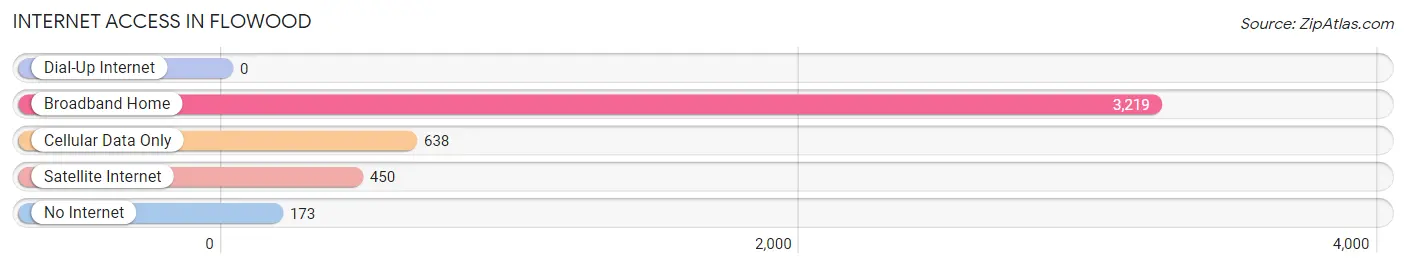
| Internet Type | # Households | % Households |
| Dial-Up Internet | 0 | 0.0% |
| Broadband Home | 3,219 | 79.0% |
| Cellular Data Only | 638 | 15.7% |
| Satellite Internet | 450 | 11.1% |
| No Internet | 173 | 4.3% |
| Total | 4,073 | 100.0% |
Flowood Summary
History
Flowood, Mississippi is a small city located in Rankin County, just east of the state capital of Jackson. The city was founded in 1837 and was originally known as “The Crossroads” due to its location at the intersection of two major roads. The city was officially incorporated in 1891 and was named after the nearby Flowood Creek.
The city of Flowood has a rich history that is closely tied to the development of the state of Mississippi. During the Civil War, the city was the site of a major battle between Union and Confederate forces. After the war, the city experienced a period of growth and development, becoming a major hub for the cotton industry. The city was also home to several prominent businesses, including a cotton gin, a sawmill, and a brickyard.
In the early 20th century, the city experienced a period of decline as the cotton industry moved away from the area. However, in the 1950s, the city began to experience a resurgence as new businesses and industries moved into the area. Today, Flowood is a thriving city with a population of over 8,000 people.
Geography
Flowood is located in Rankin County, Mississippi, just east of the state capital of Jackson. The city is situated on the banks of the Pearl River and is bordered by the cities of Pearl, Richland, and Brandon. The city covers an area of approximately 8.5 square miles and has an elevation of approximately 300 feet.
The city is located in a humid subtropical climate zone, with hot, humid summers and mild winters. The average annual temperature is around 70 degrees Fahrenheit, with an average high of around 90 degrees in the summer and an average low of around 50 degrees in the winter. The city receives an average of around 50 inches of precipitation per year.
Economy
The economy of Flowood is largely based on the service industry. The city is home to several large businesses, including a Walmart Supercenter, a Lowe’s Home Improvement store, and a variety of restaurants and retail stores. The city is also home to several medical facilities, including a hospital and several clinics.
The city is also home to several manufacturing companies, including a furniture manufacturer, a plastics manufacturer, and a metal fabrication company. The city is also home to several technology companies, including a software development company and a telecommunications company.
Demographics
As of the 2010 census, the population of Flowood was 8,092. The racial makeup of the city was 79.3% White, 16.2% African American, 0.4% Native American, 1.2% Asian, 0.1% Pacific Islander, 1.2% from other races, and 1.7% from two or more races. Hispanic or Latino of any race were 3.2% of the population.
The median income for a household in the city was $50,945, and the median income for a family was $60,945. The per capita income for the city was $25,945. About 8.2% of families and 10.2% of the population were below the poverty line, including 14.2% of those under age 18 and 8.2% of those age 65 or over.
Common Questions
What is Per Capita Income in Flowood?
Per Capita income in Flowood is $42,248.
What is the Median Family Income in Flowood?
Median Family Income in Flowood is $114,526.
What is the Median Household income in Flowood?
Median Household Income in Flowood is $89,144.
What is Income or Wage Gap in Flowood?
Income or Wage Gap in Flowood is 31.2%.
Women in Flowood earn 68.8 cents for every dollar earned by a man.
What is Family Income Deficit in Flowood?
Family Income Deficit in Flowood is $18,179.
Families that are below poverty line in Flowood earn $18,179 less on average than the poverty threshold level.
What is Inequality or Gini Index in Flowood?
Inequality or Gini Index in Flowood is 0.42.
What is the Total Population of Flowood?
Total Population of Flowood is 10,204.
What is the Total Male Population of Flowood?
Total Male Population of Flowood is 4,477.
What is the Total Female Population of Flowood?
Total Female Population of Flowood is 5,727.
What is the Ratio of Males per 100 Females in Flowood?
There are 78.17 Males per 100 Females in Flowood.
What is the Ratio of Females per 100 Males in Flowood?
There are 127.92 Females per 100 Males in Flowood.
What is the Median Population Age in Flowood?
Median Population Age in Flowood is 35.4 Years.
What is the Average Family Size in Flowood
Average Family Size in Flowood is 3.0 People.
What is the Average Household Size in Flowood
Average Household Size in Flowood is 2.5 People.
How Large is the Labor Force in Flowood?
There are 5,507 People in the Labor Forcein in Flowood.
What is the Percentage of People in the Labor Force in Flowood?
71.4% of People are in the Labor Force in Flowood.
What is the Unemployment Rate in Flowood?
Unemployment Rate in Flowood is 4.6%.