Ellisville, MS Map & Demographics
Ellisville Map
Ellisville Overview
$17,020
PER CAPITA INCOME
$41,950
AVG FAMILY INCOME
$30,479
AVG HOUSEHOLD INCOME
32.2%
WAGE / INCOME GAP [ % ]
67.8¢/ $1
WAGE / INCOME GAP [ $ ]
$15,870
FAMILY INCOME DEFICIT
0.54
INEQUALITY / GINI INDEX
4,615
TOTAL POPULATION
2,171
MALE POPULATION
2,444
FEMALE POPULATION
88.83
MALES / 100 FEMALES
112.57
FEMALES / 100 MALES
36.0
MEDIAN AGE
3.8
AVG FAMILY SIZE
2.5
AVG HOUSEHOLD SIZE
1,352
LABOR FORCE [ PEOPLE ]
36.4%
PERCENT IN LABOR FORCE
9.3%
UNEMPLOYMENT RATE
Ellisville Zip Codes
Ellisville Area Codes
Income in Ellisville
Income Overview in Ellisville
Per Capita Income in Ellisville is $17,020, while median incomes of families and households are $41,950 and $30,479 respectively.
| Characteristic | Number | Measure |
| Per Capita Income | 4,615 | $17,020 |
| Median Family Income | 680 | $41,950 |
| Mean Family Income | 680 | $56,626 |
| Median Household Income | 1,296 | $30,479 |
| Mean Household Income | 1,296 | $49,365 |
| Income Deficit | 680 | $15,870 |
| Wage / Income Gap (%) | 4,615 | 32.17% |
| Wage / Income Gap ($) | 4,615 | 67.83¢ per $1 |
| Gini / Inequality Index | 4,615 | 0.54 |
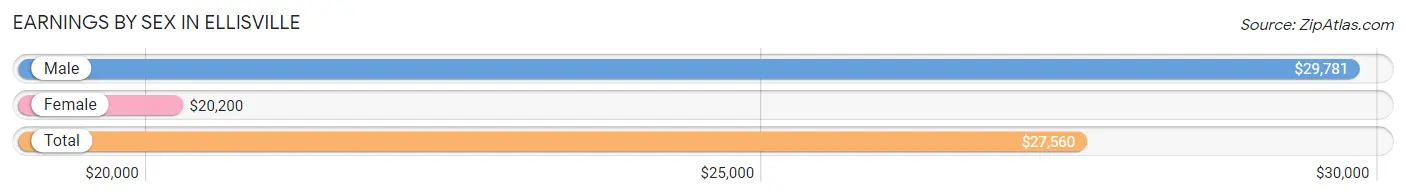
Earnings by Sex in Ellisville
Average Earnings in Ellisville are $27,560, $29,781 for men and $20,200 for women, a difference of 32.2%.
| Sex | Number | Average Earnings |
| Male | 862 (54.5%) | $29,781 |
| Female | 720 (45.5%) | $20,200 |
| Total | 1,582 (100.0%) | $27,560 |
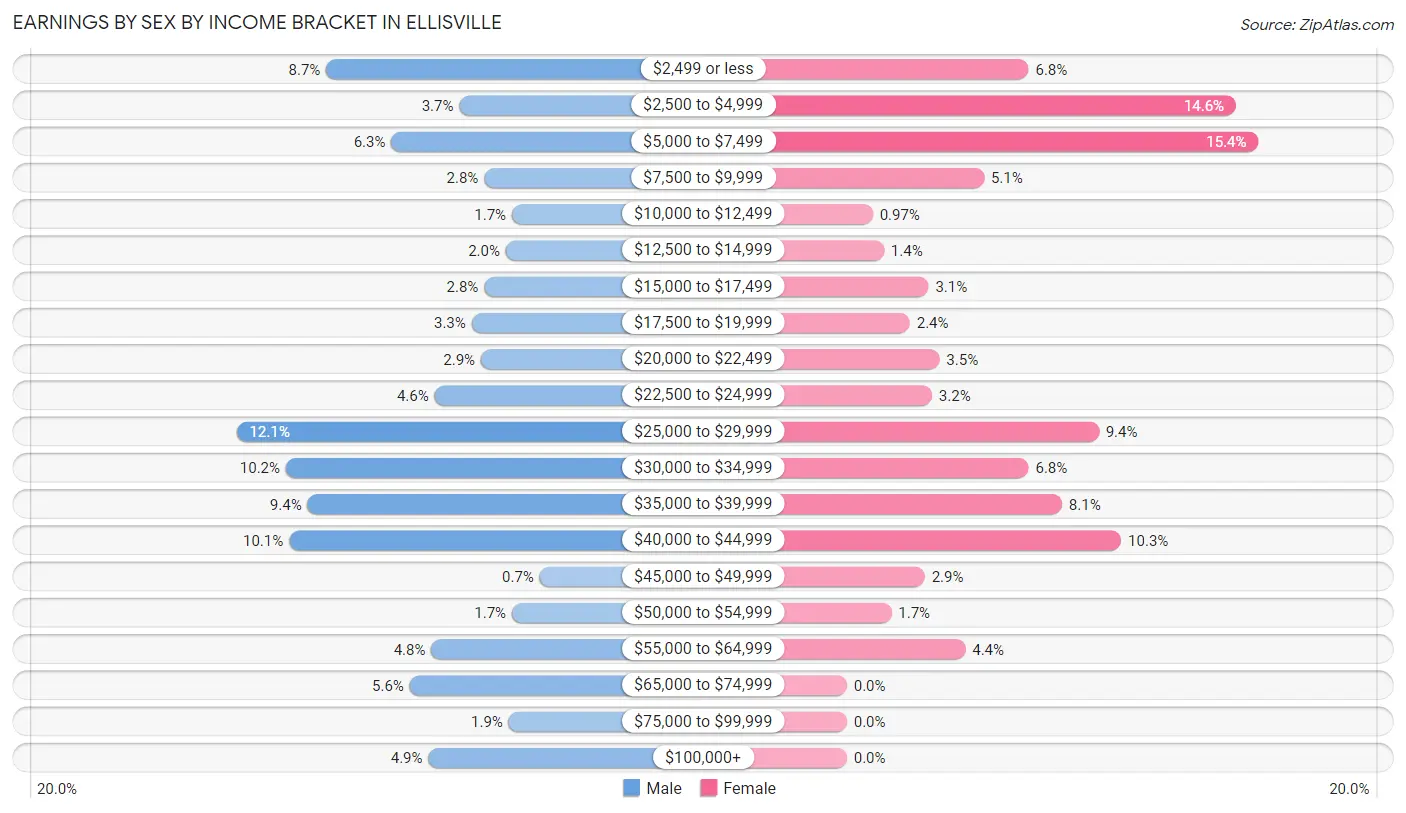
Earnings by Sex by Income Bracket in Ellisville
The most common earnings brackets in Ellisville are $25,000 to $29,999 for men (104 | 12.1%) and $5,000 to $7,499 for women (111 | 15.4%).
| Income | Male | Female |
| $2,499 or less | 75 (8.7%) | 49 (6.8%) |
| $2,500 to $4,999 | 32 (3.7%) | 105 (14.6%) |
| $5,000 to $7,499 | 54 (6.3%) | 111 (15.4%) |
| $7,500 to $9,999 | 24 (2.8%) | 37 (5.1%) |
| $10,000 to $12,499 | 15 (1.7%) | 7 (1.0%) |
| $12,500 to $14,999 | 17 (2.0%) | 10 (1.4%) |
| $15,000 to $17,499 | 24 (2.8%) | 22 (3.1%) |
| $17,500 to $19,999 | 28 (3.3%) | 17 (2.4%) |
| $20,000 to $22,499 | 25 (2.9%) | 25 (3.5%) |
| $22,500 to $24,999 | 40 (4.6%) | 23 (3.2%) |
| $25,000 to $29,999 | 104 (12.1%) | 68 (9.4%) |
| $30,000 to $34,999 | 88 (10.2%) | 49 (6.8%) |
| $35,000 to $39,999 | 81 (9.4%) | 58 (8.1%) |
| $40,000 to $44,999 | 87 (10.1%) | 74 (10.3%) |
| $45,000 to $49,999 | 6 (0.7%) | 21 (2.9%) |
| $50,000 to $54,999 | 15 (1.7%) | 12 (1.7%) |
| $55,000 to $64,999 | 41 (4.8%) | 32 (4.4%) |
| $65,000 to $74,999 | 48 (5.6%) | 0 (0.0%) |
| $75,000 to $99,999 | 16 (1.9%) | 0 (0.0%) |
| $100,000+ | 42 (4.9%) | 0 (0.0%) |
| Total | 862 (100.0%) | 720 (100.0%) |
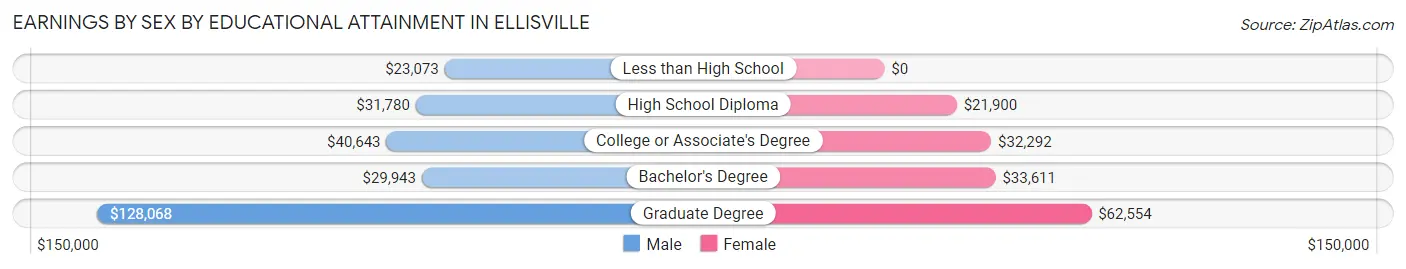
Earnings by Sex by Educational Attainment in Ellisville
Average earnings in Ellisville are $33,500 for men and $33,393 for women, a difference of 0.3%. Men with an educational attainment of graduate degree enjoy the highest average annual earnings of $128,068, while those with less than high school education earn the least with $23,073. Women with an educational attainment of graduate degree earn the most with the average annual earnings of $62,554, while those with high school diploma education have the smallest earnings of $21,900.
| Educational Attainment | Male Income | Female Income |
| Less than High School | $23,073 | $0 |
| High School Diploma | $31,780 | $21,900 |
| College or Associate's Degree | $40,643 | $32,292 |
| Bachelor's Degree | $29,943 | $33,611 |
| Graduate Degree | $128,068 | $62,554 |
| Total | $33,500 | $33,393 |
Family Income in Ellisville
Family Income Brackets in Ellisville
According to the Ellisville family income data, there are 147 families falling into the $15,000 to $24,999 income range, which is the most common income bracket and makes up 21.6% of all families.
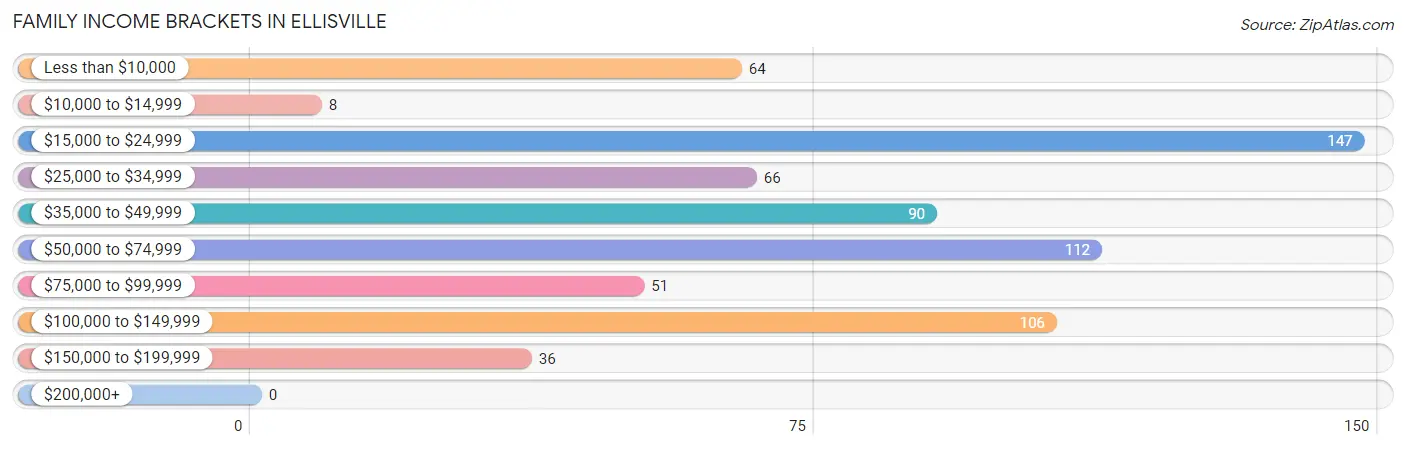
| Income Bracket | # Families | % Families |
| Less than $10,000 | 64 | 9.4% |
| $10,000 to $14,999 | 8 | 1.2% |
| $15,000 to $24,999 | 147 | 21.6% |
| $25,000 to $34,999 | 66 | 9.7% |
| $35,000 to $49,999 | 90 | 13.2% |
| $50,000 to $74,999 | 112 | 16.5% |
| $75,000 to $99,999 | 51 | 7.5% |
| $100,000 to $149,999 | 106 | 15.6% |
| $150,000 to $199,999 | 36 | 5.3% |
| $200,000+ | 0 | 0.0% |
Family Income by Famaliy Size in Ellisville
5-person families (76 | 11.2%) account for the highest median family income in Ellisville with $125,217 per family, while 5-person families (76 | 11.2%) have the highest median income of $25,043 per family member.
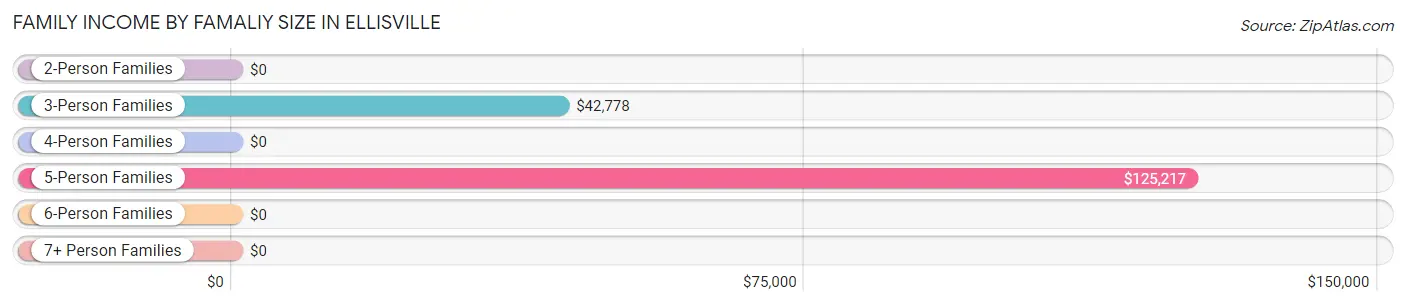
| Income Bracket | # Families | Median Income |
| 2-Person Families | 312 (45.9%) | $0 |
| 3-Person Families | 120 (17.6%) | $42,778 |
| 4-Person Families | 128 (18.8%) | $0 |
| 5-Person Families | 76 (11.2%) | $125,217 |
| 6-Person Families | 26 (3.8%) | $0 |
| 7+ Person Families | 18 (2.6%) | $0 |
| Total | 680 (100.0%) | $41,950 |
Family Income by Number of Earners in Ellisville

| Number of Earners | # Families | Median Income |
| No Earners | 197 (29.0%) | $21,673 |
| 1 Earner | 256 (37.7%) | $38,281 |
| 2 Earners | 165 (24.3%) | $103,021 |
| 3+ Earners | 62 (9.1%) | $0 |
| Total | 680 (100.0%) | $41,950 |
Household Income in Ellisville
Household Income Brackets in Ellisville
With 281 households falling in the category, the $10,000 to $14,999 income range is the most frequent in Ellisville, accounting for 21.7% of all households. In contrast, only 9 households (0.7%) fall into the $200,000+ income bracket, making it the least populous group.
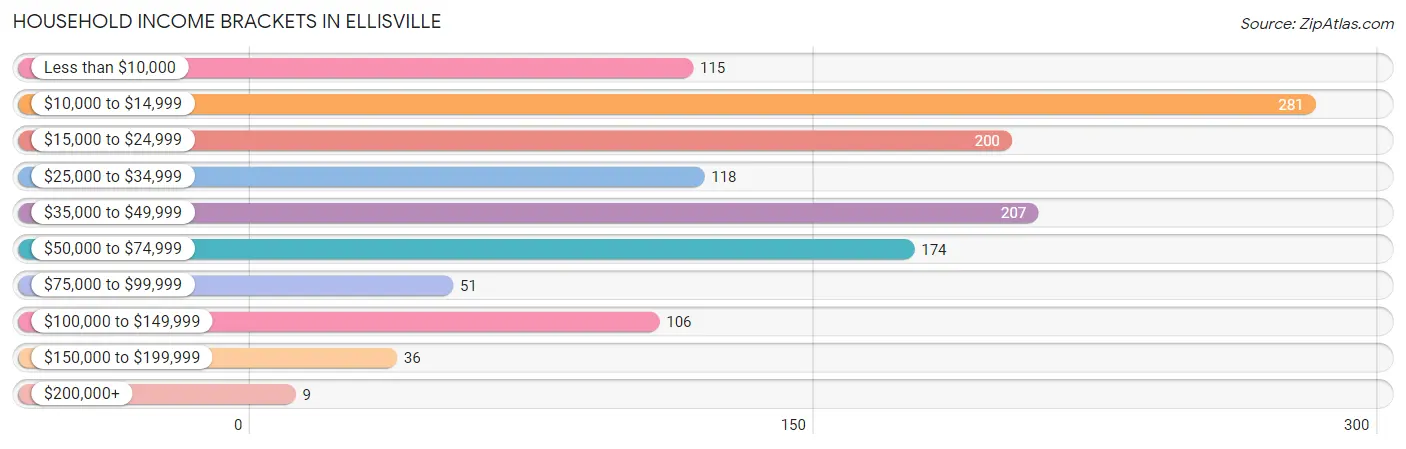
| Income Bracket | # Households | % Households |
| Less than $10,000 | 115 | 8.9% |
| $10,000 to $14,999 | 281 | 21.7% |
| $15,000 to $24,999 | 200 | 15.4% |
| $25,000 to $34,999 | 118 | 9.1% |
| $35,000 to $49,999 | 207 | 16.0% |
| $50,000 to $74,999 | 174 | 13.4% |
| $75,000 to $99,999 | 51 | 3.9% |
| $100,000 to $149,999 | 106 | 8.2% |
| $150,000 to $199,999 | 36 | 2.8% |
| $200,000+ | 9 | 0.7% |
Household Income by Householder Age in Ellisville
The median household income in Ellisville is $30,479, with the highest median household income of $41,677 found in the 25 to 44 years age bracket for the primary householder. A total of 326 households (25.2%) fall into this category. Meanwhile, the 15 to 24 years age bracket for the primary householder has the lowest median household income of $0, with 41 households (3.2%) in this group.
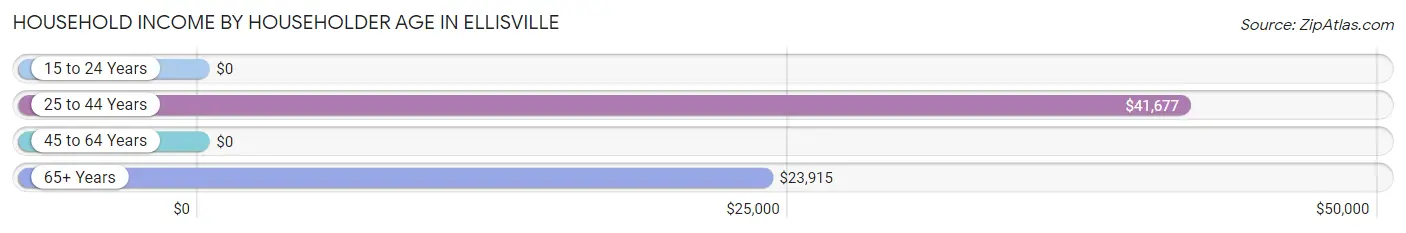
| Income Bracket | # Households | Median Income |
| 15 to 24 Years | 41 (3.2%) | $0 |
| 25 to 44 Years | 326 (25.2%) | $41,677 |
| 45 to 64 Years | 502 (38.7%) | $0 |
| 65+ Years | 427 (33.0%) | $23,915 |
| Total | 1,296 (100.0%) | $30,479 |
Poverty in Ellisville
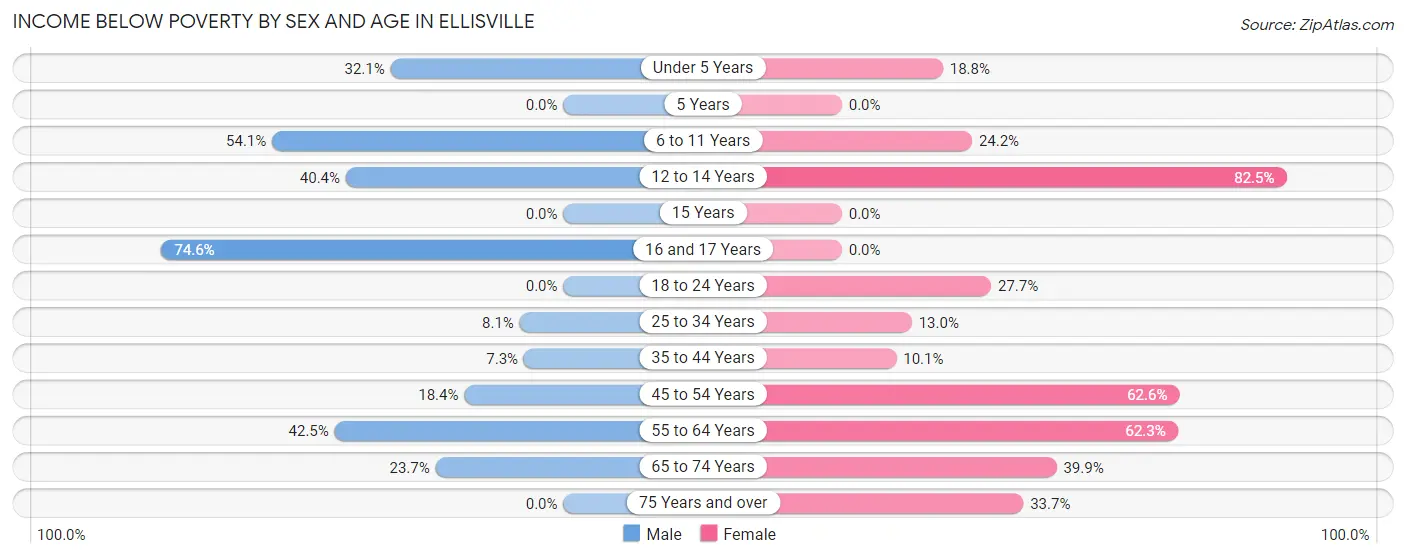
Income Below Poverty by Sex and Age in Ellisville
With 26.3% poverty level for males and 36.3% for females among the residents of Ellisville, 16 and 17 year old males and 12 to 14 year old females are the most vulnerable to poverty, with 47 males (74.6%) and 33 females (82.5%) in their respective age groups living below the poverty level.
| Age Bracket | Male | Female |
| Under 5 Years | 17 (32.1%) | 30 (18.8%) |
| 5 Years | 0 (0.0%) | 0 (0.0%) |
| 6 to 11 Years | 153 (54.1%) | 43 (24.2%) |
| 12 to 14 Years | 44 (40.4%) | 33 (82.5%) |
| 15 Years | 0 (0.0%) | 0 (0.0%) |
| 16 and 17 Years | 47 (74.6%) | 0 (0.0%) |
| 18 to 24 Years | 0 (0.0%) | 46 (27.7%) |
| 25 to 34 Years | 9 (8.1%) | 17 (13.0%) |
| 35 to 44 Years | 21 (7.3%) | 18 (10.1%) |
| 45 to 54 Years | 48 (18.4%) | 119 (62.6%) |
| 55 to 64 Years | 76 (42.5%) | 205 (62.3%) |
| 65 to 74 Years | 28 (23.7%) | 104 (39.9%) |
| 75 Years and over | 0 (0.0%) | 64 (33.7%) |
| Total | 443 (26.3%) | 679 (36.3%) |
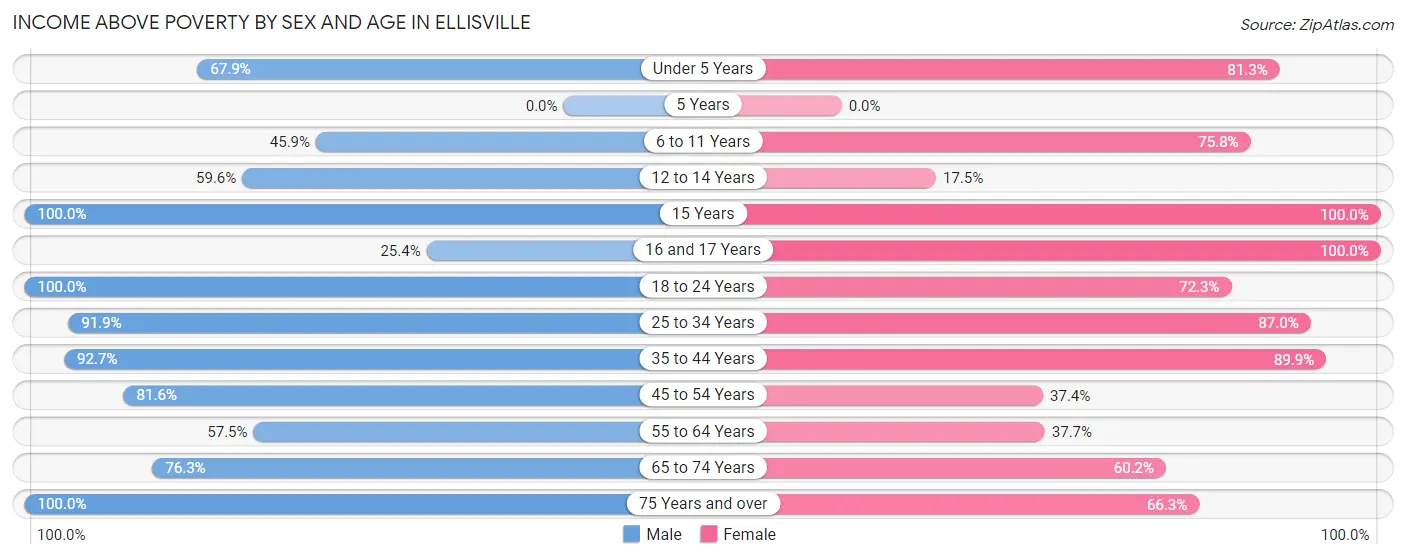
Income Above Poverty by Sex and Age in Ellisville
According to the poverty statistics in Ellisville, males aged 15 years and females aged 15 years are the age groups that are most secure financially, with 100.0% of males and 100.0% of females in these age groups living above the poverty line.
| Age Bracket | Male | Female |
| Under 5 Years | 36 (67.9%) | 130 (81.2%) |
| 5 Years | 0 (0.0%) | 0 (0.0%) |
| 6 to 11 Years | 130 (45.9%) | 135 (75.8%) |
| 12 to 14 Years | 65 (59.6%) | 7 (17.5%) |
| 15 Years | 56 (100.0%) | 10 (100.0%) |
| 16 and 17 Years | 16 (25.4%) | 35 (100.0%) |
| 18 to 24 Years | 48 (100.0%) | 120 (72.3%) |
| 25 to 34 Years | 102 (91.9%) | 114 (87.0%) |
| 35 to 44 Years | 266 (92.7%) | 160 (89.9%) |
| 45 to 54 Years | 213 (81.6%) | 71 (37.4%) |
| 55 to 64 Years | 103 (57.5%) | 124 (37.7%) |
| 65 to 74 Years | 90 (76.3%) | 157 (60.2%) |
| 75 Years and over | 116 (100.0%) | 126 (66.3%) |
| Total | 1,241 (73.7%) | 1,189 (63.6%) |
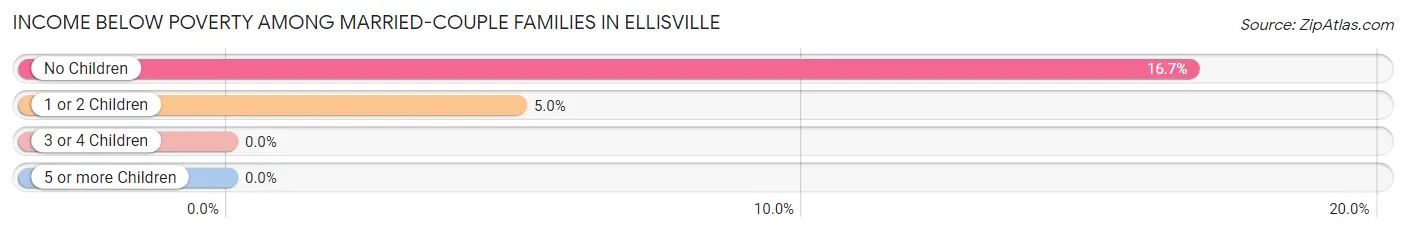
Income Below Poverty Among Married-Couple Families in Ellisville
The poverty statistics for married-couple families in Ellisville show that 11.5% or 51 of the total 443 families live below the poverty line. Families with no children have the highest poverty rate of 16.7%, comprising of 43 families. On the other hand, families with 3 or 4 children have the lowest poverty rate of 0.0%, which includes 0 families.
| Children | Above Poverty | Below Poverty |
| No Children | 214 (83.3%) | 43 (16.7%) |
| 1 or 2 Children | 151 (95.0%) | 8 (5.0%) |
| 3 or 4 Children | 27 (100.0%) | 0 (0.0%) |
| 5 or more Children | 0 (0.0%) | 0 (0.0%) |
| Total | 392 (88.5%) | 51 (11.5%) |
Income Below Poverty Among Single-Parent Households in Ellisville
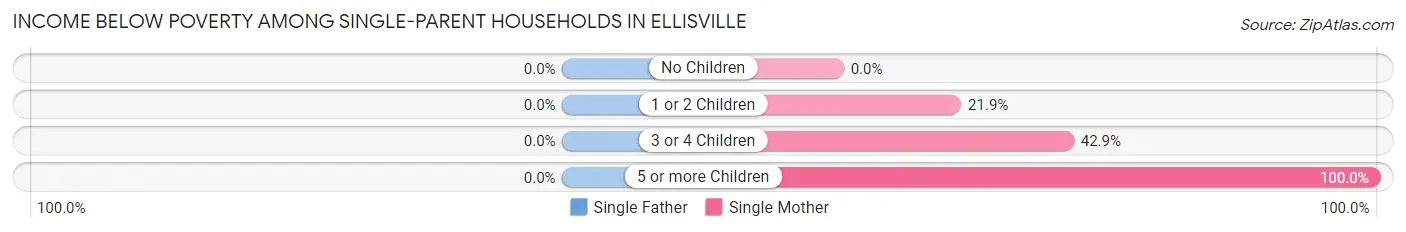
| Children | Single Father | Single Mother |
| No Children | 0 (0.0%) | 0 (0.0%) |
| 1 or 2 Children | 0 (0.0%) | 7 (21.9%) |
| 3 or 4 Children | 0 (0.0%) | 18 (42.9%) |
| 5 or more Children | 0 (0.0%) | 17 (100.0%) |
| Total | 0 (0.0%) | 42 (24.6%) |
Income Below Poverty Among Married-Couple vs Single-Parent Households in Ellisville
The poverty data for Ellisville shows that 51 of the married-couple family households (11.5%) and 42 of the single-parent households (17.7%) are living below the poverty level. Within the married-couple family households, those with no children have the highest poverty rate, with 43 households (16.7%) falling below the poverty line. Among the single-parent households, those with 5 or more children have the highest poverty rate, with 17 household (100.0%) living below poverty.
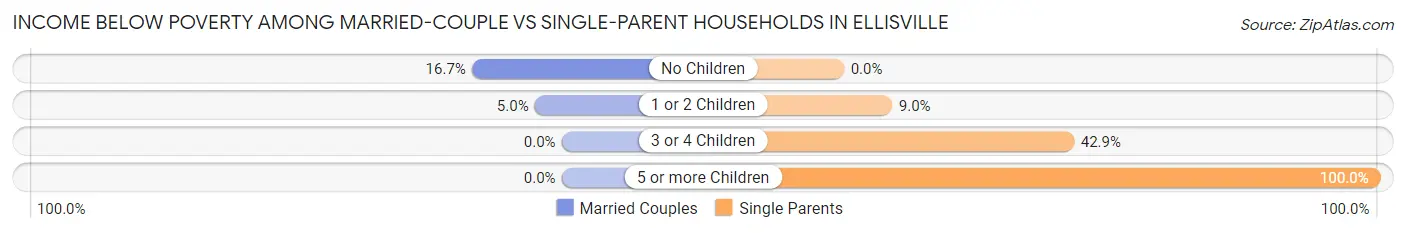
| Children | Married-Couple Families | Single-Parent Households |
| No Children | 43 (16.7%) | 0 (0.0%) |
| 1 or 2 Children | 8 (5.0%) | 7 (9.0%) |
| 3 or 4 Children | 0 (0.0%) | 18 (42.9%) |
| 5 or more Children | 0 (0.0%) | 17 (100.0%) |
| Total | 51 (11.5%) | 42 (17.7%) |
Race in Ellisville
The most populous races in Ellisville are White / Caucasian (2,740 | 59.4%), Black / African American (1,741 | 37.7%), and Hispanic or Latino (464 | 10.1%).
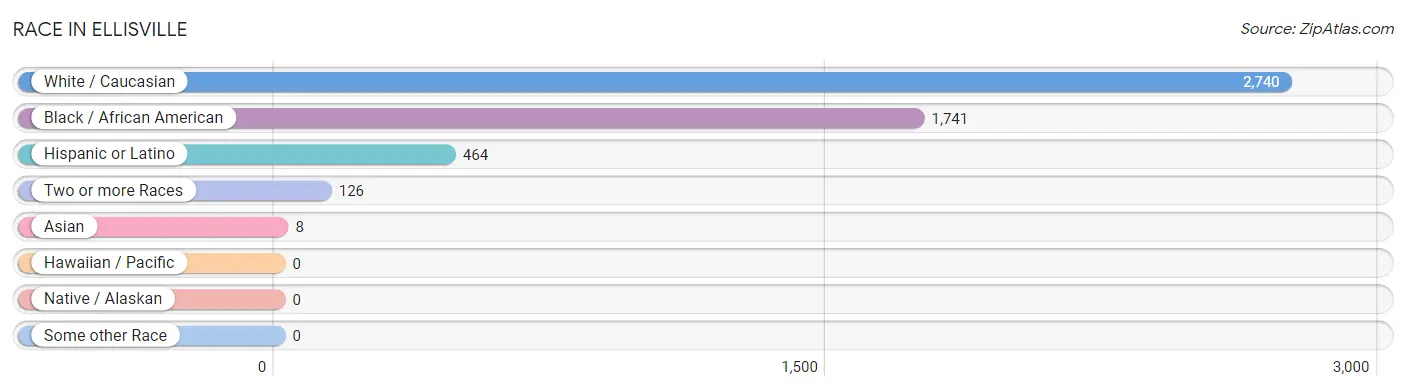
| Race | # Population | % Population |
| Asian | 8 | 0.2% |
| Black / African American | 1,741 | 37.7% |
| Hawaiian / Pacific | 0 | 0.0% |
| Hispanic or Latino | 464 | 10.1% |
| Native / Alaskan | 0 | 0.0% |
| White / Caucasian | 2,740 | 59.4% |
| Two or more Races | 126 | 2.7% |
| Some other Race | 0 | 0.0% |
| Total | 4,615 | 100.0% |
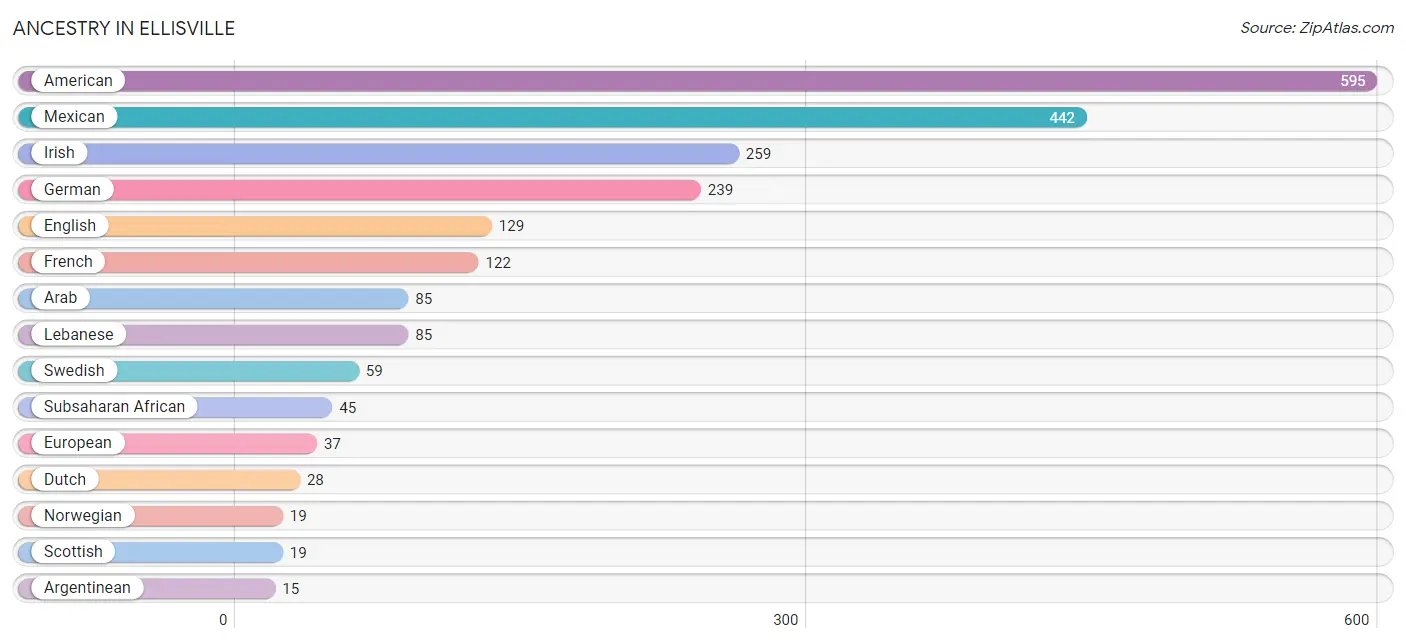
Ancestry in Ellisville
The most populous ancestries reported in Ellisville are American (595 | 12.9%), Mexican (442 | 9.6%), Irish (259 | 5.6%), German (239 | 5.2%), and English (129 | 2.8%), together accounting for 36.1% of all Ellisville residents.
| Ancestry | # Population | % Population |
| African | 9 | 0.2% |
| American | 595 | 12.9% |
| Arab | 85 | 1.8% |
| Argentinean | 15 | 0.3% |
| Czech | 15 | 0.3% |
| Dutch | 28 | 0.6% |
| English | 129 | 2.8% |
| European | 37 | 0.8% |
| French | 122 | 2.6% |
| German | 239 | 5.2% |
| Greek | 8 | 0.2% |
| Haitian | 11 | 0.2% |
| Irish | 259 | 5.6% |
| Italian | 10 | 0.2% |
| Lebanese | 85 | 1.8% |
| Mexican | 442 | 9.6% |
| Nigerian | 10 | 0.2% |
| Norwegian | 19 | 0.4% |
| Puerto Rican | 7 | 0.2% |
| Scotch-Irish | 9 | 0.2% |
| Scottish | 19 | 0.4% |
| South American | 15 | 0.3% |
| Sri Lankan | 3 | 0.1% |
| Subsaharan African | 45 | 1.0% |
| Swedish | 59 | 1.3% |
| Thai | 5 | 0.1% |
| Welsh | 9 | 0.2% | View All 27 Rows |
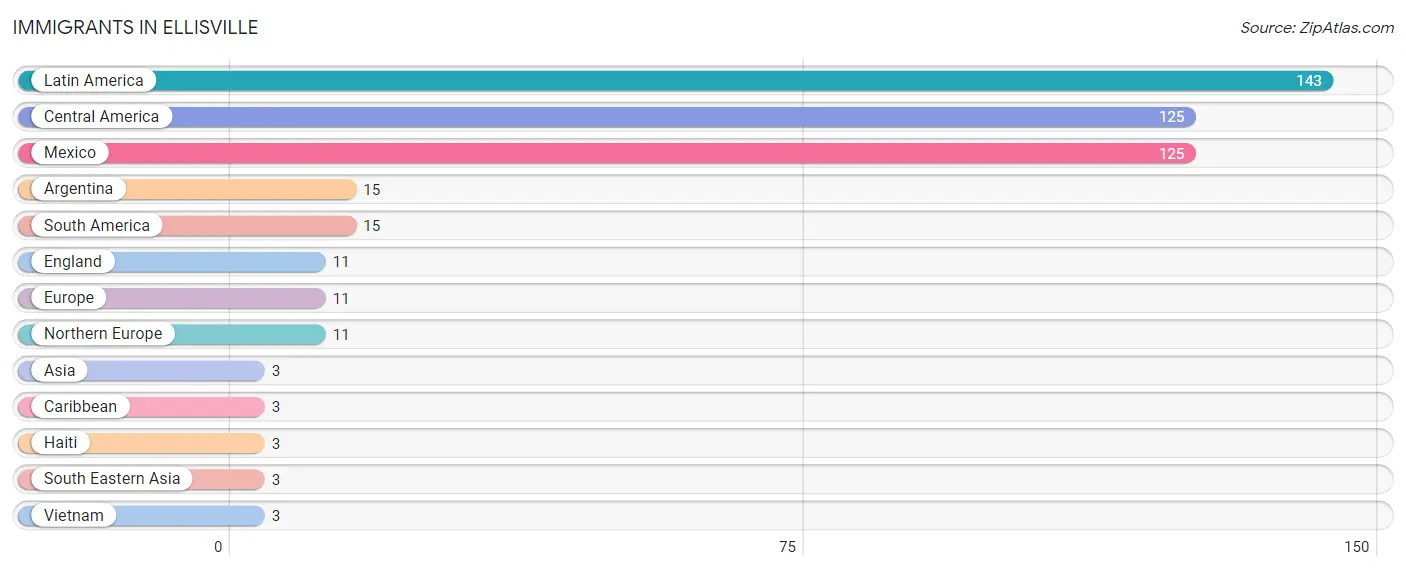
Immigrants in Ellisville
The most numerous immigrant groups reported in Ellisville came from Latin America (143 | 3.1%), Central America (125 | 2.7%), Mexico (125 | 2.7%), Argentina (15 | 0.3%), and South America (15 | 0.3%), together accounting for 9.2% of all Ellisville residents.
| Immigration Origin | # Population | % Population |
| Argentina | 15 | 0.3% |
| Asia | 3 | 0.1% |
| Caribbean | 3 | 0.1% |
| Central America | 125 | 2.7% |
| England | 11 | 0.2% |
| Europe | 11 | 0.2% |
| Haiti | 3 | 0.1% |
| Latin America | 143 | 3.1% |
| Mexico | 125 | 2.7% |
| Northern Europe | 11 | 0.2% |
| South America | 15 | 0.3% |
| South Eastern Asia | 3 | 0.1% |
| Vietnam | 3 | 0.1% | View All 13 Rows |
Sex and Age in Ellisville
Sex and Age in Ellisville
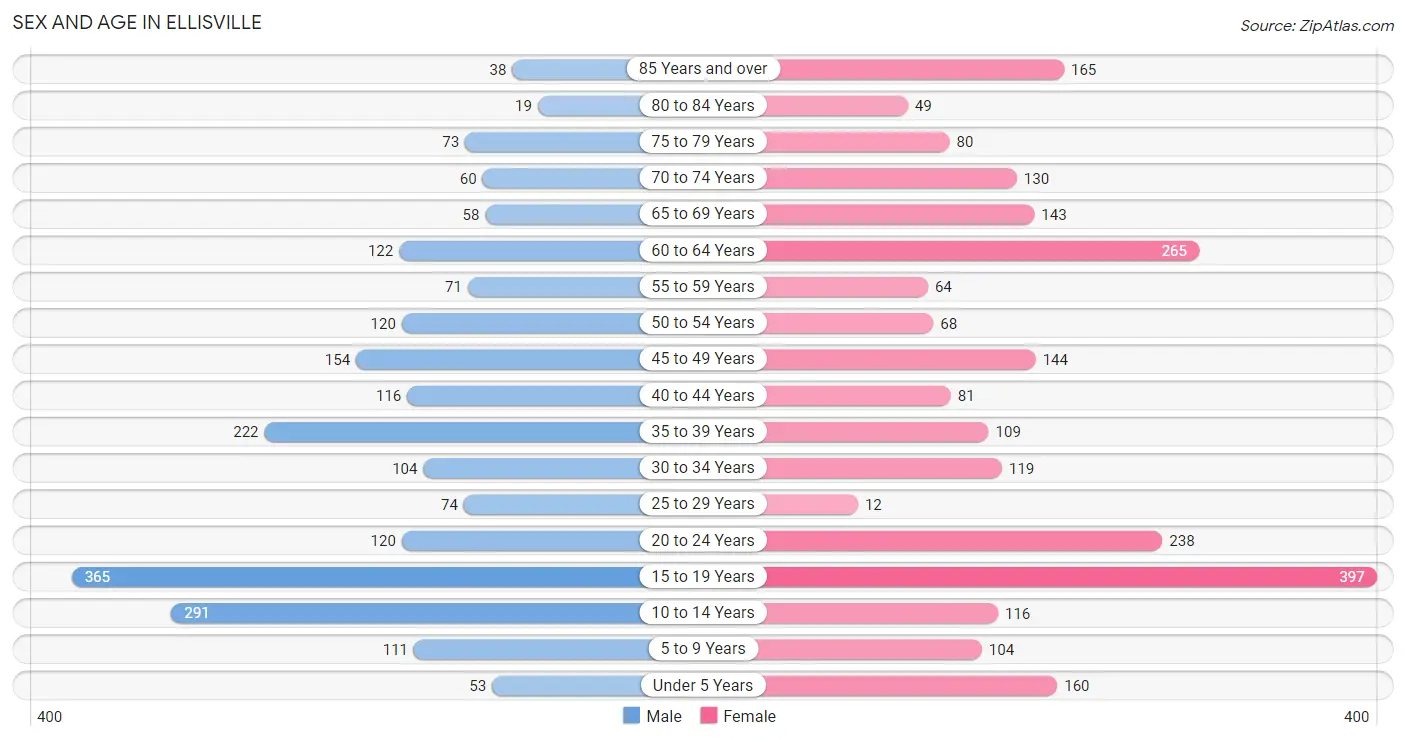
The most populous age groups in Ellisville are 15 to 19 Years (365 | 16.8%) for men and 15 to 19 Years (397 | 16.2%) for women.
| Age Bracket | Male | Female |
| Under 5 Years | 53 (2.4%) | 160 (6.6%) |
| 5 to 9 Years | 111 (5.1%) | 104 (4.3%) |
| 10 to 14 Years | 291 (13.4%) | 116 (4.8%) |
| 15 to 19 Years | 365 (16.8%) | 397 (16.2%) |
| 20 to 24 Years | 120 (5.5%) | 238 (9.7%) |
| 25 to 29 Years | 74 (3.4%) | 12 (0.5%) |
| 30 to 34 Years | 104 (4.8%) | 119 (4.9%) |
| 35 to 39 Years | 222 (10.2%) | 109 (4.5%) |
| 40 to 44 Years | 116 (5.3%) | 81 (3.3%) |
| 45 to 49 Years | 154 (7.1%) | 144 (5.9%) |
| 50 to 54 Years | 120 (5.5%) | 68 (2.8%) |
| 55 to 59 Years | 71 (3.3%) | 64 (2.6%) |
| 60 to 64 Years | 122 (5.6%) | 265 (10.8%) |
| 65 to 69 Years | 58 (2.7%) | 143 (5.9%) |
| 70 to 74 Years | 60 (2.8%) | 130 (5.3%) |
| 75 to 79 Years | 73 (3.4%) | 80 (3.3%) |
| 80 to 84 Years | 19 (0.9%) | 49 (2.0%) |
| 85 Years and over | 38 (1.8%) | 165 (6.8%) |
| Total | 2,171 (100.0%) | 2,444 (100.0%) |
Families and Households in Ellisville
Median Family Size in Ellisville
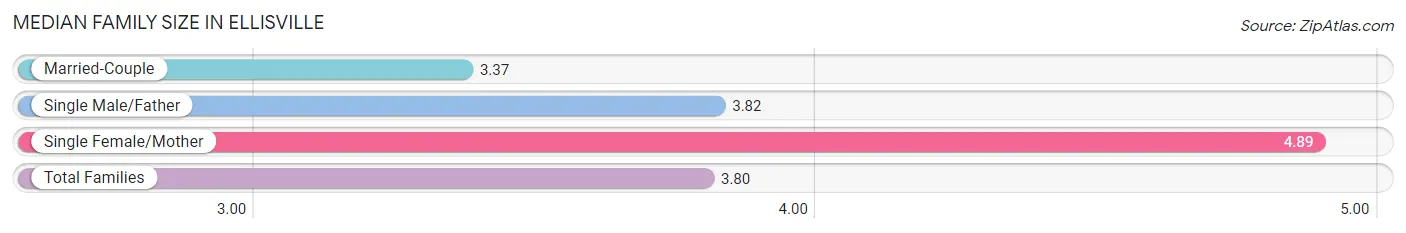
The median family size in Ellisville is 3.80 persons per family, with single female/mother families (171 | 25.2%) accounting for the largest median family size of 4.89 persons per family. On the other hand, married-couple families (443 | 65.1%) represent the smallest median family size with 3.37 persons per family.
| Family Type | # Families | Family Size |
| Married-Couple | 443 (65.1%) | 3.37 |
| Single Male/Father | 66 (9.7%) | 3.82 |
| Single Female/Mother | 171 (25.2%) | 4.89 |
| Total Families | 680 (100.0%) | 3.80 |
Median Household Size in Ellisville
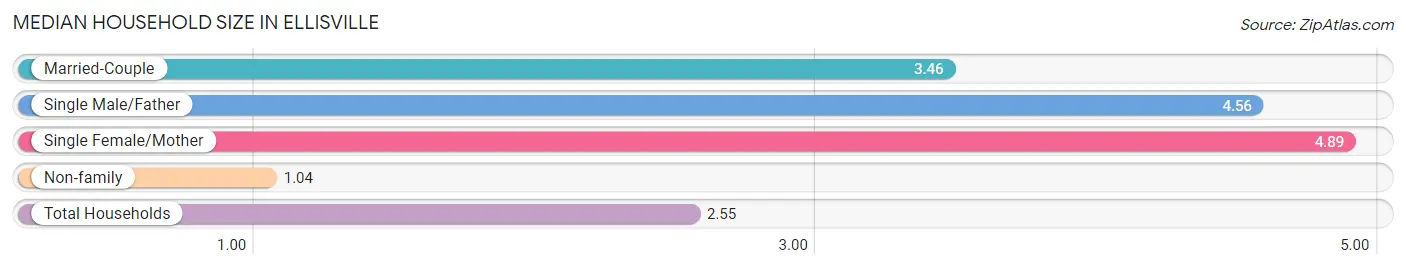
The median household size in Ellisville is 2.55 persons per household, with single female/mother households (171 | 13.2%) accounting for the largest median household size of 4.89 persons per household. non-family households (616 | 47.5%) represent the smallest median household size with 1.04 persons per household.
| Household Type | # Households | Household Size |
| Married-Couple | 443 (34.2%) | 3.46 |
| Single Male/Father | 66 (5.1%) | 4.56 |
| Single Female/Mother | 171 (13.2%) | 4.89 |
| Non-family | 616 (47.5%) | 1.04 |
| Total Households | 1,296 (100.0%) | 2.55 |
Household Size by Marriage Status in Ellisville
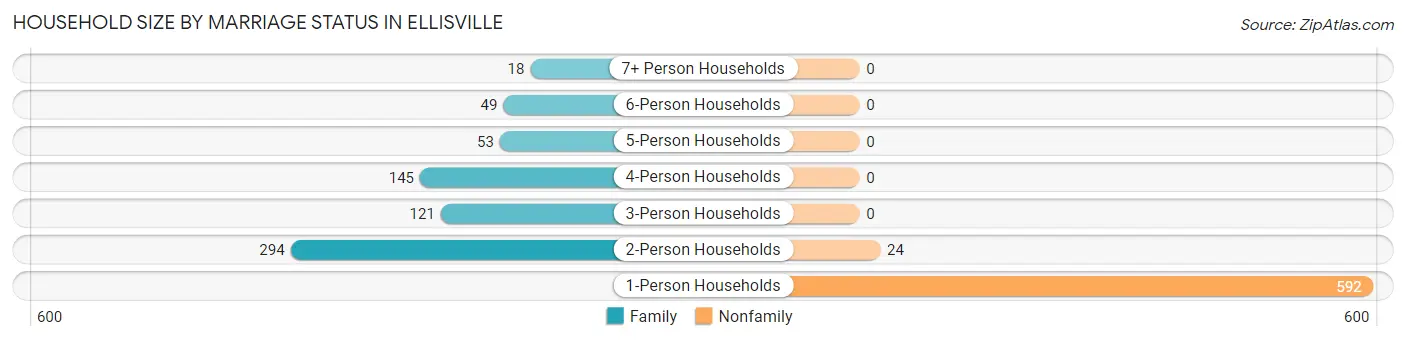
Out of a total of 1,296 households in Ellisville, 680 (52.5%) are family households, while 616 (47.5%) are nonfamily households. The most numerous type of family households are 2-person households, comprising 294, and the most common type of nonfamily households are 1-person households, comprising 592.
| Household Size | Family Households | Nonfamily Households |
| 1-Person Households | - | 592 (45.7%) |
| 2-Person Households | 294 (22.7%) | 24 (1.8%) |
| 3-Person Households | 121 (9.3%) | 0 (0.0%) |
| 4-Person Households | 145 (11.2%) | 0 (0.0%) |
| 5-Person Households | 53 (4.1%) | 0 (0.0%) |
| 6-Person Households | 49 (3.8%) | 0 (0.0%) |
| 7+ Person Households | 18 (1.4%) | 0 (0.0%) |
| Total | 680 (52.5%) | 616 (47.5%) |
Female Fertility in Ellisville
Fertility by Age in Ellisville
Average fertility rate in Ellisville is 25.0 births per 1,000 women. Women in the age bracket of 35 to 50 years have the highest fertility rate with 80.0 births per 1,000 women. Women in the age bracket of 35 to 50 years acount for 100.0% of all women with births.
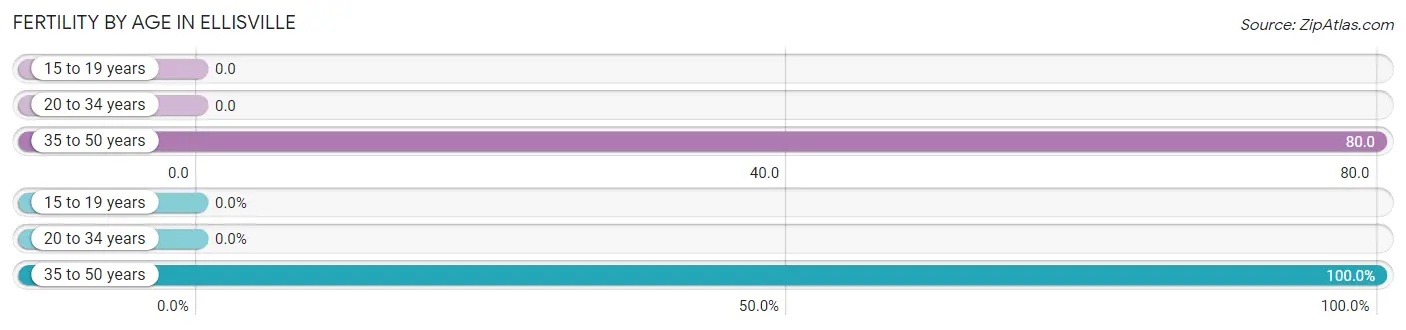
| Age Bracket | Women with Births | Births / 1,000 Women |
| 15 to 19 years | 0 (0.0%) | 0.0 |
| 20 to 34 years | 0 (0.0%) | 0.0 |
| 35 to 50 years | 28 (100.0%) | 80.0 |
| Total | 28 (100.0%) | 25.0 |
Fertility by Age by Marriage Status in Ellisville
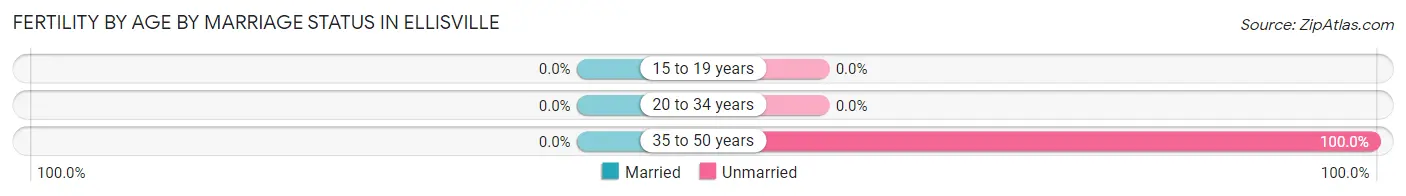
| Age Bracket | Married | Unmarried |
| 15 to 19 years | 0 (0.0%) | 0 (0.0%) |
| 20 to 34 years | 0 (0.0%) | 0 (0.0%) |
| 35 to 50 years | 0 (0.0%) | 28 (100.0%) |
| Total | 0 (0.0%) | 28 (100.0%) |
Fertility by Education in Ellisville
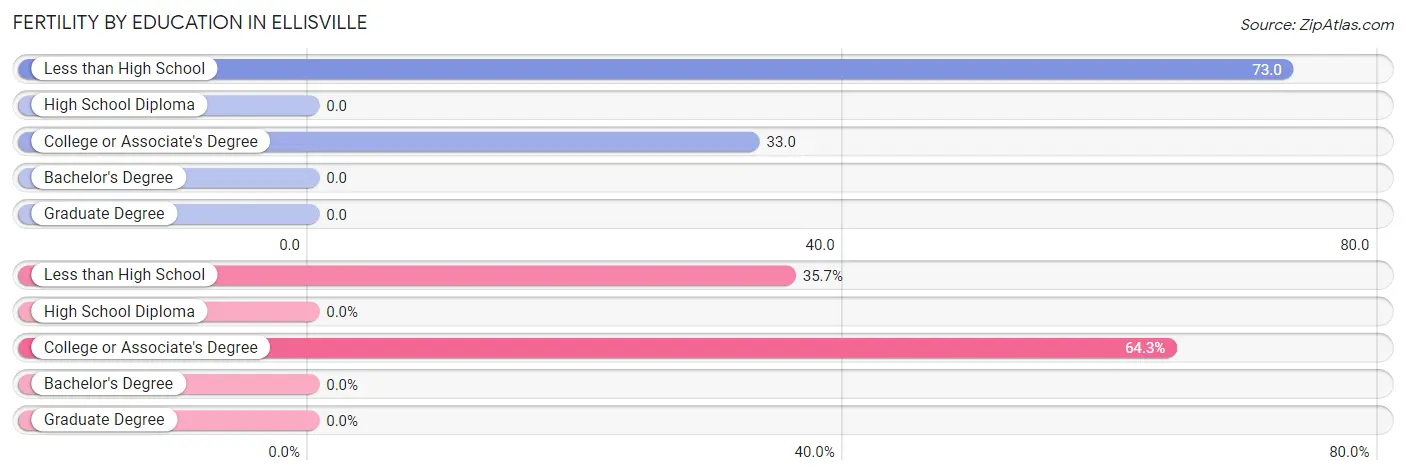
| Educational Attainment | Women with Births | Births / 1,000 Women |
| Less than High School | 10 (35.7%) | 73.0 |
| High School Diploma | 0 (0.0%) | 0.0 |
| College or Associate's Degree | 18 (64.3%) | 33.0 |
| Bachelor's Degree | 0 (0.0%) | 0.0 |
| Graduate Degree | 0 (0.0%) | 0.0 |
| Total | 28 (100.0%) | 25.0 |
Fertility by Education by Marriage Status in Ellisville
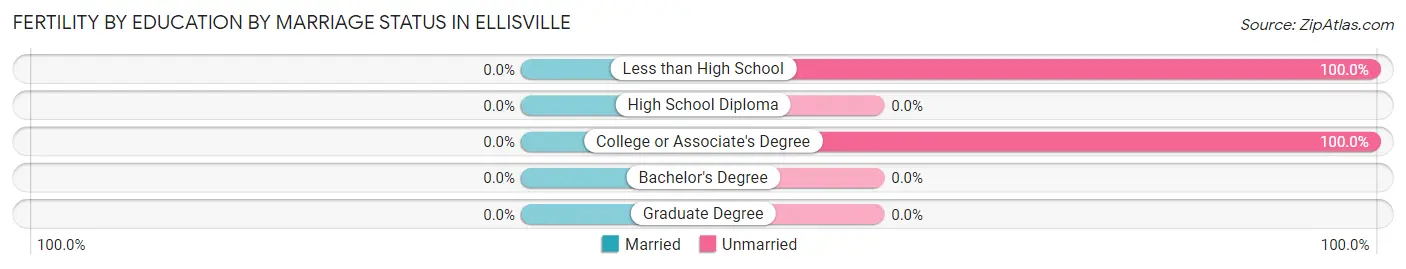
| Educational Attainment | Married | Unmarried |
| Less than High School | 0 (0.0%) | 10 (100.0%) |
| High School Diploma | 0 (0.0%) | 0 (0.0%) |
| College or Associate's Degree | 0 (0.0%) | 18 (100.0%) |
| Bachelor's Degree | 0 (0.0%) | 0 (0.0%) |
| Graduate Degree | 0 (0.0%) | 0 (0.0%) |
| Total | 0 (0.0%) | 28 (100.0%) |
Employment Characteristics in Ellisville
Employment by Class of Employer in Ellisville
Among the 1,222 employed individuals in Ellisville, private company employees (842 | 68.9%), state government employees (126 | 10.3%), and local government employees (91 | 7.4%) make up the most common classes of employment.
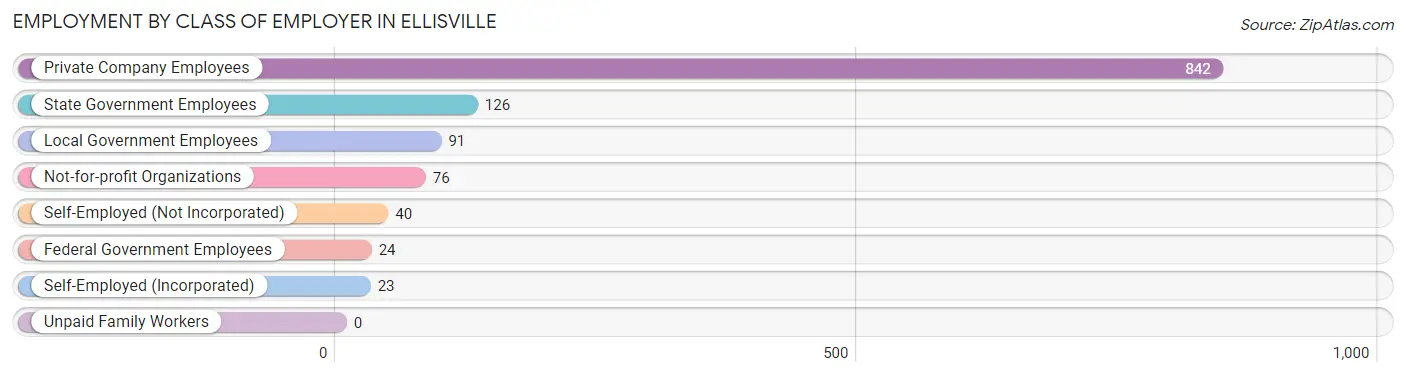
| Employer Class | # Employees | % Employees |
| Private Company Employees | 842 | 68.9% |
| Self-Employed (Incorporated) | 23 | 1.9% |
| Self-Employed (Not Incorporated) | 40 | 3.3% |
| Not-for-profit Organizations | 76 | 6.2% |
| Local Government Employees | 91 | 7.4% |
| State Government Employees | 126 | 10.3% |
| Federal Government Employees | 24 | 2.0% |
| Unpaid Family Workers | 0 | 0.0% |
| Total | 1,222 | 100.0% |
Employment Status by Age in Ellisville
According to the labor force statistics for Ellisville, out of the total population over 16 years of age (3,714), 36.4% or 1,352 individuals are in the labor force, with 9.3% or 126 of them unemployed. The age group with the highest labor force participation rate is 25 to 29 years, with 81.4% or 70 individuals in the labor force. Within the labor force, the 25 to 29 years age range has the highest percentage of unemployed individuals, with 57.1% or 40 of them being unemployed.
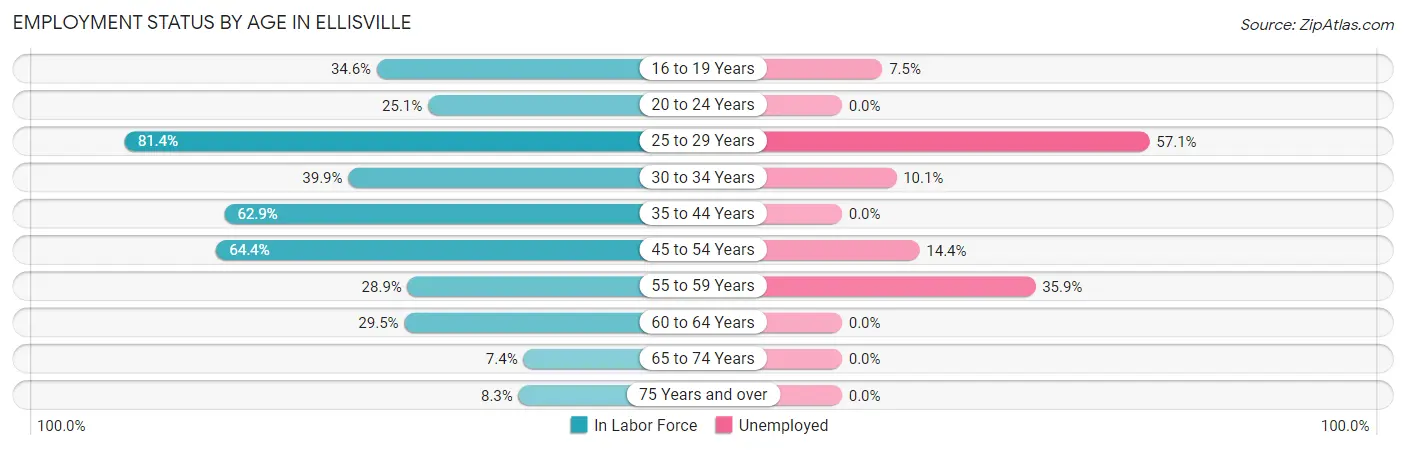
| Age Bracket | In Labor Force | Unemployed |
| 16 to 19 Years | 241 (34.6%) | 18 (7.5%) |
| 20 to 24 Years | 90 (25.1%) | 0 (0.0%) |
| 25 to 29 Years | 70 (81.4%) | 40 (57.1%) |
| 30 to 34 Years | 89 (39.9%) | 9 (10.1%) |
| 35 to 44 Years | 332 (62.9%) | 0 (0.0%) |
| 45 to 54 Years | 313 (64.4%) | 45 (14.4%) |
| 55 to 59 Years | 39 (28.9%) | 14 (35.9%) |
| 60 to 64 Years | 114 (29.5%) | 0 (0.0%) |
| 65 to 74 Years | 29 (7.4%) | 0 (0.0%) |
| 75 Years and over | 35 (8.3%) | 0 (0.0%) |
| Total | 1,352 (36.4%) | 126 (9.3%) |
Employment Status by Educational Attainment in Ellisville
According to labor force statistics for Ellisville, 51.9% of individuals (958) out of the total population between 25 and 64 years of age (1,845) are in the labor force, with 11.3% or 108 of them being unemployed. The group with the highest labor force participation rate are those with the educational attainment of bachelor's degree or higher, with 81.7% or 317 individuals in the labor force. Within the labor force, individuals with high school diploma education have the highest percentage of unemployment, with 31.9% or 76 of them being unemployed.

| Educational Attainment | In Labor Force | Unemployed |
| Less than High School | 94 (36.3%) | 0 (0.0%) |
| High School Diploma | 238 (44.0%) | 173 (31.9%) |
| College / Associate Degree | 308 (46.9%) | 68 (10.4%) |
| Bachelor's Degree or higher | 317 (81.7%) | 0 (0.0%) |
| Total | 958 (51.9%) | 208 (11.3%) |
Employment Occupations by Sex in Ellisville
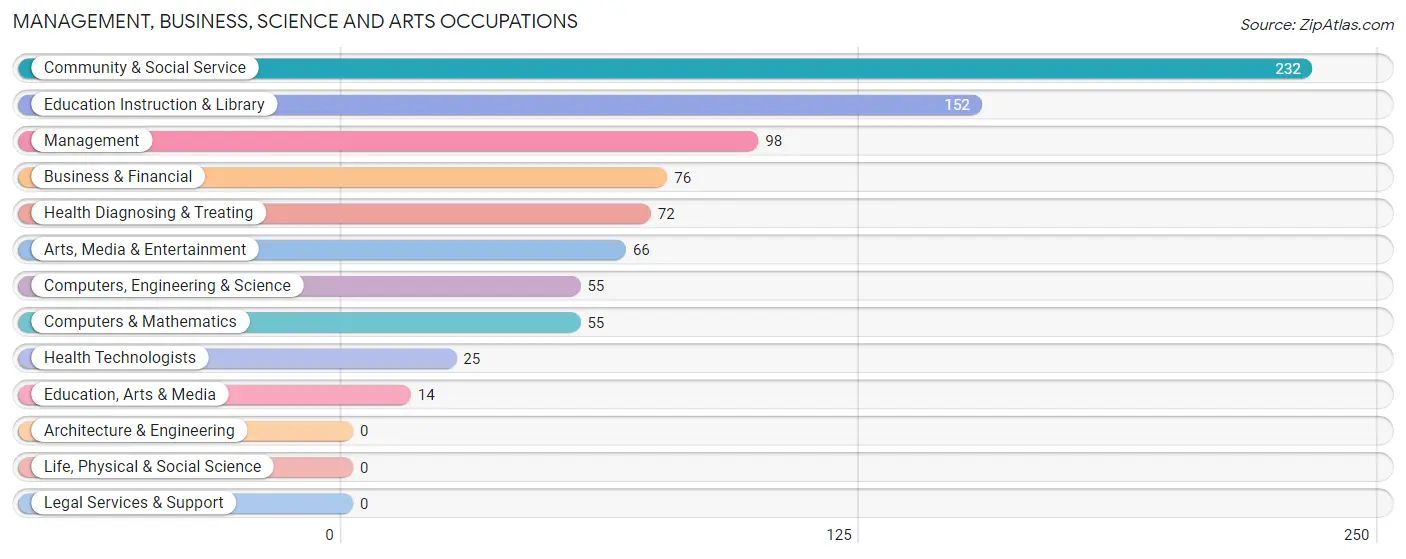
Management, Business, Science and Arts Occupations
The most common Management, Business, Science and Arts occupations in Ellisville are Community & Social Service (232 | 18.9%), Education Instruction & Library (152 | 12.4%), Management (98 | 8.0%), Business & Financial (76 | 6.2%), and Health Diagnosing & Treating (72 | 5.9%).
Management, Business, Science and Arts Occupations by Sex
Within the Management, Business, Science and Arts occupations in Ellisville, the most male-oriented occupations are Education, Arts & Media (100.0%), Arts, Media & Entertainment (100.0%), and Computers, Engineering & Science (78.2%), while the most female-oriented occupations are Health Technologists (100.0%), Education Instruction & Library (71.1%), and Business & Financial (55.3%).
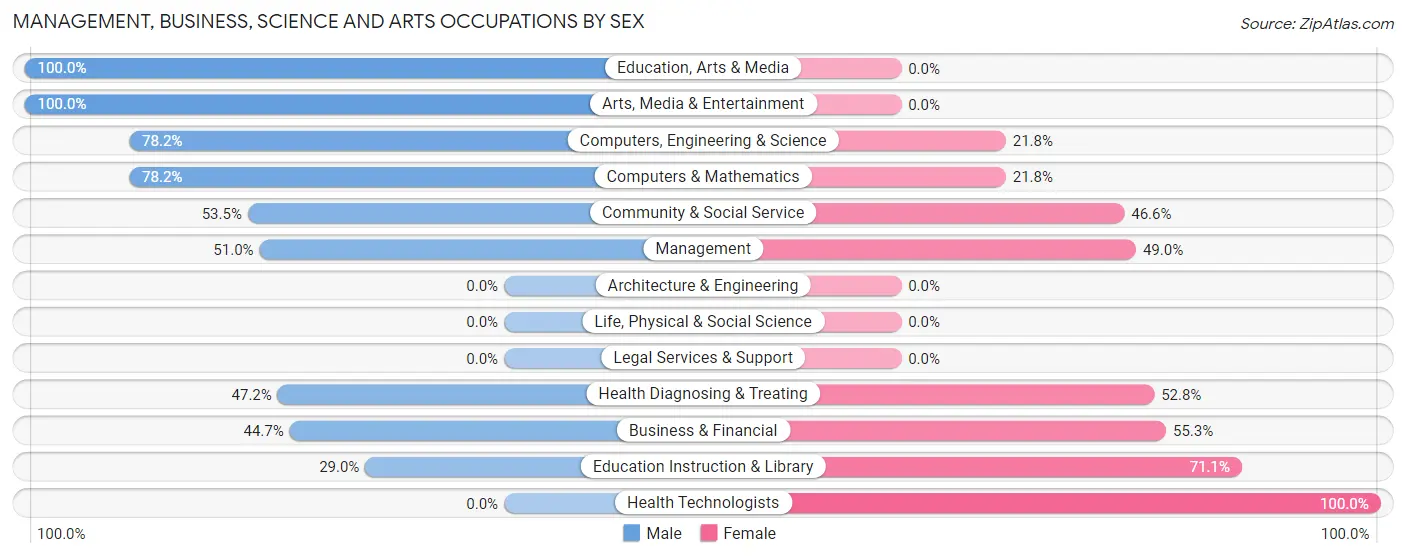
| Occupation | Male | Female |
| Management | 50 (51.0%) | 48 (49.0%) |
| Business & Financial | 34 (44.7%) | 42 (55.3%) |
| Computers, Engineering & Science | 43 (78.2%) | 12 (21.8%) |
| Computers & Mathematics | 43 (78.2%) | 12 (21.8%) |
| Architecture & Engineering | 0 (0.0%) | 0 (0.0%) |
| Life, Physical & Social Science | 0 (0.0%) | 0 (0.0%) |
| Community & Social Service | 124 (53.4%) | 108 (46.6%) |
| Education, Arts & Media | 14 (100.0%) | 0 (0.0%) |
| Legal Services & Support | 0 (0.0%) | 0 (0.0%) |
| Education Instruction & Library | 44 (28.9%) | 108 (71.1%) |
| Arts, Media & Entertainment | 66 (100.0%) | 0 (0.0%) |
| Health Diagnosing & Treating | 34 (47.2%) | 38 (52.8%) |
| Health Technologists | 0 (0.0%) | 25 (100.0%) |
| Total (Category) | 285 (53.5%) | 248 (46.5%) |
| Total (Overall) | 651 (53.1%) | 575 (46.9%) |
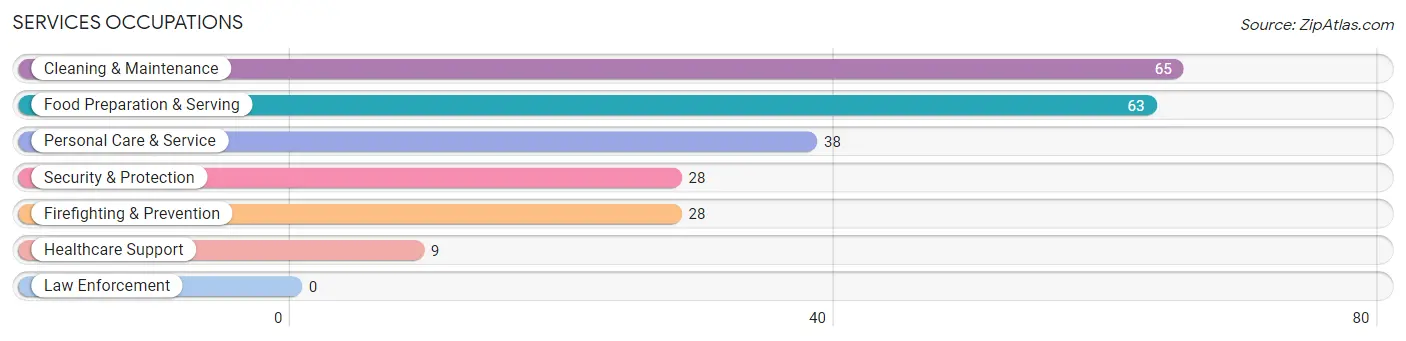
Services Occupations
The most common Services occupations in Ellisville are Cleaning & Maintenance (65 | 5.3%), Food Preparation & Serving (63 | 5.1%), Personal Care & Service (38 | 3.1%), Security & Protection (28 | 2.3%), and Firefighting & Prevention (28 | 2.3%).
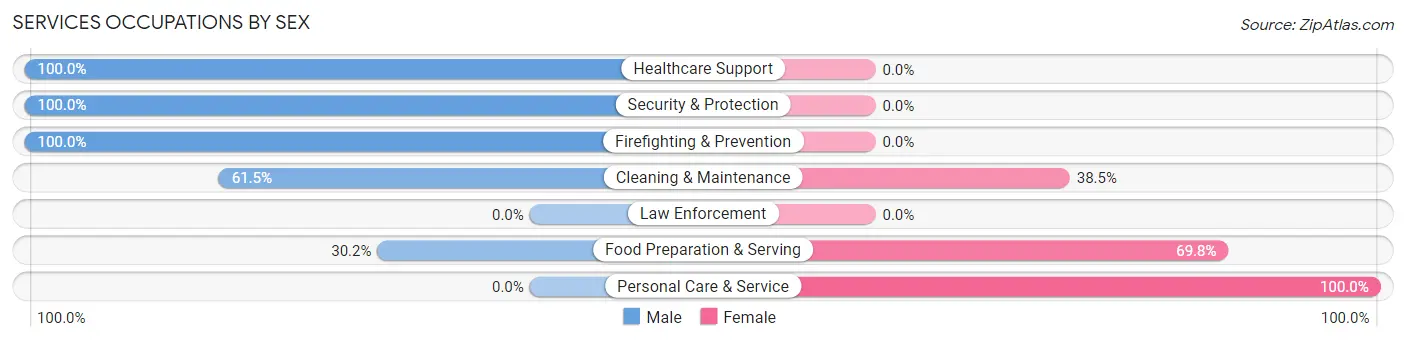
Services Occupations by Sex
Within the Services occupations in Ellisville, the most male-oriented occupations are Healthcare Support (100.0%), Security & Protection (100.0%), and Firefighting & Prevention (100.0%), while the most female-oriented occupations are Personal Care & Service (100.0%), Food Preparation & Serving (69.8%), and Cleaning & Maintenance (38.5%).
| Occupation | Male | Female |
| Healthcare Support | 9 (100.0%) | 0 (0.0%) |
| Security & Protection | 28 (100.0%) | 0 (0.0%) |
| Firefighting & Prevention | 28 (100.0%) | 0 (0.0%) |
| Law Enforcement | 0 (0.0%) | 0 (0.0%) |
| Food Preparation & Serving | 19 (30.2%) | 44 (69.8%) |
| Cleaning & Maintenance | 40 (61.5%) | 25 (38.5%) |
| Personal Care & Service | 0 (0.0%) | 38 (100.0%) |
| Total (Category) | 96 (47.3%) | 107 (52.7%) |
| Total (Overall) | 651 (53.1%) | 575 (46.9%) |
Sales and Office Occupations
The most common Sales and Office occupations in Ellisville are Sales & Related (100 | 8.2%), and Office & Administration (55 | 4.5%).

Sales and Office Occupations by Sex

| Occupation | Male | Female |
| Sales & Related | 14 (14.0%) | 86 (86.0%) |
| Office & Administration | 9 (16.4%) | 46 (83.6%) |
| Total (Category) | 23 (14.8%) | 132 (85.2%) |
| Total (Overall) | 651 (53.1%) | 575 (46.9%) |
Natural Resources, Construction and Maintenance Occupations
The most common Natural Resources, Construction and Maintenance occupations in Ellisville are Construction & Extraction (42 | 3.4%), and Installation, Maintenance & Repair (35 | 2.9%).

Natural Resources, Construction and Maintenance Occupations by Sex

| Occupation | Male | Female |
| Farming, Fishing & Forestry | 0 (0.0%) | 0 (0.0%) |
| Construction & Extraction | 42 (100.0%) | 0 (0.0%) |
| Installation, Maintenance & Repair | 35 (100.0%) | 0 (0.0%) |
| Total (Category) | 77 (100.0%) | 0 (0.0%) |
| Total (Overall) | 651 (53.1%) | 575 (46.9%) |
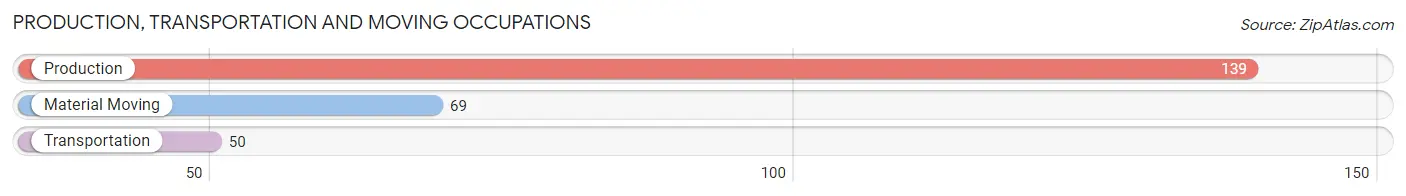
Production, Transportation and Moving Occupations
The most common Production, Transportation and Moving occupations in Ellisville are Production (139 | 11.3%), Material Moving (69 | 5.6%), and Transportation (50 | 4.1%).
Production, Transportation and Moving Occupations by Sex
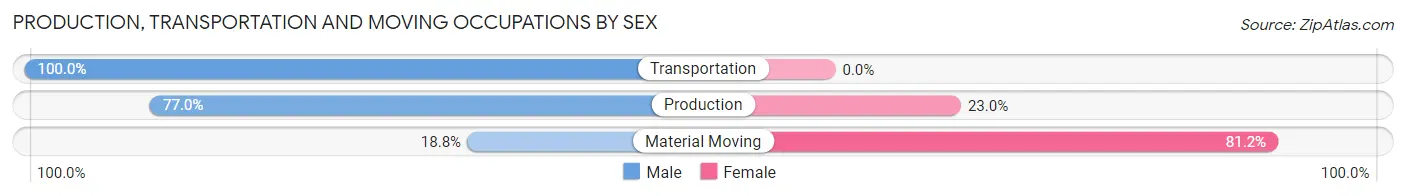
| Occupation | Male | Female |
| Production | 107 (77.0%) | 32 (23.0%) |
| Transportation | 50 (100.0%) | 0 (0.0%) |
| Material Moving | 13 (18.8%) | 56 (81.2%) |
| Total (Category) | 170 (65.9%) | 88 (34.1%) |
| Total (Overall) | 651 (53.1%) | 575 (46.9%) |
Employment Industries by Sex in Ellisville
Employment Industries in Ellisville
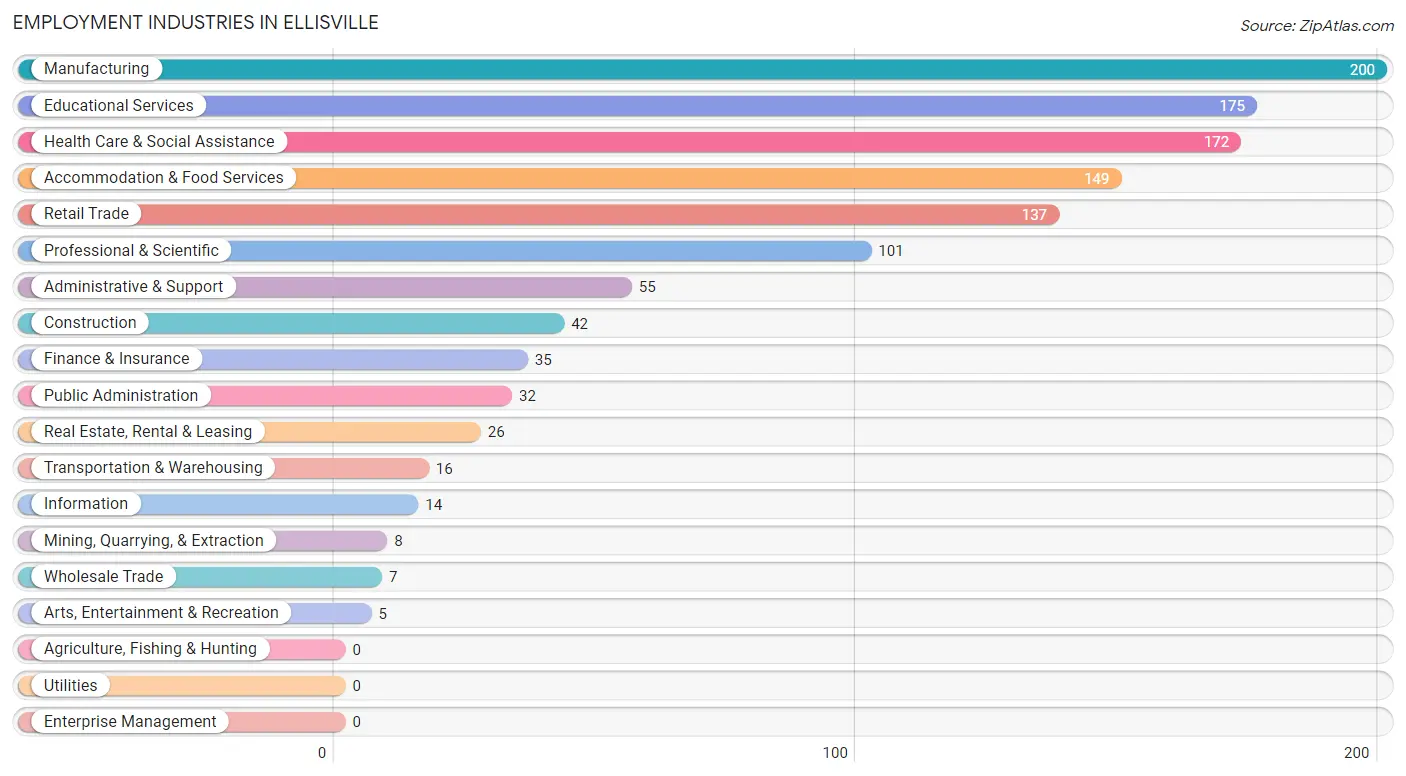
The major employment industries in Ellisville include Manufacturing (200 | 16.3%), Educational Services (175 | 14.3%), Health Care & Social Assistance (172 | 14.0%), Accommodation & Food Services (149 | 12.1%), and Retail Trade (137 | 11.2%).
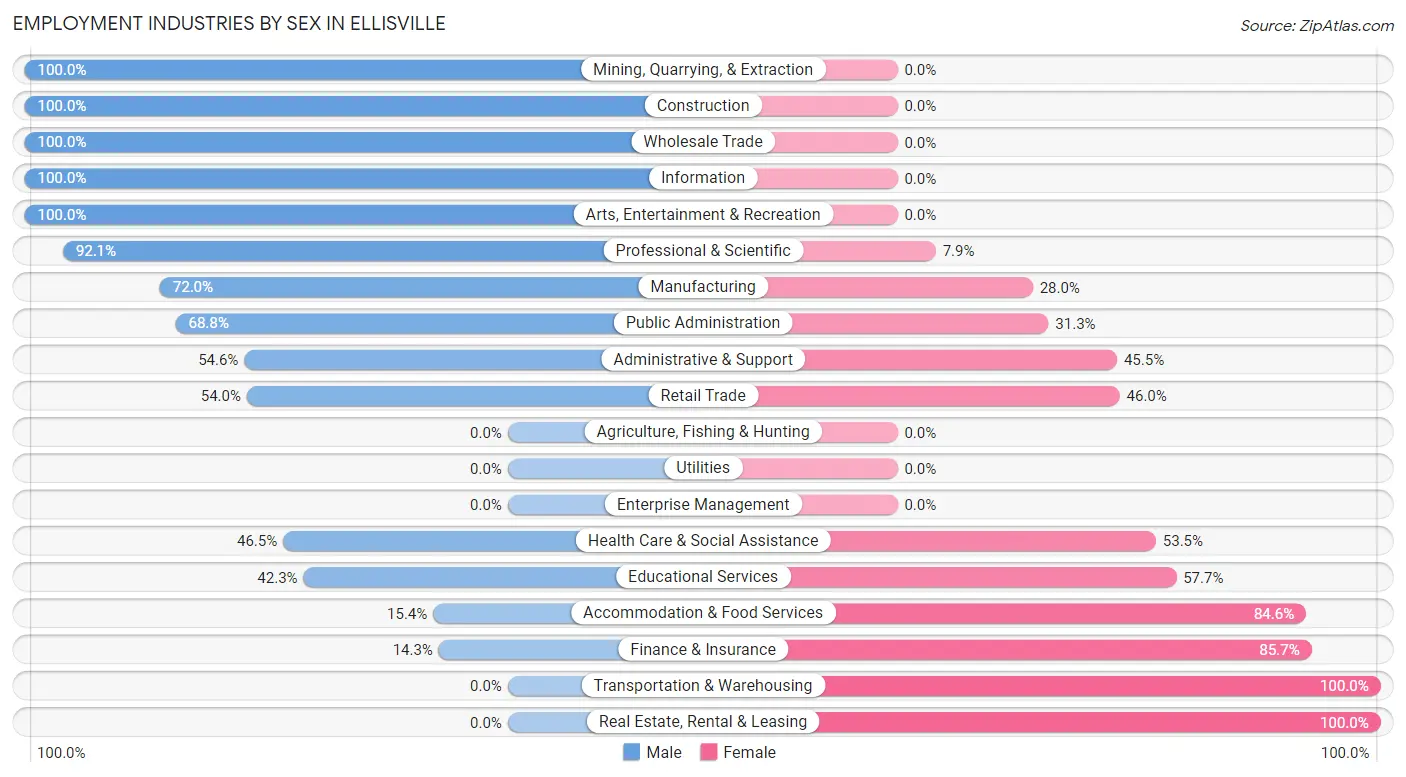
Employment Industries by Sex in Ellisville
The Ellisville industries that see more men than women are Mining, Quarrying, & Extraction (100.0%), Construction (100.0%), and Wholesale Trade (100.0%), whereas the industries that tend to have a higher number of women are Transportation & Warehousing (100.0%), Real Estate, Rental & Leasing (100.0%), and Finance & Insurance (85.7%).
| Industry | Male | Female |
| Agriculture, Fishing & Hunting | 0 (0.0%) | 0 (0.0%) |
| Mining, Quarrying, & Extraction | 8 (100.0%) | 0 (0.0%) |
| Construction | 42 (100.0%) | 0 (0.0%) |
| Manufacturing | 144 (72.0%) | 56 (28.0%) |
| Wholesale Trade | 7 (100.0%) | 0 (0.0%) |
| Retail Trade | 74 (54.0%) | 63 (46.0%) |
| Transportation & Warehousing | 0 (0.0%) | 16 (100.0%) |
| Utilities | 0 (0.0%) | 0 (0.0%) |
| Information | 14 (100.0%) | 0 (0.0%) |
| Finance & Insurance | 5 (14.3%) | 30 (85.7%) |
| Real Estate, Rental & Leasing | 0 (0.0%) | 26 (100.0%) |
| Professional & Scientific | 93 (92.1%) | 8 (7.9%) |
| Enterprise Management | 0 (0.0%) | 0 (0.0%) |
| Administrative & Support | 30 (54.5%) | 25 (45.5%) |
| Educational Services | 74 (42.3%) | 101 (57.7%) |
| Health Care & Social Assistance | 80 (46.5%) | 92 (53.5%) |
| Arts, Entertainment & Recreation | 5 (100.0%) | 0 (0.0%) |
| Accommodation & Food Services | 23 (15.4%) | 126 (84.6%) |
| Public Administration | 22 (68.8%) | 10 (31.2%) |
| Total | 651 (53.1%) | 575 (46.9%) |
Education in Ellisville
School Enrollment in Ellisville
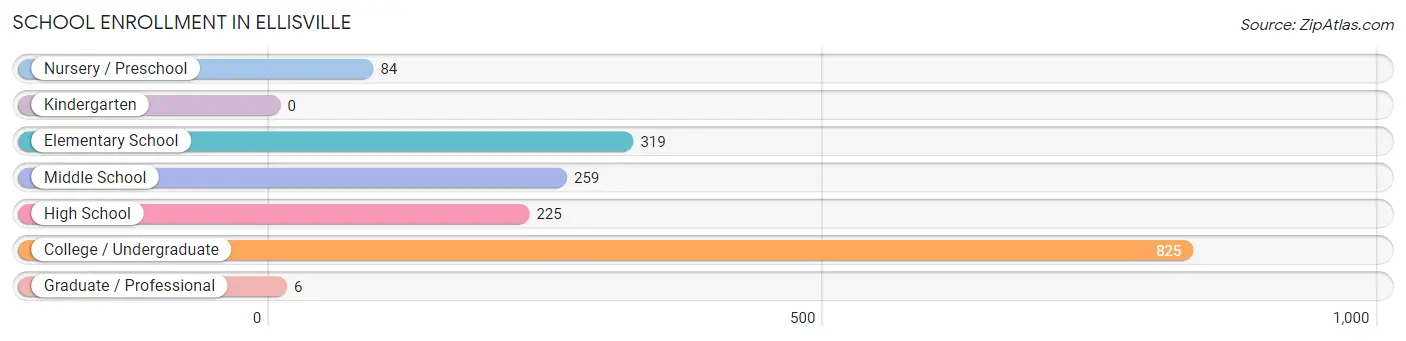
The most common levels of schooling among the 1,718 students in Ellisville are college / undergraduate (825 | 48.0%), elementary school (319 | 18.6%), and middle school (259 | 15.1%).
| School Level | # Students | % Students |
| Nursery / Preschool | 84 | 4.9% |
| Kindergarten | 0 | 0.0% |
| Elementary School | 319 | 18.6% |
| Middle School | 259 | 15.1% |
| High School | 225 | 13.1% |
| College / Undergraduate | 825 | 48.0% |
| Graduate / Professional | 6 | 0.4% |
| Total | 1,718 | 100.0% |
School Enrollment by Age by Funding Source in Ellisville
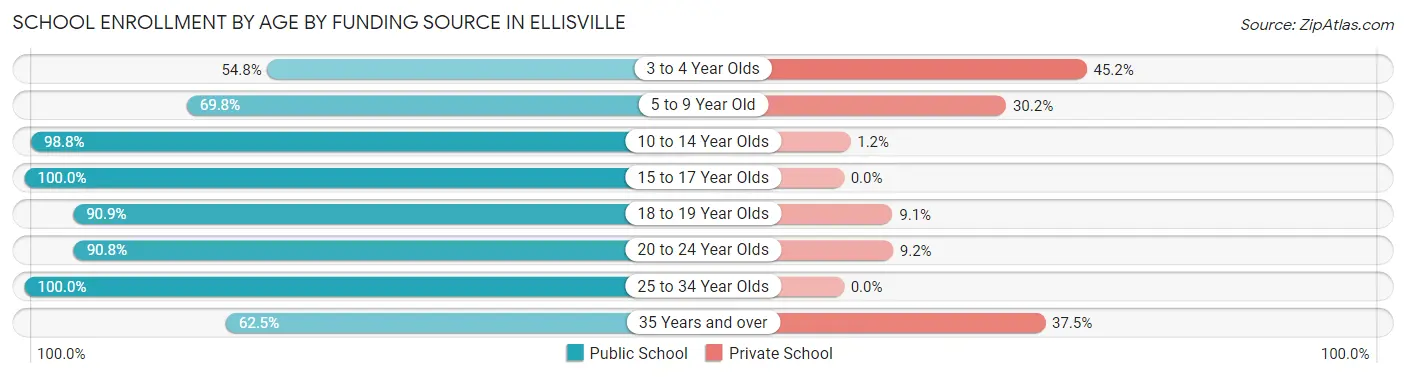
Out of a total of 1,718 students who are enrolled in schools in Ellisville, 198 (11.5%) attend a private institution, while the remaining 1,520 (88.5%) are enrolled in public schools. The age group of 3 to 4 year olds has the highest likelihood of being enrolled in private schools, with 38 (45.2% in the age bracket) enrolled. Conversely, the age group of 15 to 17 year olds has the lowest likelihood of being enrolled in a private school, with 177 (100.0% in the age bracket) attending a public institution.
| Age Bracket | Public School | Private School |
| 3 to 4 Year Olds | 46 (54.8%) | 38 (45.2%) |
| 5 to 9 Year Old | 150 (69.8%) | 65 (30.2%) |
| 10 to 14 Year Olds | 402 (98.8%) | 5 (1.2%) |
| 15 to 17 Year Olds | 177 (100.0%) | 0 (0.0%) |
| 18 to 19 Year Olds | 472 (90.9%) | 47 (9.1%) |
| 20 to 24 Year Olds | 238 (90.8%) | 24 (9.2%) |
| 25 to 34 Year Olds | 6 (100.0%) | 0 (0.0%) |
| 35 Years and over | 30 (62.5%) | 18 (37.5%) |
| Total | 1,520 (88.5%) | 198 (11.5%) |
Educational Attainment by Field of Study in Ellisville
Education (158 | 28.9%), science & technology (136 | 24.9%), business (119 | 21.8%), communications (32 | 5.9%), and arts & humanities (32 | 5.9%) are the most common fields of study among 546 individuals in Ellisville who have obtained a bachelor's degree or higher.
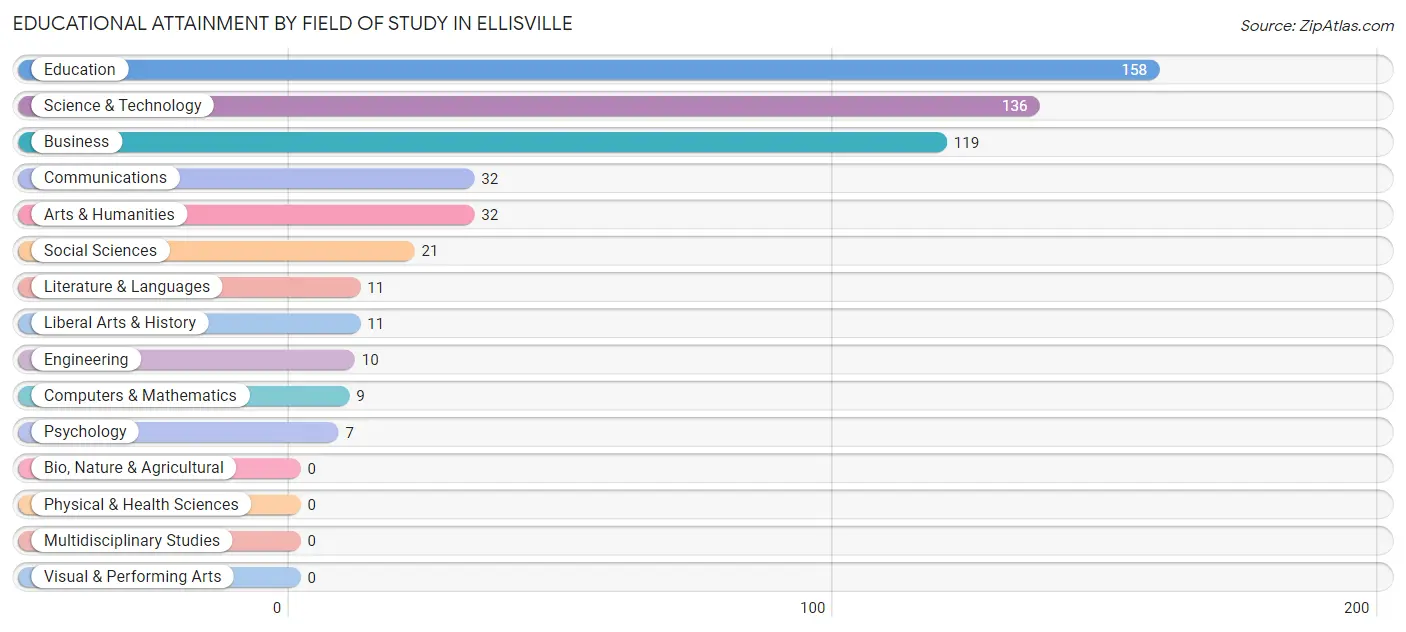
| Field of Study | # Graduates | % Graduates |
| Computers & Mathematics | 9 | 1.7% |
| Bio, Nature & Agricultural | 0 | 0.0% |
| Physical & Health Sciences | 0 | 0.0% |
| Psychology | 7 | 1.3% |
| Social Sciences | 21 | 3.8% |
| Engineering | 10 | 1.8% |
| Multidisciplinary Studies | 0 | 0.0% |
| Science & Technology | 136 | 24.9% |
| Business | 119 | 21.8% |
| Education | 158 | 28.9% |
| Literature & Languages | 11 | 2.0% |
| Liberal Arts & History | 11 | 2.0% |
| Visual & Performing Arts | 0 | 0.0% |
| Communications | 32 | 5.9% |
| Arts & Humanities | 32 | 5.9% |
| Total | 546 | 100.0% |
Transportation & Commute in Ellisville
Vehicle Availability by Sex in Ellisville
The most prevalent vehicle ownership categories in Ellisville are males with 2 vehicles (242, accounting for 41.6%) and females with 2 vehicles (153, making up 56.1%).
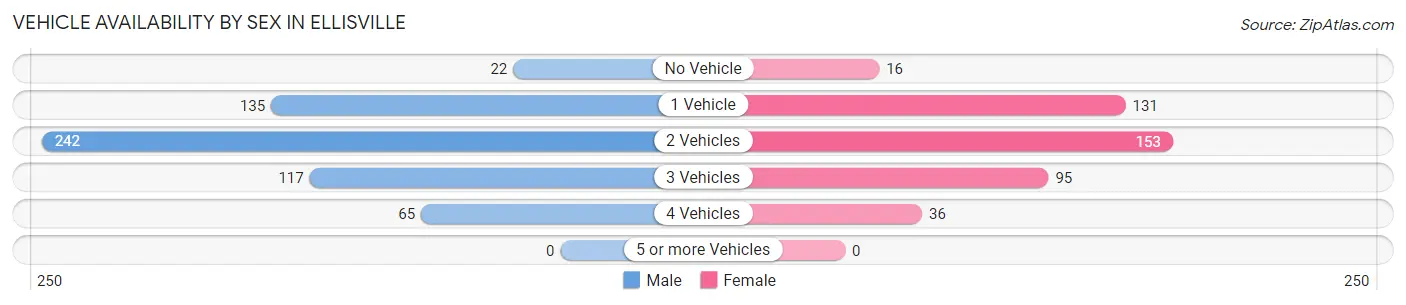
| Vehicles Available | Male | Female |
| No Vehicle | 22 (3.8%) | 16 (3.7%) |
| 1 Vehicle | 135 (23.2%) | 131 (30.4%) |
| 2 Vehicles | 242 (41.6%) | 153 (35.5%) |
| 3 Vehicles | 117 (20.1%) | 95 (22.0%) |
| 4 Vehicles | 65 (11.2%) | 36 (8.4%) |
| 5 or more Vehicles | 0 (0.0%) | 0 (0.0%) |
| Total | 581 (100.0%) | 431 (100.0%) |
Commute Time in Ellisville
The most frequently occuring commute durations in Ellisville are 15 to 19 minutes (322 commuters, 27.5%), 10 to 14 minutes (250 commuters, 21.4%), and 20 to 24 minutes (185 commuters, 15.8%).
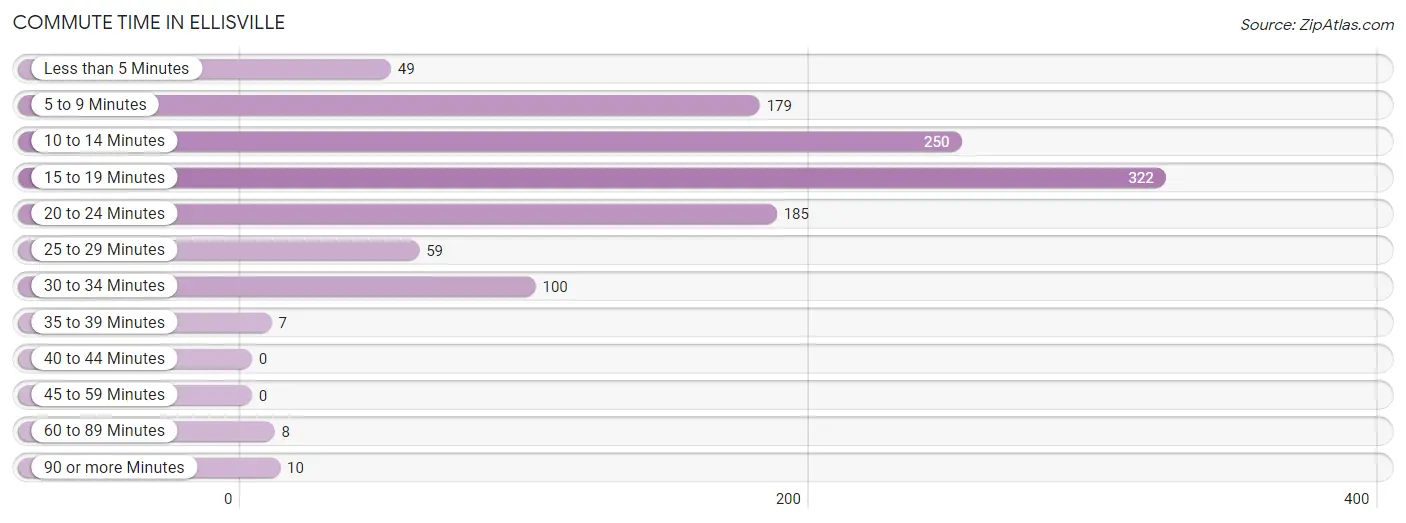
| Commute Time | # Commuters | % Commuters |
| Less than 5 Minutes | 49 | 4.2% |
| 5 to 9 Minutes | 179 | 15.3% |
| 10 to 14 Minutes | 250 | 21.4% |
| 15 to 19 Minutes | 322 | 27.5% |
| 20 to 24 Minutes | 185 | 15.8% |
| 25 to 29 Minutes | 59 | 5.1% |
| 30 to 34 Minutes | 100 | 8.6% |
| 35 to 39 Minutes | 7 | 0.6% |
| 40 to 44 Minutes | 0 | 0.0% |
| 45 to 59 Minutes | 0 | 0.0% |
| 60 to 89 Minutes | 8 | 0.7% |
| 90 or more Minutes | 10 | 0.9% |
Commute Time by Sex in Ellisville
The most common commute times in Ellisville are 15 to 19 minutes (239 commuters, 36.9%) for males and 10 to 14 minutes (134 commuters, 25.7%) for females.
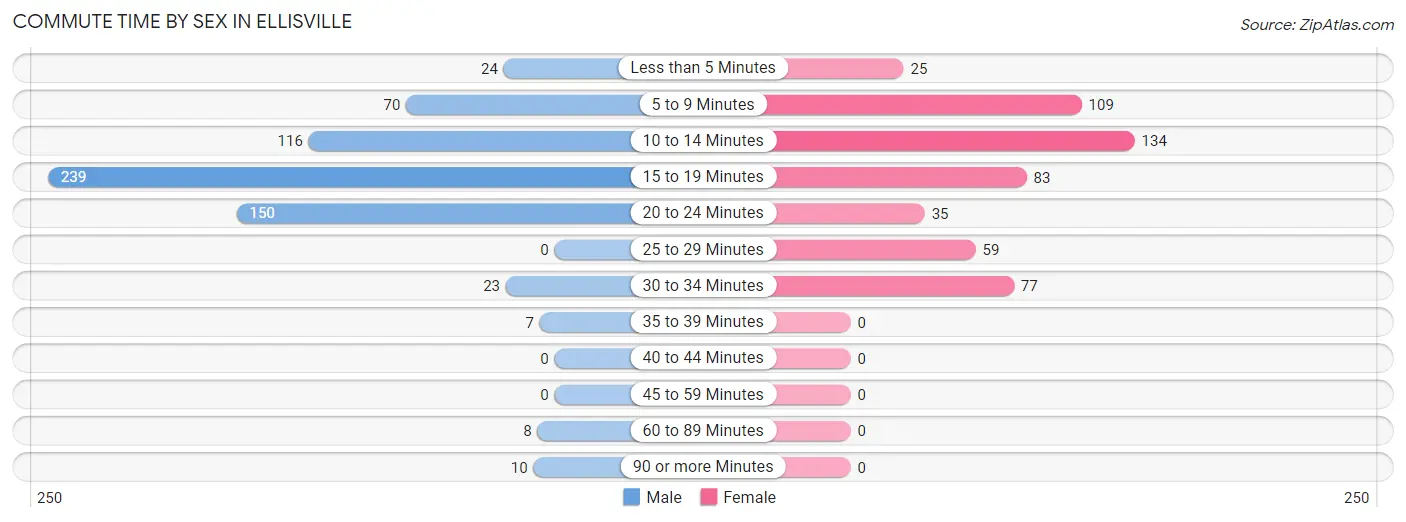
| Commute Time | Male | Female |
| Less than 5 Minutes | 24 (3.7%) | 25 (4.8%) |
| 5 to 9 Minutes | 70 (10.8%) | 109 (20.9%) |
| 10 to 14 Minutes | 116 (17.9%) | 134 (25.7%) |
| 15 to 19 Minutes | 239 (36.9%) | 83 (15.9%) |
| 20 to 24 Minutes | 150 (23.2%) | 35 (6.7%) |
| 25 to 29 Minutes | 0 (0.0%) | 59 (11.3%) |
| 30 to 34 Minutes | 23 (3.5%) | 77 (14.7%) |
| 35 to 39 Minutes | 7 (1.1%) | 0 (0.0%) |
| 40 to 44 Minutes | 0 (0.0%) | 0 (0.0%) |
| 45 to 59 Minutes | 0 (0.0%) | 0 (0.0%) |
| 60 to 89 Minutes | 8 (1.2%) | 0 (0.0%) |
| 90 or more Minutes | 10 (1.5%) | 0 (0.0%) |
Time of Departure to Work by Sex in Ellisville
The most frequent times of departure to work in Ellisville are 7:30 AM to 7:59 AM (140, 21.6%) for males and 7:00 AM to 7:29 AM (89, 17.1%) for females.
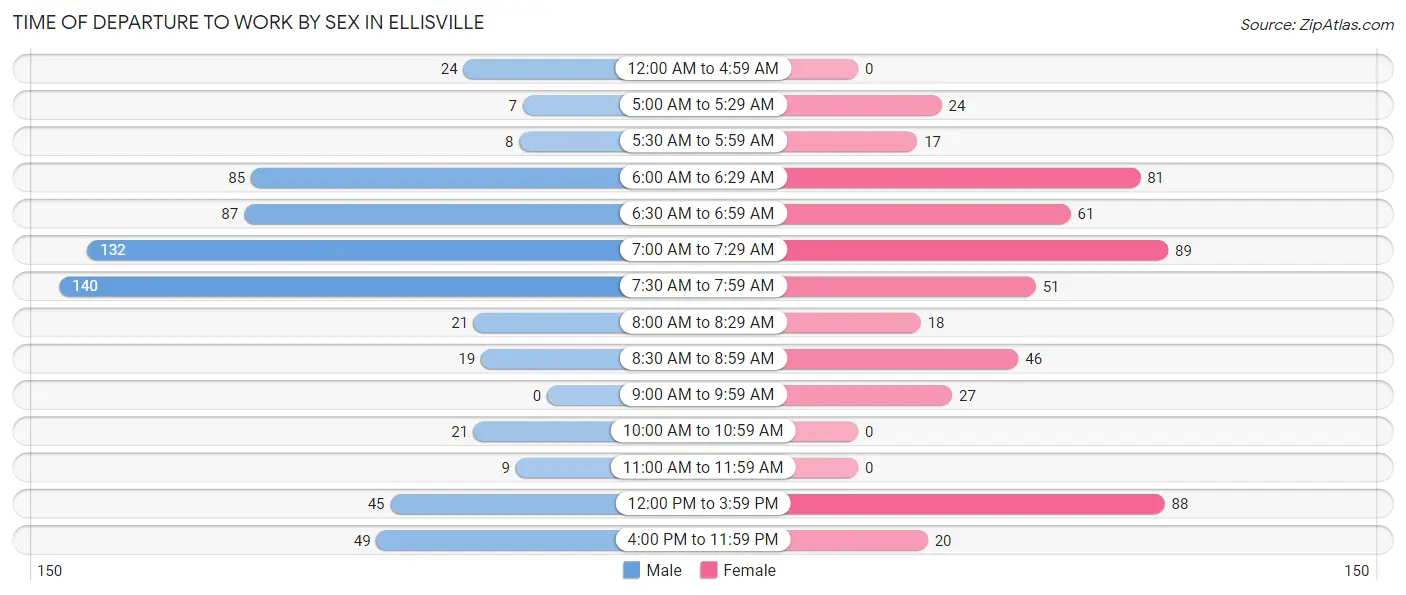
| Time of Departure | Male | Female |
| 12:00 AM to 4:59 AM | 24 (3.7%) | 0 (0.0%) |
| 5:00 AM to 5:29 AM | 7 (1.1%) | 24 (4.6%) |
| 5:30 AM to 5:59 AM | 8 (1.2%) | 17 (3.3%) |
| 6:00 AM to 6:29 AM | 85 (13.1%) | 81 (15.5%) |
| 6:30 AM to 6:59 AM | 87 (13.5%) | 61 (11.7%) |
| 7:00 AM to 7:29 AM | 132 (20.4%) | 89 (17.1%) |
| 7:30 AM to 7:59 AM | 140 (21.6%) | 51 (9.8%) |
| 8:00 AM to 8:29 AM | 21 (3.3%) | 18 (3.5%) |
| 8:30 AM to 8:59 AM | 19 (2.9%) | 46 (8.8%) |
| 9:00 AM to 9:59 AM | 0 (0.0%) | 27 (5.2%) |
| 10:00 AM to 10:59 AM | 21 (3.3%) | 0 (0.0%) |
| 11:00 AM to 11:59 AM | 9 (1.4%) | 0 (0.0%) |
| 12:00 PM to 3:59 PM | 45 (7.0%) | 88 (16.9%) |
| 4:00 PM to 11:59 PM | 49 (7.6%) | 20 (3.8%) |
| Total | 647 (100.0%) | 522 (100.0%) |
Housing Occupancy in Ellisville
Occupancy by Ownership in Ellisville
Of the total 1,296 dwellings in Ellisville, owner-occupied units account for 682 (52.6%), while renter-occupied units make up 614 (47.4%).
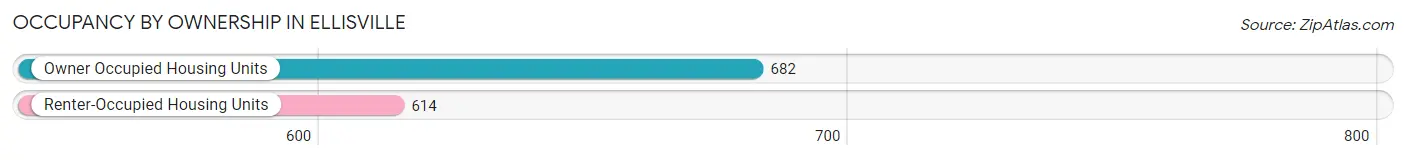
| Occupancy | # Housing Units | % Housing Units |
| Owner Occupied Housing Units | 682 | 52.6% |
| Renter-Occupied Housing Units | 614 | 47.4% |
| Total Occupied Housing Units | 1,296 | 100.0% |
Occupancy by Household Size in Ellisville
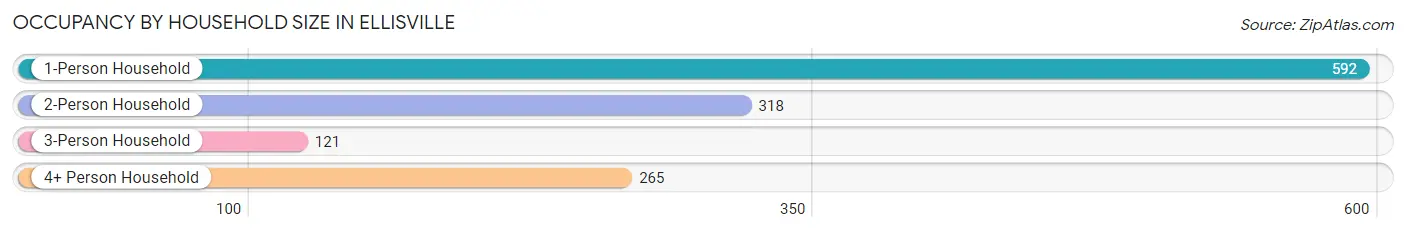
| Household Size | # Housing Units | % Housing Units |
| 1-Person Household | 592 | 45.7% |
| 2-Person Household | 318 | 24.5% |
| 3-Person Household | 121 | 9.3% |
| 4+ Person Household | 265 | 20.4% |
| Total Housing Units | 1,296 | 100.0% |
Occupancy by Ownership by Household Size in Ellisville
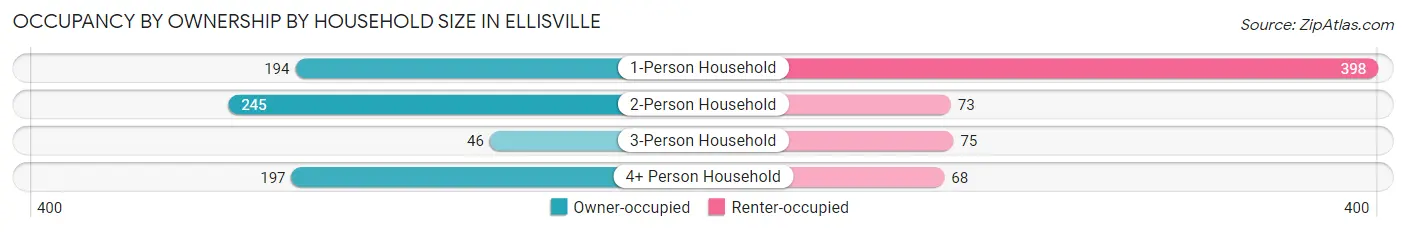
| Household Size | Owner-occupied | Renter-occupied |
| 1-Person Household | 194 (32.8%) | 398 (67.2%) |
| 2-Person Household | 245 (77.0%) | 73 (23.0%) |
| 3-Person Household | 46 (38.0%) | 75 (62.0%) |
| 4+ Person Household | 197 (74.3%) | 68 (25.7%) |
| Total Housing Units | 682 (52.6%) | 614 (47.4%) |
Occupancy by Educational Attainment in Ellisville
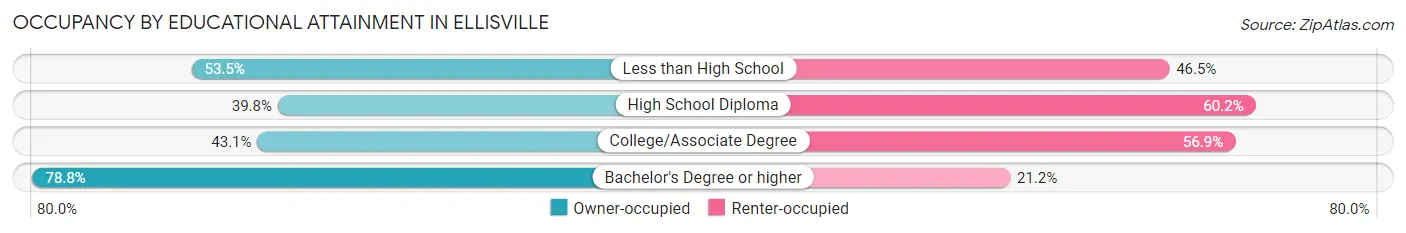
| Household Size | Owner-occupied | Renter-occupied |
| Less than High School | 76 (53.5%) | 66 (46.5%) |
| High School Diploma | 149 (39.8%) | 225 (60.2%) |
| College/Associate Degree | 190 (43.1%) | 251 (56.9%) |
| Bachelor's Degree or higher | 267 (78.8%) | 72 (21.2%) |
Occupancy by Age of Householder in Ellisville
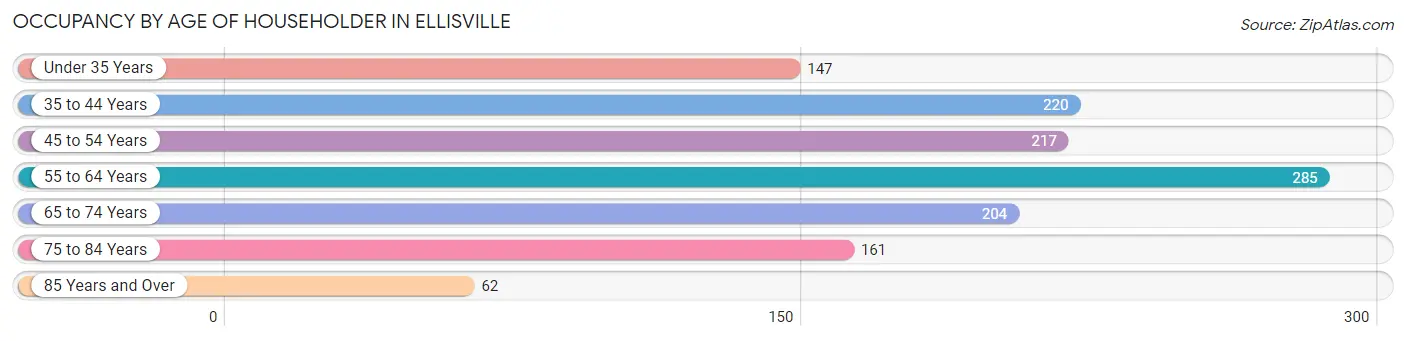
| Age Bracket | # Households | % Households |
| Under 35 Years | 147 | 11.3% |
| 35 to 44 Years | 220 | 17.0% |
| 45 to 54 Years | 217 | 16.7% |
| 55 to 64 Years | 285 | 22.0% |
| 65 to 74 Years | 204 | 15.7% |
| 75 to 84 Years | 161 | 12.4% |
| 85 Years and Over | 62 | 4.8% |
| Total | 1,296 | 100.0% |
Housing Finances in Ellisville
Median Income by Occupancy in Ellisville
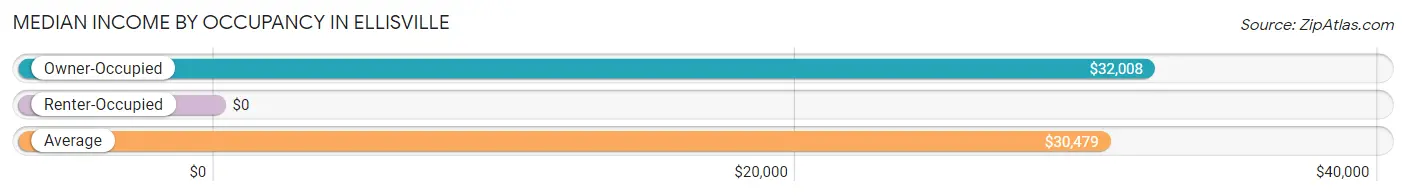
| Occupancy Type | # Households | Median Income |
| Owner-Occupied | 682 (52.6%) | $32,008 |
| Renter-Occupied | 614 (47.4%) | $0 |
| Average | 1,296 (100.0%) | $30,479 |
Occupancy by Householder Income Bracket in Ellisville
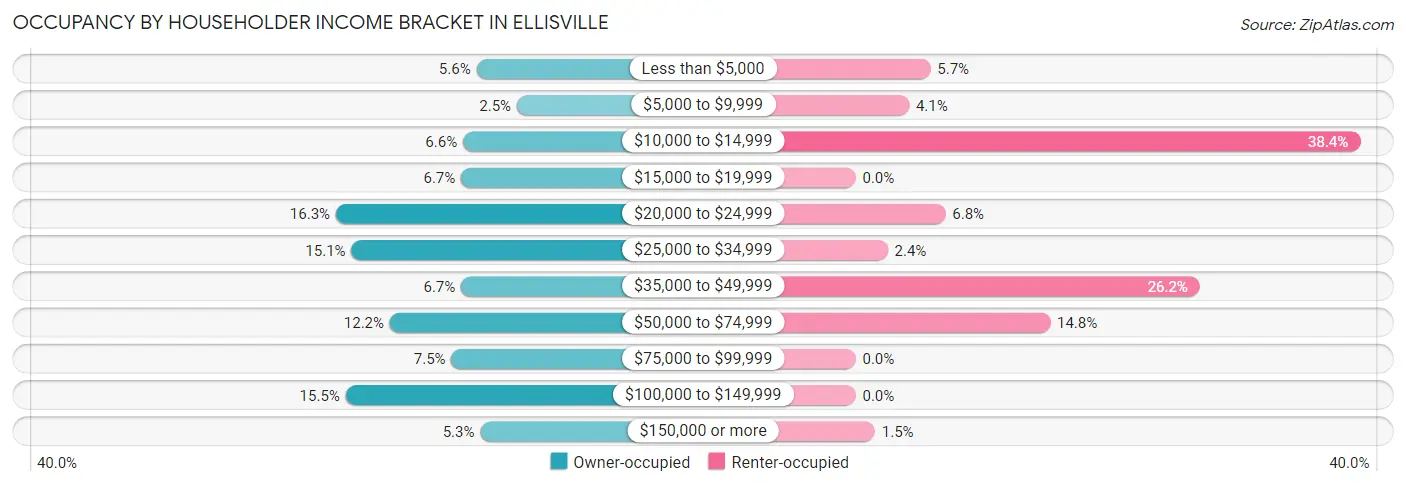
| Income Bracket | Owner-occupied | Renter-occupied |
| Less than $5,000 | 38 (5.6%) | 35 (5.7%) |
| $5,000 to $9,999 | 17 (2.5%) | 25 (4.1%) |
| $10,000 to $14,999 | 45 (6.6%) | 236 (38.4%) |
| $15,000 to $19,999 | 46 (6.7%) | 0 (0.0%) |
| $20,000 to $24,999 | 111 (16.3%) | 42 (6.8%) |
| $25,000 to $34,999 | 103 (15.1%) | 15 (2.4%) |
| $35,000 to $49,999 | 46 (6.7%) | 161 (26.2%) |
| $50,000 to $74,999 | 83 (12.2%) | 91 (14.8%) |
| $75,000 to $99,999 | 51 (7.5%) | 0 (0.0%) |
| $100,000 to $149,999 | 106 (15.5%) | 0 (0.0%) |
| $150,000 or more | 36 (5.3%) | 9 (1.5%) |
| Total | 682 (100.0%) | 614 (100.0%) |
Monthly Housing Cost Tiers in Ellisville
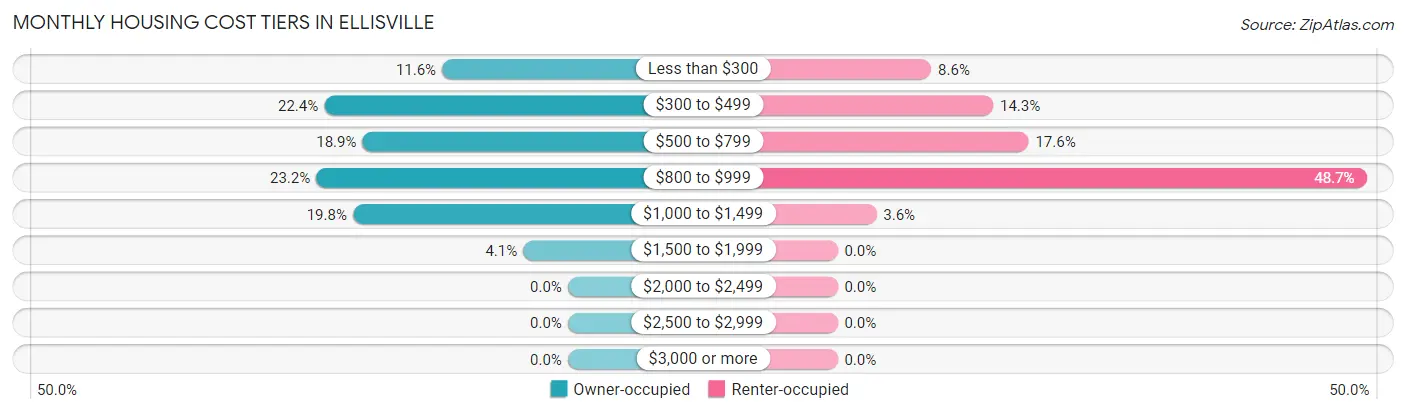
| Monthly Cost | Owner-occupied | Renter-occupied |
| Less than $300 | 79 (11.6%) | 53 (8.6%) |
| $300 to $499 | 153 (22.4%) | 88 (14.3%) |
| $500 to $799 | 129 (18.9%) | 108 (17.6%) |
| $800 to $999 | 158 (23.2%) | 299 (48.7%) |
| $1,000 to $1,499 | 135 (19.8%) | 22 (3.6%) |
| $1,500 to $1,999 | 28 (4.1%) | 0 (0.0%) |
| $2,000 to $2,499 | 0 (0.0%) | 0 (0.0%) |
| $2,500 to $2,999 | 0 (0.0%) | 0 (0.0%) |
| $3,000 or more | 0 (0.0%) | 0 (0.0%) |
| Total | 682 (100.0%) | 614 (100.0%) |
Physical Housing Characteristics in Ellisville
Housing Structures in Ellisville
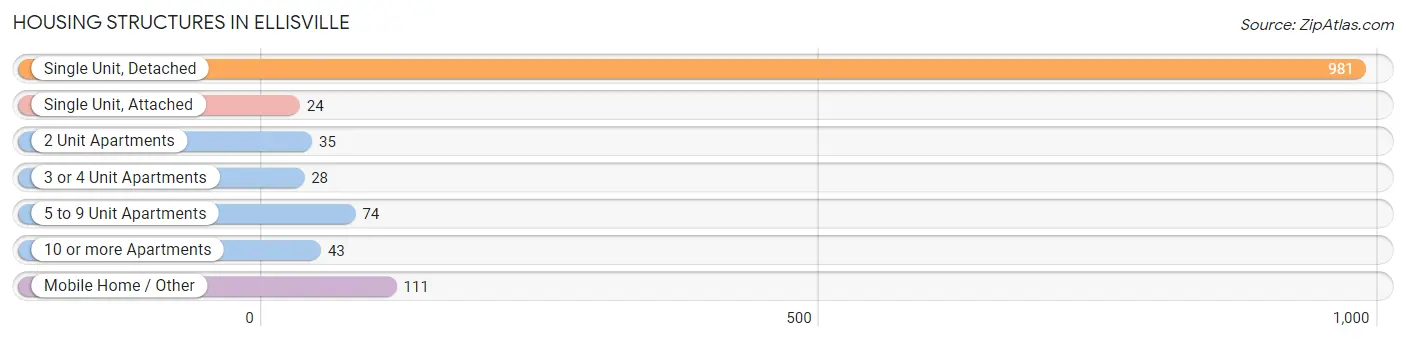
| Structure Type | # Housing Units | % Housing Units |
| Single Unit, Detached | 981 | 75.7% |
| Single Unit, Attached | 24 | 1.8% |
| 2 Unit Apartments | 35 | 2.7% |
| 3 or 4 Unit Apartments | 28 | 2.2% |
| 5 to 9 Unit Apartments | 74 | 5.7% |
| 10 or more Apartments | 43 | 3.3% |
| Mobile Home / Other | 111 | 8.6% |
| Total | 1,296 | 100.0% |
Housing Structures by Occupancy in Ellisville
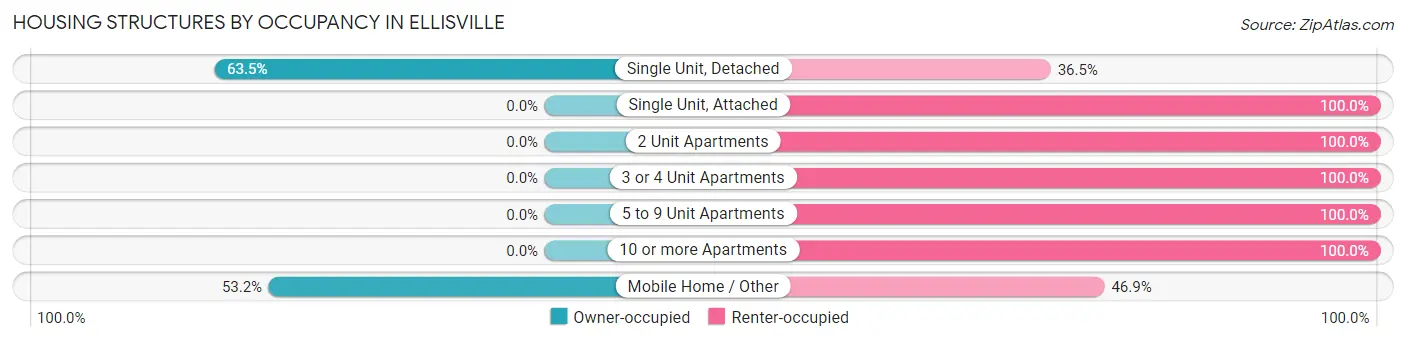
| Structure Type | Owner-occupied | Renter-occupied |
| Single Unit, Detached | 623 (63.5%) | 358 (36.5%) |
| Single Unit, Attached | 0 (0.0%) | 24 (100.0%) |
| 2 Unit Apartments | 0 (0.0%) | 35 (100.0%) |
| 3 or 4 Unit Apartments | 0 (0.0%) | 28 (100.0%) |
| 5 to 9 Unit Apartments | 0 (0.0%) | 74 (100.0%) |
| 10 or more Apartments | 0 (0.0%) | 43 (100.0%) |
| Mobile Home / Other | 59 (53.1%) | 52 (46.9%) |
| Total | 682 (52.6%) | 614 (47.4%) |
Housing Structures by Number of Rooms in Ellisville
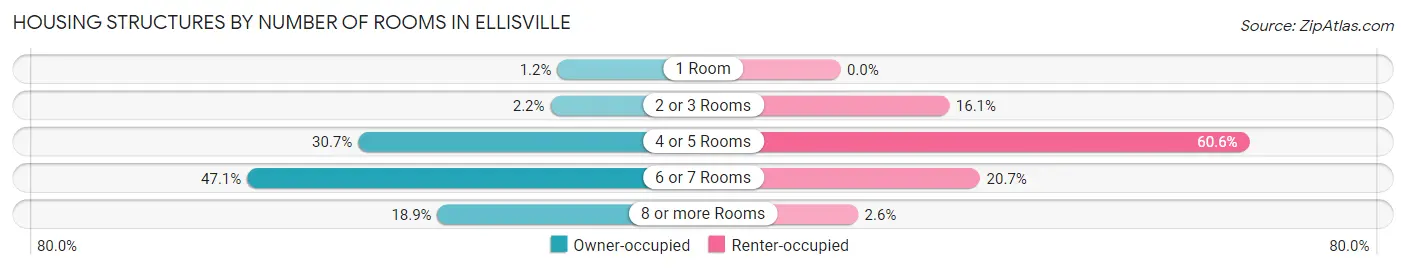
| Number of Rooms | Owner-occupied | Renter-occupied |
| 1 Room | 8 (1.2%) | 0 (0.0%) |
| 2 or 3 Rooms | 15 (2.2%) | 99 (16.1%) |
| 4 or 5 Rooms | 209 (30.6%) | 372 (60.6%) |
| 6 or 7 Rooms | 321 (47.1%) | 127 (20.7%) |
| 8 or more Rooms | 129 (18.9%) | 16 (2.6%) |
| Total | 682 (100.0%) | 614 (100.0%) |
Housing Structure by Heating Type in Ellisville
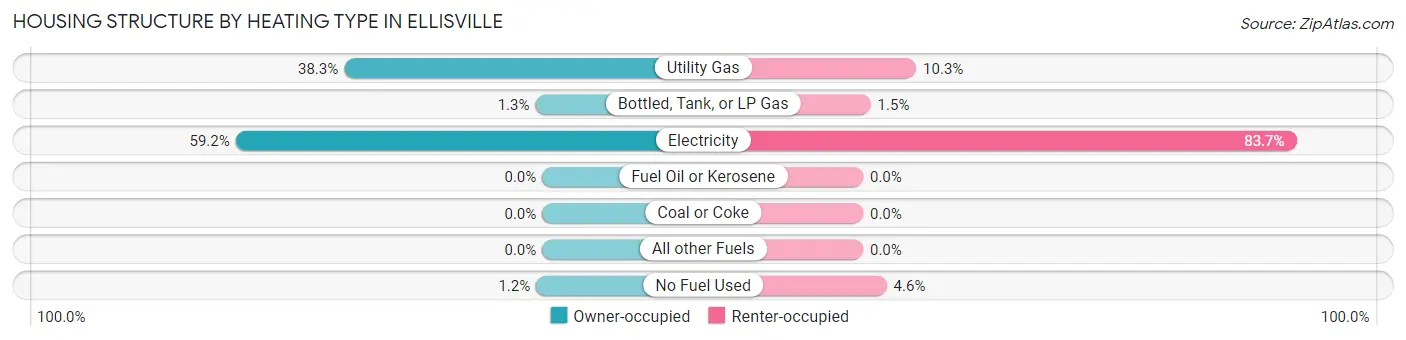
| Heating Type | Owner-occupied | Renter-occupied |
| Utility Gas | 261 (38.3%) | 63 (10.3%) |
| Bottled, Tank, or LP Gas | 9 (1.3%) | 9 (1.5%) |
| Electricity | 404 (59.2%) | 514 (83.7%) |
| Fuel Oil or Kerosene | 0 (0.0%) | 0 (0.0%) |
| Coal or Coke | 0 (0.0%) | 0 (0.0%) |
| All other Fuels | 0 (0.0%) | 0 (0.0%) |
| No Fuel Used | 8 (1.2%) | 28 (4.6%) |
| Total | 682 (100.0%) | 614 (100.0%) |
Household Vehicle Usage in Ellisville
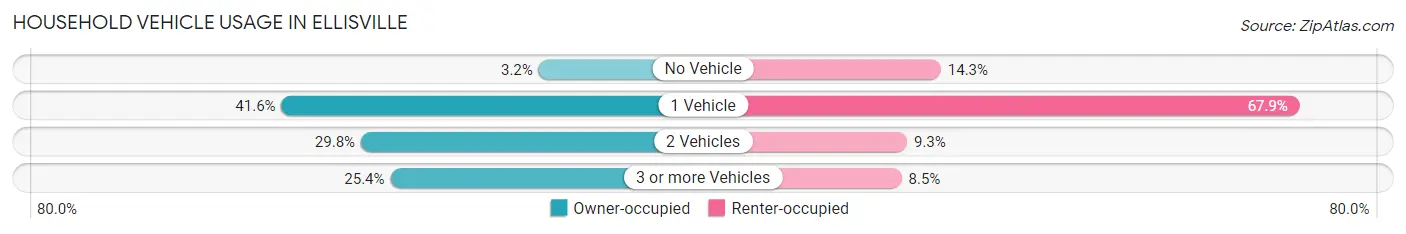
| Vehicles per Household | Owner-occupied | Renter-occupied |
| No Vehicle | 22 (3.2%) | 88 (14.3%) |
| 1 Vehicle | 284 (41.6%) | 417 (67.9%) |
| 2 Vehicles | 203 (29.8%) | 57 (9.3%) |
| 3 or more Vehicles | 173 (25.4%) | 52 (8.5%) |
| Total | 682 (100.0%) | 614 (100.0%) |
Real Estate & Mortgages in Ellisville
Real Estate and Mortgage Overview in Ellisville
| Characteristic | Without Mortgage | With Mortgage |
| Housing Units | 368 | 314 |
| Median Property Value | $100,000 | $97,000 |
| Median Household Income | $24,286 | $17 |
| Monthly Housing Costs | $444 | $0 |
| Real Estate Taxes | $961 | $104 |
Property Value by Mortgage Status in Ellisville
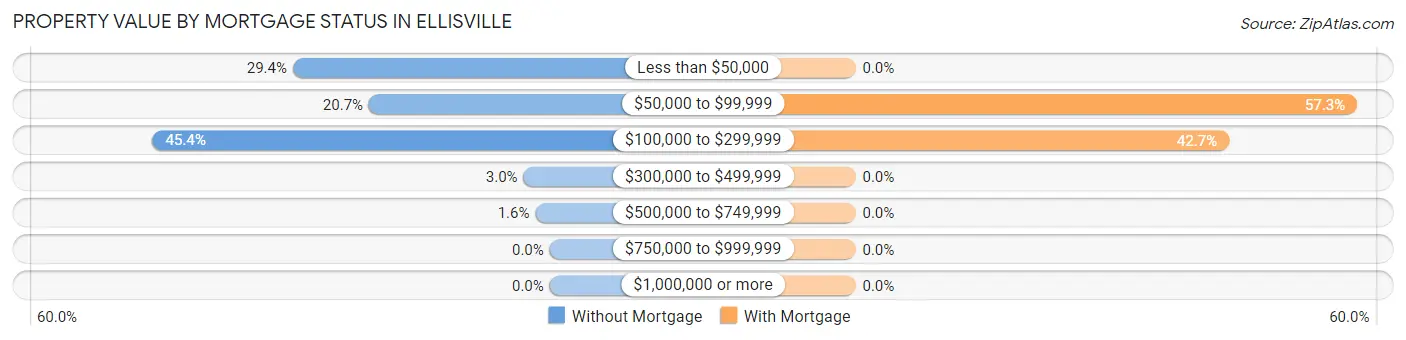
| Property Value | Without Mortgage | With Mortgage |
| Less than $50,000 | 108 (29.3%) | 0 (0.0%) |
| $50,000 to $99,999 | 76 (20.6%) | 180 (57.3%) |
| $100,000 to $299,999 | 167 (45.4%) | 134 (42.7%) |
| $300,000 to $499,999 | 11 (3.0%) | 0 (0.0%) |
| $500,000 to $749,999 | 6 (1.6%) | 0 (0.0%) |
| $750,000 to $999,999 | 0 (0.0%) | 0 (0.0%) |
| $1,000,000 or more | 0 (0.0%) | 0 (0.0%) |
| Total | 368 (100.0%) | 314 (100.0%) |
Household Income by Mortgage Status in Ellisville
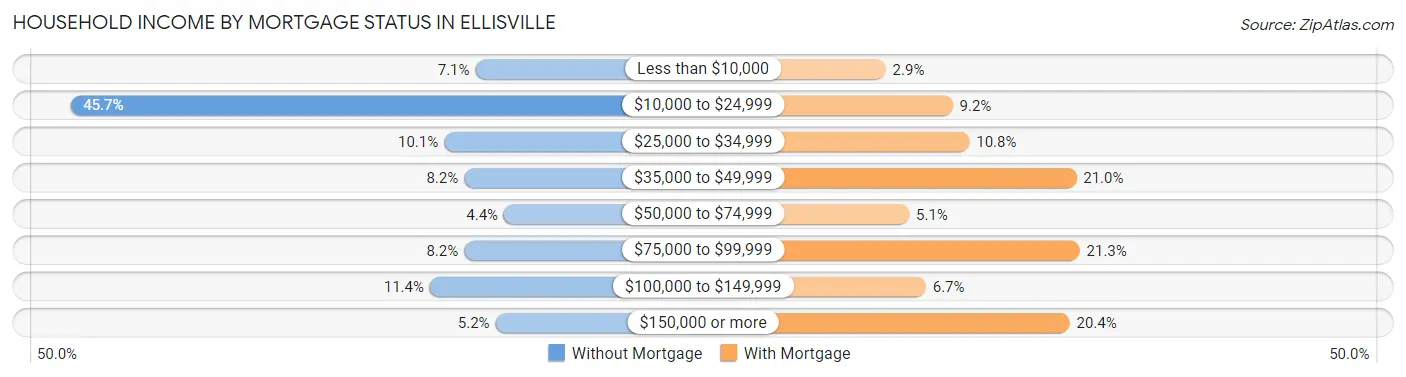
| Household Income | Without Mortgage | With Mortgage |
| Less than $10,000 | 26 (7.1%) | 9 (2.9%) |
| $10,000 to $24,999 | 168 (45.7%) | 29 (9.2%) |
| $25,000 to $34,999 | 37 (10.1%) | 34 (10.8%) |
| $35,000 to $49,999 | 30 (8.2%) | 66 (21.0%) |
| $50,000 to $74,999 | 16 (4.3%) | 16 (5.1%) |
| $75,000 to $99,999 | 30 (8.2%) | 67 (21.3%) |
| $100,000 to $149,999 | 42 (11.4%) | 21 (6.7%) |
| $150,000 or more | 19 (5.2%) | 64 (20.4%) |
| Total | 368 (100.0%) | 314 (100.0%) |
Property Value to Household Income Ratio in Ellisville
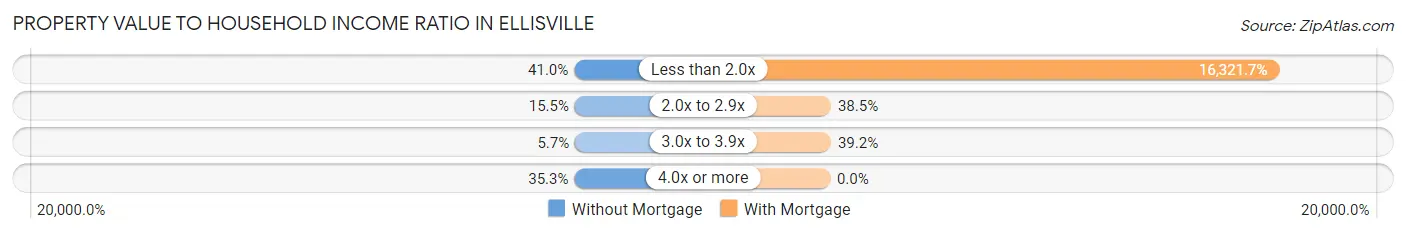
| Value-to-Income Ratio | Without Mortgage | With Mortgage |
| Less than 2.0x | 151 (41.0%) | 51,250 (16,321.7%) |
| 2.0x to 2.9x | 57 (15.5%) | 121 (38.5%) |
| 3.0x to 3.9x | 21 (5.7%) | 123 (39.2%) |
| 4.0x or more | 130 (35.3%) | 0 (0.0%) |
| Total | 368 (100.0%) | 314 (100.0%) |
Real Estate Taxes by Mortgage Status in Ellisville
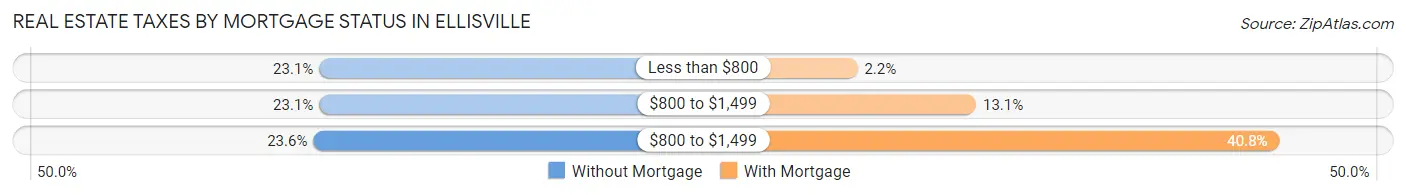
| Property Taxes | Without Mortgage | With Mortgage |
| Less than $800 | 85 (23.1%) | 7 (2.2%) |
| $800 to $1,499 | 85 (23.1%) | 41 (13.1%) |
| $800 to $1,499 | 87 (23.6%) | 128 (40.8%) |
| Total | 368 (100.0%) | 314 (100.0%) |
Health & Disability in Ellisville
Health Insurance Coverage by Age in Ellisville
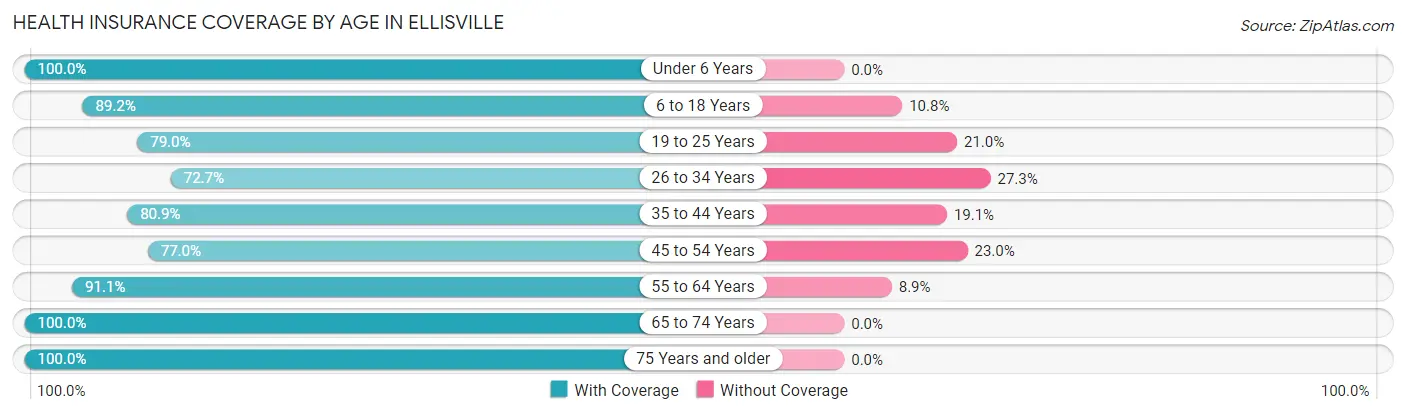
| Age Bracket | With Coverage | Without Coverage |
| Under 6 Years | 213 (100.0%) | 0 (0.0%) |
| 6 to 18 Years | 975 (89.2%) | 118 (10.8%) |
| 19 to 25 Years | 451 (79.0%) | 120 (21.0%) |
| 26 to 34 Years | 176 (72.7%) | 66 (27.3%) |
| 35 to 44 Years | 376 (80.9%) | 89 (19.1%) |
| 45 to 54 Years | 352 (77.0%) | 105 (23.0%) |
| 55 to 64 Years | 463 (91.1%) | 45 (8.9%) |
| 65 to 74 Years | 379 (100.0%) | 0 (0.0%) |
| 75 Years and older | 306 (100.0%) | 0 (0.0%) |
| Total | 3,691 (87.2%) | 543 (12.8%) |
Health Insurance Coverage by Citizenship Status in Ellisville
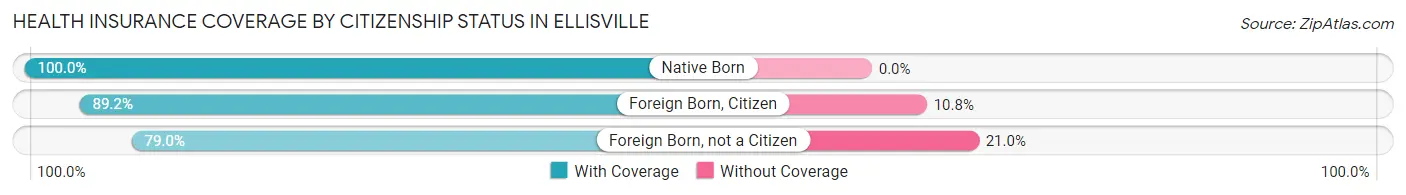
| Citizenship Status | With Coverage | Without Coverage |
| Native Born | 213 (100.0%) | 0 (0.0%) |
| Foreign Born, Citizen | 975 (89.2%) | 118 (10.8%) |
| Foreign Born, not a Citizen | 451 (79.0%) | 120 (21.0%) |
Health Insurance Coverage by Household Income in Ellisville
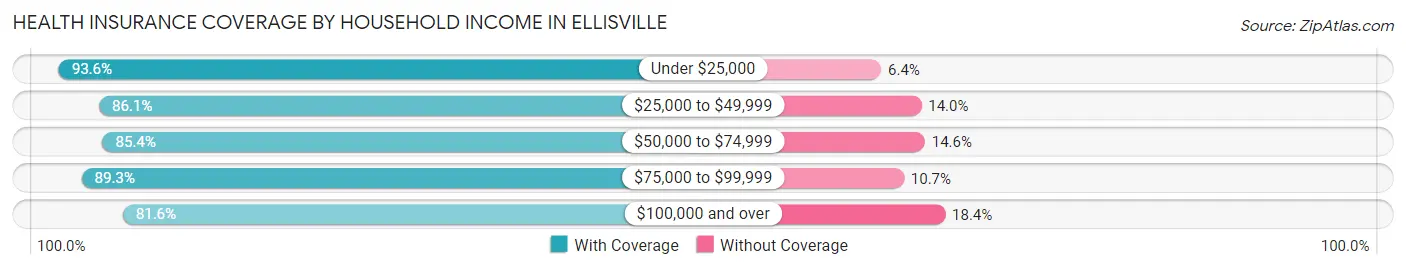
| Household Income | With Coverage | Without Coverage |
| Under $25,000 | 1,079 (93.6%) | 74 (6.4%) |
| $25,000 to $49,999 | 697 (86.1%) | 113 (14.0%) |
| $50,000 to $74,999 | 380 (85.4%) | 65 (14.6%) |
| $75,000 to $99,999 | 117 (89.3%) | 14 (10.7%) |
| $100,000 and over | 629 (81.6%) | 142 (18.4%) |
Public vs Private Health Insurance Coverage by Age in Ellisville
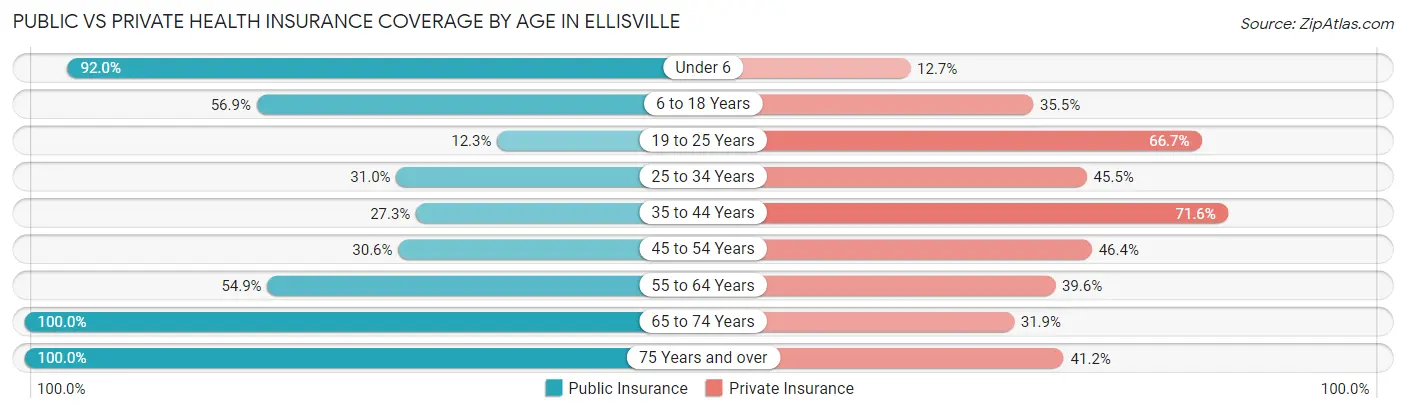
| Age Bracket | Public Insurance | Private Insurance |
| Under 6 | 196 (92.0%) | 27 (12.7%) |
| 6 to 18 Years | 622 (56.9%) | 388 (35.5%) |
| 19 to 25 Years | 70 (12.3%) | 381 (66.7%) |
| 25 to 34 Years | 75 (31.0%) | 110 (45.5%) |
| 35 to 44 Years | 127 (27.3%) | 333 (71.6%) |
| 45 to 54 Years | 140 (30.6%) | 212 (46.4%) |
| 55 to 64 Years | 279 (54.9%) | 201 (39.6%) |
| 65 to 74 Years | 379 (100.0%) | 121 (31.9%) |
| 75 Years and over | 306 (100.0%) | 126 (41.2%) |
| Total | 2,194 (51.8%) | 1,899 (44.9%) |
Disability Status by Sex by Age in Ellisville
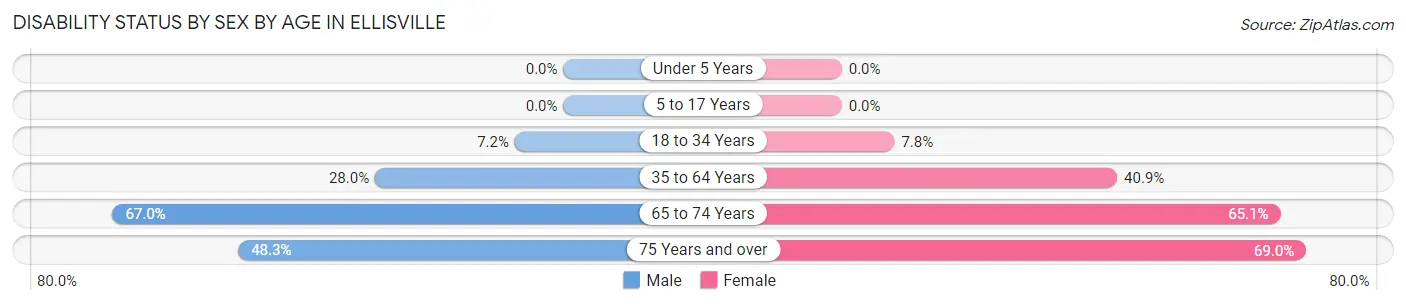
| Age Bracket | Male | Female |
| Under 5 Years | 0 (0.0%) | 0 (0.0%) |
| 5 to 17 Years | 0 (0.0%) | 0 (0.0%) |
| 18 to 34 Years | 30 (7.2%) | 55 (7.8%) |
| 35 to 64 Years | 205 (28.0%) | 285 (40.9%) |
| 65 to 74 Years | 79 (66.9%) | 170 (65.1%) |
| 75 Years and over | 56 (48.3%) | 131 (69.0%) |
Disability Class by Sex by Age in Ellisville
Disability Class: Hearing Difficulty
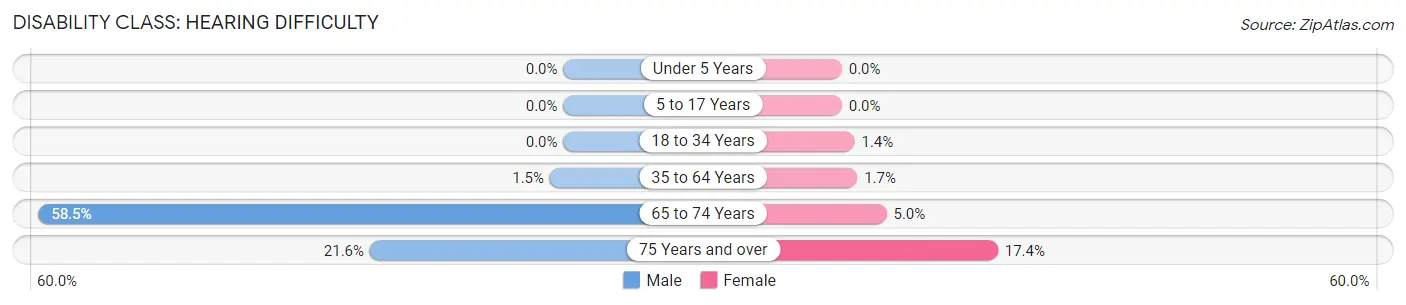
| Age Bracket | Male | Female |
| Under 5 Years | 0 (0.0%) | 0 (0.0%) |
| 5 to 17 Years | 0 (0.0%) | 0 (0.0%) |
| 18 to 34 Years | 0 (0.0%) | 10 (1.4%) |
| 35 to 64 Years | 11 (1.5%) | 12 (1.7%) |
| 65 to 74 Years | 69 (58.5%) | 13 (5.0%) |
| 75 Years and over | 25 (21.5%) | 33 (17.4%) |
Disability Class: Vision Difficulty
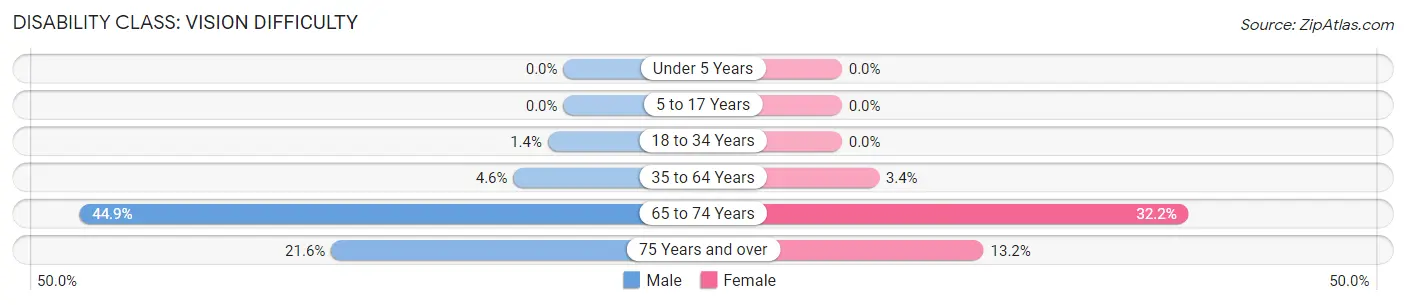
| Age Bracket | Male | Female |
| Under 5 Years | 0 (0.0%) | 0 (0.0%) |
| 5 to 17 Years | 0 (0.0%) | 0 (0.0%) |
| 18 to 34 Years | 6 (1.4%) | 0 (0.0%) |
| 35 to 64 Years | 34 (4.6%) | 24 (3.4%) |
| 65 to 74 Years | 53 (44.9%) | 84 (32.2%) |
| 75 Years and over | 25 (21.5%) | 25 (13.2%) |
Disability Class: Cognitive Difficulty
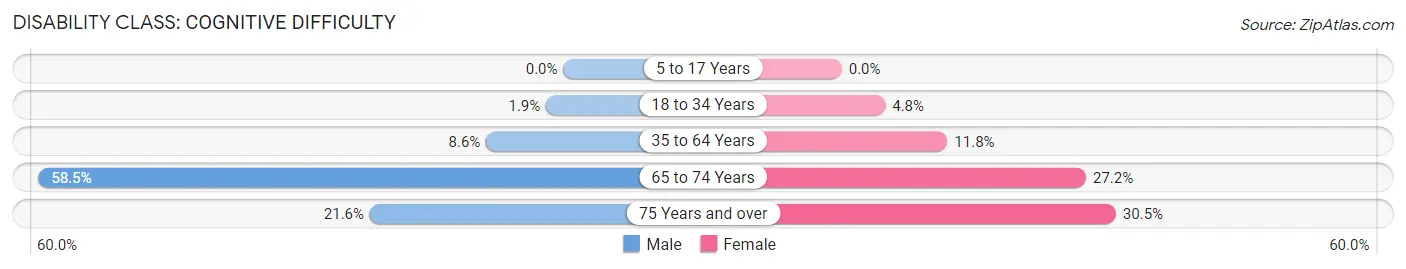
| Age Bracket | Male | Female |
| 5 to 17 Years | 0 (0.0%) | 0 (0.0%) |
| 18 to 34 Years | 8 (1.9%) | 34 (4.8%) |
| 35 to 64 Years | 63 (8.6%) | 82 (11.8%) |
| 65 to 74 Years | 69 (58.5%) | 71 (27.2%) |
| 75 Years and over | 25 (21.5%) | 58 (30.5%) |
Disability Class: Ambulatory Difficulty
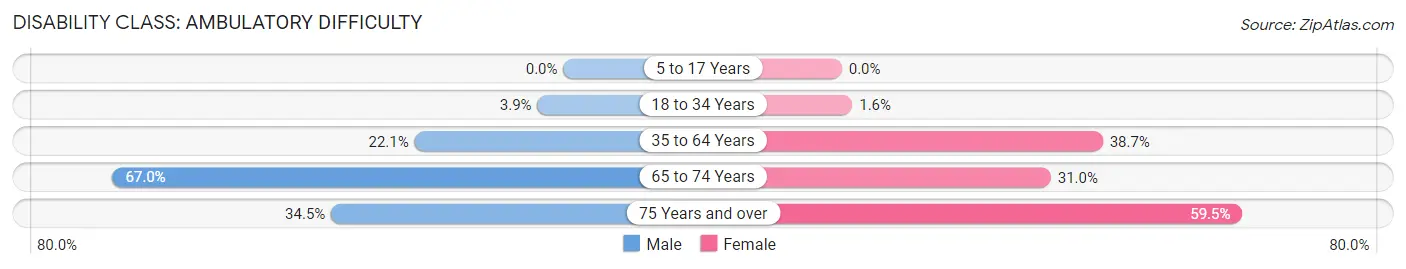
| Age Bracket | Male | Female |
| 5 to 17 Years | 0 (0.0%) | 0 (0.0%) |
| 18 to 34 Years | 16 (3.8%) | 11 (1.6%) |
| 35 to 64 Years | 162 (22.1%) | 270 (38.7%) |
| 65 to 74 Years | 79 (66.9%) | 81 (31.0%) |
| 75 Years and over | 40 (34.5%) | 113 (59.5%) |
Disability Class: Self-Care Difficulty
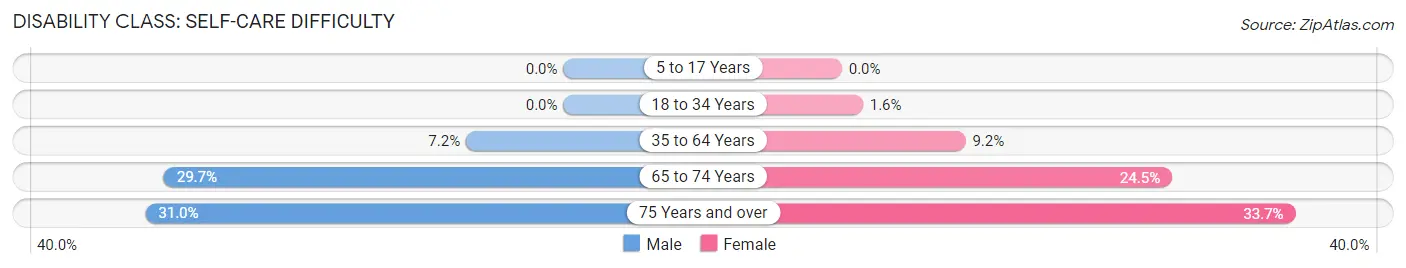
| Age Bracket | Male | Female |
| 5 to 17 Years | 0 (0.0%) | 0 (0.0%) |
| 18 to 34 Years | 0 (0.0%) | 11 (1.6%) |
| 35 to 64 Years | 53 (7.2%) | 64 (9.2%) |
| 65 to 74 Years | 35 (29.7%) | 64 (24.5%) |
| 75 Years and over | 36 (31.0%) | 64 (33.7%) |
Technology Access in Ellisville
Computing Device Access in Ellisville
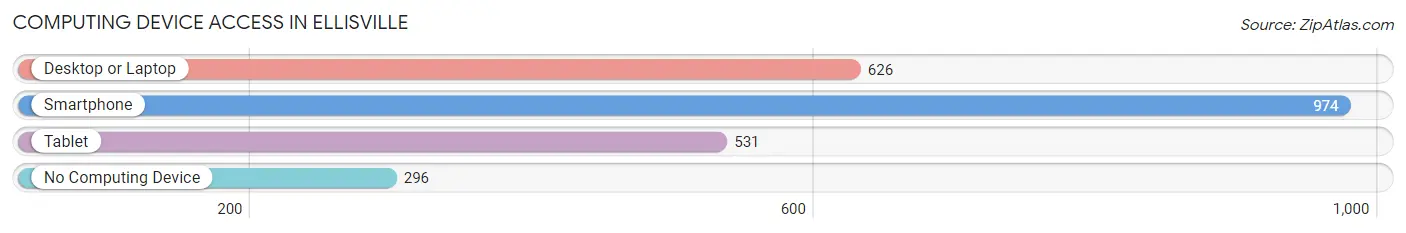
| Device Type | # Households | % Households |
| Desktop or Laptop | 626 | 48.3% |
| Smartphone | 974 | 75.1% |
| Tablet | 531 | 41.0% |
| No Computing Device | 296 | 22.8% |
| Total | 1,296 | 100.0% |
Internet Access in Ellisville
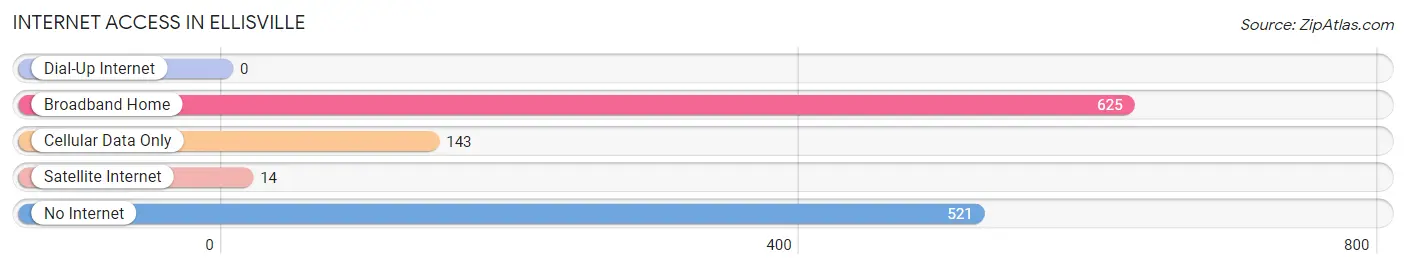
| Internet Type | # Households | % Households |
| Dial-Up Internet | 0 | 0.0% |
| Broadband Home | 625 | 48.2% |
| Cellular Data Only | 143 | 11.0% |
| Satellite Internet | 14 | 1.1% |
| No Internet | 521 | 40.2% |
| Total | 1,296 | 100.0% |
Ellisville Summary
Ellisville is a city located in Jones County, Mississippi, United States. It is the county seat of Jones County and is part of the Laurel, Mississippi Metropolitan Statistical Area. The population was 4,448 at the 2010 census.
History
The area that is now Ellisville was first settled in the early 1800s by settlers from North Carolina and Virginia. The town was originally known as "Mount Pleasant" and was later renamed "Ellisville" in honor of Powhatan Ellis, a prominent local politician.
Ellisville was incorporated in 1839 and was designated as the county seat of Jones County in 1841. The town quickly grew and became a center of commerce and industry in the region. The town was home to several sawmills, gristmills, and other businesses.
During the Civil War, Ellisville was the site of several skirmishes between Union and Confederate forces. After the war, the town continued to grow and by the early 1900s, it had become a major center of commerce and industry in the region.
Geography
Ellisville is located at 31°45'25" North, 89°17'45" West (31.756944, -89.295833). According to the United States Census Bureau, the city has a total area of 5.2 square miles (13.4 km2), all land.
Economy
Ellisville is a small city with a population of just over 4,000 people. The city is home to several small businesses, including restaurants, retail stores, and professional services. The city is also home to several manufacturing companies, including a furniture manufacturer, a paper mill, and a plastics manufacturer.
The city is also home to several educational institutions, including Jones County Junior College, William Carey University, and the University of Southern Mississippi.
Demographics
As of the 2010 census, there were 4,448 people, 1,717 households, and 1,093 families residing in the city. The population density was 854.2 people per square mile (330.2/km2). There were 1,919 housing units at an average density of 369.2 per square mile (142.7/km2). The racial makeup of the city was 68.2% White, 28.7% African American, 0.3% Native American, 0.7% Asian, 0.1% Pacific Islander, 0.7% from other races, and 1.2% from two or more races. Hispanic or Latino of any race were 2.2% of the population.
There were 1,717 households, out of which 28.2% had children under the age of 18 living with them, 39.2% were married couples living together, 19.2% had a female householder with no husband present, and 36.2% were non-families. 32.2% of all households were made up of individuals, and 14.2% had someone living alone who was 65 years of age or older. The average household size was 2.41 and the average family size was 3.03.
In the city, the population was spread out, with 24.7% under the age of 18, 11.2% from 18 to 24, 24.7% from 25 to 44, 22.2% from 45 to 64, and 17.2% who were 65 years of age or older. The median age was 36 years. For every 100 females, there were 87.2 males. For every 100 females age 18 and over, there were 81.2 males.
The median income for a household in the city was $25,938, and the median income for a family was $32,917. Males had a median income of $27,917 versus $20,000 for females. The per capita income for the city was $14,845. About 17.2% of families and 20.7% of the population were below the poverty line, including 28.2% of those under age 18 and 16.7% of those age 65 or over.
Common Questions
What is Per Capita Income in Ellisville?
Per Capita income in Ellisville is $17,020.
What is the Median Family Income in Ellisville?
Median Family Income in Ellisville is $41,950.
What is the Median Household income in Ellisville?
Median Household Income in Ellisville is $30,479.
What is Income or Wage Gap in Ellisville?
Income or Wage Gap in Ellisville is 32.2%.
Women in Ellisville earn 67.8 cents for every dollar earned by a man.
What is Family Income Deficit in Ellisville?
Family Income Deficit in Ellisville is $15,870.
Families that are below poverty line in Ellisville earn $15,870 less on average than the poverty threshold level.
What is Inequality or Gini Index in Ellisville?
Inequality or Gini Index in Ellisville is 0.54.
What is the Total Population of Ellisville?
Total Population of Ellisville is 4,615.
What is the Total Male Population of Ellisville?
Total Male Population of Ellisville is 2,171.
What is the Total Female Population of Ellisville?
Total Female Population of Ellisville is 2,444.
What is the Ratio of Males per 100 Females in Ellisville?
There are 88.83 Males per 100 Females in Ellisville.
What is the Ratio of Females per 100 Males in Ellisville?
There are 112.57 Females per 100 Males in Ellisville.
What is the Median Population Age in Ellisville?
Median Population Age in Ellisville is 36.0 Years.
What is the Average Family Size in Ellisville
Average Family Size in Ellisville is 3.8 People.
What is the Average Household Size in Ellisville
Average Household Size in Ellisville is 2.5 People.
How Large is the Labor Force in Ellisville?
There are 1,352 People in the Labor Forcein in Ellisville.
What is the Percentage of People in the Labor Force in Ellisville?
36.4% of People are in the Labor Force in Ellisville.
What is the Unemployment Rate in Ellisville?
Unemployment Rate in Ellisville is 9.3%.