Satartia, MS Map & Demographics
Satartia Map
Satartia Overview
$34,920
PER CAPITA INCOME
$113,214
AVG FAMILY INCOME
0.39
INEQUALITY / GINI INDEX
44
TOTAL POPULATION
24
MALE POPULATION
20
FEMALE POPULATION
120.00
MALES / 100 FEMALES
83.33
FEMALES / 100 MALES
57.0
MEDIAN AGE
2.2
AVG FAMILY SIZE
1.8
AVG HOUSEHOLD SIZE
27
LABOR FORCE [ PEOPLE ]
69.2%
PERCENT IN LABOR FORCE
Satartia Zip Codes
Satartia Area Codes
Income in Satartia
Income Overview in Satartia
| Characteristic | Number | Measure |
| Per Capita Income | 44 | $34,920 |
| Median Family Income | 16 | $113,214 |
| Mean Family Income | 16 | $113,831 |
| Median Household Income | 24 | $0 |
| Mean Household Income | 24 | $89,333 |
| Income Deficit | 16 | $0 |
| Wage / Income Gap (%) | 44 | 0.00% |
| Wage / Income Gap ($) | 44 | 100.00¢ per $1 |
| Gini / Inequality Index | 44 | 0.39 |
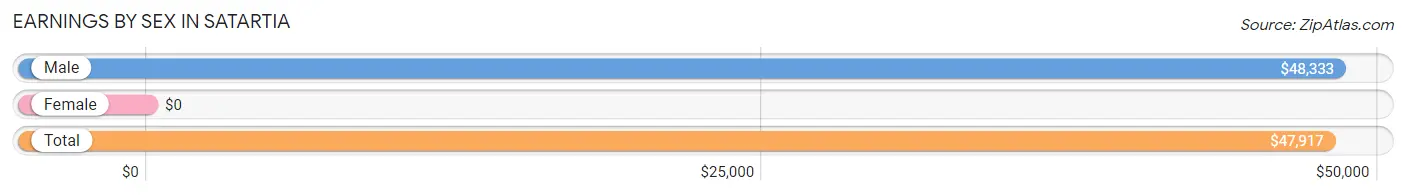
Earnings by Sex in Satartia
| Sex | Number | Average Earnings |
| Male | 18 (64.3%) | $48,333 |
| Female | 10 (35.7%) | $0 |
| Total | 28 (100.0%) | $47,917 |
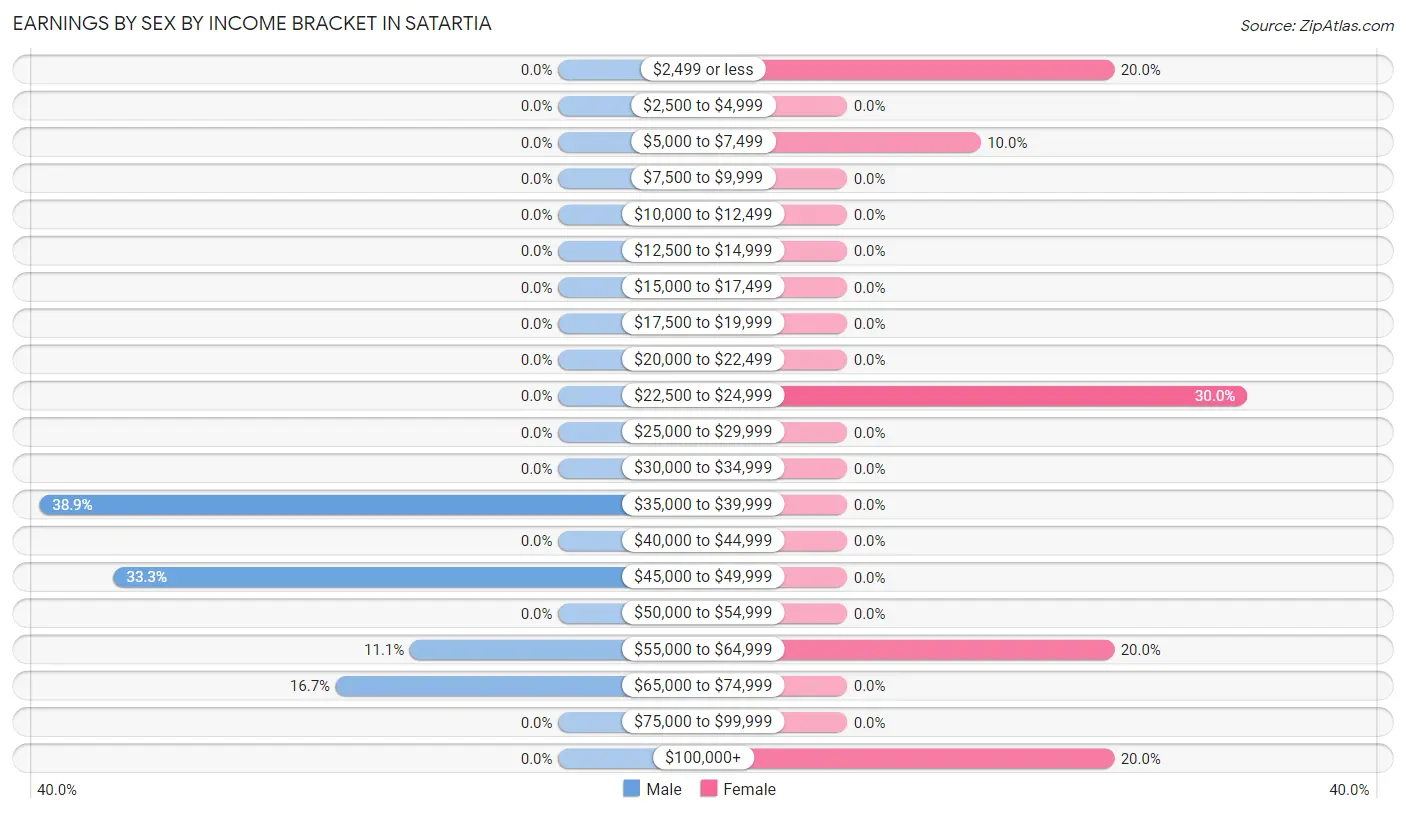
Earnings by Sex by Income Bracket in Satartia
The most common earnings brackets in Satartia are $35,000 to $39,999 for men (7 | 38.9%) and $22,500 to $24,999 for women (3 | 30.0%).
| Income | Male | Female |
| $2,499 or less | 0 (0.0%) | 2 (20.0%) |
| $2,500 to $4,999 | 0 (0.0%) | 0 (0.0%) |
| $5,000 to $7,499 | 0 (0.0%) | 1 (10.0%) |
| $7,500 to $9,999 | 0 (0.0%) | 0 (0.0%) |
| $10,000 to $12,499 | 0 (0.0%) | 0 (0.0%) |
| $12,500 to $14,999 | 0 (0.0%) | 0 (0.0%) |
| $15,000 to $17,499 | 0 (0.0%) | 0 (0.0%) |
| $17,500 to $19,999 | 0 (0.0%) | 0 (0.0%) |
| $20,000 to $22,499 | 0 (0.0%) | 0 (0.0%) |
| $22,500 to $24,999 | 0 (0.0%) | 3 (30.0%) |
| $25,000 to $29,999 | 0 (0.0%) | 0 (0.0%) |
| $30,000 to $34,999 | 0 (0.0%) | 0 (0.0%) |
| $35,000 to $39,999 | 7 (38.9%) | 0 (0.0%) |
| $40,000 to $44,999 | 0 (0.0%) | 0 (0.0%) |
| $45,000 to $49,999 | 6 (33.3%) | 0 (0.0%) |
| $50,000 to $54,999 | 0 (0.0%) | 0 (0.0%) |
| $55,000 to $64,999 | 2 (11.1%) | 2 (20.0%) |
| $65,000 to $74,999 | 3 (16.7%) | 0 (0.0%) |
| $75,000 to $99,999 | 0 (0.0%) | 0 (0.0%) |
| $100,000+ | 0 (0.0%) | 2 (20.0%) |
| Total | 18 (100.0%) | 10 (100.0%) |
Earnings by Sex by Educational Attainment in Satartia
| Educational Attainment | Male Income | Female Income |
| Less than High School | - | - |
| High School Diploma | - | - |
| College or Associate's Degree | - | - |
| Bachelor's Degree | - | - |
| Graduate Degree | - | - |
| Total | $48,333 | $0 |
Family Income in Satartia
Family Income Brackets in Satartia
According to the Satartia family income data, there are 7 families falling into the $100,000 to $149,999 income range, which is the most common income bracket and makes up 43.8% of all families.
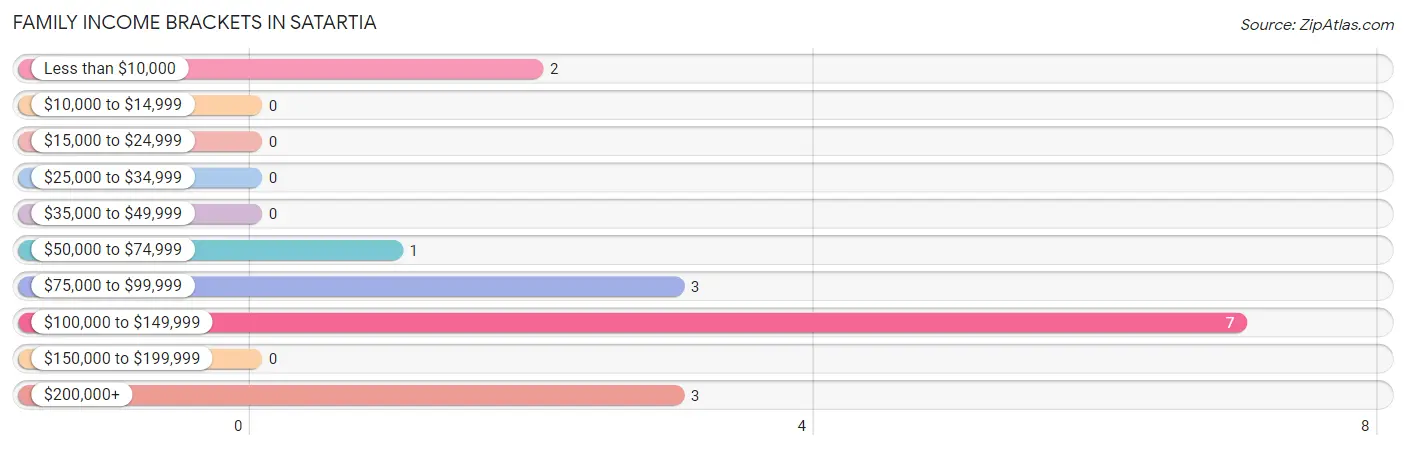
| Income Bracket | # Families | % Families |
| Less than $10,000 | 2 | 12.5% |
| $10,000 to $14,999 | 0 | 0.0% |
| $15,000 to $24,999 | 0 | 0.0% |
| $25,000 to $34,999 | 0 | 0.0% |
| $35,000 to $49,999 | 0 | 0.0% |
| $50,000 to $74,999 | 1 | 6.3% |
| $75,000 to $99,999 | 3 | 18.8% |
| $100,000 to $149,999 | 7 | 43.8% |
| $150,000 to $199,999 | 0 | 0.0% |
| $200,000+ | 3 | 18.8% |
Family Income by Famaliy Size in Satartia
| Income Bracket | # Families | Median Income |
| 2-Person Families | 7 (43.8%) | $0 |
| 3-Person Families | 0 (0.0%) | $0 |
| 4-Person Families | 9 (56.2%) | $0 |
| 5-Person Families | 0 (0.0%) | $0 |
| 6-Person Families | 0 (0.0%) | $0 |
| 7+ Person Families | 0 (0.0%) | $0 |
| Total | 16 (100.0%) | $113,214 |
Family Income by Number of Earners in Satartia
| Number of Earners | # Families | Median Income |
| No Earners | 0 (0.0%) | $0 |
| 1 Earner | 5 (31.2%) | $0 |
| 2 Earners | 4 (25.0%) | $0 |
| 3+ Earners | 7 (43.8%) | $0 |
| Total | 16 (100.0%) | $113,214 |
Household Income in Satartia
Household Income Brackets in Satartia
With 7 households falling in the category, the $100,000 to $149,999 income range is the most frequent in Satartia, accounting for 29.2% of all households.
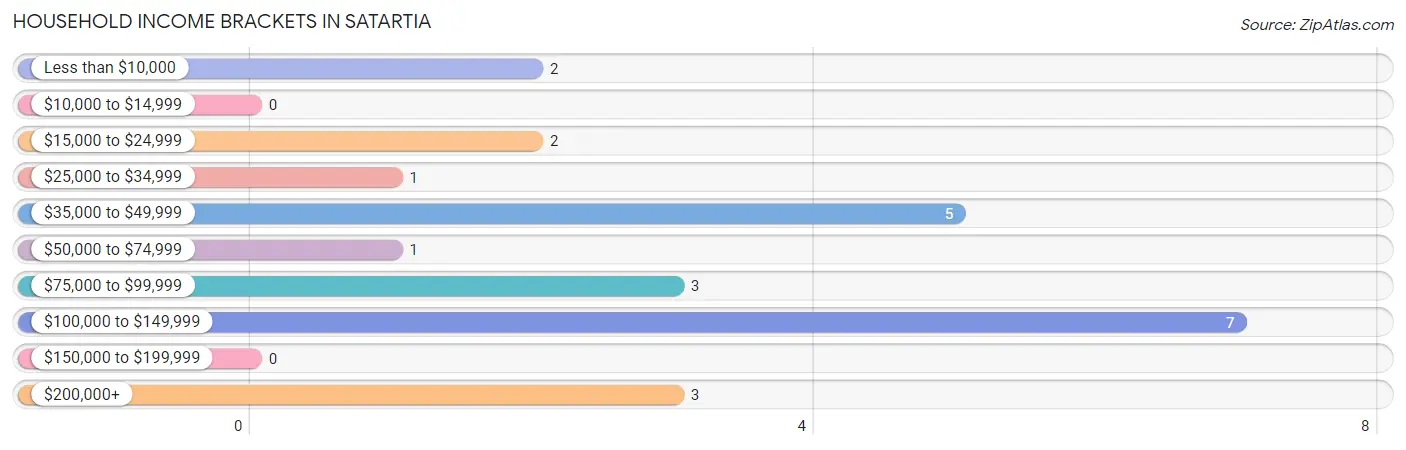
| Income Bracket | # Households | % Households |
| Less than $10,000 | 2 | 8.3% |
| $10,000 to $14,999 | 0 | 0.0% |
| $15,000 to $24,999 | 2 | 8.3% |
| $25,000 to $34,999 | 1 | 4.2% |
| $35,000 to $49,999 | 5 | 20.8% |
| $50,000 to $74,999 | 1 | 4.2% |
| $75,000 to $99,999 | 3 | 12.5% |
| $100,000 to $149,999 | 7 | 29.2% |
| $150,000 to $199,999 | 0 | 0.0% |
| $200,000+ | 3 | 12.5% |
Household Income by Householder Age in Satartia
| Income Bracket | # Households | Median Income |
| 15 to 24 Years | 0 (0.0%) | $0 |
| 25 to 44 Years | 0 (0.0%) | $0 |
| 45 to 64 Years | 20 (83.3%) | $0 |
| 65+ Years | 4 (16.7%) | $0 |
| Total | 24 (100.0%) | $0 |
Poverty in Satartia
Income Below Poverty by Sex and Age in Satartia
With 12.5% poverty level for males and 35.0% for females among the residents of Satartia, 35 to 44 year old males and 12 to 14 year old females are the most vulnerable to poverty, with 3 males (100.0%) and 3 females (100.0%) in their respective age groups living below the poverty level.
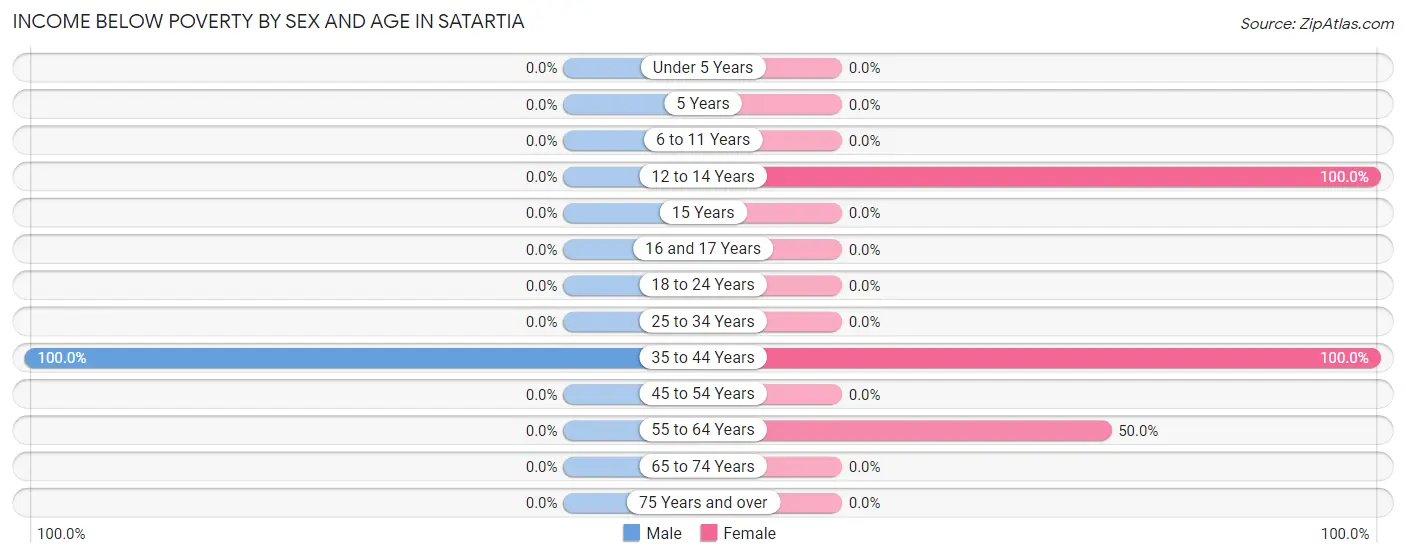
| Age Bracket | Male | Female |
| Under 5 Years | 0 (0.0%) | 0 (0.0%) |
| 5 Years | 0 (0.0%) | 0 (0.0%) |
| 6 to 11 Years | 0 (0.0%) | 0 (0.0%) |
| 12 to 14 Years | 0 (0.0%) | 3 (100.0%) |
| 15 Years | 0 (0.0%) | 0 (0.0%) |
| 16 and 17 Years | 0 (0.0%) | 0 (0.0%) |
| 18 to 24 Years | 0 (0.0%) | 0 (0.0%) |
| 25 to 34 Years | 0 (0.0%) | 0 (0.0%) |
| 35 to 44 Years | 3 (100.0%) | 2 (100.0%) |
| 45 to 54 Years | 0 (0.0%) | 0 (0.0%) |
| 55 to 64 Years | 0 (0.0%) | 2 (50.0%) |
| 65 to 74 Years | 0 (0.0%) | 0 (0.0%) |
| 75 Years and over | 0 (0.0%) | 0 (0.0%) |
| Total | 3 (12.5%) | 7 (35.0%) |
Income Above Poverty by Sex and Age in Satartia
According to the poverty statistics in Satartia, males aged 45 to 54 years and females aged under 5 years are the age groups that are most secure financially, with 100.0% of males and 100.0% of females in these age groups living above the poverty line.
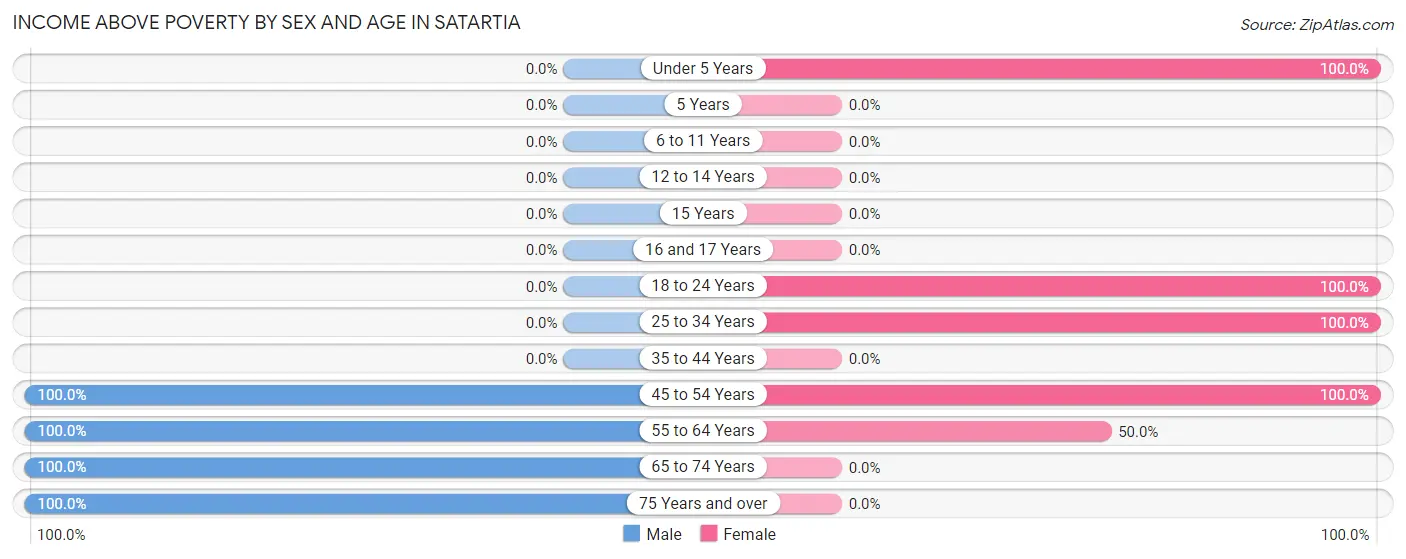
| Age Bracket | Male | Female |
| Under 5 Years | 0 (0.0%) | 2 (100.0%) |
| 5 Years | 0 (0.0%) | 0 (0.0%) |
| 6 to 11 Years | 0 (0.0%) | 0 (0.0%) |
| 12 to 14 Years | 0 (0.0%) | 0 (0.0%) |
| 15 Years | 0 (0.0%) | 0 (0.0%) |
| 16 and 17 Years | 0 (0.0%) | 0 (0.0%) |
| 18 to 24 Years | 0 (0.0%) | 1 (100.0%) |
| 25 to 34 Years | 0 (0.0%) | 3 (100.0%) |
| 35 to 44 Years | 0 (0.0%) | 0 (0.0%) |
| 45 to 54 Years | 1 (100.0%) | 5 (100.0%) |
| 55 to 64 Years | 16 (100.0%) | 2 (50.0%) |
| 65 to 74 Years | 3 (100.0%) | 0 (0.0%) |
| 75 Years and over | 1 (100.0%) | 0 (0.0%) |
| Total | 21 (87.5%) | 13 (65.0%) |
Income Below Poverty Among Married-Couple Families in Satartia
| Children | Above Poverty | Below Poverty |
| No Children | 6 (100.0%) | 0 (0.0%) |
| 1 or 2 Children | 7 (100.0%) | 0 (0.0%) |
| 3 or 4 Children | 0 (0.0%) | 0 (0.0%) |
| 5 or more Children | 0 (0.0%) | 0 (0.0%) |
| Total | 13 (100.0%) | 0 (0.0%) |
Income Below Poverty Among Single-Parent Households in Satartia
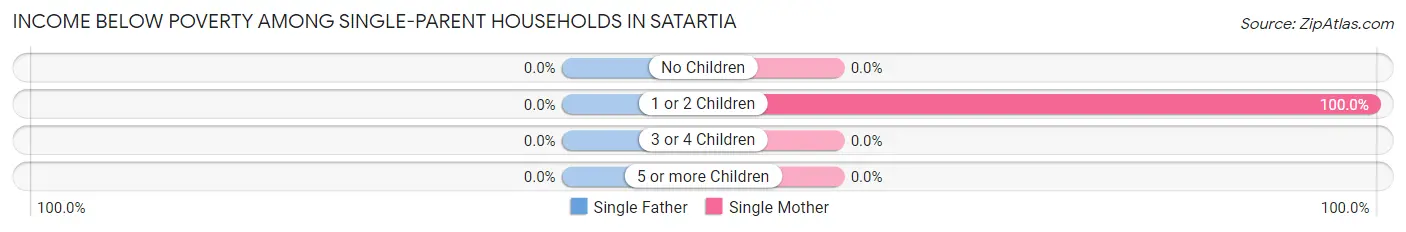
| Children | Single Father | Single Mother |
| No Children | 0 (0.0%) | 0 (0.0%) |
| 1 or 2 Children | 0 (0.0%) | 2 (100.0%) |
| 3 or 4 Children | 0 (0.0%) | 0 (0.0%) |
| 5 or more Children | 0 (0.0%) | 0 (0.0%) |
| Total | 0 (0.0%) | 2 (100.0%) |
Income Below Poverty Among Married-Couple vs Single-Parent Households in Satartia
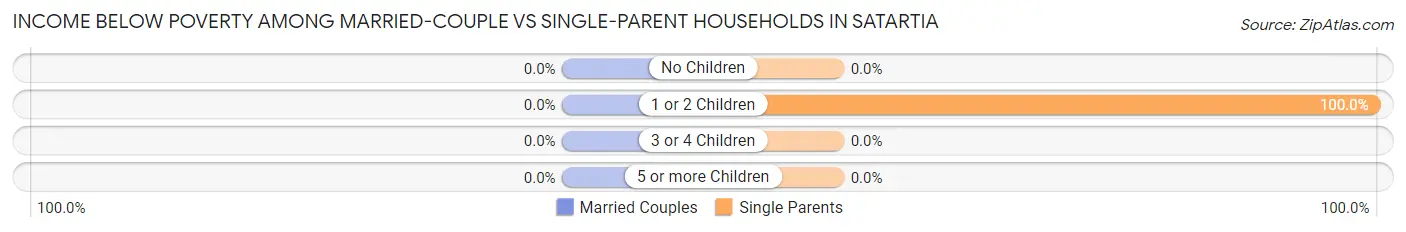
| Children | Married-Couple Families | Single-Parent Households |
| No Children | 0 (0.0%) | 0 (0.0%) |
| 1 or 2 Children | 0 (0.0%) | 2 (100.0%) |
| 3 or 4 Children | 0 (0.0%) | 0 (0.0%) |
| 5 or more Children | 0 (0.0%) | 0 (0.0%) |
| Total | 0 (0.0%) | 2 (66.7%) |
Race in Satartia
The most populous races in Satartia are Black / African American (26 | 59.1%), and White / Caucasian (18 | 40.9%).
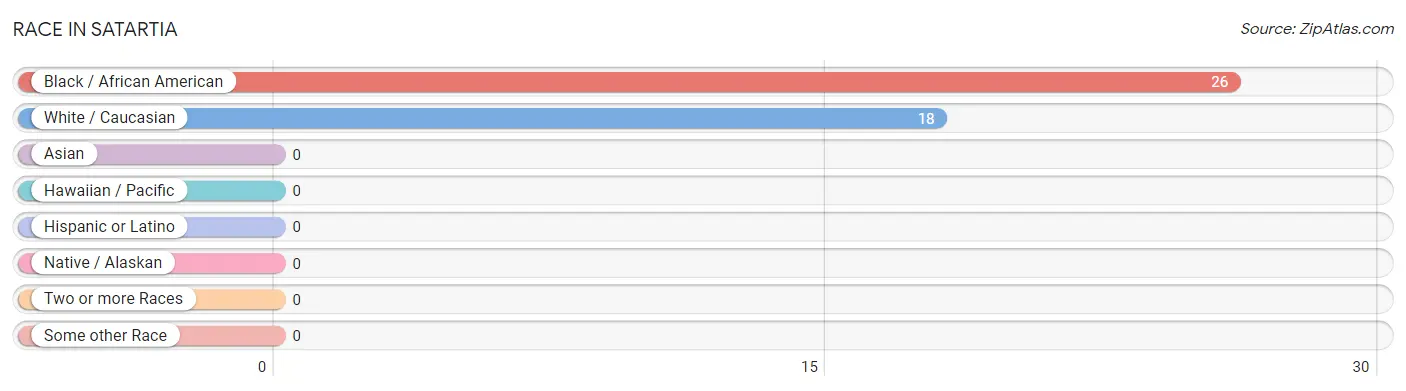
| Race | # Population | % Population |
| Asian | 0 | 0.0% |
| Black / African American | 26 | 59.1% |
| Hawaiian / Pacific | 0 | 0.0% |
| Hispanic or Latino | 0 | 0.0% |
| Native / Alaskan | 0 | 0.0% |
| White / Caucasian | 18 | 40.9% |
| Two or more Races | 0 | 0.0% |
| Some other Race | 0 | 0.0% |
| Total | 44 | 100.0% |
Ancestry in Satartia

| Ancestry | # Population | % Population | View All 0 Rows |
Immigrants in Satartia

| Immigration Origin | # Population | % Population | View All 0 Rows |
Sex and Age in Satartia
Sex and Age in Satartia
The most populous age groups in Satartia are 55 to 59 Years (14 | 58.3%) for men and 10 to 14 Years (3 | 15.0%) for women.
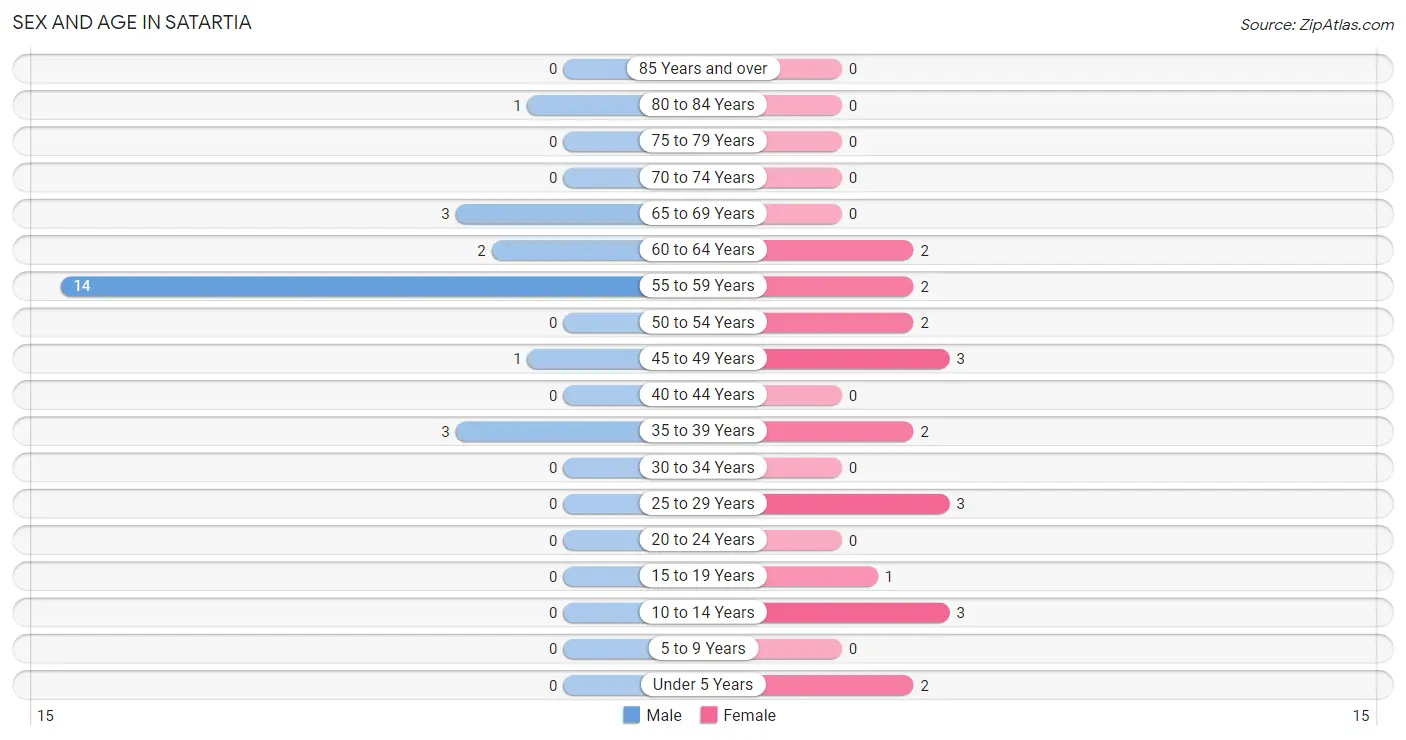
| Age Bracket | Male | Female |
| Under 5 Years | 0 (0.0%) | 2 (10.0%) |
| 5 to 9 Years | 0 (0.0%) | 0 (0.0%) |
| 10 to 14 Years | 0 (0.0%) | 3 (15.0%) |
| 15 to 19 Years | 0 (0.0%) | 1 (5.0%) |
| 20 to 24 Years | 0 (0.0%) | 0 (0.0%) |
| 25 to 29 Years | 0 (0.0%) | 3 (15.0%) |
| 30 to 34 Years | 0 (0.0%) | 0 (0.0%) |
| 35 to 39 Years | 3 (12.5%) | 2 (10.0%) |
| 40 to 44 Years | 0 (0.0%) | 0 (0.0%) |
| 45 to 49 Years | 1 (4.2%) | 3 (15.0%) |
| 50 to 54 Years | 0 (0.0%) | 2 (10.0%) |
| 55 to 59 Years | 14 (58.3%) | 2 (10.0%) |
| 60 to 64 Years | 2 (8.3%) | 2 (10.0%) |
| 65 to 69 Years | 3 (12.5%) | 0 (0.0%) |
| 70 to 74 Years | 0 (0.0%) | 0 (0.0%) |
| 75 to 79 Years | 0 (0.0%) | 0 (0.0%) |
| 80 to 84 Years | 1 (4.2%) | 0 (0.0%) |
| 85 Years and over | 0 (0.0%) | 0 (0.0%) |
| Total | 24 (100.0%) | 20 (100.0%) |
Families and Households in Satartia
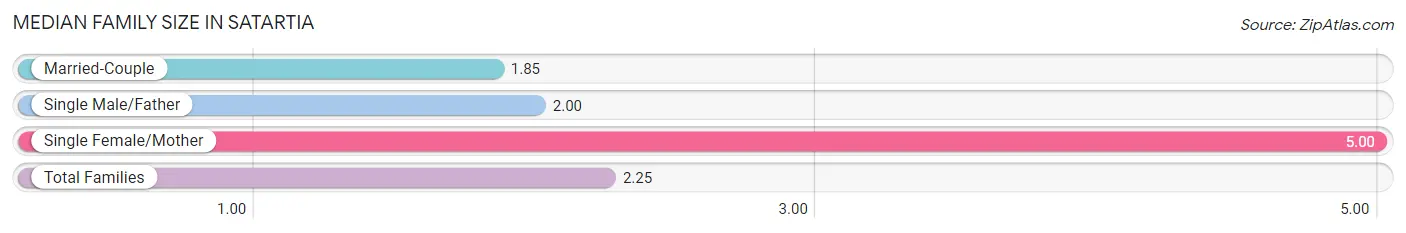
Median Family Size in Satartia
The median family size in Satartia is 2.25 persons per family, with single female/mother families (2 | 12.5%) accounting for the largest median family size of 5 persons per family. On the other hand, married-couple families (13 | 81.2%) represent the smallest median family size with 1.85 persons per family.
| Family Type | # Families | Family Size |
| Married-Couple | 13 (81.2%) | 1.85 |
| Single Male/Father | 1 (6.2%) | 2.00 |
| Single Female/Mother | 2 (12.5%) | 5.00 |
| Total Families | 16 (100.0%) | 2.25 |
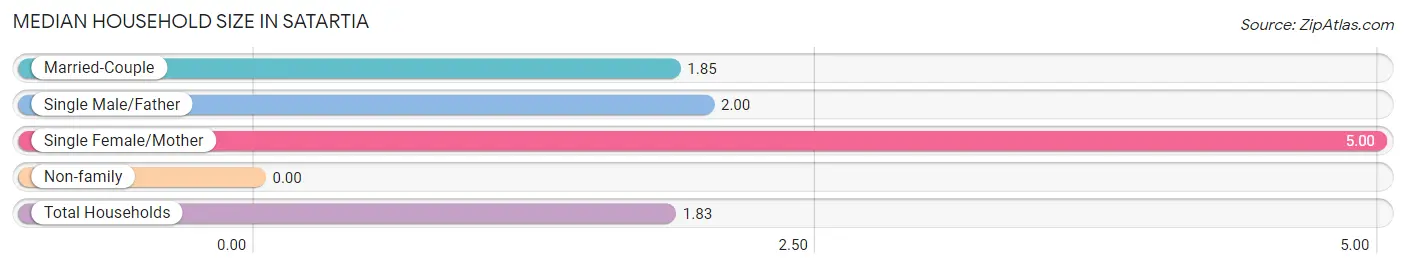
Median Household Size in Satartia
| Household Type | # Households | Household Size |
| Married-Couple | 13 (54.2%) | 1.85 |
| Single Male/Father | 1 (4.2%) | 2.00 |
| Single Female/Mother | 2 (8.3%) | 5.00 |
| Non-family | 8 (33.3%) | - |
| Total Households | 24 (100.0%) | 1.83 |
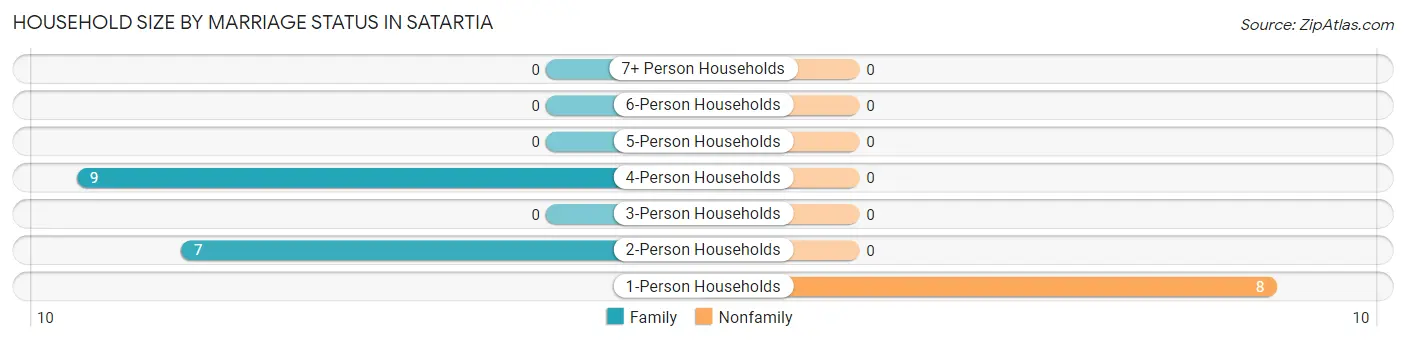
Household Size by Marriage Status in Satartia
Out of a total of 24 households in Satartia, 16 (66.7%) are family households, while 8 (33.3%) are nonfamily households. The most numerous type of family households are 4-person households, comprising 9, and the most common type of nonfamily households are 1-person households, comprising 8.
| Household Size | Family Households | Nonfamily Households |
| 1-Person Households | - | 8 (33.3%) |
| 2-Person Households | 7 (29.2%) | 0 (0.0%) |
| 3-Person Households | 0 (0.0%) | 0 (0.0%) |
| 4-Person Households | 9 (37.5%) | 0 (0.0%) |
| 5-Person Households | 0 (0.0%) | 0 (0.0%) |
| 6-Person Households | 0 (0.0%) | 0 (0.0%) |
| 7+ Person Households | 0 (0.0%) | 0 (0.0%) |
| Total | 16 (66.7%) | 8 (33.3%) |
Female Fertility in Satartia
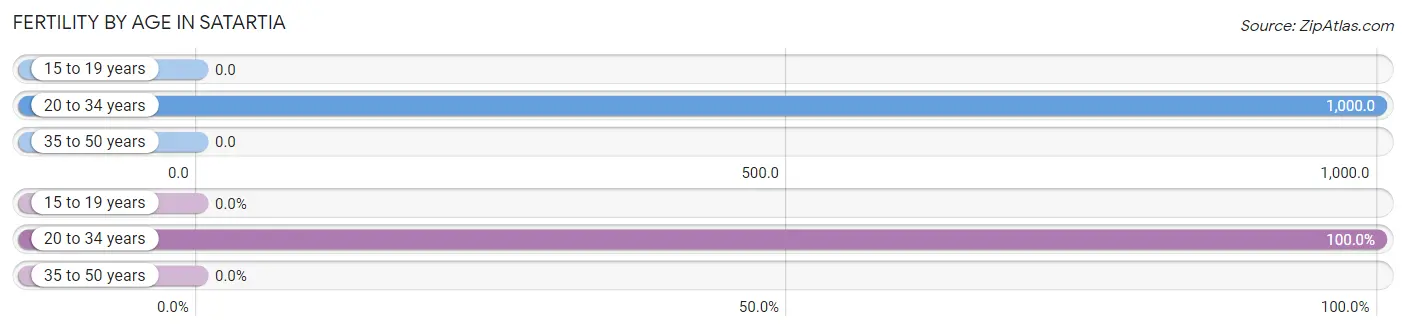
Fertility by Age in Satartia
Average fertility rate in Satartia is 333.0 births per 1,000 women. Women in the age bracket of 20 to 34 years have the highest fertility rate with 1,000.0 births per 1,000 women. Women in the age bracket of 20 to 34 years acount for 100.0% of all women with births.
| Age Bracket | Women with Births | Births / 1,000 Women |
| 15 to 19 years | 0 (0.0%) | 0.0 |
| 20 to 34 years | 3 (100.0%) | 1,000.0 |
| 35 to 50 years | 0 (0.0%) | 0.0 |
| Total | 3 (100.0%) | 333.0 |
Fertility by Age by Marriage Status in Satartia
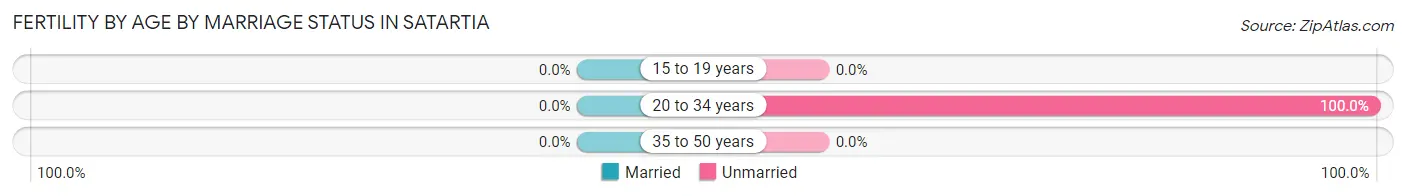
| Age Bracket | Married | Unmarried |
| 15 to 19 years | 0 (0.0%) | 0 (0.0%) |
| 20 to 34 years | 0 (0.0%) | 3 (100.0%) |
| 35 to 50 years | 0 (0.0%) | 0 (0.0%) |
| Total | 0 (0.0%) | 3 (100.0%) |
Fertility by Education in Satartia
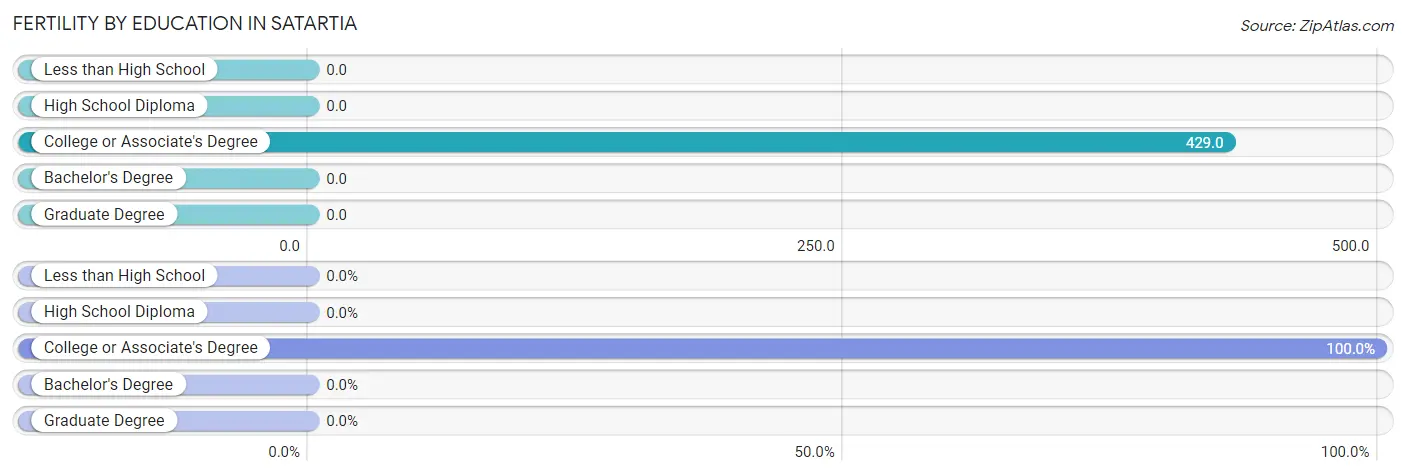
| Educational Attainment | Women with Births | Births / 1,000 Women |
| Less than High School | 0 (0.0%) | 0.0 |
| High School Diploma | 0 (0.0%) | 0.0 |
| College or Associate's Degree | 3 (100.0%) | 429.0 |
| Bachelor's Degree | 0 (0.0%) | 0.0 |
| Graduate Degree | 0 (0.0%) | 0.0 |
| Total | 3 (100.0%) | 333.0 |
Fertility by Education by Marriage Status in Satartia
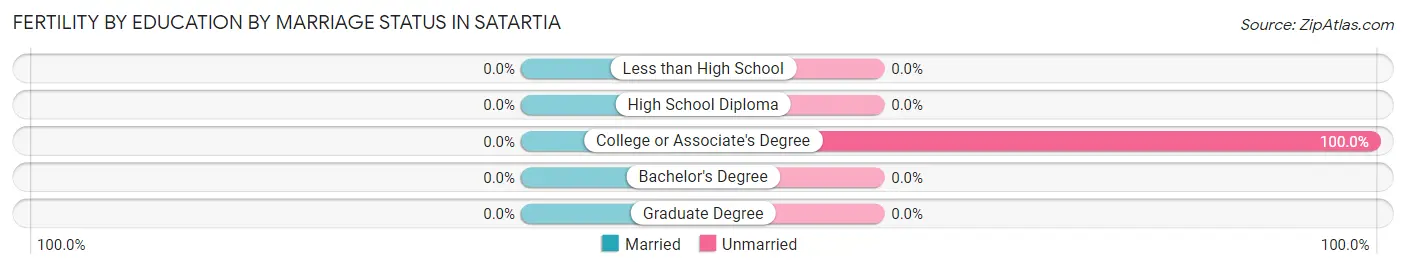
| Educational Attainment | Married | Unmarried |
| Less than High School | 0 (0.0%) | 0 (0.0%) |
| High School Diploma | 0 (0.0%) | 0 (0.0%) |
| College or Associate's Degree | 0 (0.0%) | 3 (100.0%) |
| Bachelor's Degree | 0 (0.0%) | 0 (0.0%) |
| Graduate Degree | 0 (0.0%) | 0 (0.0%) |
| Total | 0 (0.0%) | 3 (100.0%) |
Employment Characteristics in Satartia
Employment by Class of Employer in Satartia
Among the 27 employed individuals in Satartia, private company employees (18 | 66.7%), local government employees (7 | 25.9%), and state government employees (2 | 7.4%) make up the most common classes of employment.
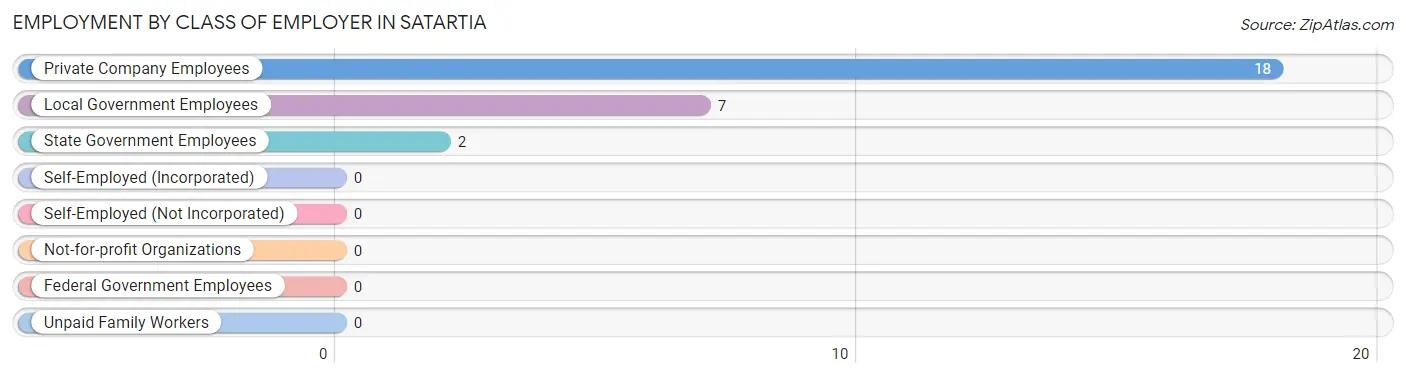
| Employer Class | # Employees | % Employees |
| Private Company Employees | 18 | 66.7% |
| Self-Employed (Incorporated) | 0 | 0.0% |
| Self-Employed (Not Incorporated) | 0 | 0.0% |
| Not-for-profit Organizations | 0 | 0.0% |
| Local Government Employees | 7 | 25.9% |
| State Government Employees | 2 | 7.4% |
| Federal Government Employees | 0 | 0.0% |
| Unpaid Family Workers | 0 | 0.0% |
| Total | 27 | 100.0% |
Employment Status by Age in Satartia
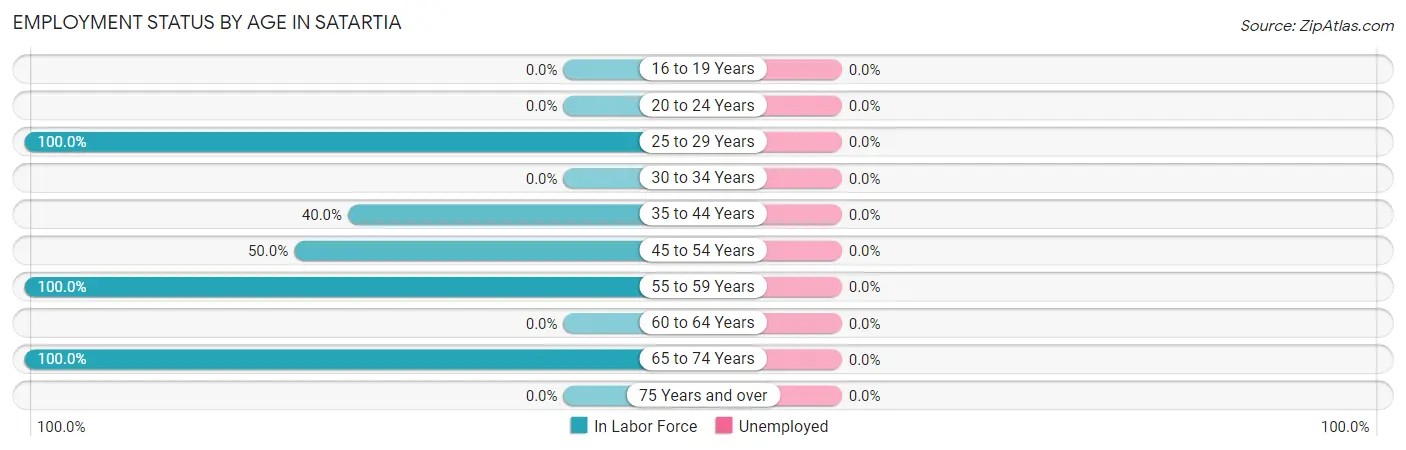
| Age Bracket | In Labor Force | Unemployed |
| 16 to 19 Years | 0 (0.0%) | 0 (0.0%) |
| 20 to 24 Years | 0 (0.0%) | 0 (0.0%) |
| 25 to 29 Years | 3 (100.0%) | 0 (0.0%) |
| 30 to 34 Years | 0 (0.0%) | 0 (0.0%) |
| 35 to 44 Years | 2 (40.0%) | 0 (0.0%) |
| 45 to 54 Years | 3 (50.0%) | 0 (0.0%) |
| 55 to 59 Years | 16 (100.0%) | 0 (0.0%) |
| 60 to 64 Years | 0 (0.0%) | 0 (0.0%) |
| 65 to 74 Years | 3 (100.0%) | 0 (0.0%) |
| 75 Years and over | 0 (0.0%) | 0 (0.0%) |
| Total | 27 (69.2%) | 0 (0.0%) |
Employment Status by Educational Attainment in Satartia
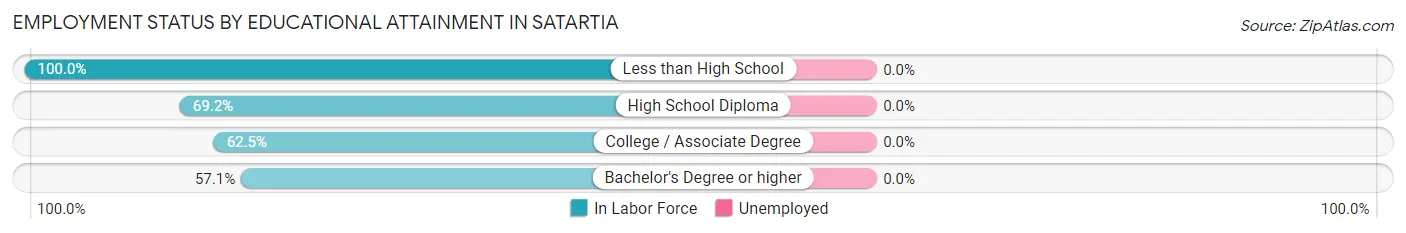
| Educational Attainment | In Labor Force | Unemployed |
| Less than High School | 6 (100.0%) | 0 (0.0%) |
| High School Diploma | 9 (69.2%) | 0 (0.0%) |
| College / Associate Degree | 5 (62.5%) | 0 (0.0%) |
| Bachelor's Degree or higher | 4 (57.1%) | 0 (0.0%) |
| Total | 24 (70.6%) | 0 (0.0%) |
Employment Occupations by Sex in Satartia
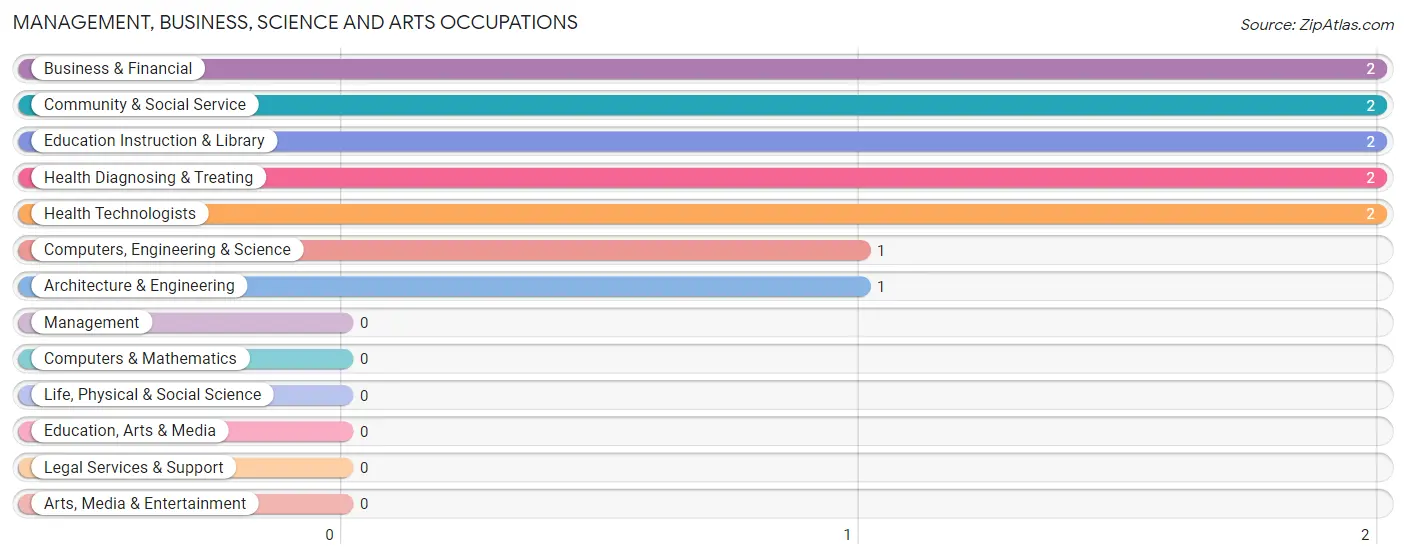
Management, Business, Science and Arts Occupations
The most common Management, Business, Science and Arts occupations in Satartia are Business & Financial (2 | 7.4%), Community & Social Service (2 | 7.4%), Education Instruction & Library (2 | 7.4%), Health Diagnosing & Treating (2 | 7.4%), and Health Technologists (2 | 7.4%).
Management, Business, Science and Arts Occupations by Sex
Within the Management, Business, Science and Arts occupations in Satartia, the most male-oriented occupations are Computers, Engineering & Science (100.0%), and Architecture & Engineering (100.0%), while the most female-oriented occupations are Business & Financial (100.0%), Community & Social Service (100.0%), and Education Instruction & Library (100.0%).
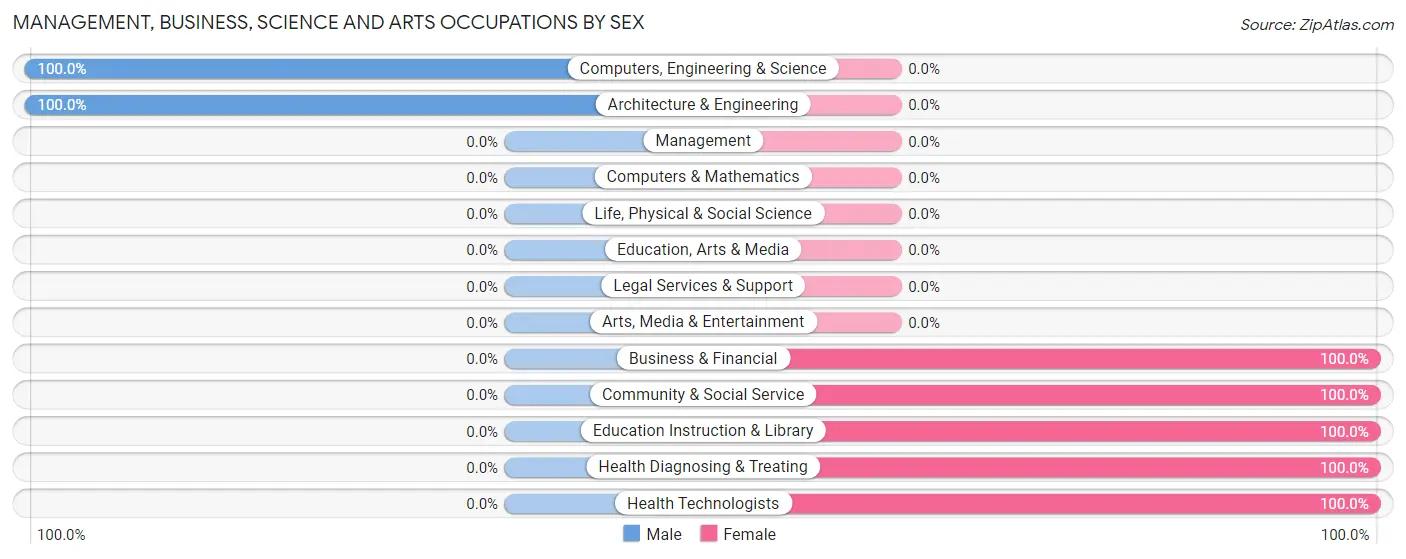
| Occupation | Male | Female |
| Management | 0 (0.0%) | 0 (0.0%) |
| Business & Financial | 0 (0.0%) | 2 (100.0%) |
| Computers, Engineering & Science | 1 (100.0%) | 0 (0.0%) |
| Computers & Mathematics | 0 (0.0%) | 0 (0.0%) |
| Architecture & Engineering | 1 (100.0%) | 0 (0.0%) |
| Life, Physical & Social Science | 0 (0.0%) | 0 (0.0%) |
| Community & Social Service | 0 (0.0%) | 2 (100.0%) |
| Education, Arts & Media | 0 (0.0%) | 0 (0.0%) |
| Legal Services & Support | 0 (0.0%) | 0 (0.0%) |
| Education Instruction & Library | 0 (0.0%) | 2 (100.0%) |
| Arts, Media & Entertainment | 0 (0.0%) | 0 (0.0%) |
| Health Diagnosing & Treating | 0 (0.0%) | 2 (100.0%) |
| Health Technologists | 0 (0.0%) | 2 (100.0%) |
| Total (Category) | 1 (14.3%) | 6 (85.7%) |
| Total (Overall) | 18 (66.7%) | 9 (33.3%) |
Services Occupations
The most common Services occupations in Satartia are , and Personal Care & Service (3 | 11.1%).
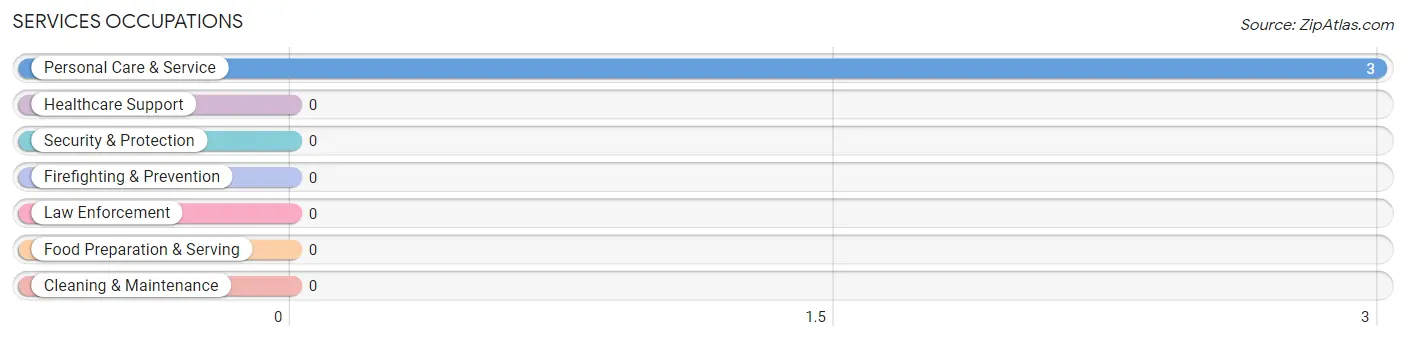
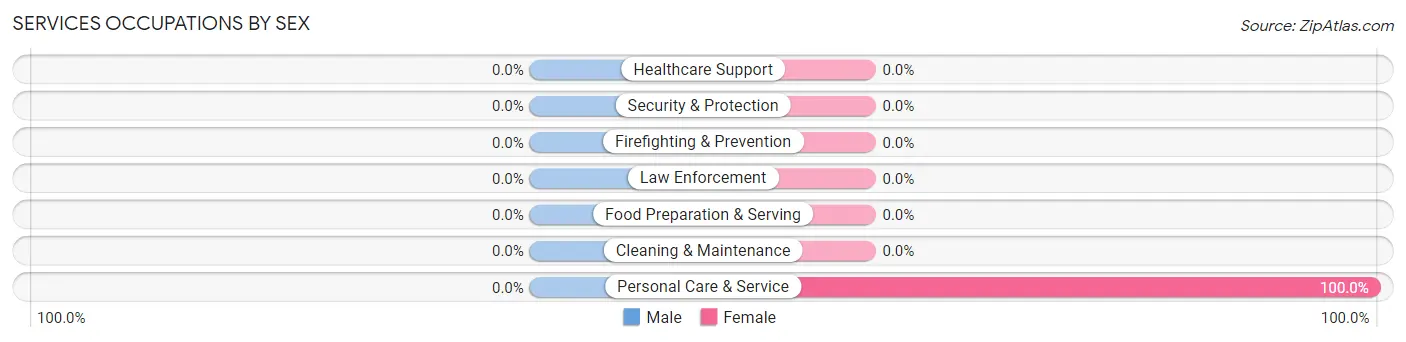
Services Occupations by Sex
| Occupation | Male | Female |
| Healthcare Support | 0 (0.0%) | 0 (0.0%) |
| Security & Protection | 0 (0.0%) | 0 (0.0%) |
| Firefighting & Prevention | 0 (0.0%) | 0 (0.0%) |
| Law Enforcement | 0 (0.0%) | 0 (0.0%) |
| Food Preparation & Serving | 0 (0.0%) | 0 (0.0%) |
| Cleaning & Maintenance | 0 (0.0%) | 0 (0.0%) |
| Personal Care & Service | 0 (0.0%) | 3 (100.0%) |
| Total (Category) | 0 (0.0%) | 3 (100.0%) |
| Total (Overall) | 18 (66.7%) | 9 (33.3%) |
Sales and Office Occupations
The most common Sales and Office occupations in Satartia are , and Sales & Related (3 | 11.1%).
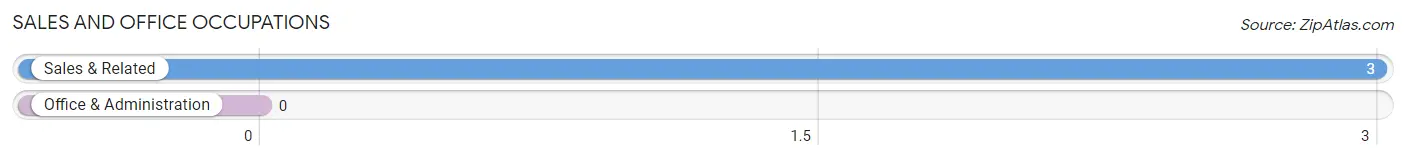
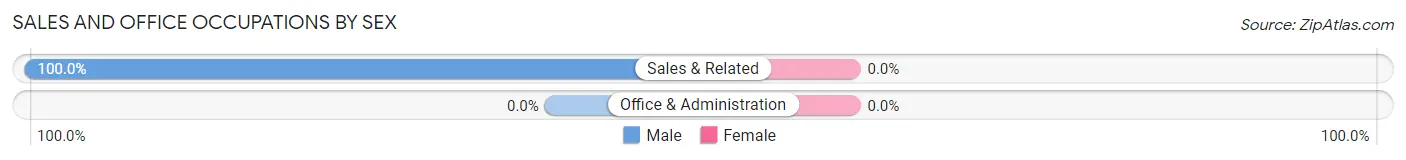
Sales and Office Occupations by Sex
| Occupation | Male | Female |
| Sales & Related | 3 (100.0%) | 0 (0.0%) |
| Office & Administration | 0 (0.0%) | 0 (0.0%) |
| Total (Category) | 3 (100.0%) | 0 (0.0%) |
| Total (Overall) | 18 (66.7%) | 9 (33.3%) |
Natural Resources, Construction and Maintenance Occupations
The most common Natural Resources, Construction and Maintenance occupations in Satartia are , and Construction & Extraction (5 | 18.5%).
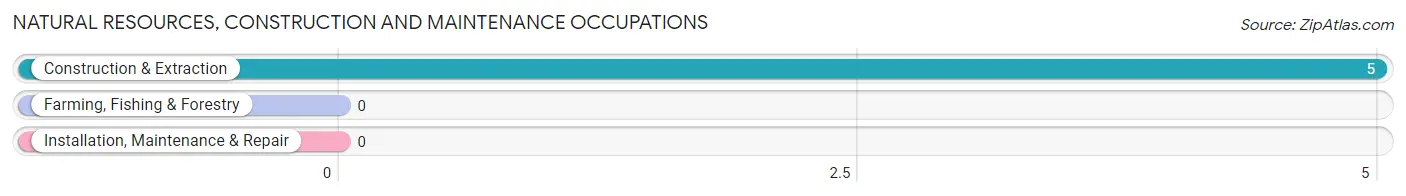
Natural Resources, Construction and Maintenance Occupations by Sex
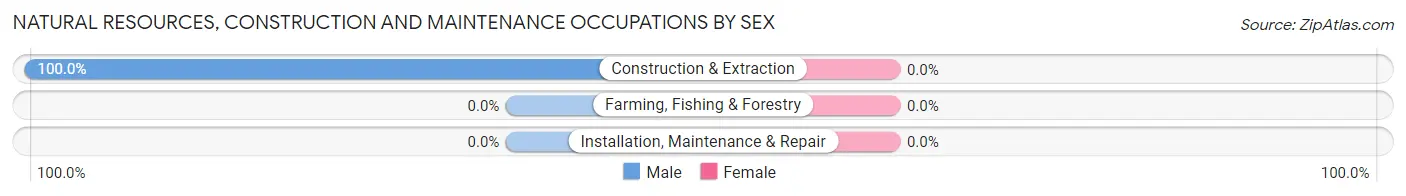
| Occupation | Male | Female |
| Farming, Fishing & Forestry | 0 (0.0%) | 0 (0.0%) |
| Construction & Extraction | 5 (100.0%) | 0 (0.0%) |
| Installation, Maintenance & Repair | 0 (0.0%) | 0 (0.0%) |
| Total (Category) | 5 (100.0%) | 0 (0.0%) |
| Total (Overall) | 18 (66.7%) | 9 (33.3%) |
Production, Transportation and Moving Occupations
The most common Production, Transportation and Moving occupations in Satartia are Production (7 | 25.9%), and Transportation (2 | 7.4%).
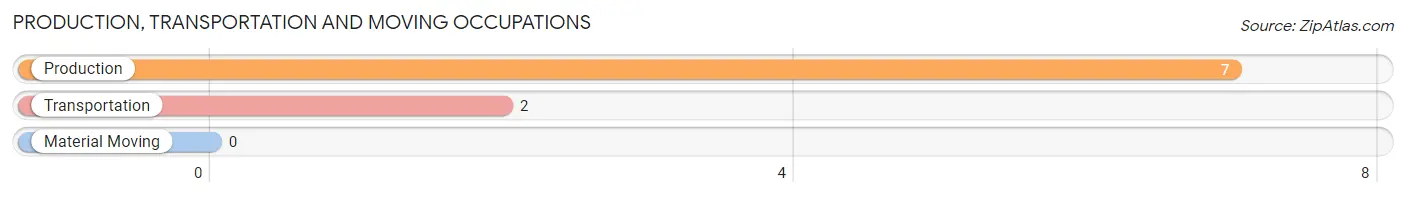
Production, Transportation and Moving Occupations by Sex
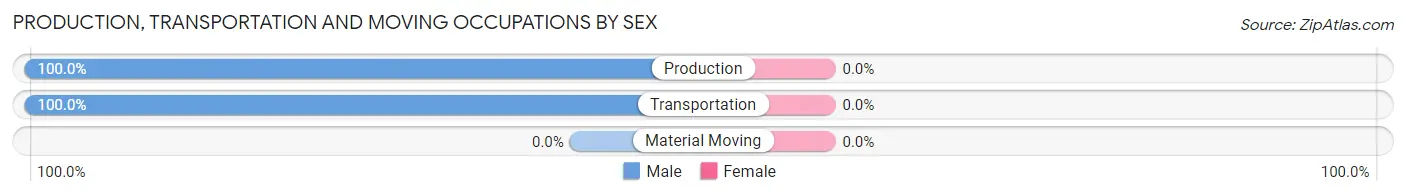
| Occupation | Male | Female |
| Production | 7 (100.0%) | 0 (0.0%) |
| Transportation | 2 (100.0%) | 0 (0.0%) |
| Material Moving | 0 (0.0%) | 0 (0.0%) |
| Total (Category) | 9 (100.0%) | 0 (0.0%) |
| Total (Overall) | 18 (66.7%) | 9 (33.3%) |
Employment Industries by Sex in Satartia
Employment Industries in Satartia
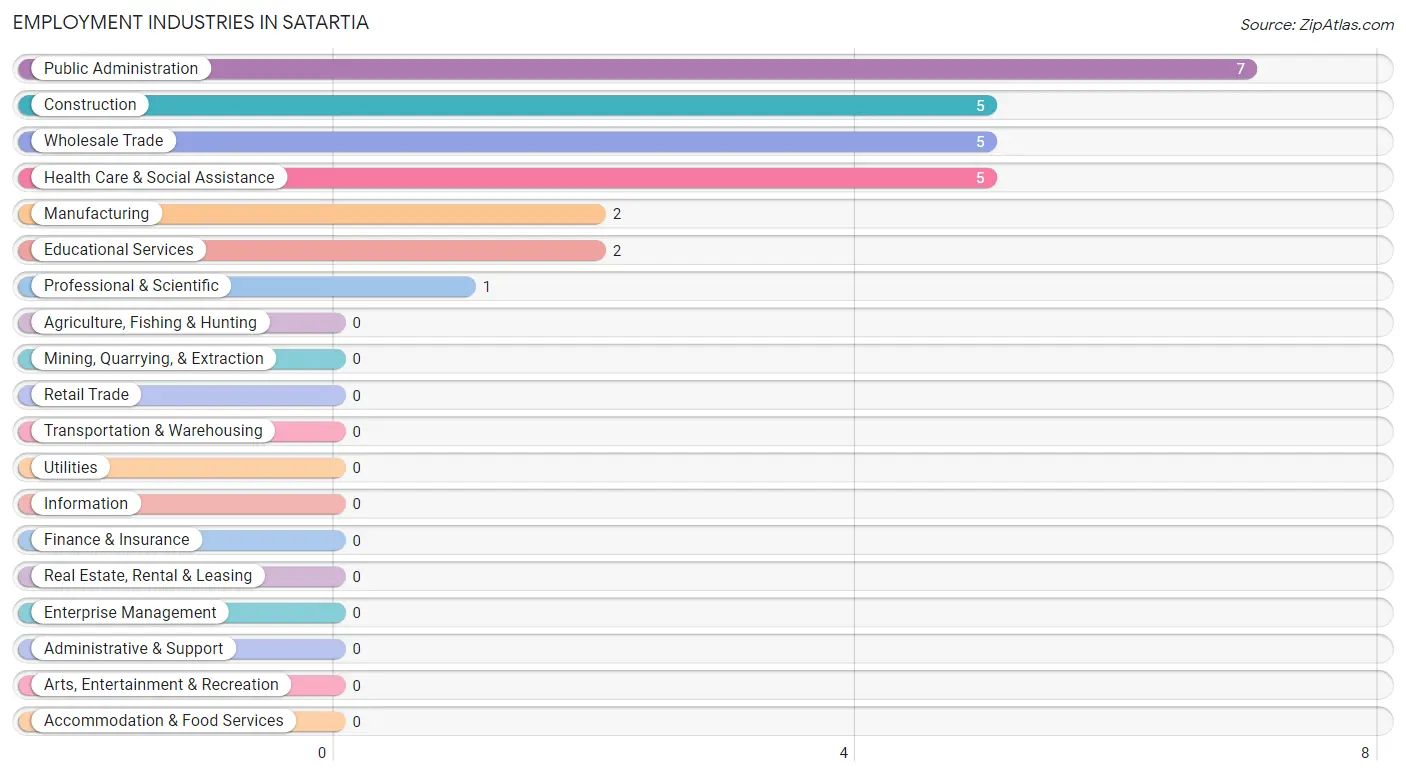
The major employment industries in Satartia include Public Administration (7 | 25.9%), Construction (5 | 18.5%), Wholesale Trade (5 | 18.5%), Health Care & Social Assistance (5 | 18.5%), and Manufacturing (2 | 7.4%).
Employment Industries by Sex in Satartia
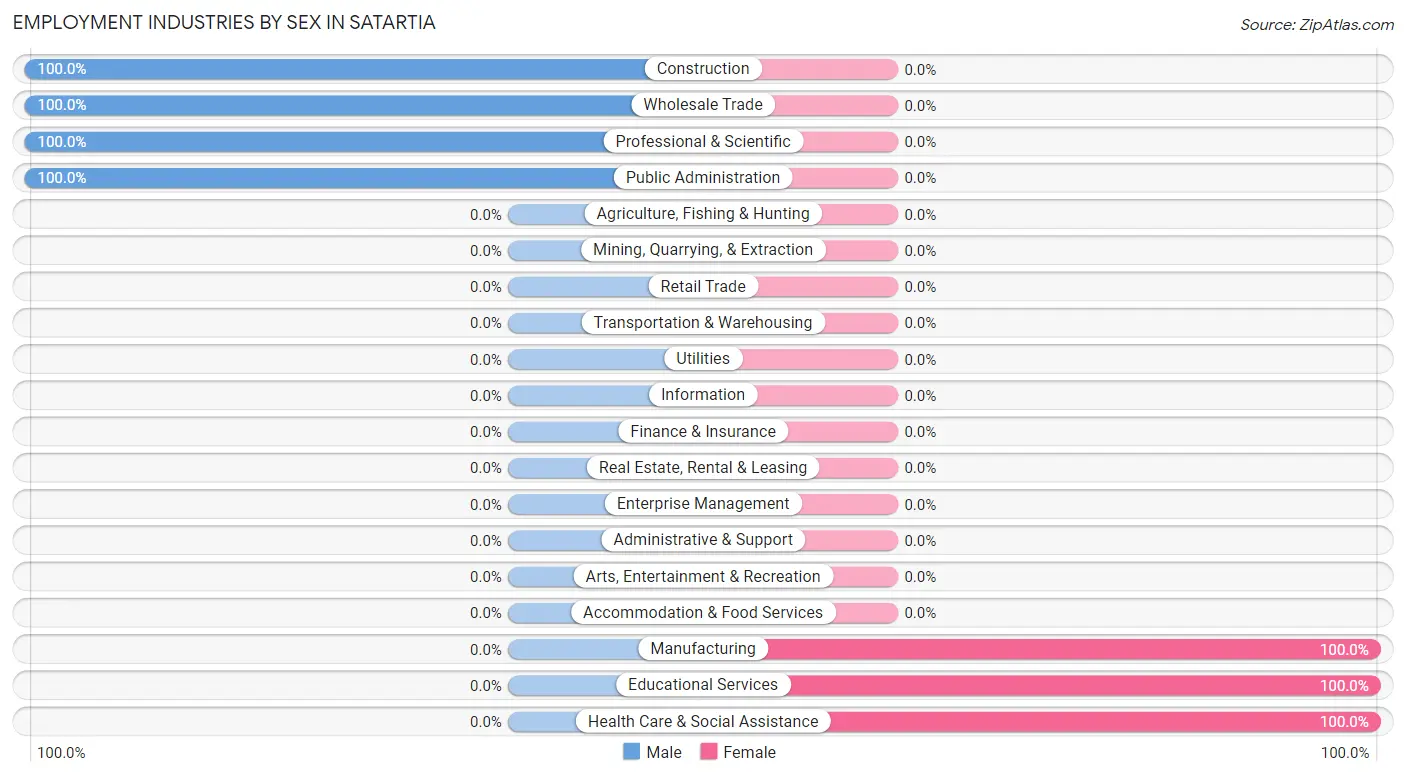
The Satartia industries that see more men than women are Construction (100.0%), Wholesale Trade (100.0%), and Professional & Scientific (100.0%), whereas the industries that tend to have a higher number of women are Manufacturing (100.0%), Educational Services (100.0%), and Health Care & Social Assistance (100.0%).
| Industry | Male | Female |
| Agriculture, Fishing & Hunting | 0 (0.0%) | 0 (0.0%) |
| Mining, Quarrying, & Extraction | 0 (0.0%) | 0 (0.0%) |
| Construction | 5 (100.0%) | 0 (0.0%) |
| Manufacturing | 0 (0.0%) | 2 (100.0%) |
| Wholesale Trade | 5 (100.0%) | 0 (0.0%) |
| Retail Trade | 0 (0.0%) | 0 (0.0%) |
| Transportation & Warehousing | 0 (0.0%) | 0 (0.0%) |
| Utilities | 0 (0.0%) | 0 (0.0%) |
| Information | 0 (0.0%) | 0 (0.0%) |
| Finance & Insurance | 0 (0.0%) | 0 (0.0%) |
| Real Estate, Rental & Leasing | 0 (0.0%) | 0 (0.0%) |
| Professional & Scientific | 1 (100.0%) | 0 (0.0%) |
| Enterprise Management | 0 (0.0%) | 0 (0.0%) |
| Administrative & Support | 0 (0.0%) | 0 (0.0%) |
| Educational Services | 0 (0.0%) | 2 (100.0%) |
| Health Care & Social Assistance | 0 (0.0%) | 5 (100.0%) |
| Arts, Entertainment & Recreation | 0 (0.0%) | 0 (0.0%) |
| Accommodation & Food Services | 0 (0.0%) | 0 (0.0%) |
| Public Administration | 7 (100.0%) | 0 (0.0%) |
| Total | 18 (66.7%) | 9 (33.3%) |
Education in Satartia
School Enrollment in Satartia
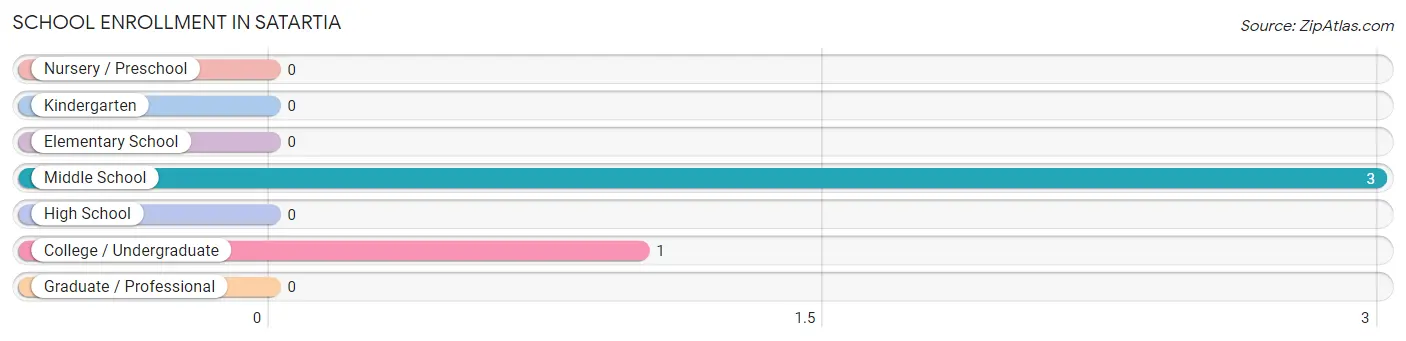
The most common levels of schooling among the 4 students in Satartia are middle school (3 | 75.0%), and college / undergraduate (1 | 25.0%).
| School Level | # Students | % Students |
| Nursery / Preschool | 0 | 0.0% |
| Kindergarten | 0 | 0.0% |
| Elementary School | 0 | 0.0% |
| Middle School | 3 | 75.0% |
| High School | 0 | 0.0% |
| College / Undergraduate | 1 | 25.0% |
| Graduate / Professional | 0 | 0.0% |
| Total | 4 | 100.0% |
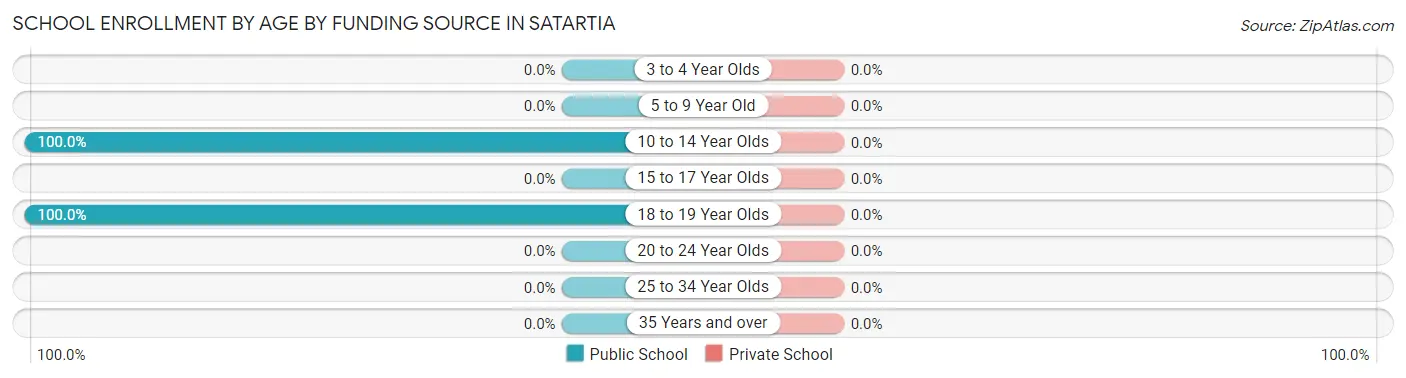
School Enrollment by Age by Funding Source in Satartia
| Age Bracket | Public School | Private School |
| 3 to 4 Year Olds | 0 (0.0%) | 0 (0.0%) |
| 5 to 9 Year Old | 0 (0.0%) | 0 (0.0%) |
| 10 to 14 Year Olds | 3 (100.0%) | 0 (0.0%) |
| 15 to 17 Year Olds | 0 (0.0%) | 0 (0.0%) |
| 18 to 19 Year Olds | 1 (100.0%) | 0 (0.0%) |
| 20 to 24 Year Olds | 0 (0.0%) | 0 (0.0%) |
| 25 to 34 Year Olds | 0 (0.0%) | 0 (0.0%) |
| 35 Years and over | 0 (0.0%) | 0 (0.0%) |
| Total | 4 (100.0%) | 0 (0.0%) |
Educational Attainment by Field of Study in Satartia
Business (5 | 50.0%), literature & languages (3 | 30.0%), and education (2 | 20.0%) are the most common fields of study among 10 individuals in Satartia who have obtained a bachelor's degree or higher.
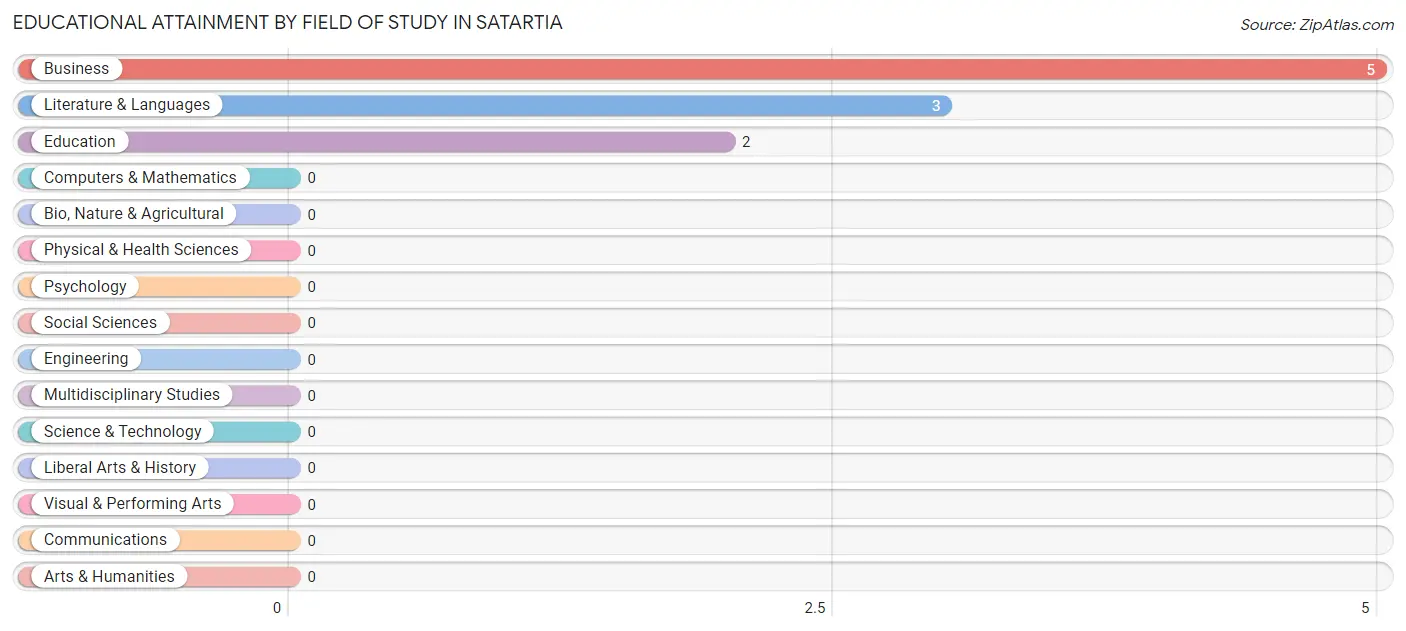
| Field of Study | # Graduates | % Graduates |
| Computers & Mathematics | 0 | 0.0% |
| Bio, Nature & Agricultural | 0 | 0.0% |
| Physical & Health Sciences | 0 | 0.0% |
| Psychology | 0 | 0.0% |
| Social Sciences | 0 | 0.0% |
| Engineering | 0 | 0.0% |
| Multidisciplinary Studies | 0 | 0.0% |
| Science & Technology | 0 | 0.0% |
| Business | 5 | 50.0% |
| Education | 2 | 20.0% |
| Literature & Languages | 3 | 30.0% |
| Liberal Arts & History | 0 | 0.0% |
| Visual & Performing Arts | 0 | 0.0% |
| Communications | 0 | 0.0% |
| Arts & Humanities | 0 | 0.0% |
| Total | 10 | 100.0% |
Transportation & Commute in Satartia
Vehicle Availability by Sex in Satartia
The most prevalent vehicle ownership categories in Satartia are males with 4 vehicles (7, accounting for 38.9%) and females with 4 vehicles (5, making up 77.8%).
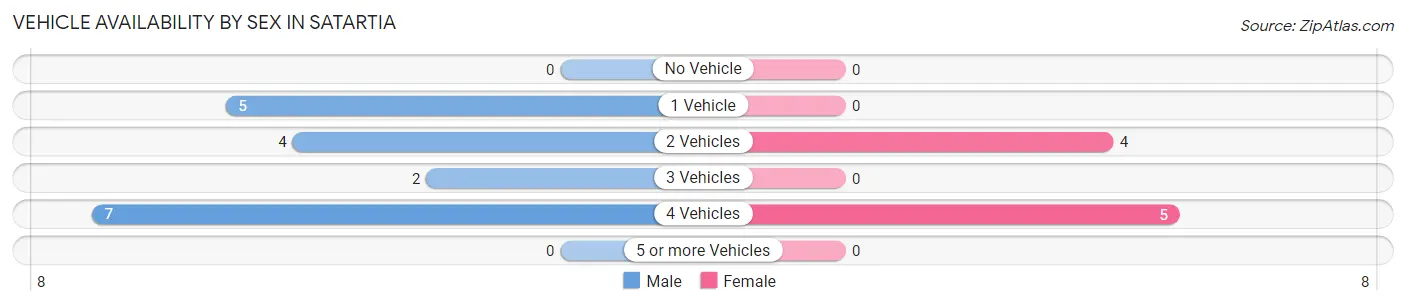
| Vehicles Available | Male | Female |
| No Vehicle | 0 (0.0%) | 0 (0.0%) |
| 1 Vehicle | 5 (27.8%) | 0 (0.0%) |
| 2 Vehicles | 4 (22.2%) | 4 (44.4%) |
| 3 Vehicles | 2 (11.1%) | 0 (0.0%) |
| 4 Vehicles | 7 (38.9%) | 5 (55.6%) |
| 5 or more Vehicles | 0 (0.0%) | 0 (0.0%) |
| Total | 18 (100.0%) | 9 (100.0%) |
Commute Time in Satartia
The most frequently occuring commute durations in Satartia are 10 to 14 minutes (7 commuters, 25.9%), less than 5 minutes (5 commuters, 18.5%), and 20 to 24 minutes (3 commuters, 11.1%).
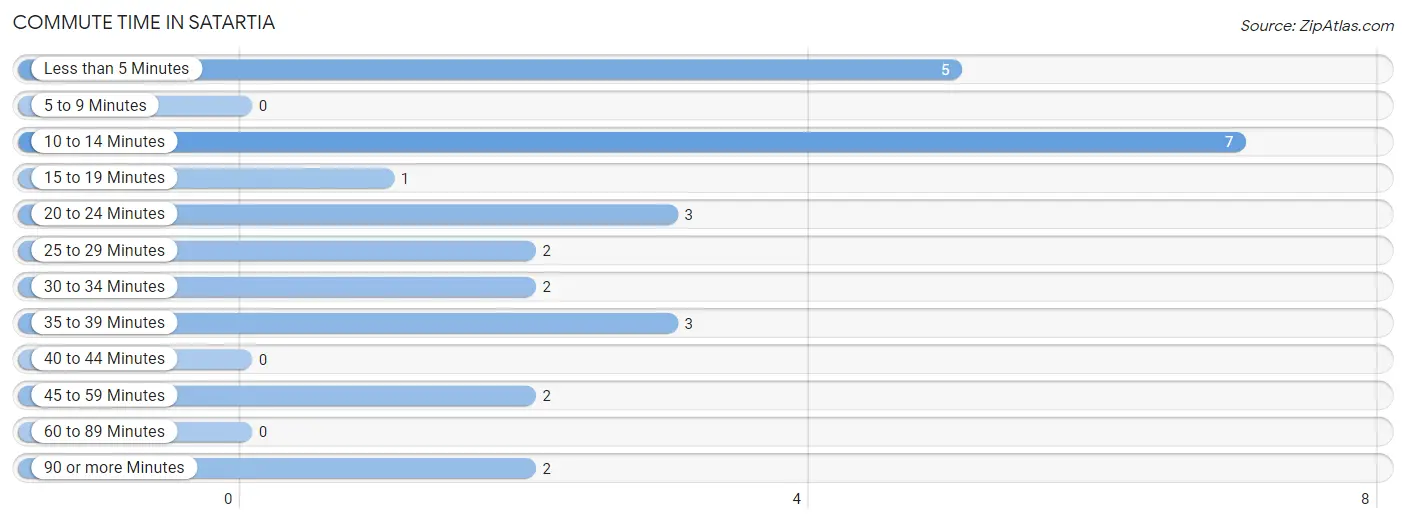
| Commute Time | # Commuters | % Commuters |
| Less than 5 Minutes | 5 | 18.5% |
| 5 to 9 Minutes | 0 | 0.0% |
| 10 to 14 Minutes | 7 | 25.9% |
| 15 to 19 Minutes | 1 | 3.7% |
| 20 to 24 Minutes | 3 | 11.1% |
| 25 to 29 Minutes | 2 | 7.4% |
| 30 to 34 Minutes | 2 | 7.4% |
| 35 to 39 Minutes | 3 | 11.1% |
| 40 to 44 Minutes | 0 | 0.0% |
| 45 to 59 Minutes | 2 | 7.4% |
| 60 to 89 Minutes | 0 | 0.0% |
| 90 or more Minutes | 2 | 7.4% |
Commute Time by Sex in Satartia
The most common commute times in Satartia are 10 to 14 minutes (7 commuters, 38.9%) for males and 35 to 39 minutes (3 commuters, 33.3%) for females.
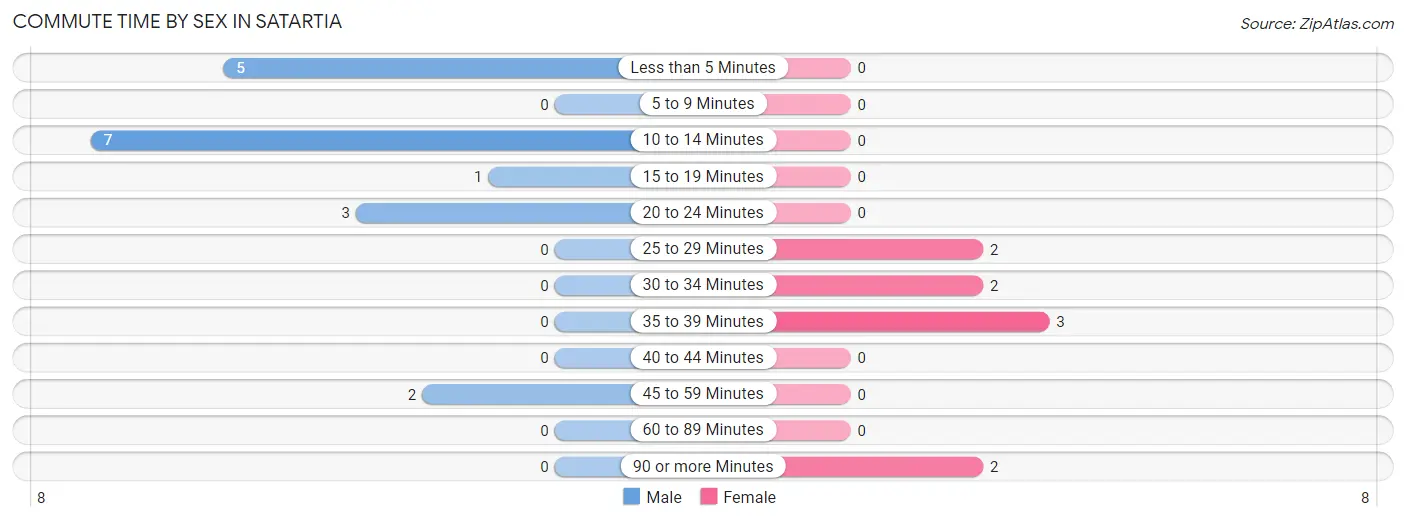
| Commute Time | Male | Female |
| Less than 5 Minutes | 5 (27.8%) | 0 (0.0%) |
| 5 to 9 Minutes | 0 (0.0%) | 0 (0.0%) |
| 10 to 14 Minutes | 7 (38.9%) | 0 (0.0%) |
| 15 to 19 Minutes | 1 (5.6%) | 0 (0.0%) |
| 20 to 24 Minutes | 3 (16.7%) | 0 (0.0%) |
| 25 to 29 Minutes | 0 (0.0%) | 2 (22.2%) |
| 30 to 34 Minutes | 0 (0.0%) | 2 (22.2%) |
| 35 to 39 Minutes | 0 (0.0%) | 3 (33.3%) |
| 40 to 44 Minutes | 0 (0.0%) | 0 (0.0%) |
| 45 to 59 Minutes | 2 (11.1%) | 0 (0.0%) |
| 60 to 89 Minutes | 0 (0.0%) | 0 (0.0%) |
| 90 or more Minutes | 0 (0.0%) | 2 (22.2%) |
Time of Departure to Work by Sex in Satartia
The most frequent times of departure to work in Satartia are 6:30 AM to 6:59 AM (13, 72.2%) for males and 6:30 AM to 6:59 AM (5, 55.6%) for females.
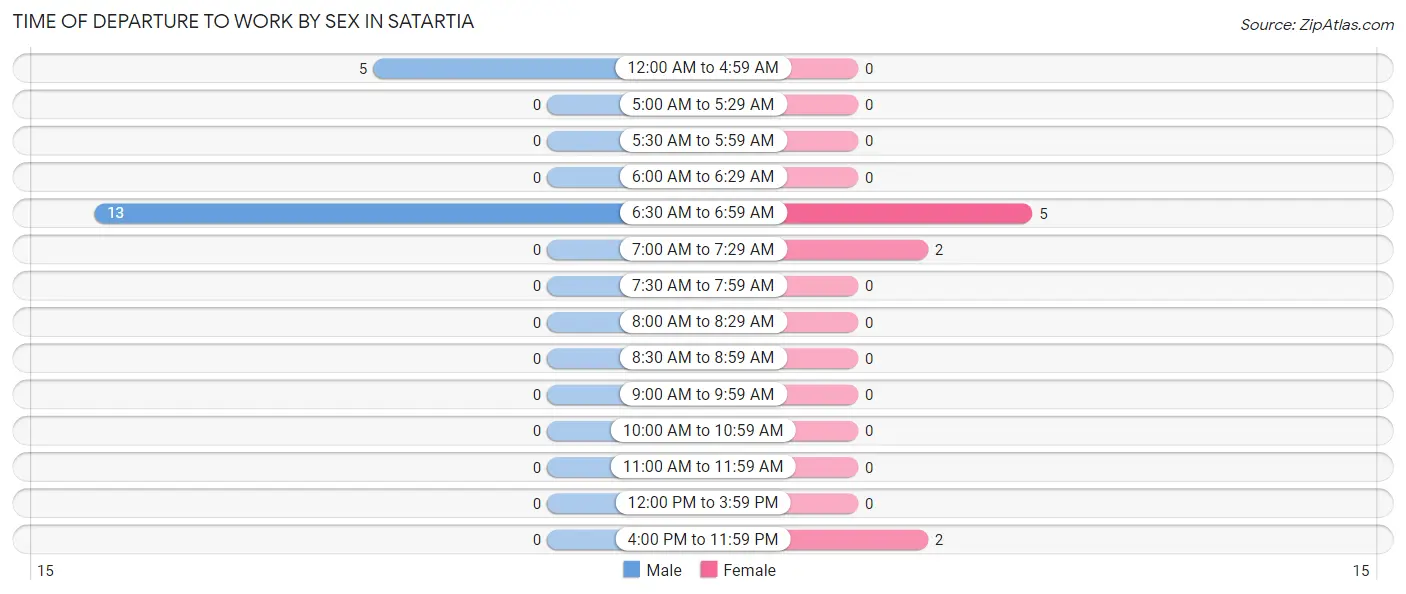
| Time of Departure | Male | Female |
| 12:00 AM to 4:59 AM | 5 (27.8%) | 0 (0.0%) |
| 5:00 AM to 5:29 AM | 0 (0.0%) | 0 (0.0%) |
| 5:30 AM to 5:59 AM | 0 (0.0%) | 0 (0.0%) |
| 6:00 AM to 6:29 AM | 0 (0.0%) | 0 (0.0%) |
| 6:30 AM to 6:59 AM | 13 (72.2%) | 5 (55.6%) |
| 7:00 AM to 7:29 AM | 0 (0.0%) | 2 (22.2%) |
| 7:30 AM to 7:59 AM | 0 (0.0%) | 0 (0.0%) |
| 8:00 AM to 8:29 AM | 0 (0.0%) | 0 (0.0%) |
| 8:30 AM to 8:59 AM | 0 (0.0%) | 0 (0.0%) |
| 9:00 AM to 9:59 AM | 0 (0.0%) | 0 (0.0%) |
| 10:00 AM to 10:59 AM | 0 (0.0%) | 0 (0.0%) |
| 11:00 AM to 11:59 AM | 0 (0.0%) | 0 (0.0%) |
| 12:00 PM to 3:59 PM | 0 (0.0%) | 0 (0.0%) |
| 4:00 PM to 11:59 PM | 0 (0.0%) | 2 (22.2%) |
| Total | 18 (100.0%) | 9 (100.0%) |
Housing Occupancy in Satartia
Occupancy by Ownership in Satartia
Of the total 24 dwellings in Satartia, owner-occupied units account for 23 (95.8%), while renter-occupied units make up 1 (4.2%).
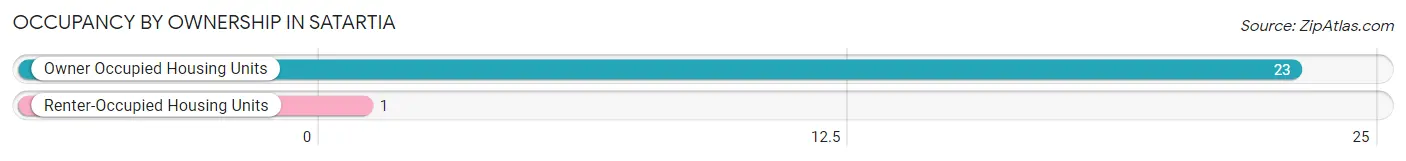
| Occupancy | # Housing Units | % Housing Units |
| Owner Occupied Housing Units | 23 | 95.8% |
| Renter-Occupied Housing Units | 1 | 4.2% |
| Total Occupied Housing Units | 24 | 100.0% |
Occupancy by Household Size in Satartia
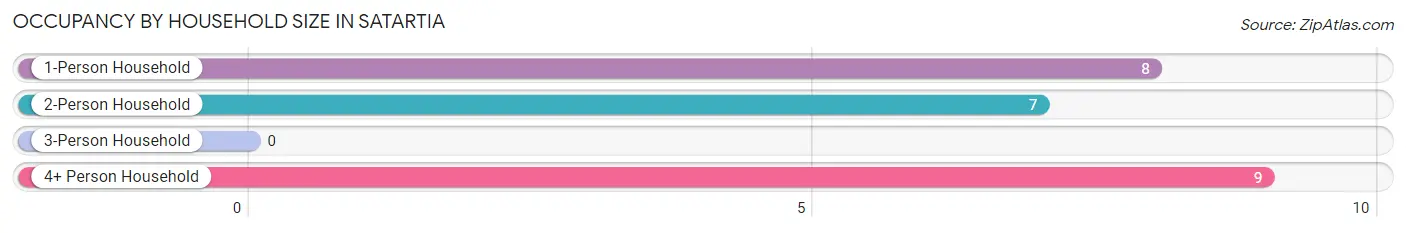
| Household Size | # Housing Units | % Housing Units |
| 1-Person Household | 8 | 33.3% |
| 2-Person Household | 7 | 29.2% |
| 3-Person Household | 0 | 0.0% |
| 4+ Person Household | 9 | 37.5% |
| Total Housing Units | 24 | 100.0% |
Occupancy by Ownership by Household Size in Satartia
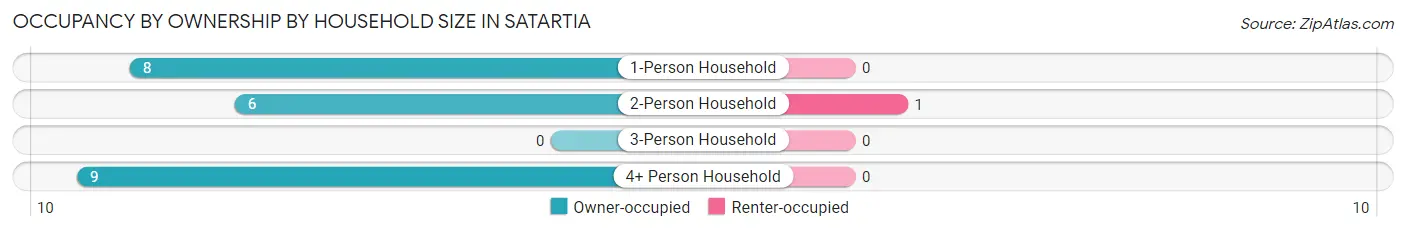
| Household Size | Owner-occupied | Renter-occupied |
| 1-Person Household | 8 (100.0%) | 0 (0.0%) |
| 2-Person Household | 6 (85.7%) | 1 (14.3%) |
| 3-Person Household | 0 (0.0%) | 0 (0.0%) |
| 4+ Person Household | 9 (100.0%) | 0 (0.0%) |
| Total Housing Units | 23 (95.8%) | 1 (4.2%) |
Occupancy by Educational Attainment in Satartia
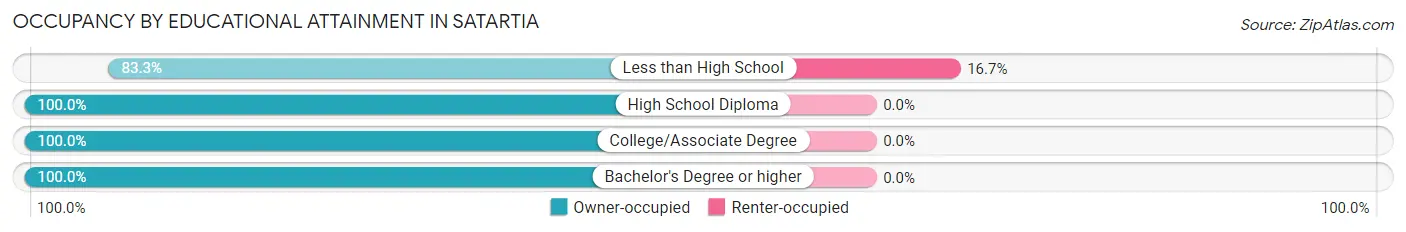
| Household Size | Owner-occupied | Renter-occupied |
| Less than High School | 5 (83.3%) | 1 (16.7%) |
| High School Diploma | 11 (100.0%) | 0 (0.0%) |
| College/Associate Degree | 4 (100.0%) | 0 (0.0%) |
| Bachelor's Degree or higher | 3 (100.0%) | 0 (0.0%) |
Occupancy by Age of Householder in Satartia
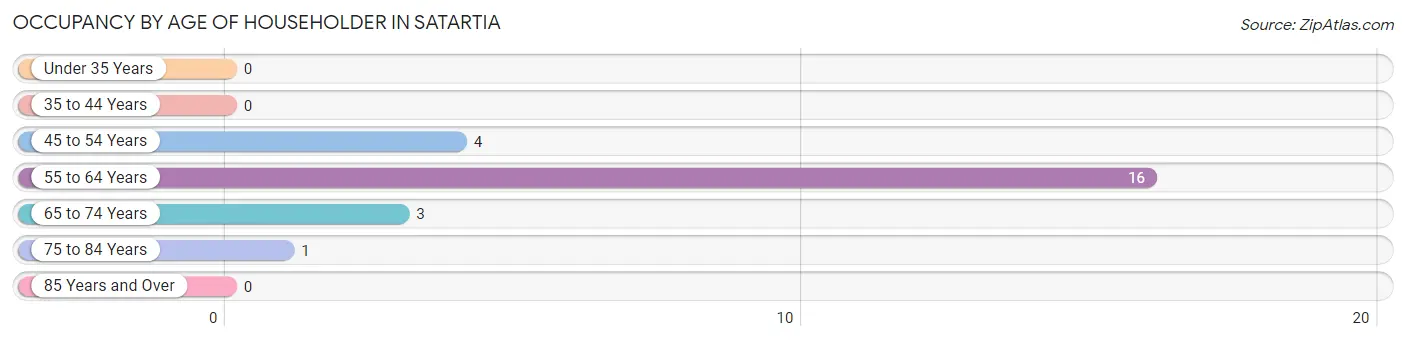
| Age Bracket | # Households | % Households |
| Under 35 Years | 0 | 0.0% |
| 35 to 44 Years | 0 | 0.0% |
| 45 to 54 Years | 4 | 16.7% |
| 55 to 64 Years | 16 | 66.7% |
| 65 to 74 Years | 3 | 12.5% |
| 75 to 84 Years | 1 | 4.2% |
| 85 Years and Over | 0 | 0.0% |
| Total | 24 | 100.0% |
Housing Finances in Satartia
Median Income by Occupancy in Satartia
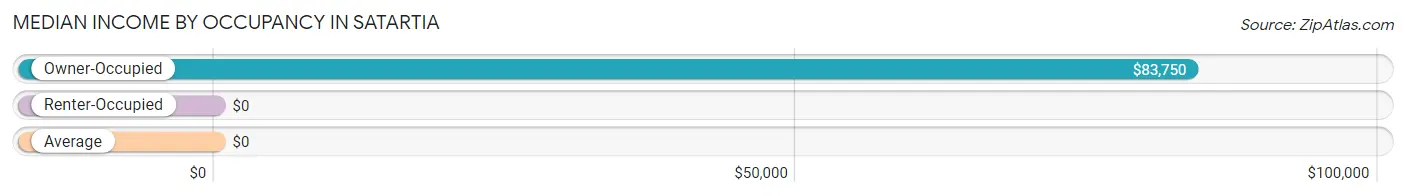
| Occupancy Type | # Households | Median Income |
| Owner-Occupied | 23 (95.8%) | $83,750 |
| Renter-Occupied | 1 (4.2%) | $0 |
| Average | 24 (100.0%) | $0 |
Occupancy by Householder Income Bracket in Satartia
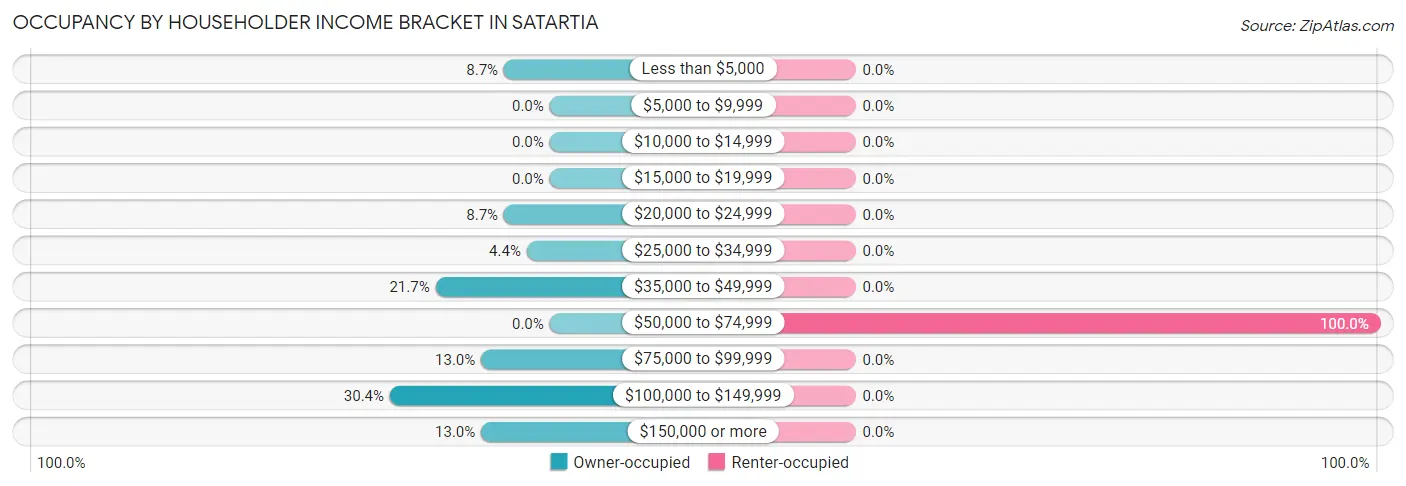
| Income Bracket | Owner-occupied | Renter-occupied |
| Less than $5,000 | 2 (8.7%) | 0 (0.0%) |
| $5,000 to $9,999 | 0 (0.0%) | 0 (0.0%) |
| $10,000 to $14,999 | 0 (0.0%) | 0 (0.0%) |
| $15,000 to $19,999 | 0 (0.0%) | 0 (0.0%) |
| $20,000 to $24,999 | 2 (8.7%) | 0 (0.0%) |
| $25,000 to $34,999 | 1 (4.3%) | 0 (0.0%) |
| $35,000 to $49,999 | 5 (21.7%) | 0 (0.0%) |
| $50,000 to $74,999 | 0 (0.0%) | 1 (100.0%) |
| $75,000 to $99,999 | 3 (13.0%) | 0 (0.0%) |
| $100,000 to $149,999 | 7 (30.4%) | 0 (0.0%) |
| $150,000 or more | 3 (13.0%) | 0 (0.0%) |
| Total | 23 (100.0%) | 1 (100.0%) |
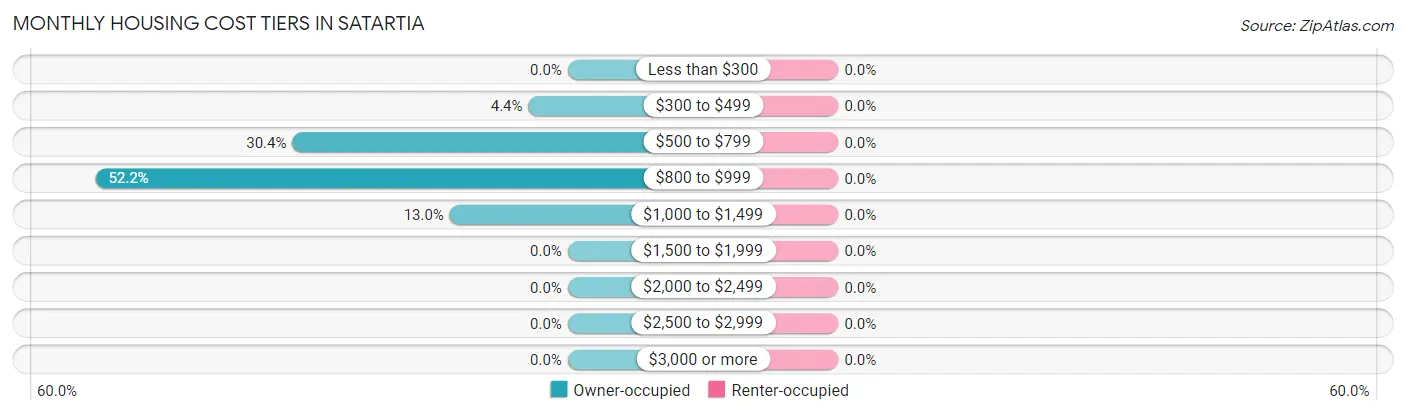
Monthly Housing Cost Tiers in Satartia
| Monthly Cost | Owner-occupied | Renter-occupied |
| Less than $300 | 0 (0.0%) | 0 (0.0%) |
| $300 to $499 | 1 (4.3%) | 0 (0.0%) |
| $500 to $799 | 7 (30.4%) | 0 (0.0%) |
| $800 to $999 | 12 (52.2%) | 0 (0.0%) |
| $1,000 to $1,499 | 3 (13.0%) | 0 (0.0%) |
| $1,500 to $1,999 | 0 (0.0%) | 0 (0.0%) |
| $2,000 to $2,499 | 0 (0.0%) | 0 (0.0%) |
| $2,500 to $2,999 | 0 (0.0%) | 0 (0.0%) |
| $3,000 or more | 0 (0.0%) | 0 (0.0%) |
| Total | 23 (100.0%) | 1 (100.0%) |
Physical Housing Characteristics in Satartia
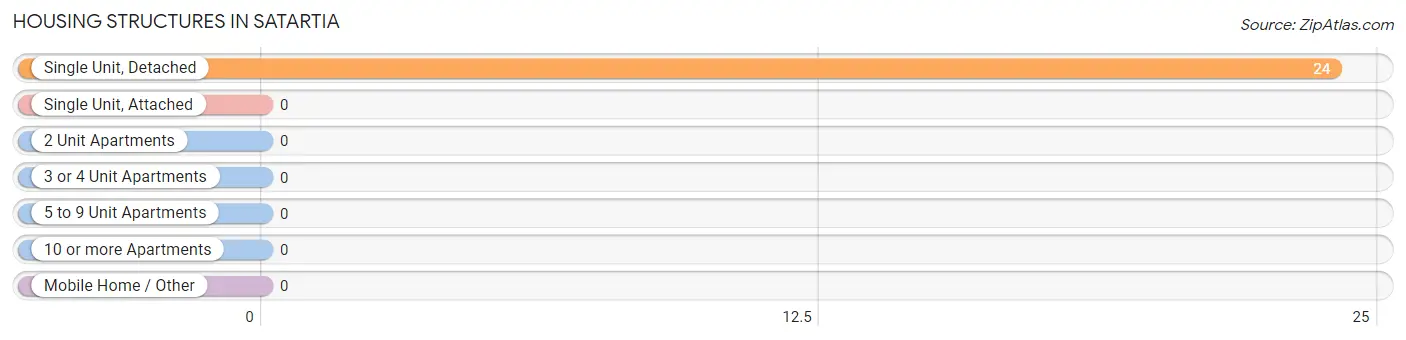
Housing Structures in Satartia
| Structure Type | # Housing Units | % Housing Units |
| Single Unit, Detached | 24 | 100.0% |
| Single Unit, Attached | 0 | 0.0% |
| 2 Unit Apartments | 0 | 0.0% |
| 3 or 4 Unit Apartments | 0 | 0.0% |
| 5 to 9 Unit Apartments | 0 | 0.0% |
| 10 or more Apartments | 0 | 0.0% |
| Mobile Home / Other | 0 | 0.0% |
| Total | 24 | 100.0% |
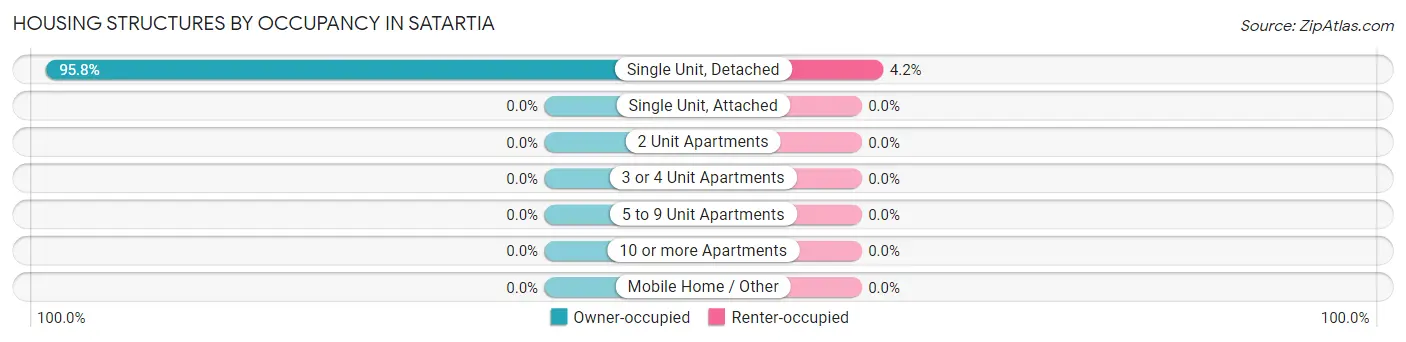
Housing Structures by Occupancy in Satartia
| Structure Type | Owner-occupied | Renter-occupied |
| Single Unit, Detached | 23 (95.8%) | 1 (4.2%) |
| Single Unit, Attached | 0 (0.0%) | 0 (0.0%) |
| 2 Unit Apartments | 0 (0.0%) | 0 (0.0%) |
| 3 or 4 Unit Apartments | 0 (0.0%) | 0 (0.0%) |
| 5 to 9 Unit Apartments | 0 (0.0%) | 0 (0.0%) |
| 10 or more Apartments | 0 (0.0%) | 0 (0.0%) |
| Mobile Home / Other | 0 (0.0%) | 0 (0.0%) |
| Total | 23 (95.8%) | 1 (4.2%) |
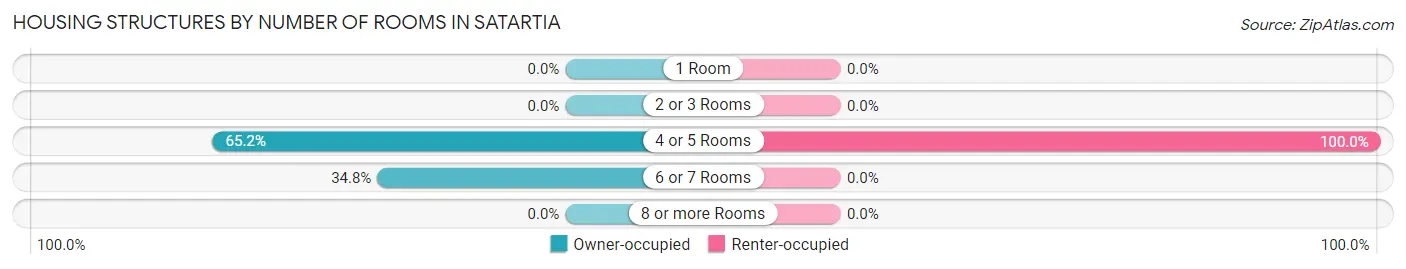
Housing Structures by Number of Rooms in Satartia
| Number of Rooms | Owner-occupied | Renter-occupied |
| 1 Room | 0 (0.0%) | 0 (0.0%) |
| 2 or 3 Rooms | 0 (0.0%) | 0 (0.0%) |
| 4 or 5 Rooms | 15 (65.2%) | 1 (100.0%) |
| 6 or 7 Rooms | 8 (34.8%) | 0 (0.0%) |
| 8 or more Rooms | 0 (0.0%) | 0 (0.0%) |
| Total | 23 (100.0%) | 1 (100.0%) |
Housing Structure by Heating Type in Satartia
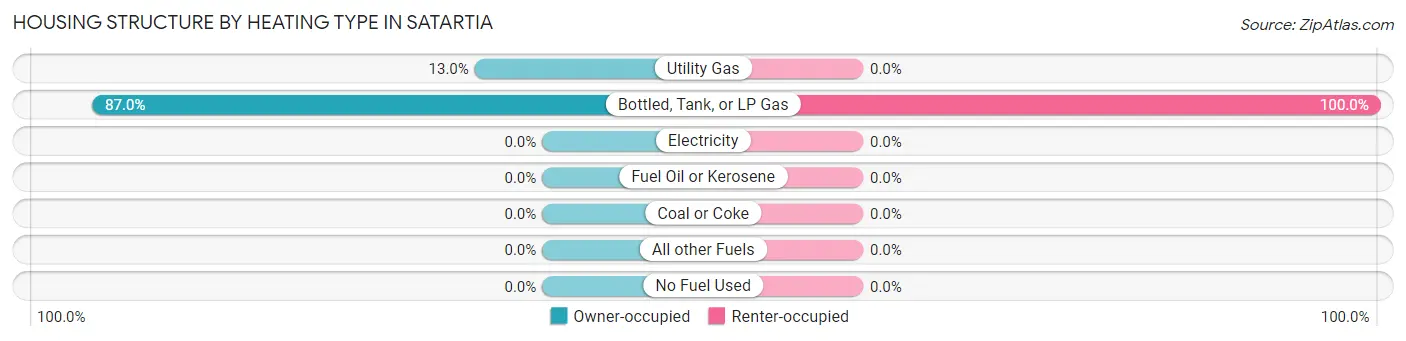
| Heating Type | Owner-occupied | Renter-occupied |
| Utility Gas | 3 (13.0%) | 0 (0.0%) |
| Bottled, Tank, or LP Gas | 20 (87.0%) | 1 (100.0%) |
| Electricity | 0 (0.0%) | 0 (0.0%) |
| Fuel Oil or Kerosene | 0 (0.0%) | 0 (0.0%) |
| Coal or Coke | 0 (0.0%) | 0 (0.0%) |
| All other Fuels | 0 (0.0%) | 0 (0.0%) |
| No Fuel Used | 0 (0.0%) | 0 (0.0%) |
| Total | 23 (100.0%) | 1 (100.0%) |
Household Vehicle Usage in Satartia
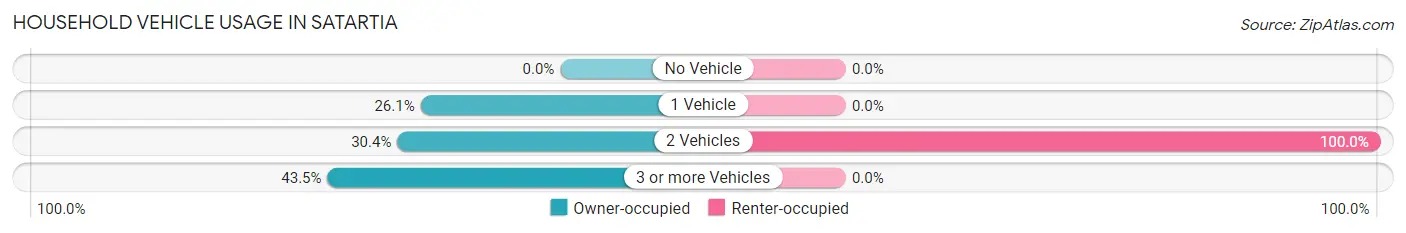
| Vehicles per Household | Owner-occupied | Renter-occupied |
| No Vehicle | 0 (0.0%) | 0 (0.0%) |
| 1 Vehicle | 6 (26.1%) | 0 (0.0%) |
| 2 Vehicles | 7 (30.4%) | 1 (100.0%) |
| 3 or more Vehicles | 10 (43.5%) | 0 (0.0%) |
| Total | 23 (100.0%) | 1 (100.0%) |
Real Estate & Mortgages in Satartia
Real Estate and Mortgage Overview in Satartia
| Characteristic | Without Mortgage | With Mortgage |
| Housing Units | 15 | 8 |
| Median Property Value | - | - |
| Median Household Income | - | - |
| Monthly Housing Costs | $890 | $0 |
| Real Estate Taxes | - | - |
Property Value by Mortgage Status in Satartia
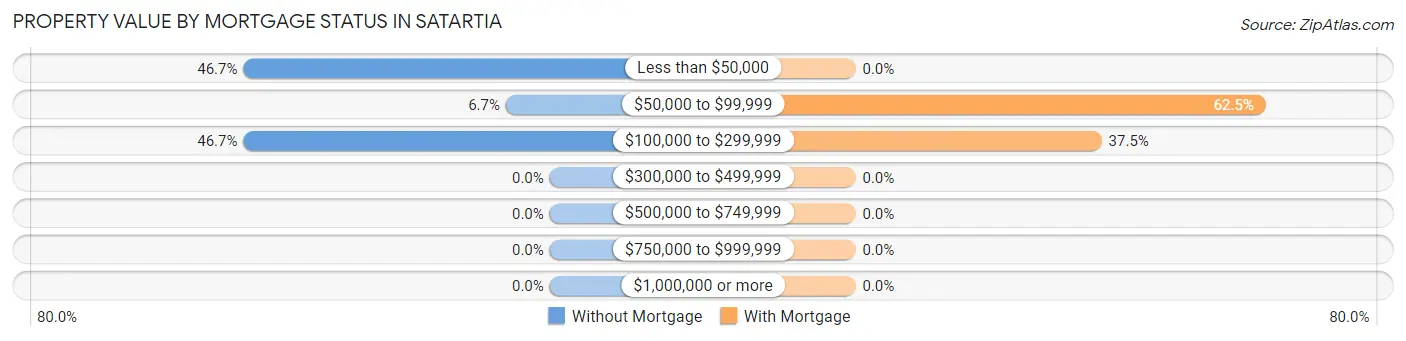
| Property Value | Without Mortgage | With Mortgage |
| Less than $50,000 | 7 (46.7%) | 0 (0.0%) |
| $50,000 to $99,999 | 1 (6.7%) | 5 (62.5%) |
| $100,000 to $299,999 | 7 (46.7%) | 3 (37.5%) |
| $300,000 to $499,999 | 0 (0.0%) | 0 (0.0%) |
| $500,000 to $749,999 | 0 (0.0%) | 0 (0.0%) |
| $750,000 to $999,999 | 0 (0.0%) | 0 (0.0%) |
| $1,000,000 or more | 0 (0.0%) | 0 (0.0%) |
| Total | 15 (100.0%) | 8 (100.0%) |
Household Income by Mortgage Status in Satartia
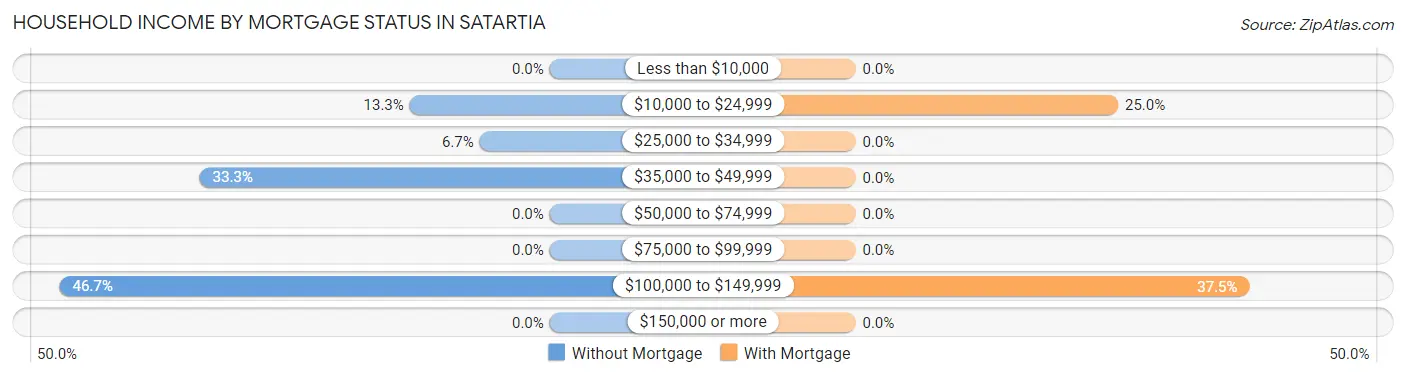
| Household Income | Without Mortgage | With Mortgage |
| Less than $10,000 | 0 (0.0%) | 0 (0.0%) |
| $10,000 to $24,999 | 2 (13.3%) | 2 (25.0%) |
| $25,000 to $34,999 | 1 (6.7%) | 0 (0.0%) |
| $35,000 to $49,999 | 5 (33.3%) | 0 (0.0%) |
| $50,000 to $74,999 | 0 (0.0%) | 0 (0.0%) |
| $75,000 to $99,999 | 0 (0.0%) | 0 (0.0%) |
| $100,000 to $149,999 | 7 (46.7%) | 3 (37.5%) |
| $150,000 or more | 0 (0.0%) | 0 (0.0%) |
| Total | 15 (100.0%) | 8 (100.0%) |
Property Value to Household Income Ratio in Satartia
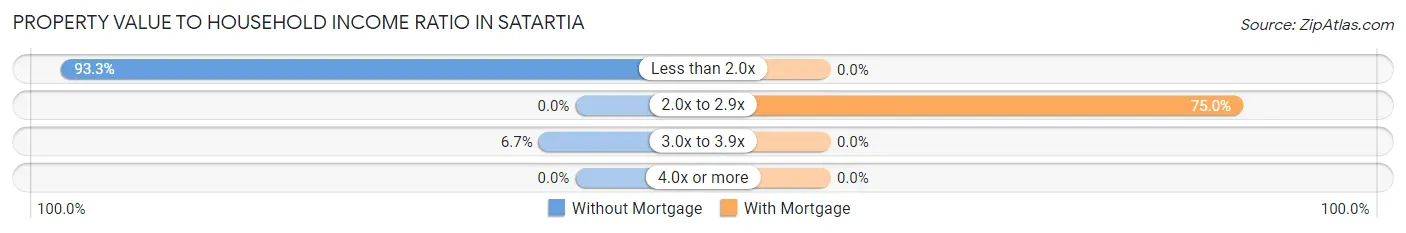
| Value-to-Income Ratio | Without Mortgage | With Mortgage |
| Less than 2.0x | 14 (93.3%) | 0 (0.0%) |
| 2.0x to 2.9x | 0 (0.0%) | 6 (75.0%) |
| 3.0x to 3.9x | 1 (6.7%) | 0 (0.0%) |
| 4.0x or more | 0 (0.0%) | 0 (0.0%) |
| Total | 15 (100.0%) | 8 (100.0%) |
Real Estate Taxes by Mortgage Status in Satartia
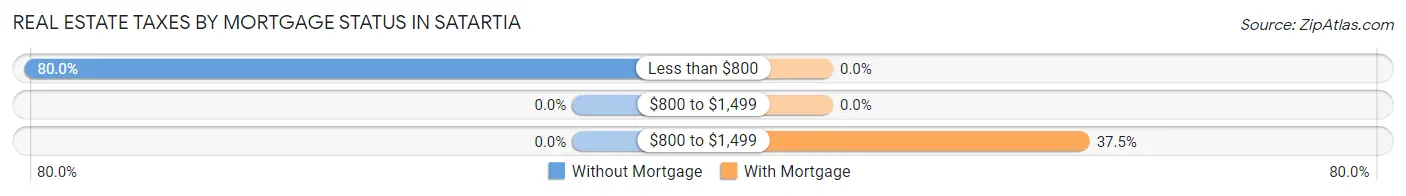
| Property Taxes | Without Mortgage | With Mortgage |
| Less than $800 | 12 (80.0%) | 0 (0.0%) |
| $800 to $1,499 | 0 (0.0%) | 0 (0.0%) |
| $800 to $1,499 | 0 (0.0%) | 3 (37.5%) |
| Total | 15 (100.0%) | 8 (100.0%) |
Health & Disability in Satartia
Health Insurance Coverage by Age in Satartia
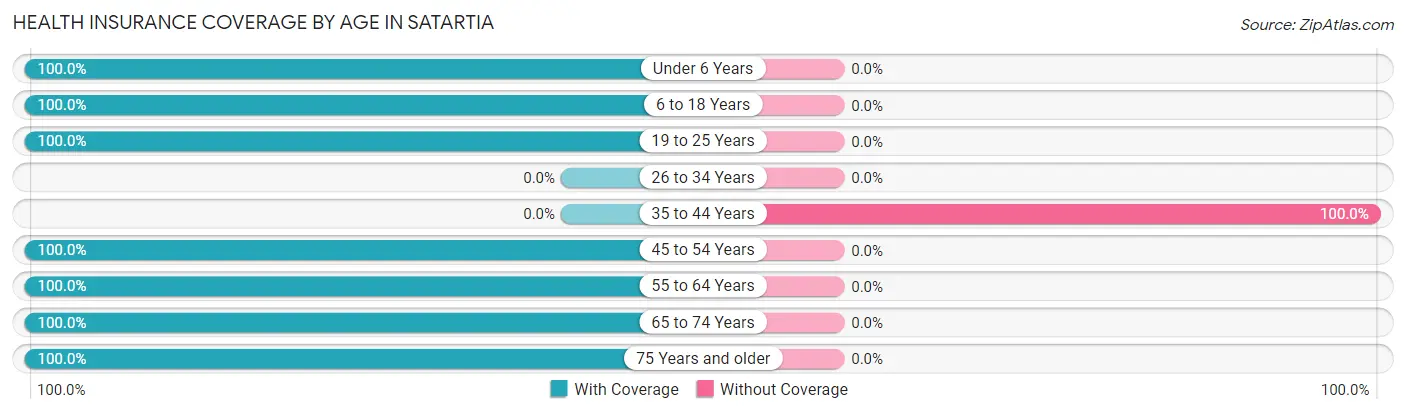
| Age Bracket | With Coverage | Without Coverage |
| Under 6 Years | 2 (100.0%) | 0 (0.0%) |
| 6 to 18 Years | 3 (100.0%) | 0 (0.0%) |
| 19 to 25 Years | 4 (100.0%) | 0 (0.0%) |
| 26 to 34 Years | 0 (0.0%) | 0 (0.0%) |
| 35 to 44 Years | 0 (0.0%) | 5 (100.0%) |
| 45 to 54 Years | 6 (100.0%) | 0 (0.0%) |
| 55 to 64 Years | 20 (100.0%) | 0 (0.0%) |
| 65 to 74 Years | 3 (100.0%) | 0 (0.0%) |
| 75 Years and older | 1 (100.0%) | 0 (0.0%) |
| Total | 39 (88.6%) | 5 (11.4%) |
Health Insurance Coverage by Citizenship Status in Satartia
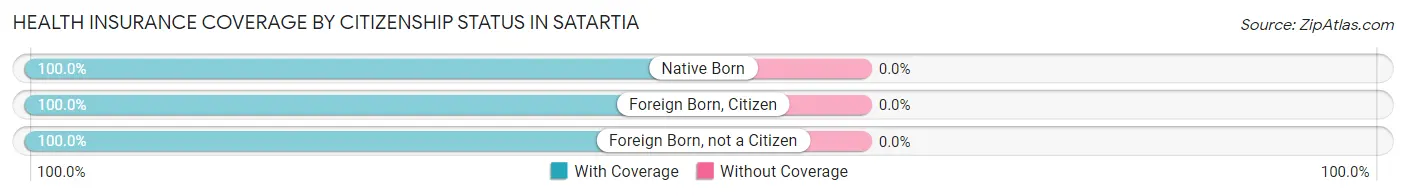
| Citizenship Status | With Coverage | Without Coverage |
| Native Born | 2 (100.0%) | 0 (0.0%) |
| Foreign Born, Citizen | 3 (100.0%) | 0 (0.0%) |
| Foreign Born, not a Citizen | 4 (100.0%) | 0 (0.0%) |
Health Insurance Coverage by Household Income in Satartia
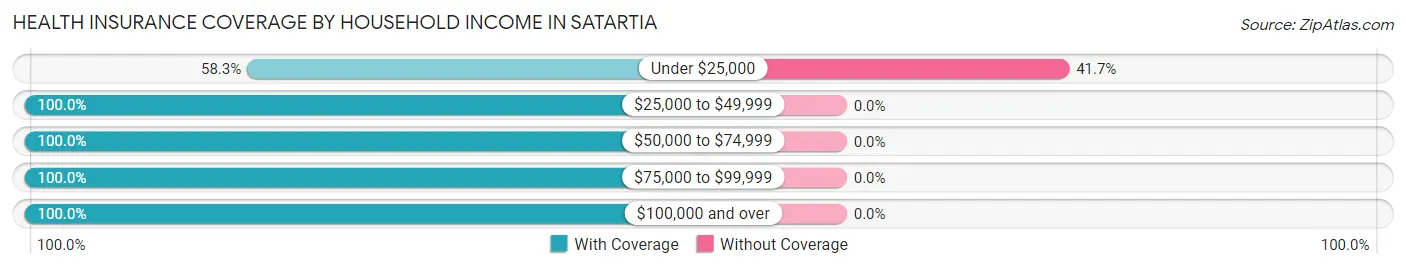
| Household Income | With Coverage | Without Coverage |
| Under $25,000 | 7 (58.3%) | 5 (41.7%) |
| $25,000 to $49,999 | 6 (100.0%) | 0 (0.0%) |
| $50,000 to $74,999 | 2 (100.0%) | 0 (0.0%) |
| $75,000 to $99,999 | 5 (100.0%) | 0 (0.0%) |
| $100,000 and over | 19 (100.0%) | 0 (0.0%) |
Public vs Private Health Insurance Coverage by Age in Satartia
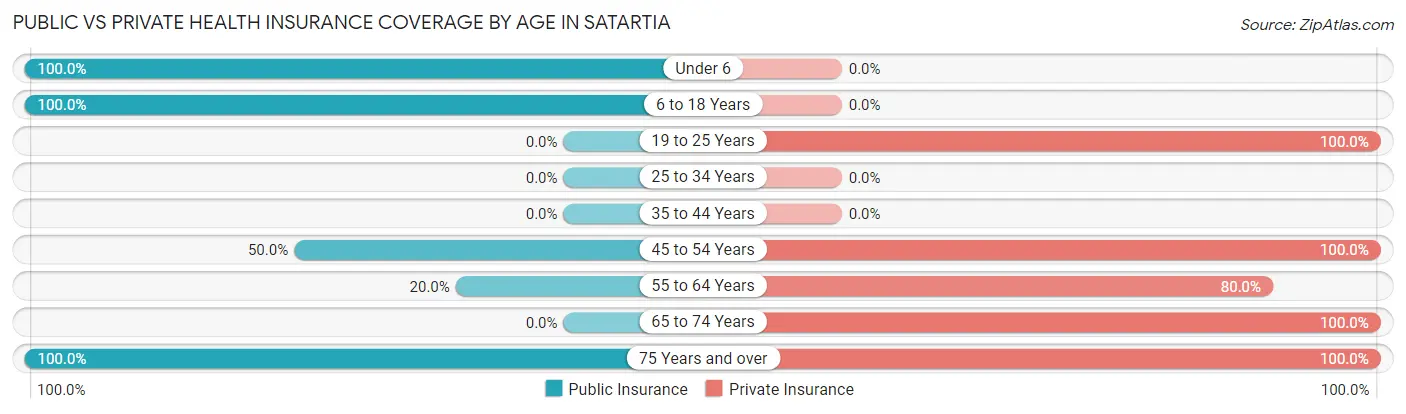
| Age Bracket | Public Insurance | Private Insurance |
| Under 6 | 2 (100.0%) | 0 (0.0%) |
| 6 to 18 Years | 3 (100.0%) | 0 (0.0%) |
| 19 to 25 Years | 0 (0.0%) | 4 (100.0%) |
| 25 to 34 Years | 0 (0.0%) | 0 (0.0%) |
| 35 to 44 Years | 0 (0.0%) | 0 (0.0%) |
| 45 to 54 Years | 3 (50.0%) | 6 (100.0%) |
| 55 to 64 Years | 4 (20.0%) | 16 (80.0%) |
| 65 to 74 Years | 0 (0.0%) | 3 (100.0%) |
| 75 Years and over | 1 (100.0%) | 1 (100.0%) |
| Total | 13 (29.5%) | 30 (68.2%) |
Disability Status by Sex by Age in Satartia
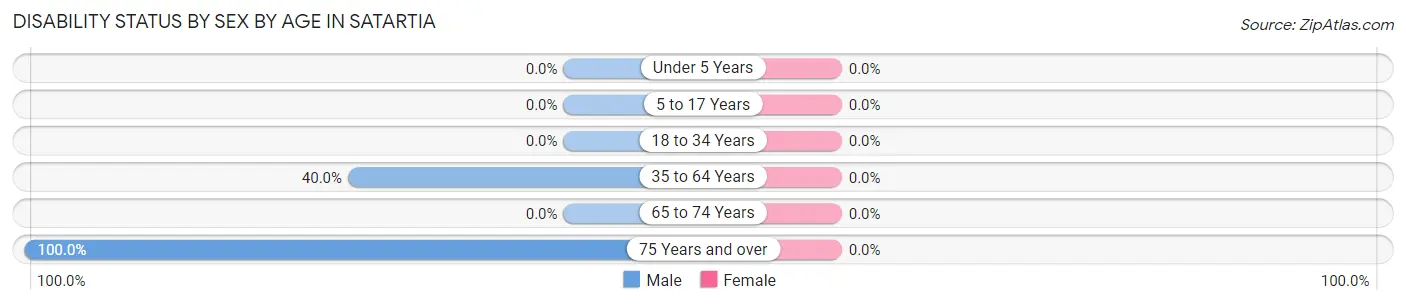
| Age Bracket | Male | Female |
| Under 5 Years | 0 (0.0%) | 0 (0.0%) |
| 5 to 17 Years | 0 (0.0%) | 0 (0.0%) |
| 18 to 34 Years | 0 (0.0%) | 0 (0.0%) |
| 35 to 64 Years | 8 (40.0%) | 0 (0.0%) |
| 65 to 74 Years | 0 (0.0%) | 0 (0.0%) |
| 75 Years and over | 1 (100.0%) | 0 (0.0%) |
Disability Class by Sex by Age in Satartia
Disability Class: Hearing Difficulty
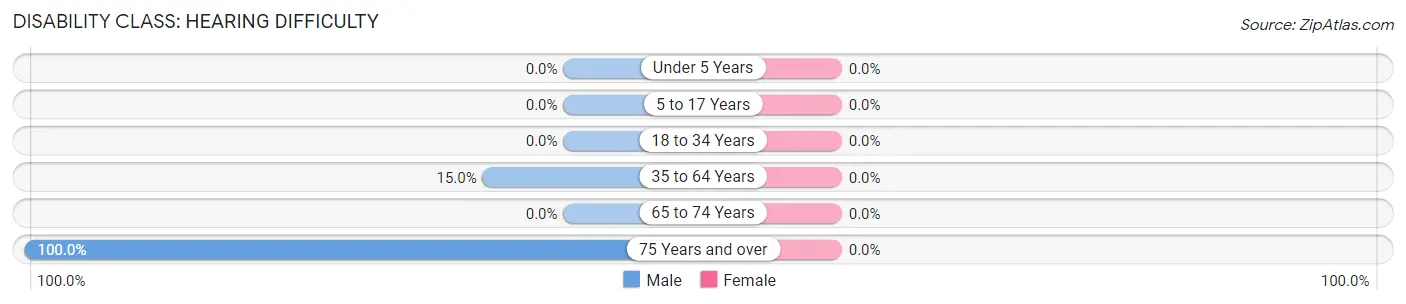
| Age Bracket | Male | Female |
| Under 5 Years | 0 (0.0%) | 0 (0.0%) |
| 5 to 17 Years | 0 (0.0%) | 0 (0.0%) |
| 18 to 34 Years | 0 (0.0%) | 0 (0.0%) |
| 35 to 64 Years | 3 (15.0%) | 0 (0.0%) |
| 65 to 74 Years | 0 (0.0%) | 0 (0.0%) |
| 75 Years and over | 1 (100.0%) | 0 (0.0%) |
Disability Class: Vision Difficulty
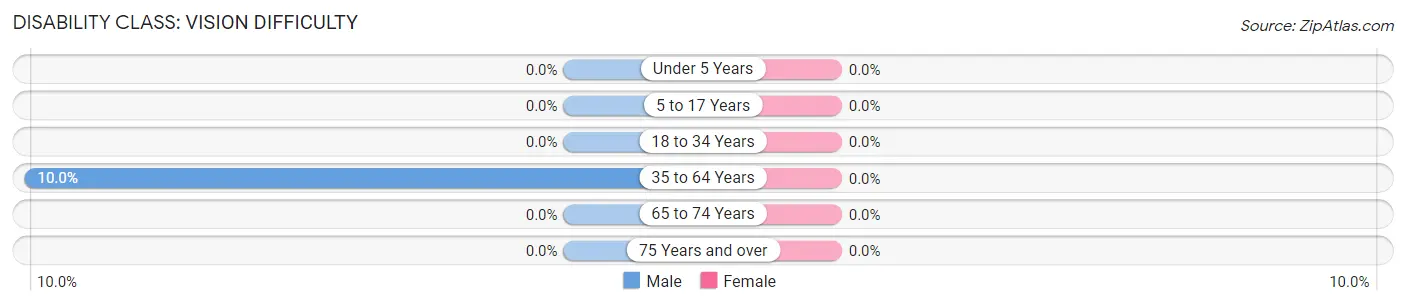
| Age Bracket | Male | Female |
| Under 5 Years | 0 (0.0%) | 0 (0.0%) |
| 5 to 17 Years | 0 (0.0%) | 0 (0.0%) |
| 18 to 34 Years | 0 (0.0%) | 0 (0.0%) |
| 35 to 64 Years | 2 (10.0%) | 0 (0.0%) |
| 65 to 74 Years | 0 (0.0%) | 0 (0.0%) |
| 75 Years and over | 0 (0.0%) | 0 (0.0%) |
Disability Class: Cognitive Difficulty
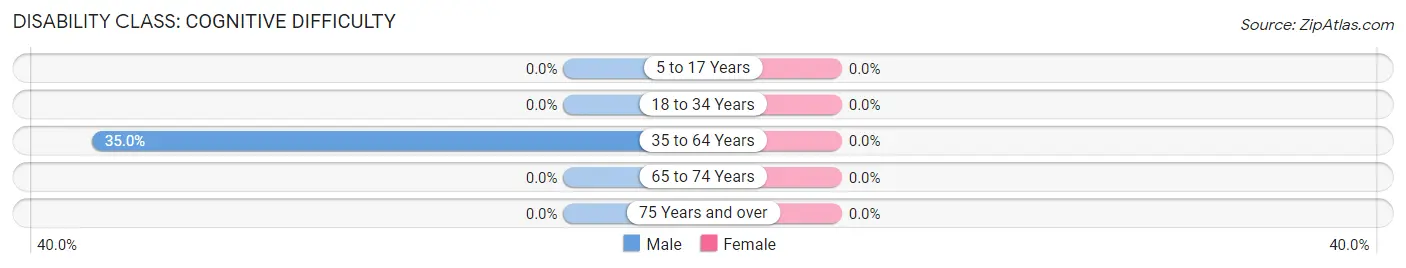
| Age Bracket | Male | Female |
| 5 to 17 Years | 0 (0.0%) | 0 (0.0%) |
| 18 to 34 Years | 0 (0.0%) | 0 (0.0%) |
| 35 to 64 Years | 7 (35.0%) | 0 (0.0%) |
| 65 to 74 Years | 0 (0.0%) | 0 (0.0%) |
| 75 Years and over | 0 (0.0%) | 0 (0.0%) |
Disability Class: Ambulatory Difficulty
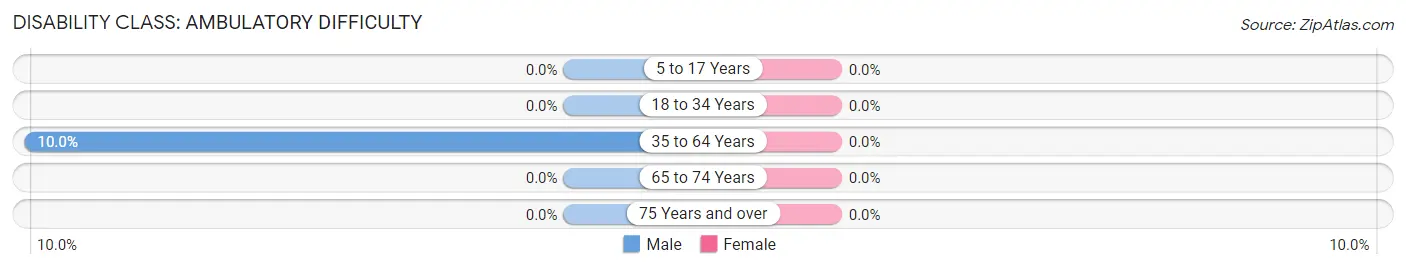
| Age Bracket | Male | Female |
| 5 to 17 Years | 0 (0.0%) | 0 (0.0%) |
| 18 to 34 Years | 0 (0.0%) | 0 (0.0%) |
| 35 to 64 Years | 2 (10.0%) | 0 (0.0%) |
| 65 to 74 Years | 0 (0.0%) | 0 (0.0%) |
| 75 Years and over | 0 (0.0%) | 0 (0.0%) |
Disability Class: Self-Care Difficulty
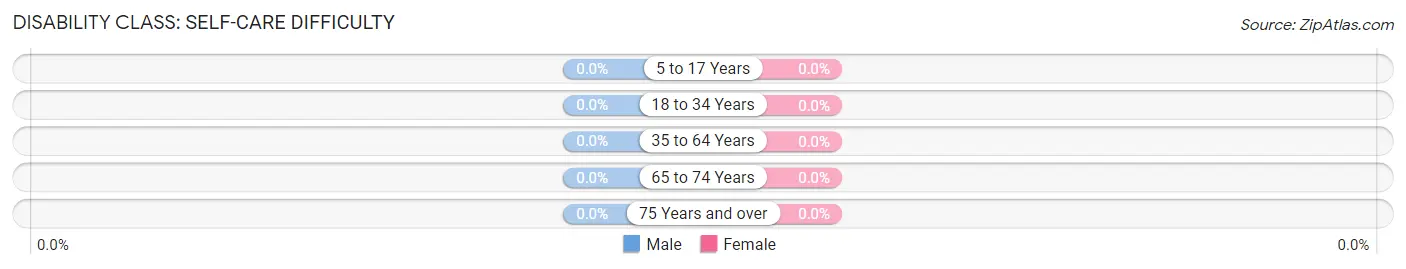
| Age Bracket | Male | Female |
| 5 to 17 Years | 0 (0.0%) | 0 (0.0%) |
| 18 to 34 Years | 0 (0.0%) | 0 (0.0%) |
| 35 to 64 Years | 0 (0.0%) | 0 (0.0%) |
| 65 to 74 Years | 0 (0.0%) | 0 (0.0%) |
| 75 Years and over | 0 (0.0%) | 0 (0.0%) |
Technology Access in Satartia
Computing Device Access in Satartia
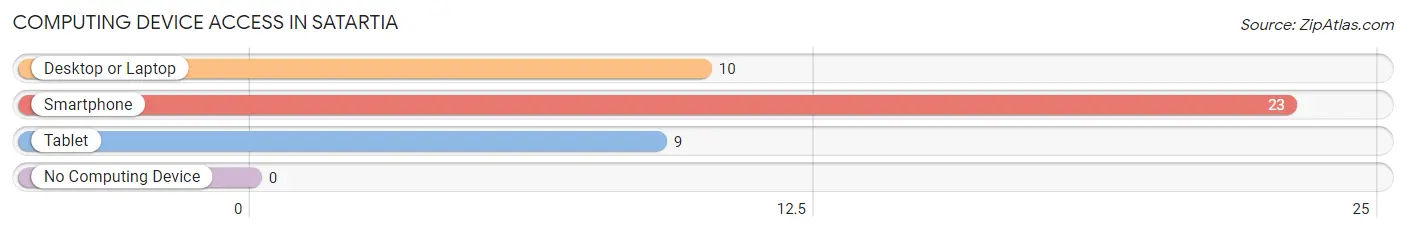
| Device Type | # Households | % Households |
| Desktop or Laptop | 10 | 41.7% |
| Smartphone | 23 | 95.8% |
| Tablet | 9 | 37.5% |
| No Computing Device | 0 | 0.0% |
| Total | 24 | 100.0% |
Internet Access in Satartia
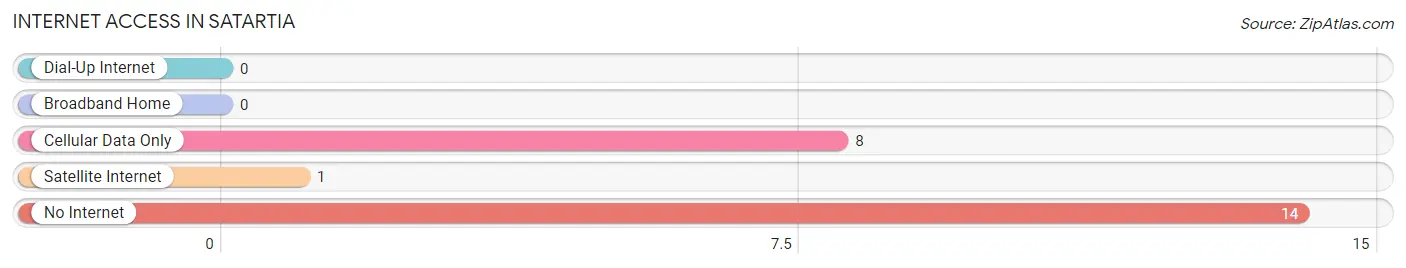
| Internet Type | # Households | % Households |
| Dial-Up Internet | 0 | 0.0% |
| Broadband Home | 0 | 0.0% |
| Cellular Data Only | 8 | 33.3% |
| Satellite Internet | 1 | 4.2% |
| No Internet | 14 | 58.3% |
| Total | 24 | 100.0% |
Satartia Summary
Satartia is a small town located in Yazoo County, Mississippi. It is situated on the banks of the Yazoo River, about 25 miles northwest of Jackson, the state capital. The town was founded in 1837 and named after the Satartia Indian tribe, which had inhabited the area for centuries. The population of Satartia was estimated to be around 500 in 2000.
Geography
Satartia is located in the Yazoo River Delta region of Mississippi. The town is situated on the banks of the Yazoo River, about 25 miles northwest of Jackson, the state capital. The town is surrounded by flat, fertile farmland, and is located in the Yazoo-Mississippi Delta National Wildlife Refuge. The town is also located near the Mississippi River, which is about 30 miles to the south.
Economy
Satartia’s economy is largely based on agriculture. The town is surrounded by flat, fertile farmland, and is located in the Yazoo-Mississippi Delta National Wildlife Refuge. The town is also located near the Mississippi River, which is about 30 miles to the south. The town is home to several small businesses, including a grocery store, a hardware store, and a few restaurants. The town also has a few small manufacturing plants, which produce items such as furniture and clothing.
Demographics
The population of Satartia was estimated to be around 500 in 2000. The town is predominantly white, with a small African American population. The median household income in Satartia is around $30,000, and the median home value is around $80,000. The town has a high rate of poverty, with around 25% of the population living below the poverty line.
History
Satartia was founded in 1837 and named after the Satartia Indian tribe, which had inhabited the area for centuries. The town was originally a trading post for the local Native American tribes, and was later used as a stop on the Mississippi River steamboat route. During the Civil War, the town was occupied by Union forces, and the town was destroyed by a tornado in 1878. The town was rebuilt, and the economy was largely based on agriculture. In the early 20th century, the town was home to several small businesses, including a grocery store, a hardware store, and a few restaurants. The town also had a few small manufacturing plants, which produced items such as furniture and clothing.
Common Questions
What is Per Capita Income in Satartia?
Per Capita income in Satartia is $34,920.
What is the Median Family Income in Satartia?
Median Family Income in Satartia is $113,214.
What is Inequality or Gini Index in Satartia?
Inequality or Gini Index in Satartia is 0.39.
What is the Total Population of Satartia?
Total Population of Satartia is 44.
What is the Total Male Population of Satartia?
Total Male Population of Satartia is 24.
What is the Total Female Population of Satartia?
Total Female Population of Satartia is 20.
What is the Ratio of Males per 100 Females in Satartia?
There are 120.00 Males per 100 Females in Satartia.
What is the Ratio of Females per 100 Males in Satartia?
There are 83.33 Females per 100 Males in Satartia.
What is the Median Population Age in Satartia?
Median Population Age in Satartia is 57.0 Years.
What is the Average Family Size in Satartia
Average Family Size in Satartia is 2.2 People.
What is the Average Household Size in Satartia
Average Household Size in Satartia is 1.8 People.
How Large is the Labor Force in Satartia?
There are 27 People in the Labor Forcein in Satartia.
What is the Percentage of People in the Labor Force in Satartia?
69.2% of People are in the Labor Force in Satartia.