Immigrants from Honduras Wage/Income Gap
COMPARE
Immigrants from Honduras
Select to Compare
Wage/Income Gap
Immigrants from Honduras Wage/Income Gap
23.5%
WAGE/INCOME GAP
99.5/ 100
METRIC RATING
92nd/ 347
METRIC RANK
Immigrants from Honduras Wage/Income Gap Correlation Chart
The statistical analysis conducted on geographies consisting of 322,424,555 people shows a mild positive correlation between the proportion of Immigrants from Honduras and wage/income gap percentage in the United States with a correlation coefficient (R) of 0.342 and weighted average of 23.5%. On average, for every 1% (one percent) increase in Immigrants from Honduras within a typical geography, there is an increase of 0.52% in wage/income gap percentage.
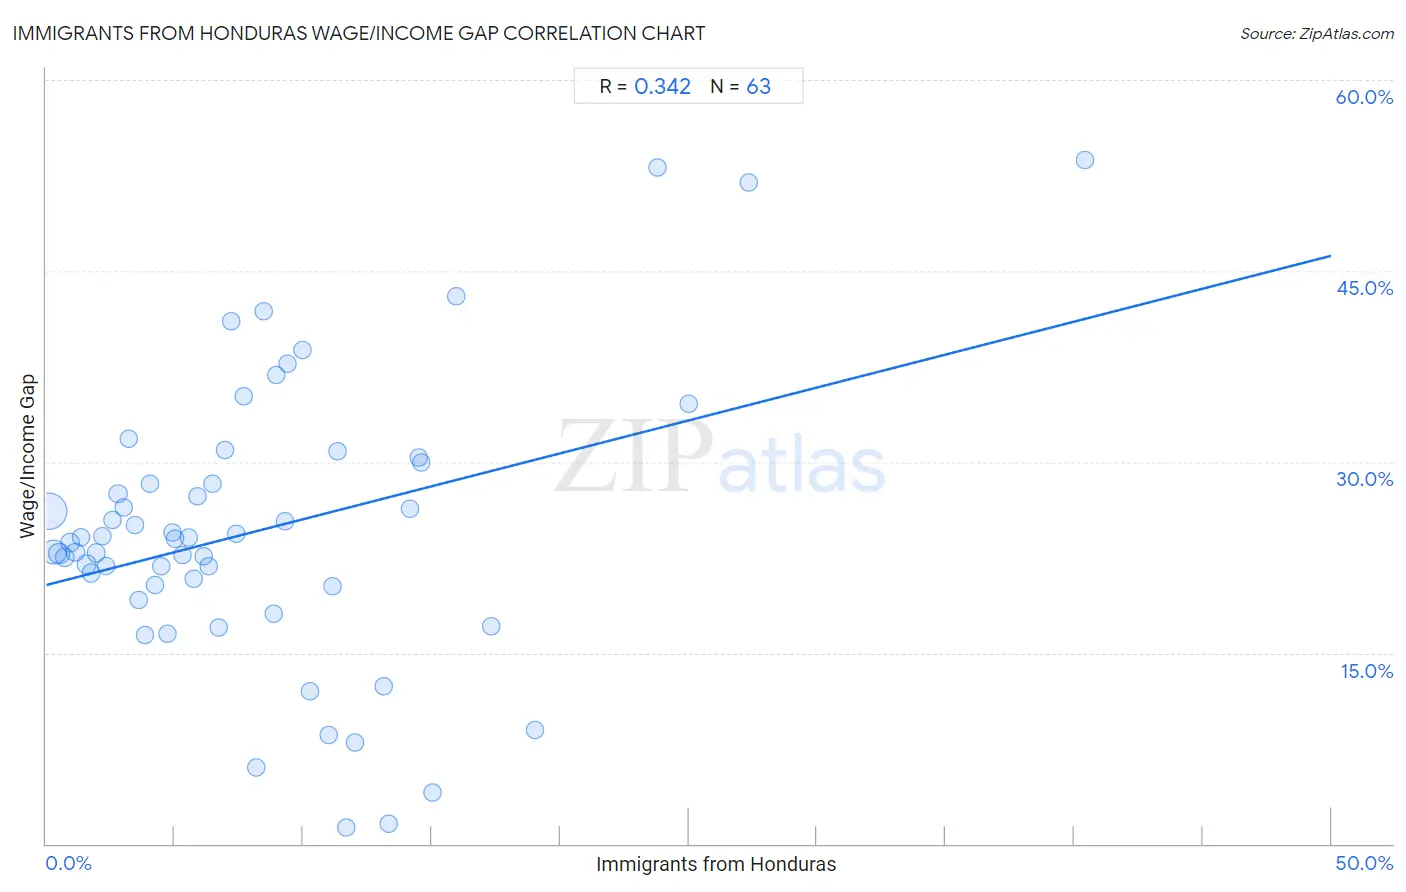
It is essential to understand that the correlation between the percentage of Immigrants from Honduras and wage/income gap percentage does not imply a direct cause-and-effect relationship. It remains uncertain whether the presence of Immigrants from Honduras influences an upward or downward trend in the level of wage/income gap percentage within an area, or if Immigrants from Honduras simply ended up residing in those areas with higher or lower levels of wage/income gap percentage due to other factors.
Demographics Similar to Immigrants from Honduras by Wage/Income Gap
In terms of wage/income gap, the demographic groups most similar to Immigrants from Honduras are Arapaho (23.5%, a difference of 0.15%), Immigrants from Cabo Verde (23.6%, a difference of 0.24%), Nicaraguan (23.4%, a difference of 0.29%), Marshallese (23.4%, a difference of 0.30%), and Honduran (23.6%, a difference of 0.33%).
| Demographics | Rating | Rank | Wage/Income Gap |
| Immigrants from Cambodia | 99.7 /100 | #85 | Exceptional 23.3% |
| Cheyenne | 99.7 /100 | #86 | Exceptional 23.3% |
| Yuman | 99.7 /100 | #87 | Exceptional 23.3% |
| Immigrants from Panama | 99.6 /100 | #88 | Exceptional 23.4% |
| Marshallese | 99.6 /100 | #89 | Exceptional 23.4% |
| Nicaraguans | 99.6 /100 | #90 | Exceptional 23.4% |
| Arapaho | 99.6 /100 | #91 | Exceptional 23.5% |
| Immigrants from Honduras | 99.5 /100 | #92 | Exceptional 23.5% |
| Immigrants from Cabo Verde | 99.5 /100 | #93 | Exceptional 23.6% |
| Hondurans | 99.5 /100 | #94 | Exceptional 23.6% |
| Cape Verdeans | 99.4 /100 | #95 | Exceptional 23.6% |
| Kiowa | 99.4 /100 | #96 | Exceptional 23.6% |
| Immigrants from Sudan | 99.4 /100 | #97 | Exceptional 23.6% |
| Immigrants from Latin America | 99.2 /100 | #98 | Exceptional 23.7% |
| Aleuts | 99.2 /100 | #99 | Exceptional 23.7% |
Immigrants from Honduras Wage/Income Gap Correlation Summary
| Measurement | Immigrants from Honduras Data | Wage/Income Gap Data |
| Minimum | 0.086% | 1.3% |
| Maximum | 40.4% | 53.7% |
| Range | 40.3% | 52.4% |
| Mean | 8.3% | 24.6% |
| Median | 6.5% | 24.0% |
| Interquartile 25% (IQ1) | 3.2% | 20.2% |
| Interquartile 75% (IQ3) | 11.3% | 30.0% |
| Interquartile Range (IQR) | 8.1% | 9.8% |
| Standard Deviation (Sample) | 7.4% | 11.1% |
| Standard Deviation (Population) | 7.3% | 11.0% |
Correlation Details
| Immigrants from Honduras Percentile | Sample Size | Wage/Income Gap |
[ 0.0% - 0.5% ] 0.086% | 175,005,770 | 26.1% |
[ 0.0% - 0.5% ] 0.31% | 65,956,813 | 22.9% |
[ 0.5% - 1.0% ] 0.50% | 27,086,201 | 22.8% |
[ 0.5% - 1.0% ] 0.72% | 15,538,878 | 22.5% |
[ 0.5% - 1.0% ] 0.94% | 9,515,331 | 23.6% |
[ 1.0% - 1.5% ] 1.13% | 4,928,831 | 22.9% |
[ 1.0% - 1.5% ] 1.34% | 4,177,372 | 24.1% |
[ 1.5% - 2.0% ] 1.57% | 3,908,069 | 22.0% |
[ 1.5% - 2.0% ] 1.76% | 2,985,824 | 21.3% |
[ 1.5% - 2.0% ] 1.96% | 1,711,016 | 22.8% |
[ 2.0% - 2.5% ] 2.17% | 1,310,824 | 24.1% |
[ 2.0% - 2.5% ] 2.32% | 3,451,396 | 21.8% |
[ 2.5% - 3.0% ] 2.57% | 1,115,708 | 25.5% |
[ 2.5% - 3.0% ] 2.79% | 1,265,471 | 27.5% |
[ 3.0% - 3.5% ] 3.02% | 412,261 | 26.4% |
[ 3.0% - 3.5% ] 3.22% | 310,136 | 31.8% |
[ 3.0% - 3.5% ] 3.45% | 189,257 | 25.0% |
[ 3.5% - 4.0% ] 3.60% | 462,659 | 19.2% |
[ 3.5% - 4.0% ] 3.87% | 223,671 | 16.4% |
[ 4.0% - 4.5% ] 4.04% | 268,045 | 28.3% |
[ 4.0% - 4.5% ] 4.24% | 350,421 | 20.3% |
[ 4.0% - 4.5% ] 4.45% | 237,052 | 21.8% |
[ 4.5% - 5.0% ] 4.72% | 58,036 | 16.5% |
[ 4.5% - 5.0% ] 4.89% | 124,604 | 24.4% |
[ 5.0% - 5.5% ] 5.02% | 553,716 | 24.0% |
[ 5.0% - 5.5% ] 5.29% | 61,328 | 22.7% |
[ 5.5% - 6.0% ] 5.53% | 135,492 | 24.0% |
[ 5.5% - 6.0% ] 5.76% | 196,162 | 20.8% |
[ 5.5% - 6.0% ] 5.87% | 127,134 | 27.3% |
[ 6.0% - 6.5% ] 6.11% | 37,205 | 22.6% |
[ 6.0% - 6.5% ] 6.30% | 54,266 | 21.8% |
[ 6.0% - 6.5% ] 6.48% | 76,752 | 28.3% |
[ 6.5% - 7.0% ] 6.70% | 11,795 | 17.0% |
[ 6.5% - 7.0% ] 6.94% | 2,220 | 31.0% |
[ 7.0% - 7.5% ] 7.21% | 31,518 | 41.0% |
[ 7.0% - 7.5% ] 7.38% | 45,797 | 24.3% |
[ 7.5% - 8.0% ] 7.71% | 33,614 | 35.2% |
[ 8.0% - 8.5% ] 8.17% | 45,390 | 6.0% |
[ 8.0% - 8.5% ] 8.48% | 33,529 | 41.9% |
[ 8.5% - 9.0% ] 8.87% | 46,123 | 18.0% |
[ 8.5% - 9.0% ] 8.95% | 20,266 | 36.8% |
[ 9.0% - 9.5% ] 9.27% | 52,360 | 25.3% |
[ 9.0% - 9.5% ] 9.37% | 896 | 37.7% |
[ 9.5% - 10.0% ] 9.95% | 46,266 | 38.7% |
[ 10.0% - 10.5% ] 10.28% | 8,071 | 12.0% |
[ 11.0% - 11.5% ] 11.01% | 8,750 | 8.6% |
[ 11.0% - 11.5% ] 11.13% | 66,326 | 20.2% |
[ 11.0% - 11.5% ] 11.32% | 59,121 | 30.9% |
[ 11.5% - 12.0% ] 11.66% | 16,743 | 1.3% |
[ 12.0% - 12.5% ] 12.01% | 26,105 | 8.0% |
[ 13.0% - 13.5% ] 13.13% | 7,385 | 12.4% |
[ 13.0% - 13.5% ] 13.32% | 856 | 1.6% |
[ 14.0% - 14.5% ] 14.14% | 6,947 | 26.3% |
[ 14.5% - 15.0% ] 14.50% | 1,303 | 30.4% |
[ 14.5% - 15.0% ] 14.58% | 48 | 30.0% |
[ 15.0% - 15.5% ] 15.03% | 3,559 | 4.0% |
[ 15.5% - 16.0% ] 15.95% | 8,989 | 43.0% |
[ 17.0% - 17.5% ] 17.32% | 976 | 17.1% |
[ 18.5% - 19.0% ] 19.00% | 679 | 8.9% |
[ 23.5% - 24.0% ] 23.77% | 774 | 53.1% |
[ 25.0% - 25.5% ] 25.00% | 1,540 | 34.6% |
[ 27.0% - 27.5% ] 27.34% | 673 | 51.9% |
[ 40.0% - 40.5% ] 40.43% | 235 | 53.7% |