Immigrants from Bosnia and Herzegovina Wage/Income Gap

COMPARE

Immigrants from Bosnia and Herzegovina
Race
Ancestry
AfghanAfricanAlaska NativeAlaskan AthabascanAlbanianAleutAlsatianAmericanApacheArabArapahoArgentineanArmenianAssyrian/Chaldean/SyriacAustralianAustrianBahamianBangladeshiBarbadianBasqueBelgianBelizeanBermudanBhutaneseBlackfeetBolivianBrazilianBritishBritish West IndianBulgarianBurmeseCajunCambodianCanadianCape VerdeanCarpatho RusynCelticCentral AmericanCentral American IndianCherokeeCheyenneChickasawChileanChineseChippewaChoctawColombianColvilleComancheCosta RicanCreeCreekCroatianCrowCubanCypriotCzechCzechoslovakianDanishDelawareDominicanDutchDutch West IndianEastern EuropeanEcuadorianEgyptianEnglishEstonianEthiopianEuropeanFijianFilipinoFinnishFrenchFrench American IndianFrench CanadianGermanGerman RussianGhanaianGreekGuamanian/ChamorroGuatemalanGuyaneseHaitianHmongHonduranHopiHoumaHungarianIcelanderIndian (Asian)IndonesianInupiatIranianIraqiIrishIroquoisIsraeliItalianJamaicanJapaneseJordanianKenyanKiowaKoreanLaotianLatvianLebaneseLiberianLithuanianLumbeeLuxembourgerMacedonianMalaysianMalteseMarshalleseMenomineeMexicanMexican American IndianMongolianMoroccanNative HawaiianNavajoNepaleseNew ZealanderNicaraguanNigerianNorthern EuropeanNorwegianOkinawanOsageOttawaPaiutePakistaniPalestinianPanamanianParaguayanPennsylvania GermanPeruvianPimaPolishPortuguesePotawatomiPuebloPuerto RicanPuget Sound SalishRomanianRussianSalvadoranSamoanScandinavianScotch-IrishScottishSeminoleSenegaleseSerbianShoshoneSierra LeoneanSiouxSlavicSlovakSloveneSomaliSouth AfricanSouth AmericanSouth American IndianSoviet UnionSpaniardSpanishSpanish AmericanSpanish American IndianSri LankanSubsaharan AfricanSudaneseSwedishSwissSyrianTaiwaneseThaiTlingit-HaidaTohono O'OdhamTonganTrinidadian and TobagonianTsimshianTurkishU.S. Virgin IslanderUgandanUkrainianUruguayanUteVenezuelanVietnameseWelshWest IndianYakamaYaquiYugoslavianYumanYup'ikZimbabwean
Immigration
NonimmigrantsImmigrantsAfghanistanAfricaAlbaniaArgentinaArmeniaAsiaAustraliaAustriaBahamasBangladeshBarbadosBelarusBelgiumBelizeBoliviaBosnia and HerzegovinaBrazilBulgariaBurma/MyanmarCabo VerdeCambodiaCameroonCanadaCaribbeanCentral AmericaChileChinaColombiaCongoCosta RicaCroatiaCubaCzechoslovakiaDenmarkDominicaDominican RepublicEastern AfricaEastern AsiaEastern EuropeEcuadorEgyptEl SalvadorEnglandEritreaEthiopiaEuropeFijiFranceGermanyGhanaGreeceGrenadaGuatemalaGuyanaHaitiHondurasHong KongHungaryIndiaIndonesiaIranIraqIrelandIsraelItalyJamaicaJapanJordanKazakhstanKenyaKoreaKuwaitLaosLatin AmericaLatviaLebanonLiberiaLithuaniaMalaysiaMexicoMicronesiaMiddle AfricaMoldovaMoroccoNepalNetherlandsNicaraguaNigeriaNorth AmericaNorth MacedoniaNorthern AfricaNorthern EuropeNorwayOceaniaPakistanPanamaPeruPhilippinesPolandPortugalRomaniaRussiaSaudi ArabiaScotlandSenegalSerbiaSierra LeoneSingaporeSomaliaSouth AfricaSouth AmericaSouth Central AsiaSouth Eastern AsiaSouthern EuropeSpainSri LankaSt. Vincent and the GrenadinesSudanSwedenSwitzerlandSyriaTaiwanThailandTrinidad and TobagoTurkeyUgandaUkraineUruguayUzbekistanVenezuelaVietnamWest IndiesWestern AfricaWestern AsiaWestern EuropeYemenZaireZimbabweAzores
Select to Compare
Race
Ancestry
AfghanAfricanAlaska NativeAlaskan AthabascanAlbanianAleutAlsatianAmericanApacheArabArapahoArgentineanArmenianAssyrian/Chaldean/SyriacAustralianAustrianBahamianBangladeshiBarbadianBasqueBelgianBelizeanBermudanBhutaneseBlackfeetBolivianBrazilianBritishBritish West IndianBulgarianBurmeseCajunCambodianCanadianCape VerdeanCarpatho RusynCelticCentral AmericanCentral American IndianCherokeeCheyenneChickasawChileanChineseChippewaChoctawColombianColvilleComancheCosta RicanCreeCreekCroatianCrowCubanCypriotCzechCzechoslovakianDanishDelawareDominicanDutchDutch West IndianEastern EuropeanEcuadorianEgyptianEnglishEstonianEthiopianEuropeanFijianFilipinoFinnishFrenchFrench American IndianFrench CanadianGermanGerman RussianGhanaianGreekGuamanian/ChamorroGuatemalanGuyaneseHaitianHmongHonduranHopiHoumaHungarianIcelanderIndian (Asian)IndonesianInupiatIranianIraqiIrishIroquoisIsraeliItalianJamaicanJapaneseJordanianKenyanKiowaKoreanLaotianLatvianLebaneseLiberianLithuanianLumbeeLuxembourgerMacedonianMalaysianMalteseMarshalleseMenomineeMexicanMexican American IndianMongolianMoroccanNative HawaiianNavajoNepaleseNew ZealanderNicaraguanNigerianNorthern EuropeanNorwegianOkinawanOsageOttawaPaiutePakistaniPalestinianPanamanianParaguayanPennsylvania GermanPeruvianPimaPolishPortuguesePotawatomiPuebloPuerto RicanPuget Sound SalishRomanianRussianSalvadoranSamoanScandinavianScotch-IrishScottishSeminoleSenegaleseSerbianShoshoneSierra LeoneanSiouxSlavicSlovakSloveneSomaliSouth AfricanSouth AmericanSouth American IndianSoviet UnionSpaniardSpanishSpanish AmericanSpanish American IndianSri LankanSubsaharan AfricanSudaneseSwedishSwissSyrianTaiwaneseThaiTlingit-HaidaTohono O'OdhamTonganTrinidadian and TobagonianTsimshianTurkishU.S. Virgin IslanderUgandanUkrainianUruguayanUteVenezuelanVietnameseWelshWest IndianYakamaYaquiYugoslavianYumanYup'ikZimbabwean
Immigration
NonimmigrantsImmigrantsAfghanistanAfricaAlbaniaArgentinaArmeniaAsiaAustraliaAustriaBahamasBangladeshBarbadosBelarusBelgiumBelizeBoliviaBrazilBulgariaBurma/MyanmarCabo VerdeCambodiaCameroonCanadaCaribbeanCentral AmericaChileChinaColombiaCongoCosta RicaCroatiaCubaCzechoslovakiaDenmarkDominicaDominican RepublicEastern AfricaEastern AsiaEastern EuropeEcuadorEgyptEl SalvadorEnglandEritreaEthiopiaEuropeFijiFranceGermanyGhanaGreeceGrenadaGuatemalaGuyanaHaitiHondurasHong KongHungaryIndiaIndonesiaIranIraqIrelandIsraelItalyJamaicaJapanJordanKazakhstanKenyaKoreaKuwaitLaosLatin AmericaLatviaLebanonLiberiaLithuaniaMalaysiaMexicoMicronesiaMiddle AfricaMoldovaMoroccoNepalNetherlandsNicaraguaNigeriaNorth AmericaNorth MacedoniaNorthern AfricaNorthern EuropeNorwayOceaniaPakistanPanamaPeruPhilippinesPolandPortugalRomaniaRussiaSaudi ArabiaScotlandSenegalSerbiaSierra LeoneSingaporeSomaliaSouth AfricaSouth AmericaSouth Central AsiaSouth Eastern AsiaSouthern EuropeSpainSri LankaSt. Vincent and the GrenadinesSudanSwedenSwitzerlandSyriaTaiwanThailandTrinidad and TobagoTurkeyUgandaUkraineUruguayUzbekistanVenezuelaVietnamWest IndiesWestern AfricaWestern AsiaWestern EuropeYemenZaireZimbabweAzores
Wage/Income Gap
Income
Poverty
Unemployment
Labor Participation
Family Structure
Vehicle Availability
Education Level
Disability

Immigrants from Bosnia and Herzegovina Wage/Income Gap
Exceptional

24.8%
WAGE/INCOME GAP
90.1/ 100
METRIC RATING
138th/ 347
METRIC RANK

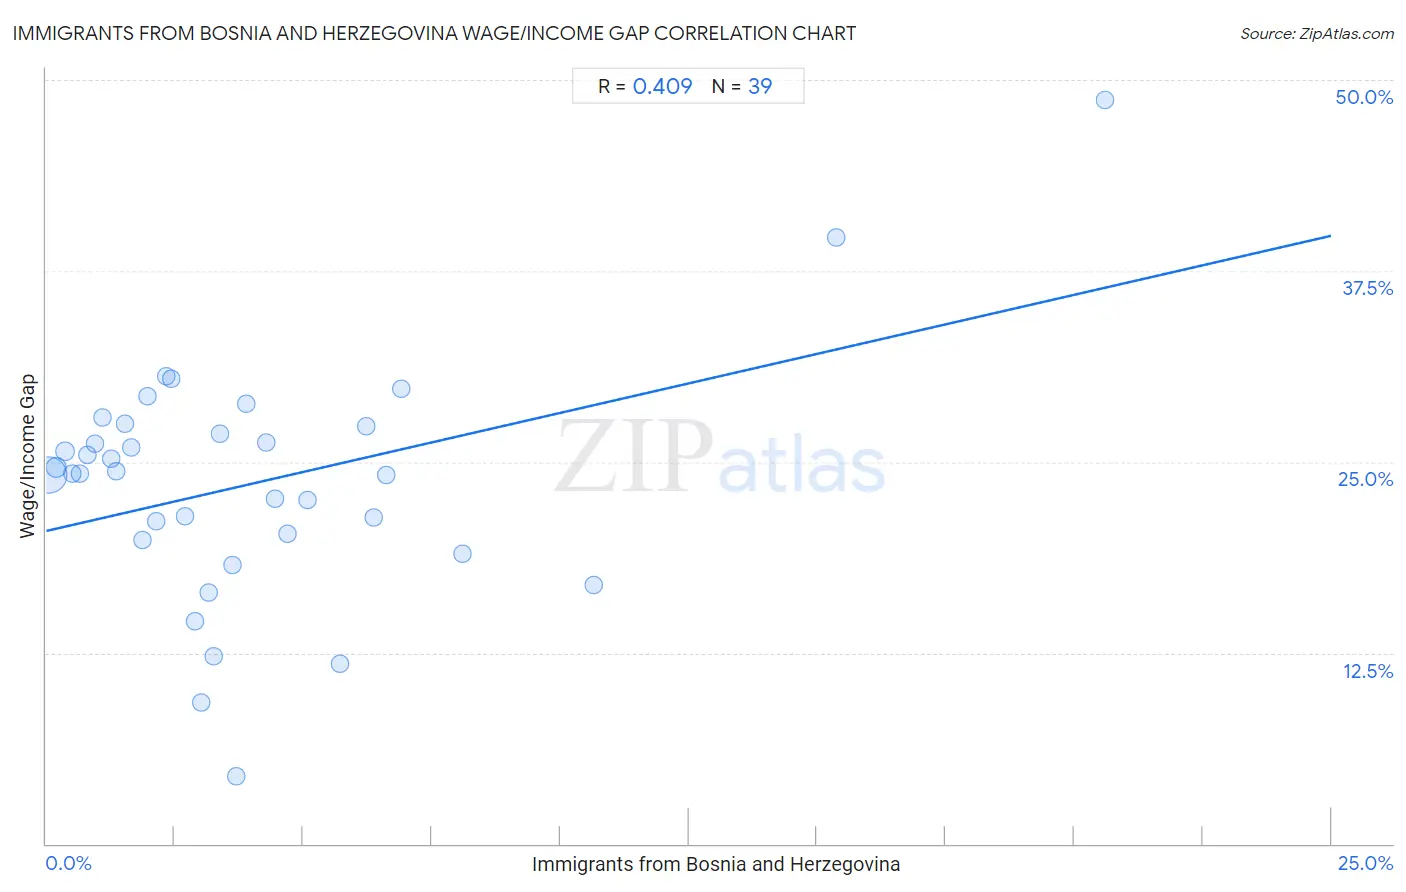
Immigrants from Bosnia and Herzegovina Wage/Income Gap Correlation Chart

The statistical analysis conducted on geographies consisting of 156,794,982 people shows a moderate positive correlation between the proportion of Immigrants from Bosnia and Herzegovina and wage/income gap percentage in the United States with a correlation coefficient (R) of 0.409 and weighted average of 24.8%. On average, for every 1% (one percent) increase in Immigrants from Bosnia and Herzegovina within a typical geography, there is an increase of 0.77% in wage/income gap percentage.
Immigrants from Bosnia and Herzegovina Wage/Income Gap
It is essential to understand that the correlation between the percentage of Immigrants from Bosnia and Herzegovina and wage/income gap percentage does not imply a direct cause-and-effect relationship. It remains uncertain whether the presence of Immigrants from Bosnia and Herzegovina influences an upward or downward trend in the level of wage/income gap percentage within an area, or if Immigrants from Bosnia and Herzegovina simply ended up residing in those areas with higher or lower levels of wage/income gap percentage due to other factors.

Demographics Similar to Immigrants from Bosnia and Herzegovina by Wage/Income Gap

In terms of wage/income gap, the demographic groups most similar to Immigrants from Bosnia and Herzegovina are Hispanic or Latino (24.9%, a difference of 0.11%), Immigrants from Nepal (24.9%, a difference of 0.14%), Hawaiian (24.9%, a difference of 0.15%), Immigrants from South Eastern Asia (24.8%, a difference of 0.16%), and Armenian (24.8%, a difference of 0.25%).
DemographicsRating | RankWage/Income Gap
Immigrants from Philippines
93.0
/100
|
#131
Exceptional
24.7%
Immigrants from Costa Rica
92.4
/100
|
#132
Exceptional
24.7%
Colombians
92.4
/100
|
#133
Exceptional
24.7%
Mexican American Indians
92.2
/100
|
#134
Exceptional
24.7%
South American Indians
92.0
/100
|
#135
Exceptional
24.7%
Armenians
91.3
/100
|
#136
Exceptional
24.8%
Immigrants from South Eastern Asia
90.9
/100
|
#137
Exceptional
24.8%
Immigrants from Bosnia and Herzegovina
90.1
/100
|
#138
Exceptional
24.8%
Hispanics or Latinos
89.5
/100
|
#139
Excellent
24.9%
Immigrants from Nepal
89.3
/100
|
#140
Excellent
24.9%
Hawaiians
89.3
/100
|
#141
Excellent
24.9%
Afghans
88.1
/100
|
#142
Excellent
24.9%
Immigrants from Uganda
88.0
/100
|
#143
Excellent
24.9%
Chippewa
86.9
/100
|
#144
Excellent
25.0%
Comanche
85.2
/100
|
#145
Excellent
25.0%

Immigrants from Bosnia and Herzegovina Wage/Income Gap Correlation Summary

MeasurementImmigrants from Bosnia and Herzegovina DataWage/Income Gap Data
Minimum0.041%4.5%
Maximum20.6%48.7%
Range20.5%44.3%
Mean4.0%23.6%
Median3.0%24.2%
Interquartile 25% (IQ1)1.4%19.9%
Interquartile 75% (IQ3)5.1%27.3%
Interquartile Range (IQR)3.7%7.4%
Standard Deviation (Sample)4.1%7.8%
Standard Deviation (Population)4.0%7.7%

Correlation Details

Immigrants from Bosnia and Herzegovina PercentileSample SizeWage/Income Gap
[
0.0%
-
0.5%
]
0.041%
124,017,58924.1%
[
0.0%
-
0.5%
]
0.20%
17,593,05424.6%
[
0.0%
-
0.5%
]
0.36%
7,609,08925.7%
[
0.5%
-
1.0%
]
0.51%
2,117,33424.2%
[
0.5%
-
1.0%
]
0.66%
1,196,77524.2%
[
0.5%
-
1.0%
]
0.80%
1,319,55825.5%
[
0.5%
-
1.0%
]
0.95%
572,00126.2%
[
1.0%
-
1.5%
]
1.10%
366,52627.9%
[
1.0%
-
1.5%
]
1.26%
520,71425.2%
[
1.0%
-
1.5%
]
1.37%
102,20424.4%
[
1.5%
-
2.0%
]
1.54%
174,10627.5%
[
1.5%
-
2.0%
]
1.66%
359,71825.9%
[
1.5%
-
2.0%
]
1.86%
106,40819.9%
[
1.5%
-
2.0%
]
1.98%
105,44529.3%
[
2.0%
-
2.5%
]
2.14%
113,78921.1%
[
2.0%
-
2.5%
]
2.34%
72,73330.6%
[
2.0%
-
2.5%
]
2.43%
47,09130.4%
[
2.5%
-
3.0%
]
2.70%
81621.4%
[
2.5%
-
3.0%
]
2.88%
19,08014.6%
[
3.0%
-
3.5%
]
3.01%
5329.3%
[
3.0%
-
3.5%
]
3.16%
12,58716.4%
[
3.0%
-
3.5%
]
3.26%
11,61912.2%
[
3.0%
-
3.5%
]
3.38%
50,34726.9%
[
3.5%
-
4.0%
]
3.62%
48,31718.2%
[
3.5%
-
4.0%
]
3.70%
6,4104.5%
[
3.5%
-
4.0%
]
3.89%
24,01428.8%
[
4.0%
-
4.5%
]
4.28%
19,92226.2%
[
4.0%
-
4.5%
]
4.45%
69,82322.6%
[
4.5%
-
5.0%
]
4.68%
2,22020.3%
[
5.0%
-
5.5%
]
5.09%
5,34522.5%
[
5.5%
-
6.0%
]
5.71%
8,75911.7%
[
6.0%
-
6.5%
]
6.23%
45,30027.3%
[
6.0%
-
6.5%
]
6.38%
4721.3%
[
6.5%
-
7.0%
]
6.62%
40,15224.1%
[
6.5%
-
7.0%
]
6.90%
32,75029.8%
[
8.0%
-
8.5%
]
8.09%
13619.0%
[
10.5%
-
11.0%
]
10.65%
69516.9%
[
15.0%
-
15.5%
]
15.36%
1,87539.7%
[
20.5%
-
21.0%
]
20.59%
10248.7%