Puget Sound Salish Wage/Income Gap

COMPARE

Puget Sound Salish
Race
Ancestry
AfghanAfricanAlaska NativeAlaskan AthabascanAlbanianAleutAlsatianAmericanApacheArabArapahoArgentineanArmenianAssyrian/Chaldean/SyriacAustralianAustrianBahamianBangladeshiBarbadianBasqueBelgianBelizeanBermudanBhutaneseBlackfeetBolivianBrazilianBritishBritish West IndianBulgarianBurmeseCajunCambodianCanadianCape VerdeanCarpatho RusynCelticCentral AmericanCentral American IndianCherokeeCheyenneChickasawChileanChineseChippewaChoctawColombianColvilleComancheCosta RicanCreeCreekCroatianCrowCubanCypriotCzechCzechoslovakianDanishDelawareDominicanDutchDutch West IndianEastern EuropeanEcuadorianEgyptianEnglishEstonianEthiopianEuropeanFijianFilipinoFinnishFrenchFrench American IndianFrench CanadianGermanGerman RussianGhanaianGreekGuamanian/ChamorroGuatemalanGuyaneseHaitianHmongHonduranHopiHoumaHungarianIcelanderIndian (Asian)IndonesianInupiatIranianIraqiIrishIroquoisIsraeliItalianJamaicanJapaneseJordanianKenyanKiowaKoreanLaotianLatvianLebaneseLiberianLithuanianLumbeeLuxembourgerMacedonianMalaysianMalteseMarshalleseMenomineeMexicanMexican American IndianMongolianMoroccanNative HawaiianNavajoNepaleseNew ZealanderNicaraguanNigerianNorthern EuropeanNorwegianOkinawanOsageOttawaPaiutePakistaniPalestinianPanamanianParaguayanPennsylvania GermanPeruvianPimaPolishPortuguesePotawatomiPuebloPuerto RicanPuget Sound SalishRomanianRussianSalvadoranSamoanScandinavianScotch-IrishScottishSeminoleSenegaleseSerbianShoshoneSierra LeoneanSiouxSlavicSlovakSloveneSomaliSouth AfricanSouth AmericanSouth American IndianSoviet UnionSpaniardSpanishSpanish AmericanSpanish American IndianSri LankanSubsaharan AfricanSudaneseSwedishSwissSyrianTaiwaneseThaiTlingit-HaidaTohono O'OdhamTonganTrinidadian and TobagonianTsimshianTurkishU.S. Virgin IslanderUgandanUkrainianUruguayanUteVenezuelanVietnameseWelshWest IndianYakamaYaquiYugoslavianYumanYup'ikZimbabwean
Immigration
NonimmigrantsImmigrantsAfghanistanAfricaAlbaniaArgentinaArmeniaAsiaAustraliaAustriaBahamasBangladeshBarbadosBelarusBelgiumBelizeBoliviaBosnia and HerzegovinaBrazilBulgariaBurma/MyanmarCabo VerdeCambodiaCameroonCanadaCaribbeanCentral AmericaChileChinaColombiaCongoCosta RicaCroatiaCubaCzechoslovakiaDenmarkDominicaDominican RepublicEastern AfricaEastern AsiaEastern EuropeEcuadorEgyptEl SalvadorEnglandEritreaEthiopiaEuropeFijiFranceGermanyGhanaGreeceGrenadaGuatemalaGuyanaHaitiHondurasHong KongHungaryIndiaIndonesiaIranIraqIrelandIsraelItalyJamaicaJapanJordanKazakhstanKenyaKoreaKuwaitLaosLatin AmericaLatviaLebanonLiberiaLithuaniaMalaysiaMexicoMicronesiaMiddle AfricaMoldovaMoroccoNepalNetherlandsNicaraguaNigeriaNorth AmericaNorth MacedoniaNorthern AfricaNorthern EuropeNorwayOceaniaPakistanPanamaPeruPhilippinesPolandPortugalRomaniaRussiaSaudi ArabiaScotlandSenegalSerbiaSierra LeoneSingaporeSomaliaSouth AfricaSouth AmericaSouth Central AsiaSouth Eastern AsiaSouthern EuropeSpainSri LankaSt. Vincent and the GrenadinesSudanSwedenSwitzerlandSyriaTaiwanThailandTrinidad and TobagoTurkeyUgandaUkraineUruguayUzbekistanVenezuelaVietnamWest IndiesWestern AfricaWestern AsiaWestern EuropeYemenZaireZimbabweAzores
Select to Compare
Race
Ancestry
AfghanAfricanAlaska NativeAlaskan AthabascanAlbanianAleutAlsatianAmericanApacheArabArapahoArgentineanArmenianAssyrian/Chaldean/SyriacAustralianAustrianBahamianBangladeshiBarbadianBasqueBelgianBelizeanBermudanBhutaneseBlackfeetBolivianBrazilianBritishBritish West IndianBulgarianBurmeseCajunCambodianCanadianCape VerdeanCarpatho RusynCelticCentral AmericanCentral American IndianCherokeeCheyenneChickasawChileanChineseChippewaChoctawColombianColvilleComancheCosta RicanCreeCreekCroatianCrowCubanCypriotCzechCzechoslovakianDanishDelawareDominicanDutchDutch West IndianEastern EuropeanEcuadorianEgyptianEnglishEstonianEthiopianEuropeanFijianFilipinoFinnishFrenchFrench American IndianFrench CanadianGermanGerman RussianGhanaianGreekGuamanian/ChamorroGuatemalanGuyaneseHaitianHmongHonduranHopiHoumaHungarianIcelanderIndian (Asian)IndonesianInupiatIranianIraqiIrishIroquoisIsraeliItalianJamaicanJapaneseJordanianKenyanKiowaKoreanLaotianLatvianLebaneseLiberianLithuanianLumbeeLuxembourgerMacedonianMalaysianMalteseMarshalleseMenomineeMexicanMexican American IndianMongolianMoroccanNative HawaiianNavajoNepaleseNew ZealanderNicaraguanNigerianNorthern EuropeanNorwegianOkinawanOsageOttawaPaiutePakistaniPalestinianPanamanianParaguayanPennsylvania GermanPeruvianPimaPolishPortuguesePotawatomiPuebloPuerto RicanRomanianRussianSalvadoranSamoanScandinavianScotch-IrishScottishSeminoleSenegaleseSerbianShoshoneSierra LeoneanSiouxSlavicSlovakSloveneSomaliSouth AfricanSouth AmericanSouth American IndianSoviet UnionSpaniardSpanishSpanish AmericanSpanish American IndianSri LankanSubsaharan AfricanSudaneseSwedishSwissSyrianTaiwaneseThaiTlingit-HaidaTohono O'OdhamTonganTrinidadian and TobagonianTsimshianTurkishU.S. Virgin IslanderUgandanUkrainianUruguayanUteVenezuelanVietnameseWelshWest IndianYakamaYaquiYugoslavianYumanYup'ikZimbabwean
Immigration
NonimmigrantsImmigrantsAfghanistanAfricaAlbaniaArgentinaArmeniaAsiaAustraliaAustriaBahamasBangladeshBarbadosBelarusBelgiumBelizeBoliviaBosnia and HerzegovinaBrazilBulgariaBurma/MyanmarCabo VerdeCambodiaCameroonCanadaCaribbeanCentral AmericaChileChinaColombiaCongoCosta RicaCroatiaCubaCzechoslovakiaDenmarkDominicaDominican RepublicEastern AfricaEastern AsiaEastern EuropeEcuadorEgyptEl SalvadorEnglandEritreaEthiopiaEuropeFijiFranceGermanyGhanaGreeceGrenadaGuatemalaGuyanaHaitiHondurasHong KongHungaryIndiaIndonesiaIranIraqIrelandIsraelItalyJamaicaJapanJordanKazakhstanKenyaKoreaKuwaitLaosLatin AmericaLatviaLebanonLiberiaLithuaniaMalaysiaMexicoMicronesiaMiddle AfricaMoldovaMoroccoNepalNetherlandsNicaraguaNigeriaNorth AmericaNorth MacedoniaNorthern AfricaNorthern EuropeNorwayOceaniaPakistanPanamaPeruPhilippinesPolandPortugalRomaniaRussiaSaudi ArabiaScotlandSenegalSerbiaSierra LeoneSingaporeSomaliaSouth AfricaSouth AmericaSouth Central AsiaSouth Eastern AsiaSouthern EuropeSpainSri LankaSt. Vincent and the GrenadinesSudanSwedenSwitzerlandSyriaTaiwanThailandTrinidad and TobagoTurkeyUgandaUkraineUruguayUzbekistanVenezuelaVietnamWest IndiesWestern AfricaWestern AsiaWestern EuropeYemenZaireZimbabweAzores
Wage/Income Gap
Income
Poverty
Unemployment
Labor Participation
Family Structure
Vehicle Availability
Education Level
Disability

Puget Sound Salish Wage/Income Gap
Good

25.3%
WAGE/INCOME GAP
73.0/ 100
METRIC RATING
159th/ 347
METRIC RANK

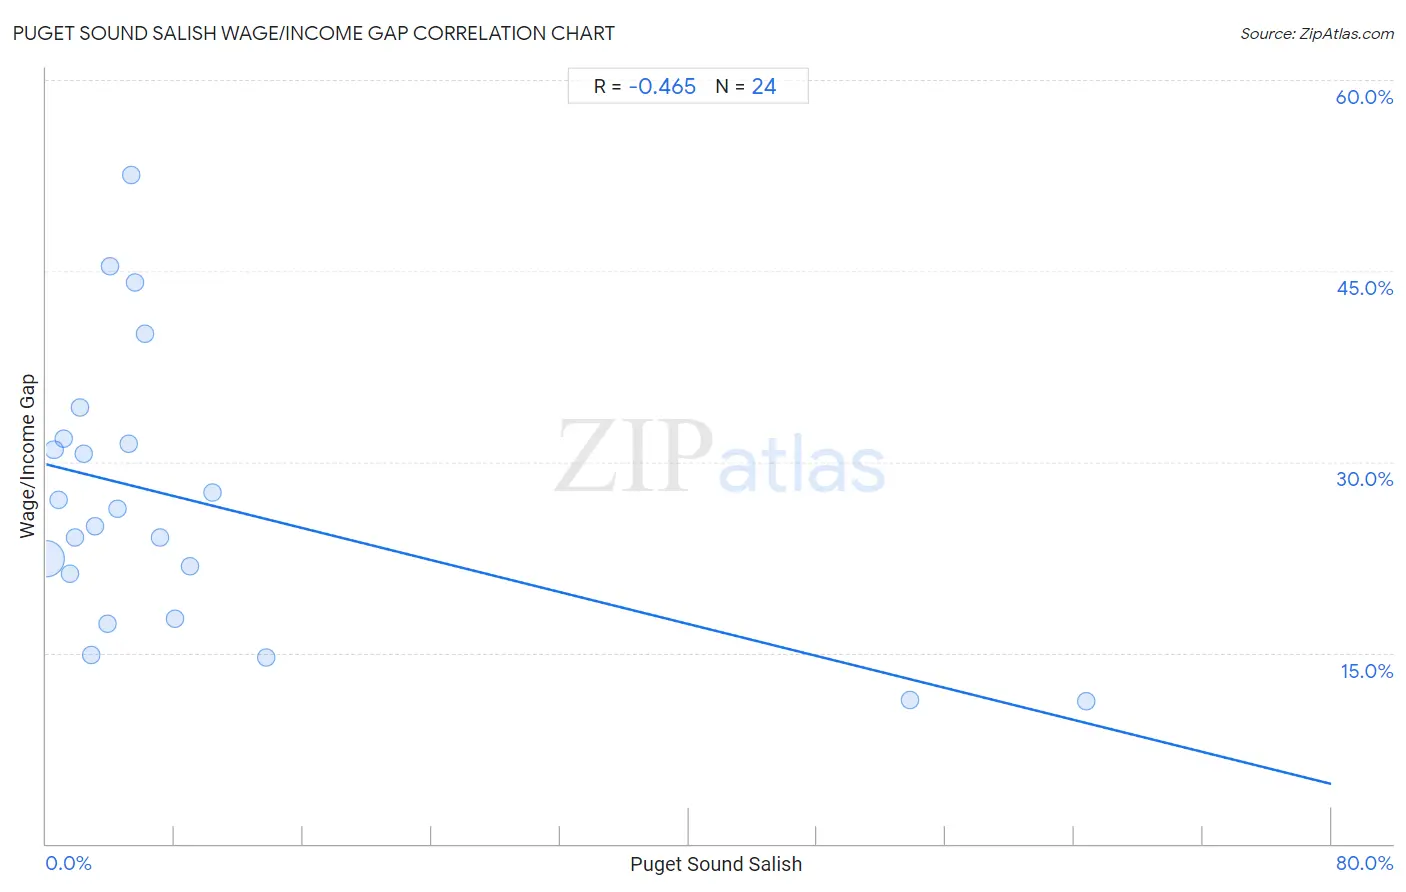
Puget Sound Salish Wage/Income Gap Correlation Chart

The statistical analysis conducted on geographies consisting of 46,141,499 people shows a moderate negative correlation between the proportion of Puget Sound Salish and wage/income gap percentage in the United States with a correlation coefficient (R) of -0.465 and weighted average of 25.3%. On average, for every 1% (one percent) increase in Puget Sound Salish within a typical geography, there is a decrease of 0.31% in wage/income gap percentage.
Puget Sound Salish Wage/Income Gap
It is essential to understand that the correlation between the percentage of Puget Sound Salish and wage/income gap percentage does not imply a direct cause-and-effect relationship. It remains uncertain whether the presence of Puget Sound Salish influences an upward or downward trend in the level of wage/income gap percentage within an area, or if Puget Sound Salish simply ended up residing in those areas with higher or lower levels of wage/income gap percentage due to other factors.

Demographics Similar to Puget Sound Salish by Wage/Income Gap

In terms of wage/income gap, the demographic groups most similar to Puget Sound Salish are French American Indian (25.4%, a difference of 0.040%), Immigrants from Zimbabwe (25.3%, a difference of 0.060%), Costa Rican (25.3%, a difference of 0.24%), Albanian (25.4%, a difference of 0.29%), and Immigrants from Mexico (25.3%, a difference of 0.30%).
DemographicsRating | RankWage/Income Gap
Uruguayans
81.3
/100
|
#152
Excellent
25.2%
Blackfeet
78.1
/100
|
#153
Good
25.2%
Immigrants from Northern Africa
78.1
/100
|
#154
Good
25.2%
Immigrants from Vietnam
77.7
/100
|
#155
Good
25.2%
Immigrants from Mexico
76.4
/100
|
#156
Good
25.3%
Costa Ricans
75.8
/100
|
#157
Good
25.3%
Immigrants from Zimbabwe
73.7
/100
|
#158
Good
25.3%
Puget Sound Salish
73.0
/100
|
#159
Good
25.3%
French American Indians
72.5
/100
|
#160
Good
25.4%
Albanians
69.4
/100
|
#161
Good
25.4%
Shoshone
69.0
/100
|
#162
Good
25.4%
Native Hawaiians
69.0
/100
|
#163
Good
25.4%
Koreans
68.6
/100
|
#164
Good
25.4%
Immigrants from Hong Kong
64.0
/100
|
#165
Good
25.5%
Immigrants from Ukraine
63.8
/100
|
#166
Good
25.5%

Puget Sound Salish Wage/Income Gap Correlation Summary

MeasurementPuget Sound Salish DataWage/Income Gap Data
Minimum0.031%11.2%
Maximum64.8%52.5%
Range64.7%41.3%
Mean9.0%27.0%
Median4.2%25.6%
Interquartile 25% (IQ1)1.9%19.5%
Interquartile 75% (IQ3)7.5%31.7%
Interquartile Range (IQR)5.6%12.2%
Standard Deviation (Sample)15.9%10.7%
Standard Deviation (Population)15.6%10.5%

Correlation Details

Puget Sound Salish PercentileSample SizeWage/Income Gap
[
0.0%
-
0.5%
]
0.031%
43,376,84022.4%
[
0.0%
-
0.5%
]
0.48%
1,432,71731.0%
[
0.5%
-
1.0%
]
0.75%
626,72527.0%
[
1.0%
-
1.5%
]
1.07%
226,15131.8%
[
1.5%
-
2.0%
]
1.51%
121,41121.2%
[
1.5%
-
2.0%
]
1.81%
132,85324.1%
[
2.0%
-
2.5%
]
2.08%
67,84934.3%
[
2.0%
-
2.5%
]
2.35%
19,73330.6%
[
2.5%
-
3.0%
]
2.81%
37,06514.9%
[
3.0%
-
3.5%
]
3.03%
44,85024.9%
[
3.5%
-
4.0%
]
3.77%
2,04017.3%
[
3.5%
-
4.0%
]
3.95%
73445.4%
[
4.0%
-
4.5%
]
4.44%
2,18526.3%
[
5.0%
-
5.5%
]
5.14%
2,04131.5%
[
5.0%
-
5.5%
]
5.29%
41652.5%
[
5.5%
-
6.0%
]
5.56%
9044.0%
[
6.0%
-
6.5%
]
6.18%
3,28440.0%
[
7.0%
-
7.5%
]
7.09%
30,26224.1%
[
8.0%
-
8.5%
]
8.00%
1,00017.7%
[
8.5%
-
9.0%
]
8.96%
3,20321.8%
[
10.0%
-
10.5%
]
10.33%
4,32927.6%
[
13.5%
-
14.0%
]
13.67%
4,48414.6%
[
53.5%
-
54.0%
]
53.79%
59311.3%
[
64.5%
-
65.0%
]
64.75%
64411.2%