Syrian Wage/Income Gap
COMPARE
Syrian
Select to Compare
Wage/Income Gap
Syrian Wage/Income Gap
27.6%
WAGE/INCOME GAP
1.4/ 100
METRIC RATING
263rd/ 347
METRIC RANK
Syrian Wage/Income Gap Correlation Chart
The statistical analysis conducted on geographies consisting of 266,238,667 people shows a slight negative correlation between the proportion of Syrians and wage/income gap percentage in the United States with a correlation coefficient (R) of -0.081 and weighted average of 27.6%. On average, for every 1% (one percent) increase in Syrians within a typical geography, there is a decrease of 0.12% in wage/income gap percentage.
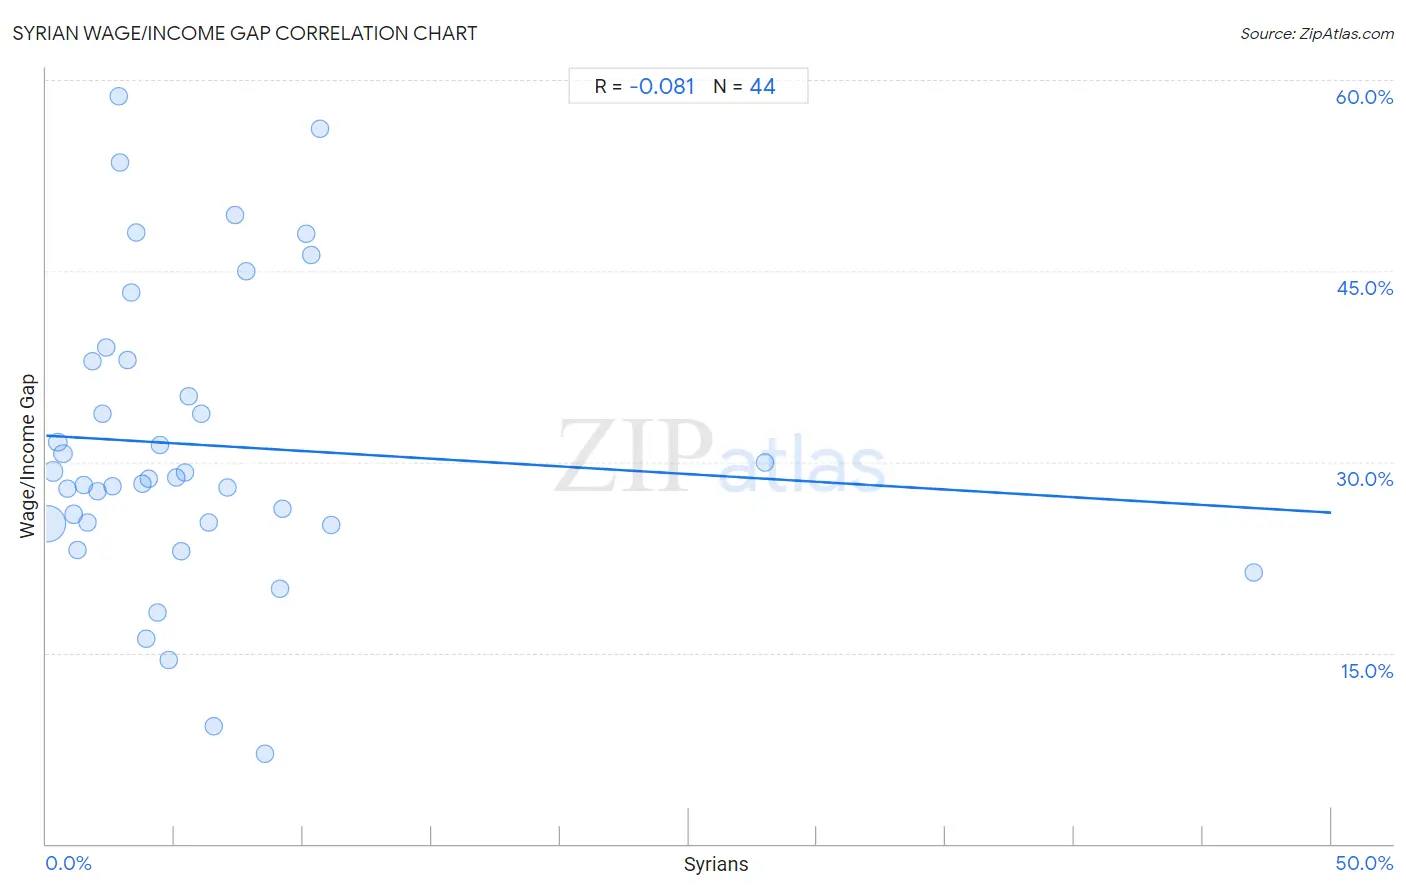
It is essential to understand that the correlation between the percentage of Syrians and wage/income gap percentage does not imply a direct cause-and-effect relationship. It remains uncertain whether the presence of Syrians influences an upward or downward trend in the level of wage/income gap percentage within an area, or if Syrians simply ended up residing in those areas with higher or lower levels of wage/income gap percentage due to other factors.
Demographics Similar to Syrians by Wage/Income Gap
In terms of wage/income gap, the demographic groups most similar to Syrians are Immigrants from Lebanon (27.5%, a difference of 0.090%), Immigrants from Germany (27.5%, a difference of 0.10%), Tongan (27.5%, a difference of 0.37%), Icelander (27.5%, a difference of 0.38%), and Immigrants from Switzerland (27.7%, a difference of 0.45%).
| Demographics | Rating | Rank | Wage/Income Gap |
| Cherokee | 1.9 /100 | #256 | Tragic 27.4% |
| Luxembourgers | 1.9 /100 | #257 | Tragic 27.4% |
| Slavs | 1.8 /100 | #258 | Tragic 27.4% |
| Icelanders | 1.8 /100 | #259 | Tragic 27.5% |
| Tongans | 1.7 /100 | #260 | Tragic 27.5% |
| Immigrants from Germany | 1.5 /100 | #261 | Tragic 27.5% |
| Immigrants from Lebanon | 1.5 /100 | #262 | Tragic 27.5% |
| Syrians | 1.4 /100 | #263 | Tragic 27.6% |
| Immigrants from Switzerland | 1.0 /100 | #264 | Tragic 27.7% |
| Serbians | 1.0 /100 | #265 | Tragic 27.7% |
| Hmong | 1.0 /100 | #266 | Tragic 27.7% |
| Turks | 1.0 /100 | #267 | Tragic 27.7% |
| New Zealanders | 1.0 /100 | #268 | Tragic 27.7% |
| Potawatomi | 0.9 /100 | #269 | Tragic 27.7% |
| Immigrants from Western Europe | 0.9 /100 | #270 | Tragic 27.8% |
Syrian Wage/Income Gap Correlation Summary
| Measurement | Syrian Data | Wage/Income Gap Data |
| Minimum | 0.066% | 7.1% |
| Maximum | 47.0% | 58.7% |
| Range | 46.9% | 51.6% |
| Mean | 6.0% | 31.3% |
| Median | 4.2% | 28.7% |
| Interquartile 25% (IQ1) | 2.1% | 25.2% |
| Interquartile 75% (IQ3) | 7.2% | 38.0% |
| Interquartile Range (IQR) | 5.1% | 12.8% |
| Standard Deviation (Sample) | 7.9% | 11.7% |
| Standard Deviation (Population) | 7.8% | 11.6% |
Correlation Details
| Syrian Percentile | Sample Size | Wage/Income Gap |
[ 0.0% - 0.5% ] 0.066% | 223,452,256 | 25.1% |
[ 0.0% - 0.5% ] 0.27% | 26,313,148 | 29.3% |
[ 0.0% - 0.5% ] 0.46% | 7,478,180 | 31.6% |
[ 0.5% - 1.0% ] 0.65% | 3,639,898 | 30.7% |
[ 0.5% - 1.0% ] 0.84% | 1,707,982 | 27.9% |
[ 1.0% - 1.5% ] 1.05% | 1,524,227 | 25.9% |
[ 1.0% - 1.5% ] 1.22% | 636,117 | 23.1% |
[ 1.0% - 1.5% ] 1.44% | 397,337 | 28.2% |
[ 1.5% - 2.0% ] 1.62% | 229,782 | 25.2% |
[ 1.5% - 2.0% ] 1.79% | 138,474 | 37.9% |
[ 2.0% - 2.5% ] 2.00% | 134,440 | 27.7% |
[ 2.0% - 2.5% ] 2.17% | 95,548 | 33.8% |
[ 2.0% - 2.5% ] 2.34% | 58,160 | 39.0% |
[ 2.5% - 3.0% ] 2.57% | 170,082 | 28.1% |
[ 2.5% - 3.0% ] 2.81% | 11,324 | 58.7% |
[ 2.5% - 3.0% ] 2.87% | 28,910 | 53.5% |
[ 3.0% - 3.5% ] 3.15% | 6,422 | 38.0% |
[ 3.0% - 3.5% ] 3.33% | 23,897 | 43.3% |
[ 3.0% - 3.5% ] 3.49% | 19,427 | 48.0% |
[ 3.5% - 4.0% ] 3.73% | 6,415 | 28.2% |
[ 3.5% - 4.0% ] 3.88% | 1,341 | 16.1% |
[ 4.0% - 4.5% ] 4.01% | 17,401 | 28.7% |
[ 4.0% - 4.5% ] 4.34% | 11,563 | 18.1% |
[ 4.0% - 4.5% ] 4.42% | 814 | 31.4% |
[ 4.5% - 5.0% ] 4.77% | 43,607 | 14.4% |
[ 5.0% - 5.5% ] 5.07% | 1,125 | 28.8% |
[ 5.0% - 5.5% ] 5.24% | 1,106 | 23.0% |
[ 5.0% - 5.5% ] 5.39% | 1,057 | 29.1% |
[ 5.5% - 6.0% ] 5.56% | 5,416 | 35.1% |
[ 6.0% - 6.5% ] 6.01% | 5,007 | 33.8% |
[ 6.0% - 6.5% ] 6.32% | 1,551 | 25.2% |
[ 6.5% - 7.0% ] 6.53% | 2,022 | 9.2% |
[ 7.0% - 7.5% ] 7.03% | 17,250 | 28.0% |
[ 7.0% - 7.5% ] 7.34% | 2,479 | 49.4% |
[ 7.5% - 8.0% ] 7.76% | 438 | 44.9% |
[ 8.0% - 8.5% ] 8.50% | 412 | 7.1% |
[ 9.0% - 9.5% ] 9.08% | 16,358 | 20.1% |
[ 9.0% - 9.5% ] 9.21% | 29,286 | 26.3% |
[ 10.0% - 10.5% ] 10.14% | 2,998 | 47.9% |
[ 10.0% - 10.5% ] 10.30% | 728 | 46.3% |
[ 10.5% - 11.0% ] 10.67% | 1,097 | 56.2% |
[ 11.0% - 11.5% ] 11.08% | 2,960 | 25.0% |
[ 27.5% - 28.0% ] 27.95% | 508 | 30.0% |
[ 47.0% - 47.5% ] 47.01% | 117 | 21.3% |