Korean Wage/Income Gap
COMPARE
Korean
Select to Compare
Wage/Income Gap
Korean Wage/Income Gap
25.4%
WAGE/INCOME GAP
68.6/ 100
METRIC RATING
164th/ 347
METRIC RANK
Korean Wage/Income Gap Correlation Chart
The statistical analysis conducted on geographies consisting of 510,260,978 people shows a slight positive correlation between the proportion of Koreans and wage/income gap percentage in the United States with a correlation coefficient (R) of 0.095 and weighted average of 25.4%. On average, for every 1% (one percent) increase in Koreans within a typical geography, there is an increase of 0.039% in wage/income gap percentage.
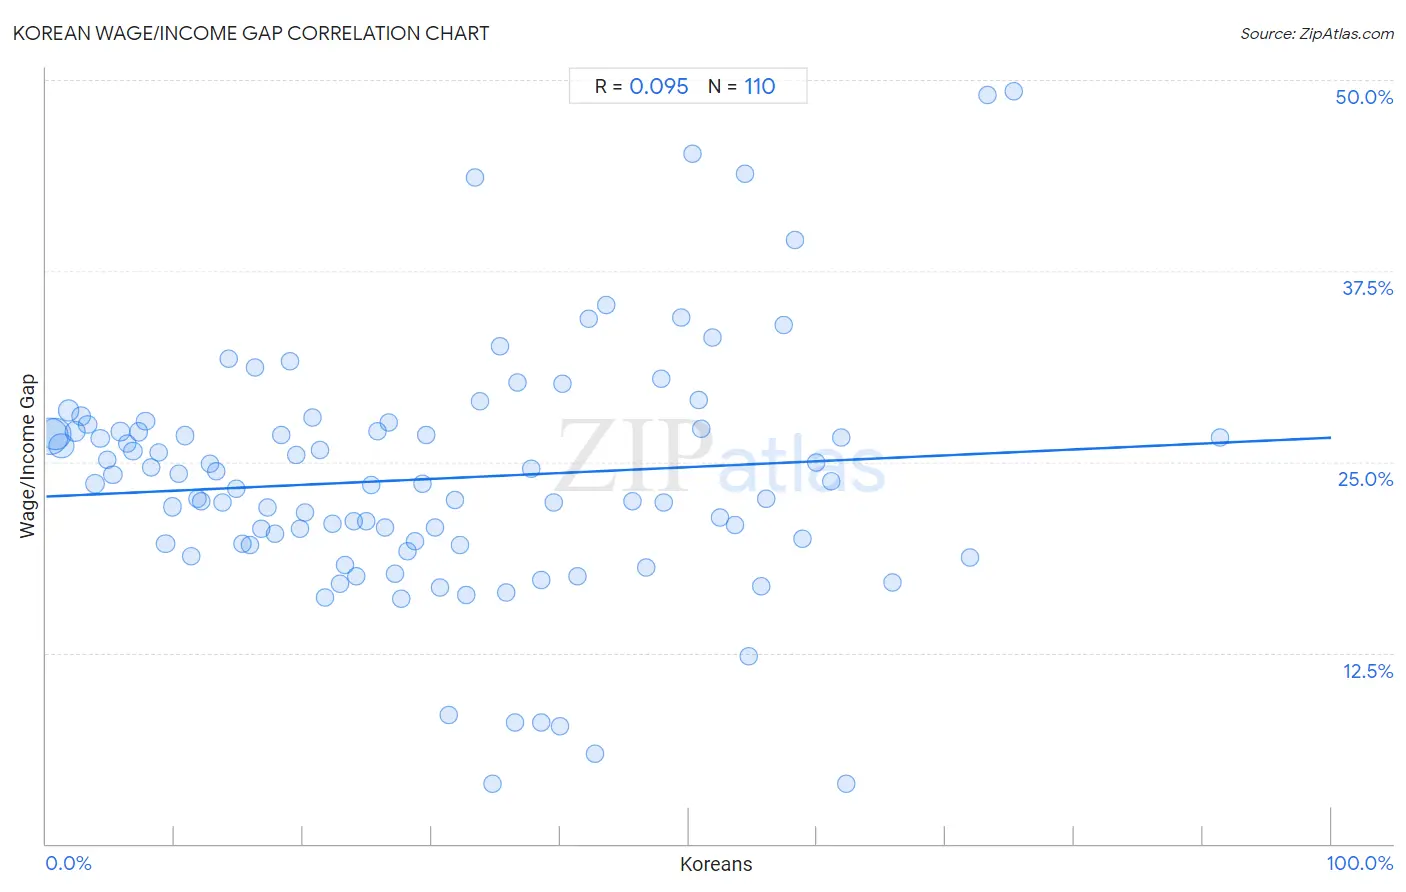
It is essential to understand that the correlation between the percentage of Koreans and wage/income gap percentage does not imply a direct cause-and-effect relationship. It remains uncertain whether the presence of Koreans influences an upward or downward trend in the level of wage/income gap percentage within an area, or if Koreans simply ended up residing in those areas with higher or lower levels of wage/income gap percentage due to other factors.
Demographics Similar to Koreans by Wage/Income Gap
In terms of wage/income gap, the demographic groups most similar to Koreans are Native Hawaiian (25.4%, a difference of 0.030%), Shoshone (25.4%, a difference of 0.040%), Albanian (25.4%, a difference of 0.060%), French American Indian (25.4%, a difference of 0.32%), and Immigrants from Hong Kong (25.5%, a difference of 0.34%).
| Demographics | Rating | Rank | Wage/Income Gap |
| Costa Ricans | 75.8 /100 | #157 | Good 25.3% |
| Immigrants from Zimbabwe | 73.7 /100 | #158 | Good 25.3% |
| Puget Sound Salish | 73.0 /100 | #159 | Good 25.3% |
| French American Indians | 72.5 /100 | #160 | Good 25.4% |
| Albanians | 69.4 /100 | #161 | Good 25.4% |
| Shoshone | 69.0 /100 | #162 | Good 25.4% |
| Native Hawaiians | 69.0 /100 | #163 | Good 25.4% |
| Koreans | 68.6 /100 | #164 | Good 25.4% |
| Immigrants from Hong Kong | 64.0 /100 | #165 | Good 25.5% |
| Immigrants from Ukraine | 63.8 /100 | #166 | Good 25.5% |
| Paiute | 62.9 /100 | #167 | Good 25.5% |
| Seminole | 62.6 /100 | #168 | Good 25.6% |
| Peruvians | 60.1 /100 | #169 | Good 25.6% |
| Immigrants from Oceania | 57.5 /100 | #170 | Average 25.6% |
| Immigrants from Greece | 56.6 /100 | #171 | Average 25.7% |
Korean Wage/Income Gap Correlation Summary
| Measurement | Korean Data | Wage/Income Gap Data |
| Minimum | 0.26% | 3.9% |
| Maximum | 91.3% | 49.3% |
| Range | 91.1% | 45.4% |
| Mean | 30.0% | 23.9% |
| Median | 27.4% | 23.6% |
| Interquartile 25% (IQ1) | 13.7% | 19.6% |
| Interquartile 75% (IQ3) | 43.6% | 27.0% |
| Interquartile Range (IQR) | 29.9% | 7.4% |
| Standard Deviation (Sample) | 19.9% | 8.1% |
| Standard Deviation (Population) | 19.8% | 8.1% |
Correlation Details
| Korean Percentile | Sample Size | Wage/Income Gap |
[ 0.0% - 0.5% ] 0.26% | 182,019,921 | 26.7% |
[ 0.5% - 1.0% ] 0.71% | 128,685,807 | 26.8% |
[ 1.0% - 1.5% ] 1.21% | 69,434,642 | 26.0% |
[ 1.5% - 2.0% ] 1.72% | 27,234,115 | 28.4% |
[ 2.0% - 2.5% ] 2.25% | 21,272,229 | 27.0% |
[ 2.5% - 3.0% ] 2.73% | 14,036,200 | 28.0% |
[ 3.0% - 3.5% ] 3.23% | 9,932,934 | 27.4% |
[ 3.5% - 4.0% ] 3.78% | 11,648,030 | 23.6% |
[ 4.0% - 4.5% ] 4.21% | 6,678,819 | 26.5% |
[ 4.5% - 5.0% ] 4.74% | 4,869,133 | 25.1% |
[ 5.0% - 5.5% ] 5.19% | 5,269,068 | 24.2% |
[ 5.5% - 6.0% ] 5.76% | 4,743,571 | 27.0% |
[ 6.0% - 6.5% ] 6.28% | 3,701,252 | 26.2% |
[ 6.5% - 7.0% ] 6.74% | 3,934,703 | 25.7% |
[ 7.0% - 7.5% ] 7.23% | 1,669,206 | 27.0% |
[ 7.5% - 8.0% ] 7.73% | 1,033,701 | 27.6% |
[ 8.0% - 8.5% ] 8.18% | 2,076,396 | 24.6% |
[ 8.5% - 9.0% ] 8.72% | 1,393,149 | 25.6% |
[ 9.0% - 9.5% ] 9.29% | 1,262,728 | 19.7% |
[ 9.5% - 10.0% ] 9.79% | 718,681 | 22.1% |
[ 10.0% - 10.5% ] 10.34% | 503,590 | 24.3% |
[ 10.5% - 11.0% ] 10.77% | 451,490 | 26.7% |
[ 11.0% - 11.5% ] 11.25% | 618,836 | 18.8% |
[ 11.5% - 12.0% ] 11.80% | 553,796 | 22.6% |
[ 12.0% - 12.5% ] 12.08% | 192,883 | 22.4% |
[ 12.5% - 13.0% ] 12.77% | 334,371 | 24.9% |
[ 13.0% - 13.5% ] 13.22% | 182,348 | 24.4% |
[ 13.5% - 14.0% ] 13.68% | 436,939 | 22.4% |
[ 14.0% - 14.5% ] 14.18% | 571,828 | 31.7% |
[ 14.5% - 15.0% ] 14.77% | 117,506 | 23.3% |
[ 15.0% - 15.5% ] 15.29% | 371,203 | 19.6% |
[ 15.5% - 16.0% ] 15.81% | 191,907 | 19.5% |
[ 16.0% - 16.5% ] 16.23% | 123,475 | 31.2% |
[ 16.5% - 17.0% ] 16.68% | 77,120 | 20.7% |
[ 17.0% - 17.5% ] 17.24% | 252,597 | 22.0% |
[ 17.5% - 18.0% ] 17.76% | 147,329 | 20.3% |
[ 18.0% - 18.5% ] 18.25% | 38,723 | 26.8% |
[ 18.5% - 19.0% ] 18.95% | 60,057 | 31.6% |
[ 19.0% - 19.5% ] 19.41% | 11,630 | 25.5% |
[ 19.5% - 20.0% ] 19.72% | 546,181 | 20.6% |
[ 20.0% - 20.5% ] 20.10% | 142,971 | 21.7% |
[ 20.5% - 21.0% ] 20.70% | 54,817 | 27.9% |
[ 21.0% - 21.5% ] 21.34% | 179,148 | 25.7% |
[ 21.5% - 22.0% ] 21.73% | 180,312 | 16.1% |
[ 22.0% - 22.5% ] 22.29% | 170,697 | 20.9% |
[ 22.5% - 23.0% ] 22.84% | 245,194 | 17.0% |
[ 23.0% - 23.5% ] 23.22% | 147,682 | 18.3% |
[ 23.5% - 24.0% ] 23.97% | 5,023 | 21.2% |
[ 24.0% - 24.5% ] 24.11% | 7,930 | 17.5% |
[ 24.5% - 25.0% ] 24.87% | 105,082 | 21.1% |
[ 25.0% - 25.5% ] 25.32% | 70,198 | 23.5% |
[ 25.5% - 26.0% ] 25.78% | 57,348 | 27.0% |
[ 26.0% - 26.5% ] 26.35% | 28,564 | 20.7% |
[ 26.5% - 27.0% ] 26.68% | 21,120 | 27.6% |
[ 27.0% - 27.5% ] 27.14% | 56,225 | 17.7% |
[ 27.5% - 28.0% ] 27.62% | 45,724 | 16.0% |
[ 28.0% - 28.5% ] 28.12% | 79,696 | 19.1% |
[ 28.5% - 29.0% ] 28.71% | 54,847 | 19.8% |
[ 29.0% - 29.5% ] 29.29% | 17,819 | 23.6% |
[ 29.5% - 30.0% ] 29.54% | 61,044 | 26.7% |
[ 30.0% - 30.5% ] 30.25% | 64,624 | 20.7% |
[ 30.5% - 31.0% ] 30.67% | 46,802 | 16.8% |
[ 31.0% - 31.5% ] 31.35% | 1,461 | 8.4% |
[ 31.5% - 32.0% ] 31.79% | 114,846 | 22.5% |
[ 32.0% - 32.5% ] 32.22% | 148,162 | 19.6% |
[ 32.5% - 33.0% ] 32.72% | 162,383 | 16.3% |
[ 33.0% - 33.5% ] 33.36% | 7,363 | 43.6% |
[ 33.5% - 34.0% ] 33.74% | 4,721 | 29.0% |
[ 34.5% - 35.0% ] 34.74% | 2,896 | 3.9% |
[ 35.0% - 35.5% ] 35.29% | 255 | 32.6% |
[ 35.5% - 36.0% ] 35.84% | 24,950 | 16.4% |
[ 36.0% - 36.5% ] 36.46% | 1,629 | 7.9% |
[ 36.5% - 37.0% ] 36.63% | 25,099 | 30.2% |
[ 37.5% - 38.0% ] 37.77% | 26,169 | 24.5% |
[ 38.0% - 38.5% ] 38.49% | 12,906 | 17.3% |
[ 38.5% - 39.0% ] 38.53% | 6,419 | 7.9% |
[ 39.0% - 39.5% ] 39.49% | 1,023 | 22.4% |
[ 39.5% - 40.0% ] 39.96% | 548 | 7.7% |
[ 40.0% - 40.5% ] 40.15% | 959 | 30.1% |
[ 41.0% - 41.5% ] 41.37% | 17,400 | 17.5% |
[ 42.0% - 42.5% ] 42.22% | 5,393 | 34.4% |
[ 42.5% - 43.0% ] 42.74% | 3,053 | 5.9% |
[ 43.5% - 44.0% ] 43.57% | 3,576 | 35.3% |
[ 45.5% - 46.0% ] 45.67% | 7,728 | 22.4% |
[ 46.5% - 47.0% ] 46.69% | 59,008 | 18.1% |
[ 47.5% - 48.0% ] 47.85% | 82,504 | 30.5% |
[ 48.0% - 48.5% ] 48.05% | 17,604 | 22.3% |
[ 49.0% - 49.5% ] 49.39% | 2,290 | 34.4% |
[ 50.0% - 50.5% ] 50.27% | 2,242 | 45.2% |
[ 50.5% - 51.0% ] 50.78% | 27,198 | 29.0% |
[ 51.0% - 51.5% ] 51.01% | 29,517 | 27.2% |
[ 51.5% - 52.0% ] 51.88% | 6,469 | 33.2% |
[ 52.0% - 52.5% ] 52.44% | 25,902 | 21.4% |
[ 53.5% - 54.0% ] 53.63% | 17,137 | 20.9% |
[ 54.0% - 54.5% ] 54.42% | 5,026 | 43.9% |
[ 54.5% - 55.0% ] 54.63% | 3,174 | 12.3% |
[ 55.5% - 56.0% ] 55.61% | 766 | 16.8% |
[ 56.0% - 56.5% ] 56.07% | 72,605 | 22.6% |
[ 57.0% - 57.5% ] 57.43% | 3,961 | 34.0% |
[ 58.0% - 58.5% ] 58.31% | 890 | 39.5% |
[ 58.5% - 59.0% ] 58.86% | 3,262 | 20.0% |
[ 59.5% - 60.0% ] 59.90% | 2,299 | 25.0% |
[ 61.0% - 61.5% ] 61.06% | 2,255 | 23.7% |
[ 61.5% - 62.0% ] 61.89% | 19,795 | 26.6% |
[ 62.0% - 62.5% ] 62.24% | 3,909 | 3.9% |
[ 65.5% - 66.0% ] 65.90% | 39,873 | 17.1% |
[ 71.5% - 72.0% ] 71.88% | 6,550 | 18.7% |
[ 73.0% - 73.5% ] 73.27% | 1,949 | 49.0% |
[ 75.0% - 75.5% ] 75.28% | 1,897 | 49.3% |
[ 91.0% - 91.5% ] 91.32% | 2,996 | 26.6% |