Immigrants from Russia Wage/Income Gap
COMPARE
Immigrants from Russia
Select to Compare
Wage/Income Gap
Immigrants from Russia Wage/Income Gap
26.4%
WAGE/INCOME GAP
19.0/ 100
METRIC RATING
204th/ 347
METRIC RANK
Immigrants from Russia Wage/Income Gap Correlation Chart
The statistical analysis conducted on geographies consisting of 347,771,483 people shows a poor negative correlation between the proportion of Immigrants from Russia and wage/income gap percentage in the United States with a correlation coefficient (R) of -0.133 and weighted average of 26.4%. On average, for every 1% (one percent) increase in Immigrants from Russia within a typical geography, there is a decrease of 0.37% in wage/income gap percentage.
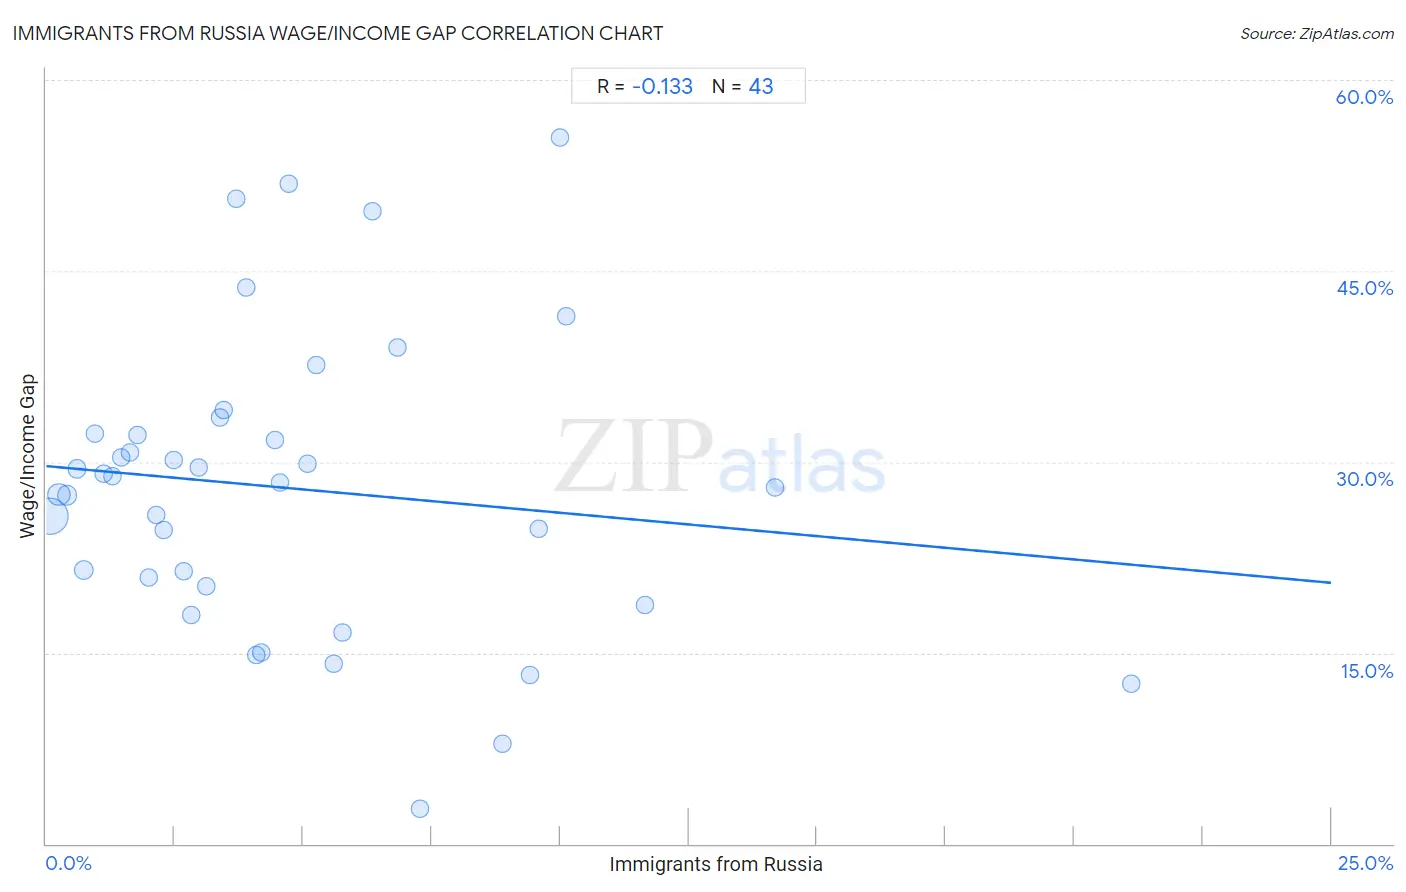
It is essential to understand that the correlation between the percentage of Immigrants from Russia and wage/income gap percentage does not imply a direct cause-and-effect relationship. It remains uncertain whether the presence of Immigrants from Russia influences an upward or downward trend in the level of wage/income gap percentage within an area, or if Immigrants from Russia simply ended up residing in those areas with higher or lower levels of wage/income gap percentage due to other factors.
Demographics Similar to Immigrants from Russia by Wage/Income Gap
In terms of wage/income gap, the demographic groups most similar to Immigrants from Russia are Laotian (26.4%, a difference of 0.020%), Immigrants from Eastern Europe (26.4%, a difference of 0.020%), Immigrants from Syria (26.4%, a difference of 0.030%), Immigrants from Southern Europe (26.4%, a difference of 0.18%), and Delaware (26.3%, a difference of 0.19%).
| Demographics | Rating | Rank | Wage/Income Gap |
| Zimbabweans | 21.6 /100 | #197 | Fair 26.3% |
| Venezuelans | 21.5 /100 | #198 | Fair 26.3% |
| Dutch West Indians | 21.0 /100 | #199 | Fair 26.3% |
| Delaware | 20.9 /100 | #200 | Fair 26.3% |
| Immigrants from Syria | 19.3 /100 | #201 | Poor 26.4% |
| Laotians | 19.2 /100 | #202 | Poor 26.4% |
| Immigrants from Eastern Europe | 19.2 /100 | #203 | Poor 26.4% |
| Immigrants from Russia | 19.0 /100 | #204 | Poor 26.4% |
| Immigrants from Southern Europe | 17.3 /100 | #205 | Poor 26.4% |
| Indians (Asian) | 16.5 /100 | #206 | Poor 26.4% |
| Immigrants from Italy | 15.8 /100 | #207 | Poor 26.5% |
| Egyptians | 12.7 /100 | #208 | Poor 26.6% |
| Immigrants from Kuwait | 12.6 /100 | #209 | Poor 26.6% |
| Arabs | 12.3 /100 | #210 | Poor 26.6% |
| Mongolians | 11.4 /100 | #211 | Poor 26.6% |
Immigrants from Russia Wage/Income Gap Correlation Summary
| Measurement | Immigrants from Russia Data | Wage/Income Gap Data |
| Minimum | 0.071% | 2.8% |
| Maximum | 21.1% | 55.5% |
| Range | 21.0% | 52.7% |
| Mean | 4.7% | 27.9% |
| Median | 3.7% | 28.3% |
| Interquartile 25% (IQ1) | 1.8% | 20.2% |
| Interquartile 75% (IQ3) | 6.3% | 32.2% |
| Interquartile Range (IQR) | 4.6% | 12.0% |
| Standard Deviation (Sample) | 4.2% | 11.6% |
| Standard Deviation (Population) | 4.2% | 11.5% |
Correlation Details
| Immigrants from Russia Percentile | Sample Size | Wage/Income Gap |
[ 0.0% - 0.5% ] 0.071% | 227,504,607 | 25.8% |
[ 0.0% - 0.5% ] 0.24% | 56,874,160 | 27.4% |
[ 0.0% - 0.5% ] 0.40% | 25,658,984 | 27.4% |
[ 0.5% - 1.0% ] 0.60% | 12,681,205 | 29.4% |
[ 0.5% - 1.0% ] 0.73% | 14,358,312 | 21.5% |
[ 0.5% - 1.0% ] 0.94% | 3,291,493 | 32.2% |
[ 1.0% - 1.5% ] 1.12% | 1,870,950 | 29.1% |
[ 1.0% - 1.5% ] 1.28% | 1,524,777 | 28.9% |
[ 1.0% - 1.5% ] 1.45% | 1,154,994 | 30.4% |
[ 1.5% - 2.0% ] 1.62% | 722,382 | 30.7% |
[ 1.5% - 2.0% ] 1.78% | 283,699 | 32.1% |
[ 1.5% - 2.0% ] 1.99% | 235,621 | 20.9% |
[ 2.0% - 2.5% ] 2.13% | 270,480 | 25.8% |
[ 2.0% - 2.5% ] 2.30% | 145,416 | 24.7% |
[ 2.0% - 2.5% ] 2.49% | 118,824 | 30.2% |
[ 2.5% - 3.0% ] 2.66% | 182,104 | 21.4% |
[ 2.5% - 3.0% ] 2.81% | 259,702 | 18.0% |
[ 2.5% - 3.0% ] 2.97% | 132,677 | 29.5% |
[ 3.0% - 3.5% ] 3.12% | 126,592 | 20.2% |
[ 3.0% - 3.5% ] 3.37% | 12,488 | 33.4% |
[ 3.0% - 3.5% ] 3.45% | 48,514 | 34.1% |
[ 3.5% - 4.0% ] 3.69% | 6,805 | 50.7% |
[ 3.5% - 4.0% ] 3.89% | 4,905 | 43.7% |
[ 4.0% - 4.5% ] 4.08% | 21,112 | 14.8% |
[ 4.0% - 4.5% ] 4.19% | 21,181 | 15.0% |
[ 4.0% - 4.5% ] 4.44% | 2,768 | 31.7% |
[ 4.5% - 5.0% ] 4.54% | 1,321 | 28.3% |
[ 4.5% - 5.0% ] 4.71% | 2,018 | 51.9% |
[ 5.0% - 5.5% ] 5.08% | 7,049 | 29.8% |
[ 5.0% - 5.5% ] 5.25% | 22,960 | 37.6% |
[ 5.5% - 6.0% ] 5.60% | 464 | 14.1% |
[ 5.5% - 6.0% ] 5.77% | 81,109 | 16.6% |
[ 6.0% - 6.5% ] 6.35% | 63 | 49.7% |
[ 6.5% - 7.0% ] 6.83% | 1,318 | 39.0% |
[ 7.0% - 7.5% ] 7.28% | 47,893 | 2.8% |
[ 8.5% - 9.0% ] 8.89% | 2,194 | 7.9% |
[ 9.0% - 9.5% ] 9.41% | 574 | 13.2% |
[ 9.5% - 10.0% ] 9.59% | 1,523 | 24.7% |
[ 10.0% - 10.5% ] 10.00% | 80 | 55.5% |
[ 10.0% - 10.5% ] 10.13% | 3,338 | 41.4% |
[ 11.5% - 12.0% ] 11.66% | 83,069 | 18.7% |
[ 14.0% - 14.5% ] 14.19% | 867 | 28.0% |
[ 21.0% - 21.5% ] 21.10% | 891 | 12.6% |