Paraguayan Wage/Income Gap
COMPARE
Paraguayan
Select to Compare
Wage/Income Gap
Paraguayan Wage/Income Gap
25.8%
WAGE/INCOME GAP
46.7/ 100
METRIC RATING
176th/ 347
METRIC RANK
Paraguayan Wage/Income Gap Correlation Chart
The statistical analysis conducted on geographies consisting of 95,100,210 people shows a poor positive correlation between the proportion of Paraguayans and wage/income gap percentage in the United States with a correlation coefficient (R) of 0.110 and weighted average of 25.8%. On average, for every 1% (one percent) increase in Paraguayans within a typical geography, there is an increase of 1.0% in wage/income gap percentage.
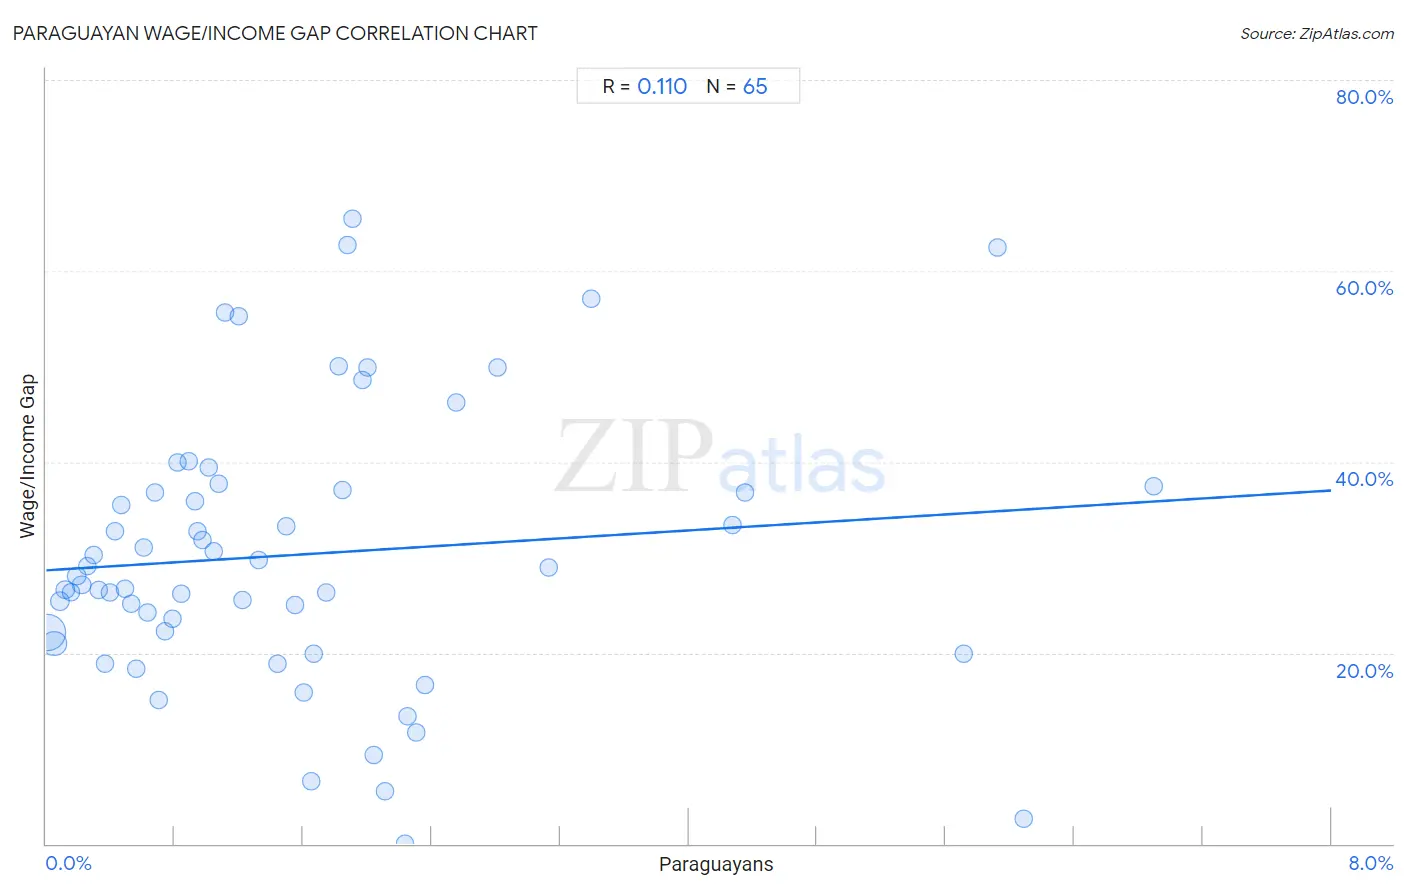
It is essential to understand that the correlation between the percentage of Paraguayans and wage/income gap percentage does not imply a direct cause-and-effect relationship. It remains uncertain whether the presence of Paraguayans influences an upward or downward trend in the level of wage/income gap percentage within an area, or if Paraguayans simply ended up residing in those areas with higher or lower levels of wage/income gap percentage due to other factors.
Demographics Similar to Paraguayans by Wage/Income Gap
In terms of wage/income gap, the demographic groups most similar to Paraguayans are Sri Lankan (25.8%, a difference of 0.020%), Cambodian (25.8%, a difference of 0.11%), Alaskan Athabascan (25.8%, a difference of 0.21%), Chinese (25.9%, a difference of 0.32%), and Immigrants from Belarus (25.7%, a difference of 0.41%).
| Demographics | Rating | Rank | Wage/Income Gap |
| Peruvians | 60.1 /100 | #169 | Good 25.6% |
| Immigrants from Oceania | 57.5 /100 | #170 | Average 25.6% |
| Immigrants from Greece | 56.6 /100 | #171 | Average 25.7% |
| Immigrants from Chile | 53.2 /100 | #172 | Average 25.7% |
| Immigrants from Belarus | 52.9 /100 | #173 | Average 25.7% |
| Alaskan Athabascans | 50.0 /100 | #174 | Average 25.8% |
| Sri Lankans | 47.0 /100 | #175 | Average 25.8% |
| Paraguayans | 46.7 /100 | #176 | Average 25.8% |
| Cambodians | 45.1 /100 | #177 | Average 25.8% |
| Chinese | 42.0 /100 | #178 | Average 25.9% |
| Samoans | 38.6 /100 | #179 | Fair 26.0% |
| Guamanians/Chamorros | 38.0 /100 | #180 | Fair 26.0% |
| Immigrants from Bolivia | 36.4 /100 | #181 | Fair 26.0% |
| Immigrants from Serbia | 35.4 /100 | #182 | Fair 26.0% |
| Immigrants from Kazakhstan | 35.2 /100 | #183 | Fair 26.0% |
Paraguayan Wage/Income Gap Correlation Summary
| Measurement | Paraguayan Data | Wage/Income Gap Data |
| Minimum | 0.0097% | 0.048% |
| Maximum | 6.9% | 65.5% |
| Range | 6.9% | 65.4% |
| Mean | 1.6% | 30.3% |
| Median | 1.1% | 28.0% |
| Interquartile 25% (IQ1) | 0.55% | 21.5% |
| Interquartile 75% (IQ3) | 2.0% | 37.3% |
| Interquartile Range (IQR) | 1.5% | 15.8% |
| Standard Deviation (Sample) | 1.5% | 14.5% |
| Standard Deviation (Population) | 1.5% | 14.3% |
Correlation Details
| Paraguayan Percentile | Sample Size | Wage/Income Gap |
[ 0.0% - 0.5% ] 0.0097% | 59,466,563 | 22.1% |
[ 0.0% - 0.5% ] 0.048% | 21,220,711 | 20.9% |
[ 0.0% - 0.5% ] 0.086% | 4,496,341 | 25.4% |
[ 0.0% - 0.5% ] 0.12% | 2,169,809 | 26.6% |
[ 0.0% - 0.5% ] 0.16% | 1,491,002 | 26.4% |
[ 0.0% - 0.5% ] 0.19% | 1,311,719 | 28.0% |
[ 0.0% - 0.5% ] 0.22% | 1,048,184 | 27.1% |
[ 0.0% - 0.5% ] 0.26% | 901,145 | 29.1% |
[ 0.0% - 0.5% ] 0.30% | 354,766 | 30.3% |
[ 0.0% - 0.5% ] 0.33% | 495,571 | 26.6% |
[ 0.0% - 0.5% ] 0.37% | 113,195 | 18.8% |
[ 0.0% - 0.5% ] 0.39% | 417,057 | 26.3% |
[ 0.0% - 0.5% ] 0.43% | 231,985 | 32.7% |
[ 0.0% - 0.5% ] 0.47% | 98,814 | 35.5% |
[ 0.0% - 0.5% ] 0.49% | 196,871 | 26.8% |
[ 0.5% - 1.0% ] 0.53% | 49,954 | 25.1% |
[ 0.5% - 1.0% ] 0.56% | 43,661 | 18.3% |
[ 0.5% - 1.0% ] 0.60% | 16,546 | 31.0% |
[ 0.5% - 1.0% ] 0.63% | 39,165 | 24.2% |
[ 0.5% - 1.0% ] 0.67% | 142,413 | 36.8% |
[ 0.5% - 1.0% ] 0.70% | 51,402 | 15.1% |
[ 0.5% - 1.0% ] 0.74% | 103,406 | 22.3% |
[ 0.5% - 1.0% ] 0.79% | 23,838 | 23.6% |
[ 0.5% - 1.0% ] 0.81% | 34,779 | 39.9% |
[ 0.5% - 1.0% ] 0.84% | 32,958 | 26.2% |
[ 0.5% - 1.0% ] 0.89% | 32,940 | 40.1% |
[ 0.5% - 1.0% ] 0.93% | 52,168 | 35.9% |
[ 0.5% - 1.0% ] 0.94% | 73,601 | 32.7% |
[ 0.5% - 1.0% ] 0.97% | 45,227 | 31.9% |
[ 1.0% - 1.5% ] 1.01% | 20,482 | 39.4% |
[ 1.0% - 1.5% ] 1.05% | 52,580 | 30.7% |
[ 1.0% - 1.5% ] 1.08% | 7,154 | 37.7% |
[ 1.0% - 1.5% ] 1.11% | 24,656 | 55.6% |
[ 1.0% - 1.5% ] 1.20% | 25,130 | 55.2% |
[ 1.0% - 1.5% ] 1.22% | 1,639 | 25.5% |
[ 1.0% - 1.5% ] 1.32% | 32,720 | 29.7% |
[ 1.0% - 1.5% ] 1.44% | 4,929 | 18.9% |
[ 1.0% - 1.5% ] 1.50% | 7,822 | 33.2% |
[ 1.5% - 2.0% ] 1.55% | 11,518 | 25.0% |
[ 1.5% - 2.0% ] 1.61% | 5,725 | 15.9% |
[ 1.5% - 2.0% ] 1.65% | 5,632 | 6.5% |
[ 1.5% - 2.0% ] 1.67% | 1,739 | 19.9% |
[ 1.5% - 2.0% ] 1.74% | 1,378 | 26.3% |
[ 1.5% - 2.0% ] 1.82% | 3,399 | 50.0% |
[ 1.5% - 2.0% ] 1.85% | 9,581 | 37.1% |
[ 1.5% - 2.0% ] 1.87% | 800 | 62.8% |
[ 1.5% - 2.0% ] 1.91% | 23,734 | 65.5% |
[ 1.5% - 2.0% ] 1.97% | 712 | 48.6% |
[ 2.0% - 2.5% ] 2.00% | 500 | 49.9% |
[ 2.0% - 2.5% ] 2.04% | 28,413 | 9.2% |
[ 2.0% - 2.5% ] 2.11% | 1,516 | 5.5% |
[ 2.0% - 2.5% ] 2.23% | 7,573 | 0.048% |
[ 2.0% - 2.5% ] 2.25% | 5,110 | 13.3% |
[ 2.0% - 2.5% ] 2.30% | 5,000 | 11.6% |
[ 2.0% - 2.5% ] 2.36% | 12,581 | 16.6% |
[ 2.5% - 3.0% ] 2.55% | 392 | 46.2% |
[ 2.5% - 3.0% ] 2.81% | 5,867 | 49.9% |
[ 3.0% - 3.5% ] 3.12% | 160 | 28.9% |
[ 3.0% - 3.5% ] 3.39% | 1,385 | 57.1% |
[ 4.0% - 4.5% ] 4.27% | 7,888 | 33.4% |
[ 4.0% - 4.5% ] 4.35% | 8,822 | 36.7% |
[ 5.5% - 6.0% ] 5.71% | 175 | 19.9% |
[ 5.5% - 6.0% ] 5.92% | 1,047 | 62.5% |
[ 6.0% - 6.5% ] 6.08% | 16,602 | 2.6% |
[ 6.5% - 7.0% ] 6.90% | 58 | 37.5% |