Immigrants from Africa Wage/Income Gap
COMPARE
Immigrants from Africa
Select to Compare
Wage/Income Gap
Immigrants from Africa Wage/Income Gap
23.2%
WAGE/INCOME GAP
99.8/ 100
METRIC RATING
83rd/ 347
METRIC RANK
Immigrants from Africa Wage/Income Gap Correlation Chart
The statistical analysis conducted on geographies consisting of 468,950,704 people shows a slight positive correlation between the proportion of Immigrants from Africa and wage/income gap percentage in the United States with a correlation coefficient (R) of 0.096 and weighted average of 23.2%. On average, for every 1% (one percent) increase in Immigrants from Africa within a typical geography, there is an increase of 0.11% in wage/income gap percentage.
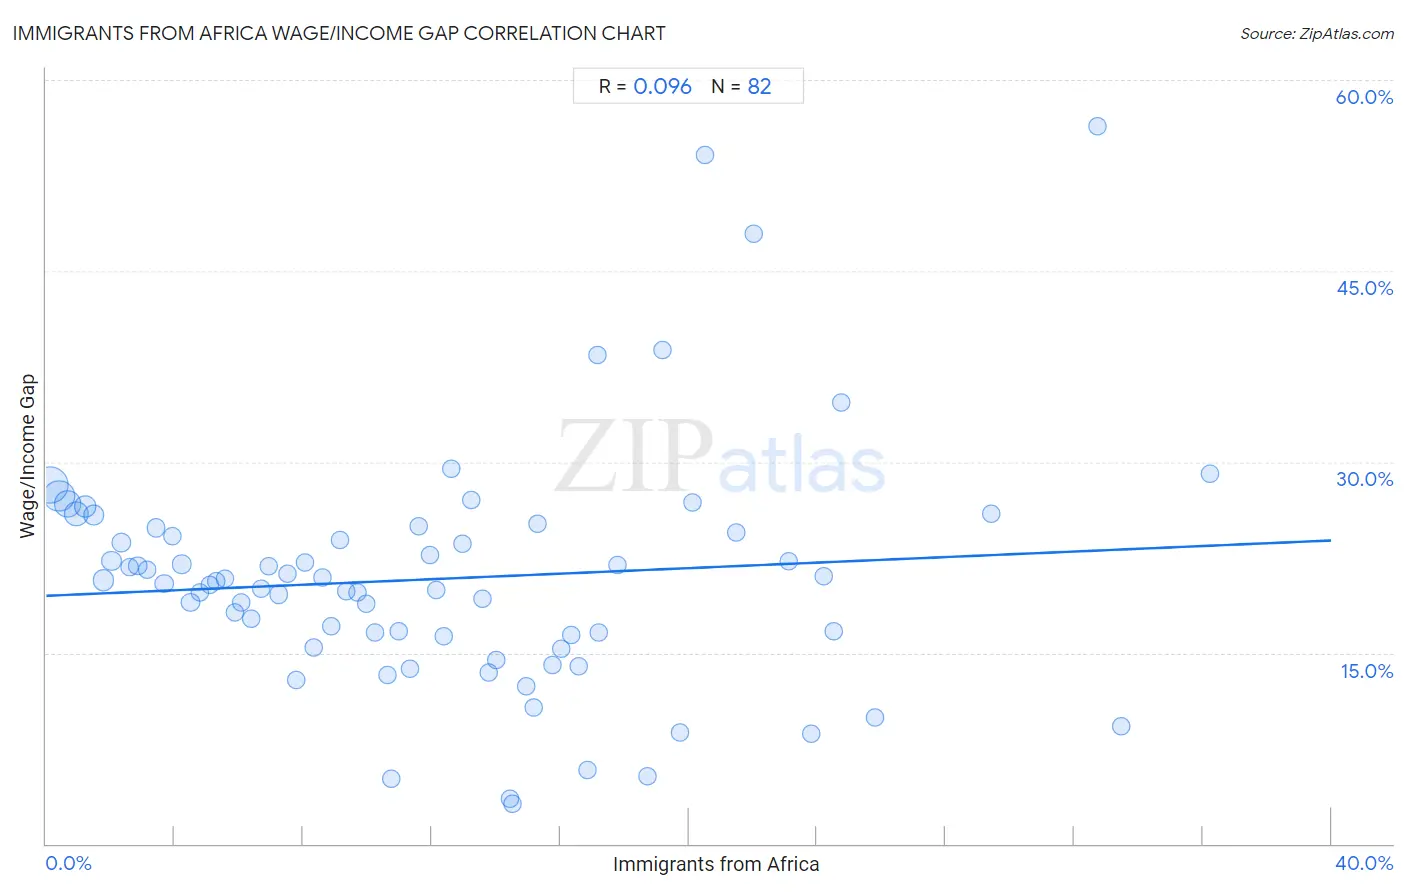
It is essential to understand that the correlation between the percentage of Immigrants from Africa and wage/income gap percentage does not imply a direct cause-and-effect relationship. It remains uncertain whether the presence of Immigrants from Africa influences an upward or downward trend in the level of wage/income gap percentage within an area, or if Immigrants from Africa simply ended up residing in those areas with higher or lower levels of wage/income gap percentage due to other factors.
Demographics Similar to Immigrants from Africa by Wage/Income Gap
In terms of wage/income gap, the demographic groups most similar to Immigrants from Africa are Bermudan (23.1%, a difference of 0.29%), Central American (23.1%, a difference of 0.29%), Cuban (23.3%, a difference of 0.37%), Immigrants from Cambodia (23.3%, a difference of 0.43%), and Cheyenne (23.3%, a difference of 0.63%).
| Demographics | Rating | Rank | Wage/Income Gap |
| Ecuadorians | 99.9 /100 | #76 | Exceptional 22.9% |
| Africans | 99.9 /100 | #77 | Exceptional 22.9% |
| Nigerians | 99.9 /100 | #78 | Exceptional 23.0% |
| Immigrants from Nicaragua | 99.9 /100 | #79 | Exceptional 23.0% |
| Salvadorans | 99.9 /100 | #80 | Exceptional 23.0% |
| Bermudans | 99.8 /100 | #81 | Exceptional 23.1% |
| Central Americans | 99.8 /100 | #82 | Exceptional 23.1% |
| Immigrants from Africa | 99.8 /100 | #83 | Exceptional 23.2% |
| Cubans | 99.7 /100 | #84 | Exceptional 23.3% |
| Immigrants from Cambodia | 99.7 /100 | #85 | Exceptional 23.3% |
| Cheyenne | 99.7 /100 | #86 | Exceptional 23.3% |
| Yuman | 99.7 /100 | #87 | Exceptional 23.3% |
| Immigrants from Panama | 99.6 /100 | #88 | Exceptional 23.4% |
| Marshallese | 99.6 /100 | #89 | Exceptional 23.4% |
| Nicaraguans | 99.6 /100 | #90 | Exceptional 23.4% |
Immigrants from Africa Wage/Income Gap Correlation Summary
| Measurement | Immigrants from Africa Data | Wage/Income Gap Data |
| Minimum | 0.13% | 3.2% |
| Maximum | 36.2% | 56.4% |
| Range | 36.1% | 53.2% |
| Mean | 12.1% | 20.8% |
| Median | 11.2% | 20.5% |
| Interquartile 25% (IQ1) | 5.6% | 16.3% |
| Interquartile 75% (IQ3) | 16.9% | 24.5% |
| Interquartile Range (IQR) | 11.3% | 8.2% |
| Standard Deviation (Sample) | 8.3% | 9.4% |
| Standard Deviation (Population) | 8.2% | 9.3% |
Correlation Details
| Immigrants from Africa Percentile | Sample Size | Wage/Income Gap |
[ 0.0% - 0.5% ] 0.13% | 137,555,540 | 28.2% |
[ 0.0% - 0.5% ] 0.40% | 95,748,301 | 27.3% |
[ 0.5% - 1.0% ] 0.67% | 62,007,036 | 26.7% |
[ 0.5% - 1.0% ] 0.94% | 44,263,189 | 26.0% |
[ 1.0% - 1.5% ] 1.21% | 24,078,947 | 26.5% |
[ 1.0% - 1.5% ] 1.50% | 17,776,545 | 25.8% |
[ 1.5% - 2.0% ] 1.78% | 23,437,751 | 20.7% |
[ 2.0% - 2.5% ] 2.04% | 14,447,440 | 22.2% |
[ 2.0% - 2.5% ] 2.32% | 7,975,170 | 23.7% |
[ 2.5% - 3.0% ] 2.59% | 5,366,546 | 21.7% |
[ 2.5% - 3.0% ] 2.85% | 5,875,017 | 21.8% |
[ 3.0% - 3.5% ] 3.14% | 4,490,946 | 21.5% |
[ 3.0% - 3.5% ] 3.41% | 3,461,743 | 24.8% |
[ 3.5% - 4.0% ] 3.67% | 2,662,787 | 20.5% |
[ 3.5% - 4.0% ] 3.92% | 1,619,540 | 24.2% |
[ 4.0% - 4.5% ] 4.22% | 1,693,378 | 22.0% |
[ 4.0% - 4.5% ] 4.49% | 1,414,931 | 18.9% |
[ 4.5% - 5.0% ] 4.78% | 1,543,649 | 19.7% |
[ 5.0% - 5.5% ] 5.09% | 2,195,470 | 20.4% |
[ 5.0% - 5.5% ] 5.30% | 1,239,186 | 20.6% |
[ 5.5% - 6.0% ] 5.56% | 757,289 | 20.8% |
[ 5.5% - 6.0% ] 5.86% | 1,501,480 | 18.2% |
[ 6.0% - 6.5% ] 6.08% | 791,592 | 19.0% |
[ 6.0% - 6.5% ] 6.40% | 584,661 | 17.7% |
[ 6.5% - 7.0% ] 6.67% | 508,858 | 20.0% |
[ 6.5% - 7.0% ] 6.92% | 550,227 | 21.8% |
[ 7.0% - 7.5% ] 7.23% | 483,371 | 19.6% |
[ 7.0% - 7.5% ] 7.50% | 236,754 | 21.2% |
[ 7.5% - 8.0% ] 7.80% | 462,979 | 12.9% |
[ 8.0% - 8.5% ] 8.05% | 249,770 | 22.1% |
[ 8.0% - 8.5% ] 8.32% | 272,744 | 15.4% |
[ 8.5% - 9.0% ] 8.61% | 224,426 | 20.9% |
[ 8.5% - 9.0% ] 8.88% | 165,627 | 17.1% |
[ 9.0% - 9.5% ] 9.13% | 272,698 | 23.9% |
[ 9.0% - 9.5% ] 9.34% | 175,960 | 19.8% |
[ 9.5% - 10.0% ] 9.71% | 413,371 | 19.7% |
[ 9.5% - 10.0% ] 9.94% | 112,394 | 18.9% |
[ 10.0% - 10.5% ] 10.23% | 200,302 | 16.6% |
[ 10.5% - 11.0% ] 10.61% | 103,682 | 13.3% |
[ 10.5% - 11.0% ] 10.74% | 31,403 | 5.1% |
[ 10.5% - 11.0% ] 10.99% | 217,713 | 16.7% |
[ 11.0% - 11.5% ] 11.34% | 126,235 | 13.8% |
[ 11.5% - 12.0% ] 11.59% | 173,608 | 25.0% |
[ 11.5% - 12.0% ] 11.94% | 47,305 | 22.7% |
[ 12.0% - 12.5% ] 12.12% | 198,710 | 20.0% |
[ 12.0% - 12.5% ] 12.39% | 85,199 | 16.3% |
[ 12.5% - 13.0% ] 12.60% | 31,679 | 29.4% |
[ 12.5% - 13.0% ] 12.94% | 214,064 | 23.6% |
[ 13.0% - 13.5% ] 13.24% | 107,661 | 27.0% |
[ 13.5% - 14.0% ] 13.57% | 152,574 | 19.3% |
[ 13.5% - 14.0% ] 13.77% | 65,413 | 13.5% |
[ 14.0% - 14.5% ] 14.03% | 54,073 | 14.4% |
[ 14.0% - 14.5% ] 14.44% | 2,348 | 3.6% |
[ 14.0% - 14.5% ] 14.50% | 29,259 | 3.2% |
[ 14.5% - 15.0% ] 14.95% | 37,693 | 12.3% |
[ 15.0% - 15.5% ] 15.19% | 29,516 | 10.7% |
[ 15.0% - 15.5% ] 15.28% | 28,172 | 25.1% |
[ 15.5% - 16.0% ] 15.75% | 16,076 | 14.0% |
[ 16.0% - 16.5% ] 16.03% | 36,105 | 15.3% |
[ 16.0% - 16.5% ] 16.33% | 72,959 | 16.4% |
[ 16.5% - 17.0% ] 16.59% | 31,151 | 13.9% |
[ 16.5% - 17.0% ] 16.87% | 25,987 | 5.8% |
[ 17.0% - 17.5% ] 17.14% | 3,588 | 38.4% |
[ 17.0% - 17.5% ] 17.20% | 56,607 | 16.6% |
[ 17.5% - 18.0% ] 17.78% | 27,919 | 21.9% |
[ 18.5% - 19.0% ] 18.73% | 19,999 | 5.3% |
[ 19.0% - 19.5% ] 19.16% | 981 | 38.8% |
[ 19.5% - 20.0% ] 19.71% | 13,580 | 8.7% |
[ 20.0% - 20.5% ] 20.12% | 825 | 26.8% |
[ 20.0% - 20.5% ] 20.49% | 493 | 54.1% |
[ 21.0% - 21.5% ] 21.47% | 8,290 | 24.5% |
[ 22.0% - 22.5% ] 22.01% | 309 | 47.9% |
[ 23.0% - 23.5% ] 23.11% | 7,703 | 22.2% |
[ 23.5% - 24.0% ] 23.82% | 14,553 | 8.7% |
[ 24.0% - 24.5% ] 24.22% | 2,849 | 21.0% |
[ 24.5% - 25.0% ] 24.52% | 4,572 | 16.7% |
[ 24.5% - 25.0% ] 24.74% | 97 | 34.7% |
[ 25.5% - 26.0% ] 25.78% | 26,684 | 9.9% |
[ 29.0% - 29.5% ] 29.42% | 15,489 | 25.9% |
[ 32.5% - 33.0% ] 32.71% | 587 | 56.4% |
[ 33.0% - 33.5% ] 33.47% | 487 | 9.2% |
[ 36.0% - 36.5% ] 36.22% | 8,892 | 29.1% |