Yaqui Wage/Income Gap
COMPARE
Yaqui
Select to Compare
Wage/Income Gap
Yaqui Wage/Income Gap
24.0%
WAGE/INCOME GAP
98.4/ 100
METRIC RATING
107th/ 347
METRIC RANK
Yaqui Wage/Income Gap Correlation Chart
The statistical analysis conducted on geographies consisting of 107,689,967 people shows a weak positive correlation between the proportion of Yaqui and wage/income gap percentage in the United States with a correlation coefficient (R) of 0.277 and weighted average of 24.0%. On average, for every 1% (one percent) increase in Yaqui within a typical geography, there is an increase of 0.85% in wage/income gap percentage.
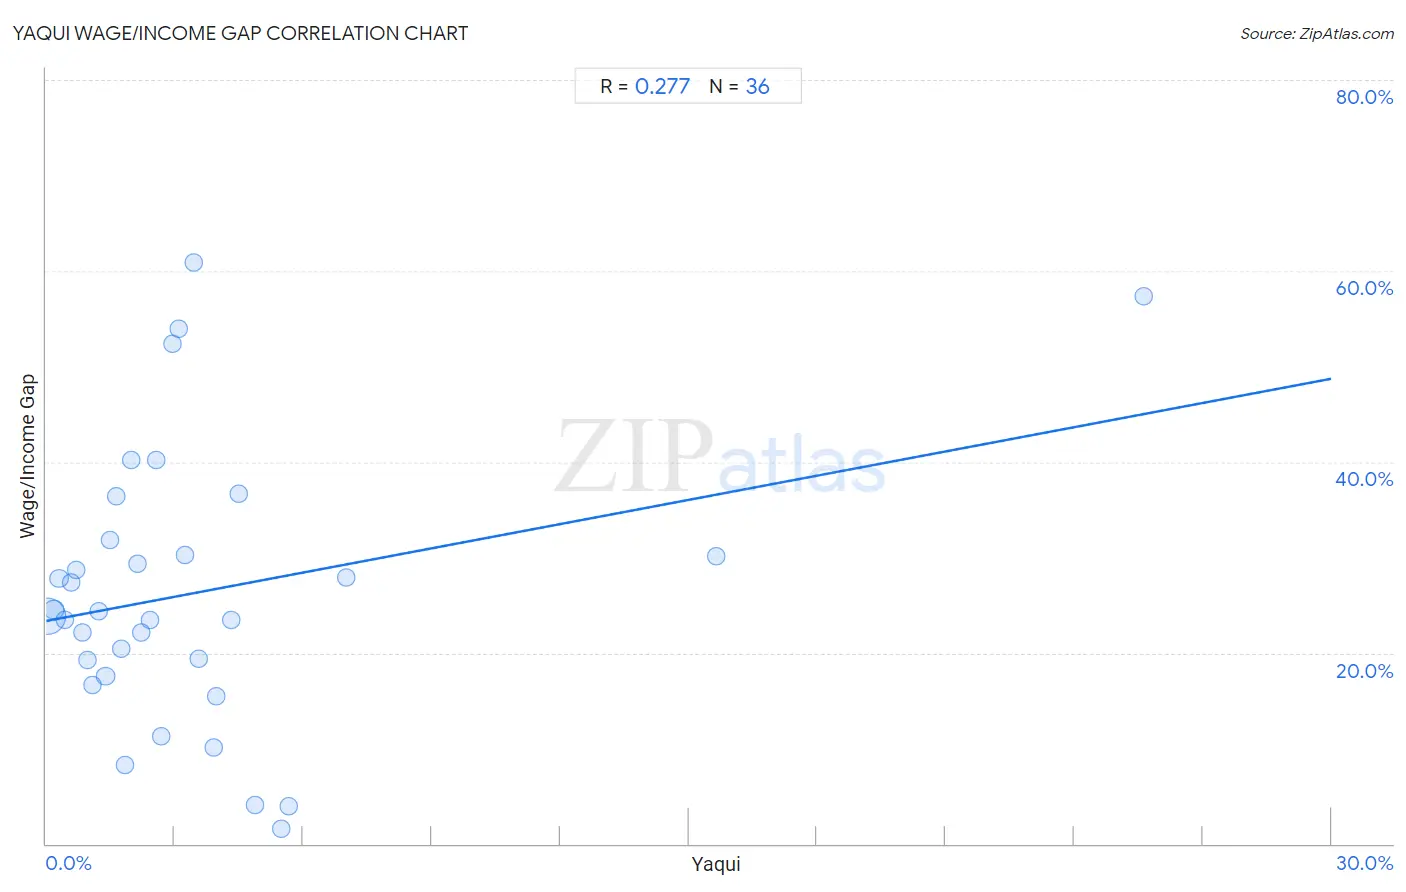
It is essential to understand that the correlation between the percentage of Yaqui and wage/income gap percentage does not imply a direct cause-and-effect relationship. It remains uncertain whether the presence of Yaqui influences an upward or downward trend in the level of wage/income gap percentage within an area, or if Yaqui simply ended up residing in those areas with higher or lower levels of wage/income gap percentage due to other factors.
Demographics Similar to Yaqui by Wage/Income Gap
In terms of wage/income gap, the demographic groups most similar to Yaqui are Immigrants from Albania (24.0%, a difference of 0.0%), Ugandan (24.1%, a difference of 0.060%), Immigrants from Morocco (24.1%, a difference of 0.28%), Sudanese (24.0%, a difference of 0.30%), and Moroccan (24.0%, a difference of 0.31%).
| Demographics | Rating | Rank | Wage/Income Gap |
| Yakama | 99.2 /100 | #100 | Exceptional 23.7% |
| Japanese | 99.1 /100 | #101 | Exceptional 23.8% |
| Immigrants from Laos | 99.0 /100 | #102 | Exceptional 23.8% |
| Tsimshian | 98.9 /100 | #103 | Exceptional 23.9% |
| Tlingit-Haida | 98.7 /100 | #104 | Exceptional 24.0% |
| Moroccans | 98.6 /100 | #105 | Exceptional 24.0% |
| Sudanese | 98.6 /100 | #106 | Exceptional 24.0% |
| Yaqui | 98.4 /100 | #107 | Exceptional 24.0% |
| Immigrants from Albania | 98.4 /100 | #108 | Exceptional 24.0% |
| Ugandans | 98.3 /100 | #109 | Exceptional 24.1% |
| Immigrants from Morocco | 98.1 /100 | #110 | Exceptional 24.1% |
| Soviet Union | 97.6 /100 | #111 | Exceptional 24.2% |
| Immigrants from Colombia | 97.0 /100 | #112 | Exceptional 24.3% |
| Sioux | 96.9 /100 | #113 | Exceptional 24.3% |
| Panamanians | 96.5 /100 | #114 | Exceptional 24.4% |
Yaqui Wage/Income Gap Correlation Summary
| Measurement | Yaqui Data | Wage/Income Gap Data |
| Minimum | 0.033% | 1.6% |
| Maximum | 25.6% | 60.9% |
| Range | 25.6% | 59.3% |
| Mean | 3.5% | 26.3% |
| Median | 2.3% | 24.0% |
| Interquartile 25% (IQ1) | 1.1% | 18.4% |
| Interquartile 75% (IQ3) | 3.9% | 31.0% |
| Interquartile Range (IQR) | 2.8% | 12.6% |
| Standard Deviation (Sample) | 4.7% | 14.3% |
| Standard Deviation (Population) | 4.6% | 14.1% |
Correlation Details
| Yaqui Percentile | Sample Size | Wage/Income Gap |
[ 0.0% - 0.5% ] 0.033% | 90,905,701 | 23.8% |
[ 0.0% - 0.5% ] 0.18% | 9,593,687 | 24.5% |
[ 0.0% - 0.5% ] 0.30% | 2,980,842 | 27.8% |
[ 0.0% - 0.5% ] 0.44% | 1,582,435 | 23.5% |
[ 0.5% - 1.0% ] 0.58% | 436,572 | 27.4% |
[ 0.5% - 1.0% ] 0.69% | 356,826 | 28.7% |
[ 0.5% - 1.0% ] 0.83% | 297,826 | 22.1% |
[ 0.5% - 1.0% ] 0.96% | 222,220 | 19.3% |
[ 1.0% - 1.5% ] 1.08% | 79,632 | 16.6% |
[ 1.0% - 1.5% ] 1.22% | 161,683 | 24.3% |
[ 1.0% - 1.5% ] 1.39% | 585,535 | 17.5% |
[ 1.0% - 1.5% ] 1.48% | 24,976 | 31.8% |
[ 1.5% - 2.0% ] 1.65% | 6,066 | 36.3% |
[ 1.5% - 2.0% ] 1.76% | 16,937 | 20.5% |
[ 1.5% - 2.0% ] 1.83% | 59,733 | 8.2% |
[ 1.5% - 2.0% ] 1.97% | 8,016 | 40.2% |
[ 2.0% - 2.5% ] 2.13% | 23,559 | 29.3% |
[ 2.0% - 2.5% ] 2.21% | 96,191 | 22.1% |
[ 2.0% - 2.5% ] 2.41% | 35,921 | 23.4% |
[ 2.5% - 3.0% ] 2.56% | 626 | 40.2% |
[ 2.5% - 3.0% ] 2.68% | 1,454 | 11.3% |
[ 2.5% - 3.0% ] 2.94% | 6,571 | 52.4% |
[ 3.0% - 3.5% ] 3.08% | 6,260 | 54.0% |
[ 3.0% - 3.5% ] 3.23% | 36,828 | 30.3% |
[ 3.0% - 3.5% ] 3.43% | 379 | 60.9% |
[ 3.5% - 4.0% ] 3.55% | 45,881 | 19.4% |
[ 3.5% - 4.0% ] 3.90% | 15,909 | 10.1% |
[ 3.5% - 4.0% ] 3.98% | 57,897 | 15.4% |
[ 4.0% - 4.5% ] 4.31% | 4,642 | 23.4% |
[ 4.0% - 4.5% ] 4.50% | 1,845 | 36.6% |
[ 4.5% - 5.0% ] 4.87% | 1,067 | 4.1% |
[ 5.0% - 5.5% ] 5.49% | 5,100 | 1.6% |
[ 5.5% - 6.0% ] 5.65% | 4,337 | 3.9% |
[ 7.0% - 7.5% ] 7.00% | 457 | 27.9% |
[ 15.5% - 16.0% ] 15.65% | 21,021 | 30.1% |
[ 25.5% - 26.0% ] 25.62% | 5,335 | 57.3% |