Immigrants from Hong Kong Wage/Income Gap
COMPARE
Immigrants from Hong Kong
Select to Compare
Wage/Income Gap
Immigrants from Hong Kong Wage/Income Gap
25.5%
WAGE/INCOME GAP
64.0/ 100
METRIC RATING
165th/ 347
METRIC RANK
Immigrants from Hong Kong Wage/Income Gap Correlation Chart
The statistical analysis conducted on geographies consisting of 253,936,651 people shows a poor negative correlation between the proportion of Immigrants from Hong Kong and wage/income gap percentage in the United States with a correlation coefficient (R) of -0.153 and weighted average of 25.5%. On average, for every 1% (one percent) increase in Immigrants from Hong Kong within a typical geography, there is a decrease of 1.0% in wage/income gap percentage.
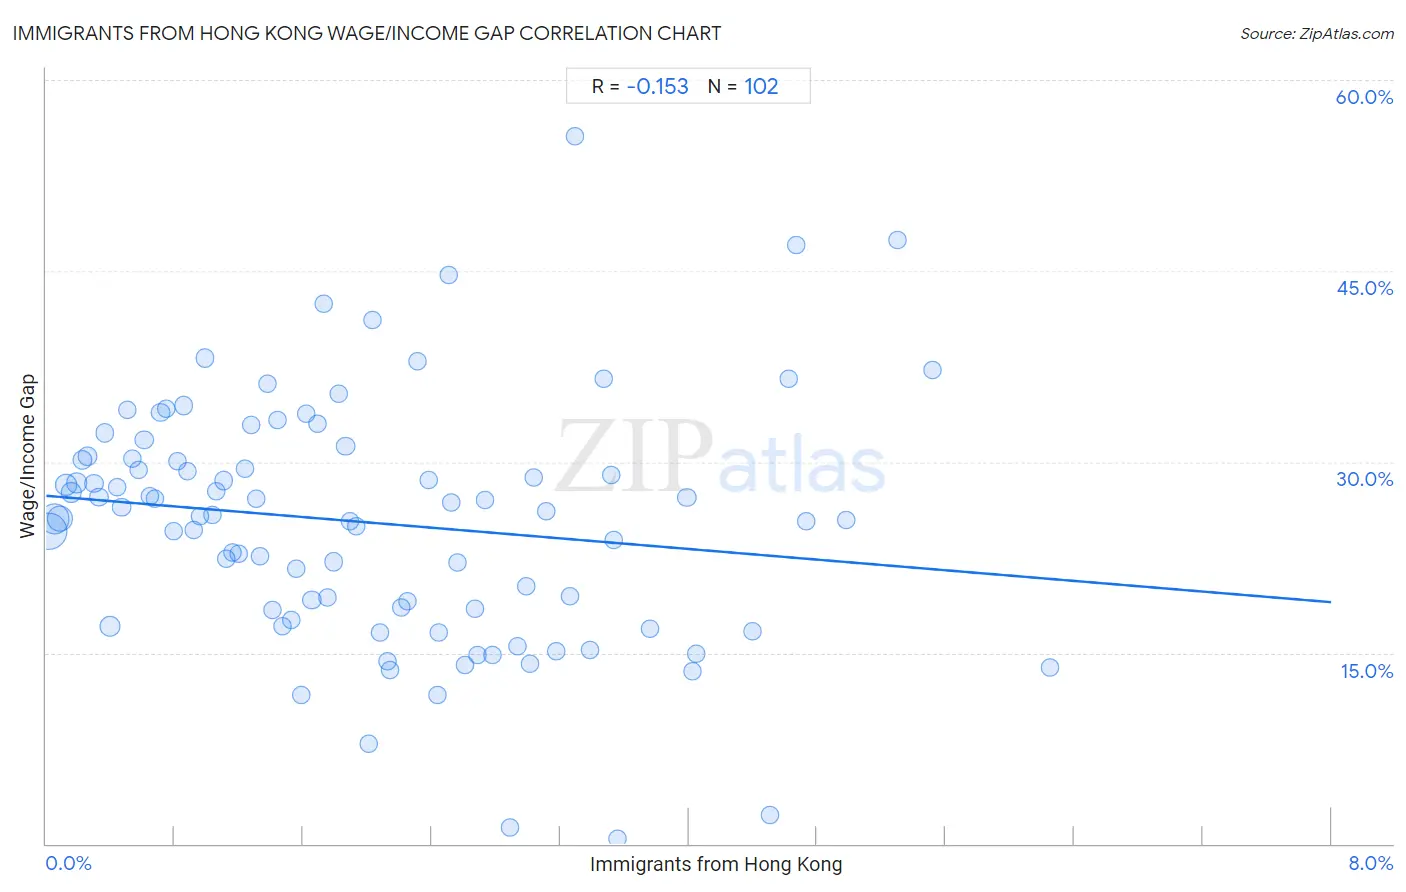
It is essential to understand that the correlation between the percentage of Immigrants from Hong Kong and wage/income gap percentage does not imply a direct cause-and-effect relationship. It remains uncertain whether the presence of Immigrants from Hong Kong influences an upward or downward trend in the level of wage/income gap percentage within an area, or if Immigrants from Hong Kong simply ended up residing in those areas with higher or lower levels of wage/income gap percentage due to other factors.
Demographics Similar to Immigrants from Hong Kong by Wage/Income Gap
In terms of wage/income gap, the demographic groups most similar to Immigrants from Hong Kong are Immigrants from Ukraine (25.5%, a difference of 0.010%), Paiute (25.5%, a difference of 0.070%), Seminole (25.6%, a difference of 0.090%), Peruvian (25.6%, a difference of 0.27%), and Korean (25.4%, a difference of 0.34%).
| Demographics | Rating | Rank | Wage/Income Gap |
| Immigrants from Zimbabwe | 73.7 /100 | #158 | Good 25.3% |
| Puget Sound Salish | 73.0 /100 | #159 | Good 25.3% |
| French American Indians | 72.5 /100 | #160 | Good 25.4% |
| Albanians | 69.4 /100 | #161 | Good 25.4% |
| Shoshone | 69.0 /100 | #162 | Good 25.4% |
| Native Hawaiians | 69.0 /100 | #163 | Good 25.4% |
| Koreans | 68.6 /100 | #164 | Good 25.4% |
| Immigrants from Hong Kong | 64.0 /100 | #165 | Good 25.5% |
| Immigrants from Ukraine | 63.8 /100 | #166 | Good 25.5% |
| Paiute | 62.9 /100 | #167 | Good 25.5% |
| Seminole | 62.6 /100 | #168 | Good 25.6% |
| Peruvians | 60.1 /100 | #169 | Good 25.6% |
| Immigrants from Oceania | 57.5 /100 | #170 | Average 25.6% |
| Immigrants from Greece | 56.6 /100 | #171 | Average 25.7% |
| Immigrants from Chile | 53.2 /100 | #172 | Average 25.7% |
Immigrants from Hong Kong Wage/Income Gap Correlation Summary
| Measurement | Immigrants from Hong Kong Data | Wage/Income Gap Data |
| Minimum | 0.018% | 0.36% |
| Maximum | 6.2% | 55.6% |
| Range | 6.2% | 55.2% |
| Mean | 2.0% | 25.2% |
| Median | 1.8% | 25.8% |
| Interquartile 25% (IQ1) | 0.88% | 18.3% |
| Interquartile 75% (IQ3) | 2.9% | 30.3% |
| Interquartile Range (IQR) | 2.1% | 11.9% |
| Standard Deviation (Sample) | 1.4% | 9.6% |
| Standard Deviation (Population) | 1.4% | 9.6% |
Correlation Details
| Immigrants from Hong Kong Percentile | Sample Size | Wage/Income Gap |
[ 0.0% - 0.5% ] 0.018% | 79,880,814 | 24.5% |
[ 0.0% - 0.5% ] 0.051% | 52,292,396 | 25.5% |
[ 0.0% - 0.5% ] 0.088% | 32,785,076 | 25.5% |
[ 0.0% - 0.5% ] 0.12% | 17,367,895 | 28.2% |
[ 0.0% - 0.5% ] 0.16% | 10,585,025 | 27.6% |
[ 0.0% - 0.5% ] 0.19% | 7,282,495 | 28.4% |
[ 0.0% - 0.5% ] 0.23% | 6,058,390 | 30.2% |
[ 0.0% - 0.5% ] 0.26% | 5,148,786 | 30.5% |
[ 0.0% - 0.5% ] 0.30% | 2,962,019 | 28.3% |
[ 0.0% - 0.5% ] 0.33% | 3,650,408 | 27.2% |
[ 0.0% - 0.5% ] 0.37% | 1,979,755 | 32.3% |
[ 0.0% - 0.5% ] 0.40% | 10,465,848 | 17.1% |
[ 0.0% - 0.5% ] 0.44% | 3,020,347 | 28.0% |
[ 0.0% - 0.5% ] 0.47% | 2,183,133 | 26.5% |
[ 0.5% - 1.0% ] 0.50% | 1,377,862 | 34.1% |
[ 0.5% - 1.0% ] 0.54% | 915,839 | 30.3% |
[ 0.5% - 1.0% ] 0.57% | 976,743 | 29.4% |
[ 0.5% - 1.0% ] 0.61% | 1,200,467 | 31.7% |
[ 0.5% - 1.0% ] 0.65% | 1,080,404 | 27.3% |
[ 0.5% - 1.0% ] 0.68% | 741,865 | 27.1% |
[ 0.5% - 1.0% ] 0.71% | 589,483 | 33.9% |
[ 0.5% - 1.0% ] 0.75% | 287,240 | 34.2% |
[ 0.5% - 1.0% ] 0.79% | 740,407 | 24.6% |
[ 0.5% - 1.0% ] 0.82% | 466,809 | 30.0% |
[ 0.5% - 1.0% ] 0.86% | 439,766 | 34.4% |
[ 0.5% - 1.0% ] 0.88% | 367,951 | 29.2% |
[ 0.5% - 1.0% ] 0.91% | 191,191 | 24.7% |
[ 0.5% - 1.0% ] 0.96% | 251,057 | 25.7% |
[ 0.5% - 1.0% ] 0.99% | 302,609 | 38.2% |
[ 1.0% - 1.5% ] 1.03% | 417,451 | 25.8% |
[ 1.0% - 1.5% ] 1.06% | 217,562 | 27.7% |
[ 1.0% - 1.5% ] 1.10% | 601,687 | 28.5% |
[ 1.0% - 1.5% ] 1.12% | 115,218 | 22.4% |
[ 1.0% - 1.5% ] 1.16% | 267,682 | 22.9% |
[ 1.0% - 1.5% ] 1.20% | 309,358 | 22.8% |
[ 1.0% - 1.5% ] 1.23% | 292,806 | 29.5% |
[ 1.0% - 1.5% ] 1.28% | 455,873 | 32.9% |
[ 1.0% - 1.5% ] 1.31% | 111,609 | 27.1% |
[ 1.0% - 1.5% ] 1.33% | 123,011 | 22.6% |
[ 1.0% - 1.5% ] 1.38% | 217,322 | 36.1% |
[ 1.0% - 1.5% ] 1.41% | 213,769 | 18.3% |
[ 1.0% - 1.5% ] 1.44% | 165,074 | 33.3% |
[ 1.0% - 1.5% ] 1.47% | 89,020 | 17.1% |
[ 1.5% - 2.0% ] 1.53% | 188,777 | 17.6% |
[ 1.5% - 2.0% ] 1.55% | 194,808 | 21.6% |
[ 1.5% - 2.0% ] 1.59% | 104,589 | 11.7% |
[ 1.5% - 2.0% ] 1.62% | 103,875 | 33.8% |
[ 1.5% - 2.0% ] 1.65% | 142,957 | 19.2% |
[ 1.5% - 2.0% ] 1.69% | 212,977 | 33.0% |
[ 1.5% - 2.0% ] 1.73% | 69,708 | 42.5% |
[ 1.5% - 2.0% ] 1.75% | 198,364 | 19.4% |
[ 1.5% - 2.0% ] 1.79% | 938,118 | 22.1% |
[ 1.5% - 2.0% ] 1.82% | 134,662 | 35.3% |
[ 1.5% - 2.0% ] 1.86% | 194,065 | 31.2% |
[ 1.5% - 2.0% ] 1.89% | 199,304 | 25.4% |
[ 1.5% - 2.0% ] 1.93% | 58,705 | 24.9% |
[ 2.0% - 2.5% ] 2.01% | 61,312 | 7.8% |
[ 2.0% - 2.5% ] 2.03% | 4,336 | 41.2% |
[ 2.0% - 2.5% ] 2.08% | 67,785 | 16.6% |
[ 2.0% - 2.5% ] 2.12% | 70,245 | 14.3% |
[ 2.0% - 2.5% ] 2.14% | 104,605 | 13.7% |
[ 2.0% - 2.5% ] 2.21% | 634 | 18.6% |
[ 2.0% - 2.5% ] 2.25% | 195,750 | 19.1% |
[ 2.0% - 2.5% ] 2.31% | 10,292 | 37.9% |
[ 2.0% - 2.5% ] 2.38% | 121,317 | 28.6% |
[ 2.0% - 2.5% ] 2.43% | 40,451 | 11.6% |
[ 2.0% - 2.5% ] 2.45% | 43,851 | 16.6% |
[ 2.5% - 3.0% ] 2.51% | 6,145 | 44.7% |
[ 2.5% - 3.0% ] 2.52% | 79,589 | 26.8% |
[ 2.5% - 3.0% ] 2.56% | 20,272 | 22.1% |
[ 2.5% - 3.0% ] 2.61% | 66,979 | 14.0% |
[ 2.5% - 3.0% ] 2.67% | 42,916 | 18.5% |
[ 2.5% - 3.0% ] 2.68% | 65,125 | 14.9% |
[ 2.5% - 3.0% ] 2.73% | 24,344 | 27.0% |
[ 2.5% - 3.0% ] 2.78% | 31,447 | 14.8% |
[ 2.5% - 3.0% ] 2.89% | 19,928 | 1.2% |
[ 2.5% - 3.0% ] 2.94% | 239,314 | 15.5% |
[ 2.5% - 3.0% ] 2.99% | 21,738 | 20.2% |
[ 3.0% - 3.5% ] 3.01% | 18,426 | 14.2% |
[ 3.0% - 3.5% ] 3.03% | 56,181 | 28.8% |
[ 3.0% - 3.5% ] 3.12% | 2,825 | 26.1% |
[ 3.0% - 3.5% ] 3.17% | 46,331 | 15.1% |
[ 3.0% - 3.5% ] 3.26% | 55,863 | 19.5% |
[ 3.0% - 3.5% ] 3.30% | 12,442 | 55.6% |
[ 3.0% - 3.5% ] 3.39% | 40,738 | 15.2% |
[ 3.0% - 3.5% ] 3.47% | 27,641 | 36.5% |
[ 3.5% - 4.0% ] 3.52% | 33,367 | 28.9% |
[ 3.5% - 4.0% ] 3.53% | 29,006 | 23.9% |
[ 3.5% - 4.0% ] 3.56% | 843 | 0.36% |
[ 3.5% - 4.0% ] 3.76% | 4,419 | 16.9% |
[ 3.5% - 4.0% ] 3.99% | 86,804 | 27.2% |
[ 4.0% - 4.5% ] 4.02% | 58,106 | 13.6% |
[ 4.0% - 4.5% ] 4.05% | 22,654 | 14.9% |
[ 4.0% - 4.5% ] 4.39% | 43,903 | 16.7% |
[ 4.5% - 5.0% ] 4.50% | 59,453 | 2.2% |
[ 4.5% - 5.0% ] 4.62% | 909 | 36.6% |
[ 4.5% - 5.0% ] 4.67% | 321 | 47.0% |
[ 4.5% - 5.0% ] 4.73% | 14,225 | 25.3% |
[ 4.5% - 5.0% ] 4.98% | 45,650 | 25.5% |
[ 5.0% - 5.5% ] 5.30% | 283 | 47.4% |
[ 5.5% - 6.0% ] 5.52% | 6,975 | 37.2% |
[ 6.0% - 6.5% ] 6.25% | 480 | 13.8% |