Cape Verdean Wage/Income Gap
COMPARE
Cape Verdean
Select to Compare
Wage/Income Gap
Cape Verdean Wage/Income Gap
23.6%
WAGE/INCOME GAP
99.4/ 100
METRIC RATING
95th/ 347
METRIC RANK
Cape Verdean Wage/Income Gap Correlation Chart
The statistical analysis conducted on geographies consisting of 107,547,548 people shows no correlation between the proportion of Cape Verdeans and wage/income gap percentage in the United States with a correlation coefficient (R) of -0.043 and weighted average of 23.6%. On average, for every 1% (one percent) increase in Cape Verdeans within a typical geography, there is a decrease of 0.088% in wage/income gap percentage.
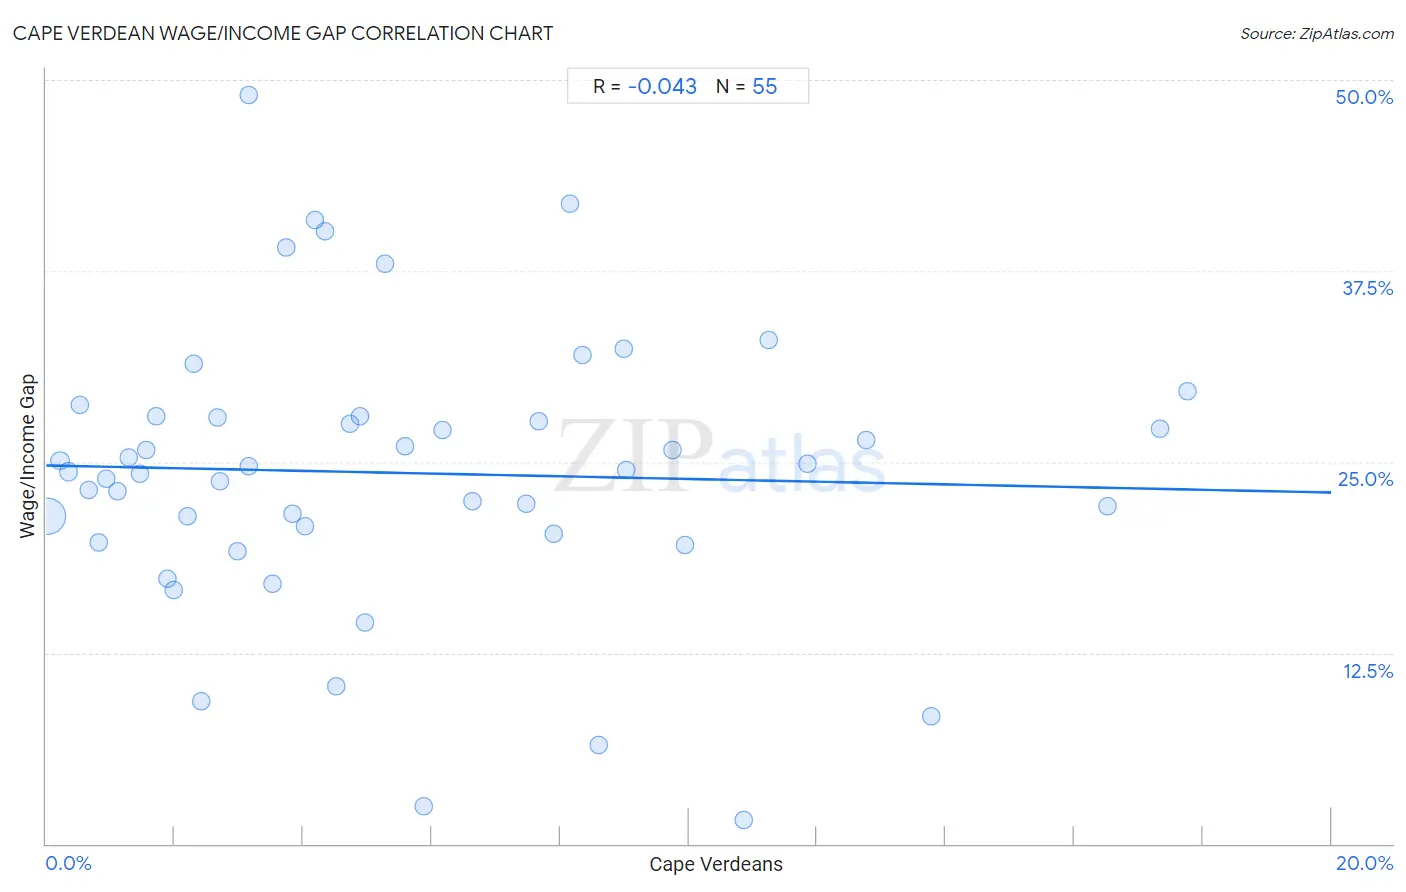
It is essential to understand that the correlation between the percentage of Cape Verdeans and wage/income gap percentage does not imply a direct cause-and-effect relationship. It remains uncertain whether the presence of Cape Verdeans influences an upward or downward trend in the level of wage/income gap percentage within an area, or if Cape Verdeans simply ended up residing in those areas with higher or lower levels of wage/income gap percentage due to other factors.
Demographics Similar to Cape Verdeans by Wage/Income Gap
In terms of wage/income gap, the demographic groups most similar to Cape Verdeans are Honduran (23.6%, a difference of 0.030%), Immigrants from Cabo Verde (23.6%, a difference of 0.12%), Kiowa (23.6%, a difference of 0.12%), Immigrants from Sudan (23.6%, a difference of 0.21%), and Immigrants from Honduras (23.5%, a difference of 0.36%).
| Demographics | Rating | Rank | Wage/Income Gap |
| Immigrants from Panama | 99.6 /100 | #88 | Exceptional 23.4% |
| Marshallese | 99.6 /100 | #89 | Exceptional 23.4% |
| Nicaraguans | 99.6 /100 | #90 | Exceptional 23.4% |
| Arapaho | 99.6 /100 | #91 | Exceptional 23.5% |
| Immigrants from Honduras | 99.5 /100 | #92 | Exceptional 23.5% |
| Immigrants from Cabo Verde | 99.5 /100 | #93 | Exceptional 23.6% |
| Hondurans | 99.5 /100 | #94 | Exceptional 23.6% |
| Cape Verdeans | 99.4 /100 | #95 | Exceptional 23.6% |
| Kiowa | 99.4 /100 | #96 | Exceptional 23.6% |
| Immigrants from Sudan | 99.4 /100 | #97 | Exceptional 23.6% |
| Immigrants from Latin America | 99.2 /100 | #98 | Exceptional 23.7% |
| Aleuts | 99.2 /100 | #99 | Exceptional 23.7% |
| Yakama | 99.2 /100 | #100 | Exceptional 23.7% |
| Japanese | 99.1 /100 | #101 | Exceptional 23.8% |
| Immigrants from Laos | 99.0 /100 | #102 | Exceptional 23.8% |
Cape Verdean Wage/Income Gap Correlation Summary
| Measurement | Cape Verdean Data | Wage/Income Gap Data |
| Minimum | 0.026% | 1.5% |
| Maximum | 17.8% | 49.0% |
| Range | 17.7% | 47.5% |
| Mean | 5.6% | 24.3% |
| Median | 4.3% | 24.5% |
| Interquartile 25% (IQ1) | 2.0% | 20.3% |
| Interquartile 75% (IQ3) | 8.3% | 28.0% |
| Interquartile Range (IQR) | 6.3% | 7.6% |
| Standard Deviation (Sample) | 4.5% | 9.2% |
| Standard Deviation (Population) | 4.5% | 9.2% |
Correlation Details
| Cape Verdean Percentile | Sample Size | Wage/Income Gap |
[ 0.0% - 0.5% ] 0.026% | 93,891,905 | 21.4% |
[ 0.0% - 0.5% ] 0.21% | 5,697,915 | 25.1% |
[ 0.0% - 0.5% ] 0.35% | 2,099,284 | 24.4% |
[ 0.5% - 1.0% ] 0.52% | 1,162,854 | 28.8% |
[ 0.5% - 1.0% ] 0.67% | 703,025 | 23.2% |
[ 0.5% - 1.0% ] 0.82% | 463,334 | 19.8% |
[ 0.5% - 1.0% ] 0.93% | 120,046 | 23.9% |
[ 1.0% - 1.5% ] 1.11% | 281,636 | 23.0% |
[ 1.0% - 1.5% ] 1.28% | 285,083 | 25.3% |
[ 1.0% - 1.5% ] 1.45% | 353,017 | 24.2% |
[ 1.5% - 2.0% ] 1.56% | 107,323 | 25.8% |
[ 1.5% - 2.0% ] 1.72% | 159,156 | 28.0% |
[ 1.5% - 2.0% ] 1.88% | 775,156 | 17.4% |
[ 1.5% - 2.0% ] 1.99% | 60,288 | 16.6% |
[ 2.0% - 2.5% ] 2.20% | 35,041 | 21.4% |
[ 2.0% - 2.5% ] 2.30% | 23,879 | 31.5% |
[ 2.0% - 2.5% ] 2.41% | 8,855 | 9.4% |
[ 2.5% - 3.0% ] 2.66% | 128,771 | 27.9% |
[ 2.5% - 3.0% ] 2.71% | 31,214 | 23.7% |
[ 2.5% - 3.0% ] 2.98% | 59,378 | 19.1% |
[ 3.0% - 3.5% ] 3.14% | 52,431 | 24.7% |
[ 3.0% - 3.5% ] 3.15% | 4,660 | 49.0% |
[ 3.5% - 4.0% ] 3.53% | 26,472 | 17.1% |
[ 3.5% - 4.0% ] 3.73% | 17,164 | 39.0% |
[ 3.5% - 4.0% ] 3.82% | 46,858 | 21.6% |
[ 4.0% - 4.5% ] 4.02% | 8,303 | 20.8% |
[ 4.0% - 4.5% ] 4.19% | 18,445 | 40.8% |
[ 4.0% - 4.5% ] 4.34% | 7,690 | 40.1% |
[ 4.5% - 5.0% ] 4.52% | 13,092 | 10.3% |
[ 4.5% - 5.0% ] 4.73% | 63,899 | 27.5% |
[ 4.5% - 5.0% ] 4.88% | 51,915 | 28.0% |
[ 4.5% - 5.0% ] 4.96% | 26,821 | 14.5% |
[ 5.0% - 5.5% ] 5.28% | 6,802 | 38.0% |
[ 5.5% - 6.0% ] 5.59% | 44,718 | 26.1% |
[ 5.5% - 6.0% ] 5.88% | 55,336 | 2.5% |
[ 6.0% - 6.5% ] 6.16% | 25,084 | 27.1% |
[ 6.5% - 7.0% ] 6.64% | 32,969 | 22.4% |
[ 7.0% - 7.5% ] 7.47% | 4,406 | 22.2% |
[ 7.5% - 8.0% ] 7.67% | 5,305 | 27.6% |
[ 7.5% - 8.0% ] 7.90% | 16,286 | 20.3% |
[ 8.0% - 8.5% ] 8.15% | 12,465 | 41.9% |
[ 8.0% - 8.5% ] 8.34% | 5,074 | 32.0% |
[ 8.5% - 9.0% ] 8.60% | 24,705 | 6.5% |
[ 8.5% - 9.0% ] 8.98% | 2,605 | 32.4% |
[ 9.0% - 9.5% ] 9.02% | 31,903 | 24.5% |
[ 9.5% - 10.0% ] 9.75% | 100,620 | 25.8% |
[ 9.5% - 10.0% ] 9.94% | 75,176 | 19.6% |
[ 10.5% - 11.0% ] 10.85% | 10,530 | 1.5% |
[ 11.0% - 11.5% ] 11.25% | 3,468 | 33.0% |
[ 11.5% - 12.0% ] 11.86% | 47,677 | 24.8% |
[ 12.5% - 13.0% ] 12.76% | 46,623 | 26.5% |
[ 13.5% - 14.0% ] 13.77% | 1,460 | 8.4% |
[ 16.5% - 17.0% ] 16.51% | 35,488 | 22.1% |
[ 17.0% - 17.5% ] 17.34% | 104,713 | 27.2% |
[ 17.5% - 18.0% ] 17.76% | 69,225 | 29.6% |