Yakama Wage/Income Gap
COMPARE
Yakama
Select to Compare
Wage/Income Gap
Yakama Wage/Income Gap
23.7%
WAGE/INCOME GAP
99.2/ 100
METRIC RATING
100th/ 347
METRIC RANK
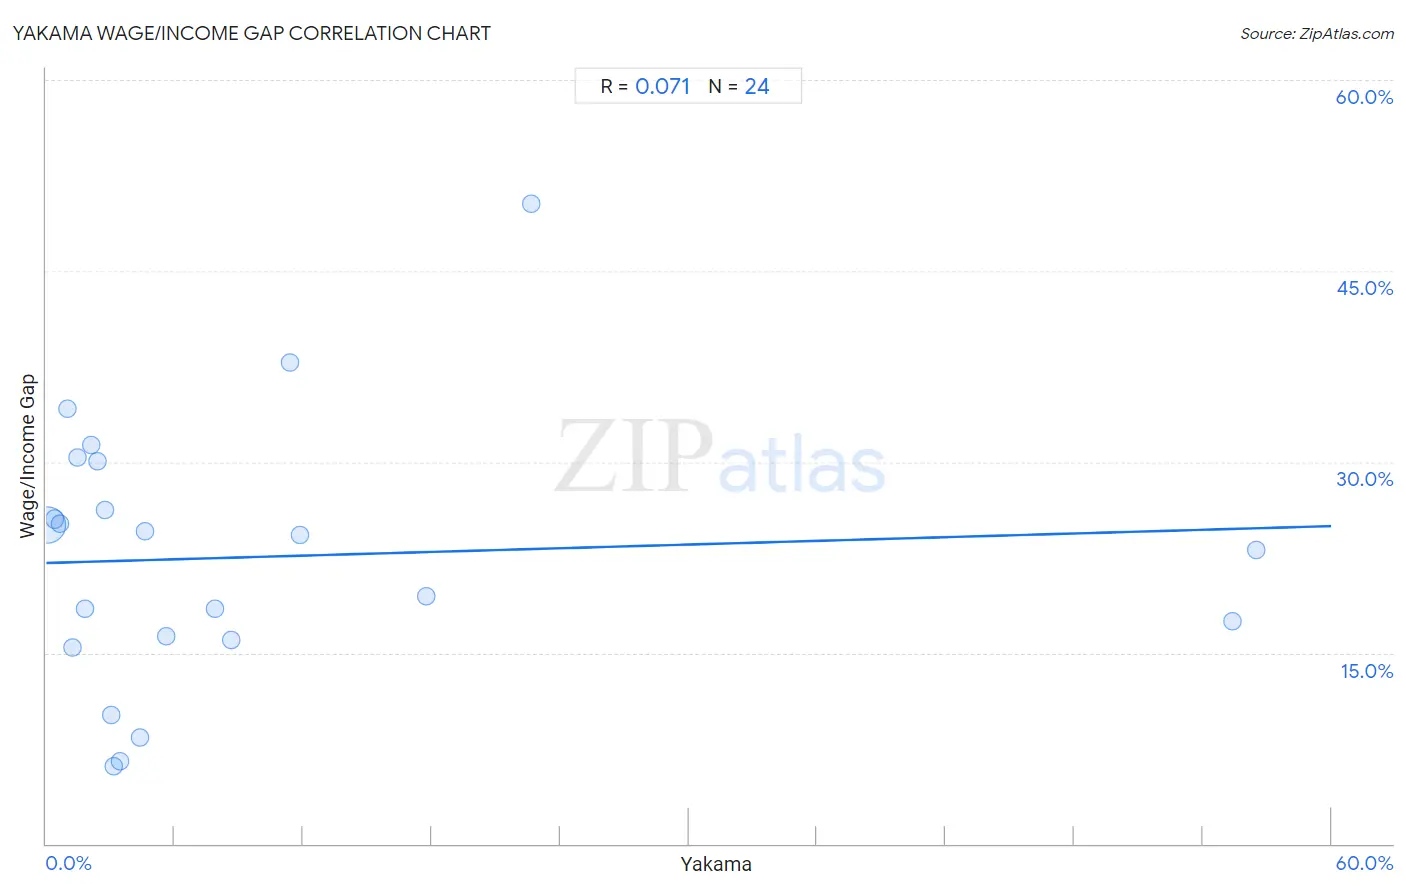
Yakama Wage/Income Gap Correlation Chart
The statistical analysis conducted on geographies consisting of 19,909,304 people shows a slight positive correlation between the proportion of Yakama and wage/income gap percentage in the United States with a correlation coefficient (R) of 0.071 and weighted average of 23.7%. On average, for every 1% (one percent) increase in Yakama within a typical geography, there is an increase of 0.048% in wage/income gap percentage.
It is essential to understand that the correlation between the percentage of Yakama and wage/income gap percentage does not imply a direct cause-and-effect relationship. It remains uncertain whether the presence of Yakama influences an upward or downward trend in the level of wage/income gap percentage within an area, or if Yakama simply ended up residing in those areas with higher or lower levels of wage/income gap percentage due to other factors.
Demographics Similar to Yakama by Wage/Income Gap
In terms of wage/income gap, the demographic groups most similar to Yakama are Aleut (23.7%, a difference of 0.020%), Immigrants from Latin America (23.7%, a difference of 0.090%), Japanese (23.8%, a difference of 0.15%), Immigrants from Laos (23.8%, a difference of 0.30%), and Immigrants from Sudan (23.6%, a difference of 0.49%).
| Demographics | Rating | Rank | Wage/Income Gap |
| Immigrants from Cabo Verde | 99.5 /100 | #93 | Exceptional 23.6% |
| Hondurans | 99.5 /100 | #94 | Exceptional 23.6% |
| Cape Verdeans | 99.4 /100 | #95 | Exceptional 23.6% |
| Kiowa | 99.4 /100 | #96 | Exceptional 23.6% |
| Immigrants from Sudan | 99.4 /100 | #97 | Exceptional 23.6% |
| Immigrants from Latin America | 99.2 /100 | #98 | Exceptional 23.7% |
| Aleuts | 99.2 /100 | #99 | Exceptional 23.7% |
| Yakama | 99.2 /100 | #100 | Exceptional 23.7% |
| Japanese | 99.1 /100 | #101 | Exceptional 23.8% |
| Immigrants from Laos | 99.0 /100 | #102 | Exceptional 23.8% |
| Tsimshian | 98.9 /100 | #103 | Exceptional 23.9% |
| Tlingit-Haida | 98.7 /100 | #104 | Exceptional 24.0% |
| Moroccans | 98.6 /100 | #105 | Exceptional 24.0% |
| Sudanese | 98.6 /100 | #106 | Exceptional 24.0% |
| Yaqui | 98.4 /100 | #107 | Exceptional 24.0% |
Yakama Wage/Income Gap Correlation Summary
| Measurement | Yakama Data | Wage/Income Gap Data |
| Minimum | 0.033% | 6.1% |
| Maximum | 56.5% | 50.3% |
| Range | 56.5% | 44.2% |
| Mean | 9.6% | 22.5% |
| Median | 3.3% | 23.7% |
| Interquartile 25% (IQ1) | 1.6% | 16.2% |
| Interquartile 75% (IQ3) | 10.0% | 28.2% |
| Interquartile Range (IQR) | 8.4% | 12.0% |
| Standard Deviation (Sample) | 15.4% | 10.3% |
| Standard Deviation (Population) | 15.0% | 10.1% |
Correlation Details
| Yakama Percentile | Sample Size | Wage/Income Gap |
[ 0.0% - 0.5% ] 0.033% | 19,058,180 | 25.0% |
[ 0.0% - 0.5% ] 0.38% | 566,577 | 25.5% |
[ 0.5% - 1.0% ] 0.66% | 80,377 | 25.1% |
[ 0.5% - 1.0% ] 1.00% | 70,828 | 34.1% |
[ 1.0% - 1.5% ] 1.24% | 11,252 | 15.4% |
[ 1.0% - 1.5% ] 1.48% | 6,220 | 30.4% |
[ 1.5% - 2.0% ] 1.79% | 13,697 | 18.4% |
[ 2.0% - 2.5% ] 2.12% | 44,079 | 31.3% |
[ 2.0% - 2.5% ] 2.42% | 6,405 | 30.1% |
[ 2.5% - 3.0% ] 2.71% | 1,768 | 26.3% |
[ 3.0% - 3.5% ] 3.03% | 659 | 10.1% |
[ 3.0% - 3.5% ] 3.14% | 2,678 | 6.1% |
[ 3.0% - 3.5% ] 3.43% | 1,078 | 6.5% |
[ 4.0% - 4.5% ] 4.39% | 569 | 8.4% |
[ 4.5% - 5.0% ] 4.60% | 3,153 | 24.6% |
[ 5.5% - 6.0% ] 5.58% | 11,112 | 16.3% |
[ 7.5% - 8.0% ] 7.88% | 13,015 | 18.4% |
[ 8.5% - 9.0% ] 8.64% | 220 | 16.0% |
[ 11.0% - 11.5% ] 11.38% | 1,195 | 37.8% |
[ 11.5% - 12.0% ] 11.87% | 640 | 24.3% |
[ 17.5% - 18.0% ] 17.73% | 13,145 | 19.5% |
[ 22.5% - 23.0% ] 22.67% | 172 | 50.3% |
[ 55.0% - 55.5% ] 55.39% | 1,724 | 17.5% |
[ 56.5% - 57.0% ] 56.51% | 561 | 23.1% |