Scandinavian Wage/Income Gap

COMPARE

Scandinavian
Race
Ancestry
AfghanAfricanAlaska NativeAlaskan AthabascanAlbanianAleutAlsatianAmericanApacheArabArapahoArgentineanArmenianAssyrian/Chaldean/SyriacAustralianAustrianBahamianBangladeshiBarbadianBasqueBelgianBelizeanBermudanBhutaneseBlackfeetBolivianBrazilianBritishBritish West IndianBulgarianBurmeseCajunCambodianCanadianCape VerdeanCarpatho RusynCelticCentral AmericanCentral American IndianCherokeeCheyenneChickasawChileanChineseChippewaChoctawColombianColvilleComancheCosta RicanCreeCreekCroatianCrowCubanCypriotCzechCzechoslovakianDanishDelawareDominicanDutchDutch West IndianEastern EuropeanEcuadorianEgyptianEnglishEstonianEthiopianEuropeanFijianFilipinoFinnishFrenchFrench American IndianFrench CanadianGermanGerman RussianGhanaianGreekGuamanian/ChamorroGuatemalanGuyaneseHaitianHmongHonduranHopiHoumaHungarianIcelanderIndian (Asian)IndonesianInupiatIranianIraqiIrishIroquoisIsraeliItalianJamaicanJapaneseJordanianKenyanKiowaKoreanLaotianLatvianLebaneseLiberianLithuanianLumbeeLuxembourgerMacedonianMalaysianMalteseMarshalleseMenomineeMexicanMexican American IndianMongolianMoroccanNative HawaiianNavajoNepaleseNew ZealanderNicaraguanNigerianNorthern EuropeanNorwegianOkinawanOsageOttawaPaiutePakistaniPalestinianPanamanianParaguayanPennsylvania GermanPeruvianPimaPolishPortuguesePotawatomiPuebloPuerto RicanPuget Sound SalishRomanianRussianSalvadoranSamoanScandinavianScotch-IrishScottishSeminoleSenegaleseSerbianShoshoneSierra LeoneanSiouxSlavicSlovakSloveneSomaliSouth AfricanSouth AmericanSouth American IndianSoviet UnionSpaniardSpanishSpanish AmericanSpanish American IndianSri LankanSubsaharan AfricanSudaneseSwedishSwissSyrianTaiwaneseThaiTlingit-HaidaTohono O'OdhamTonganTrinidadian and TobagonianTsimshianTurkishU.S. Virgin IslanderUgandanUkrainianUruguayanUteVenezuelanVietnameseWelshWest IndianYakamaYaquiYugoslavianYumanYup'ikZimbabwean
Immigration
NonimmigrantsImmigrantsAfghanistanAfricaAlbaniaArgentinaArmeniaAsiaAustraliaAustriaBahamasBangladeshBarbadosBelarusBelgiumBelizeBoliviaBosnia and HerzegovinaBrazilBulgariaBurma/MyanmarCabo VerdeCambodiaCameroonCanadaCaribbeanCentral AmericaChileChinaColombiaCongoCosta RicaCroatiaCubaCzechoslovakiaDenmarkDominicaDominican RepublicEastern AfricaEastern AsiaEastern EuropeEcuadorEgyptEl SalvadorEnglandEritreaEthiopiaEuropeFijiFranceGermanyGhanaGreeceGrenadaGuatemalaGuyanaHaitiHondurasHong KongHungaryIndiaIndonesiaIranIraqIrelandIsraelItalyJamaicaJapanJordanKazakhstanKenyaKoreaKuwaitLaosLatin AmericaLatviaLebanonLiberiaLithuaniaMalaysiaMexicoMicronesiaMiddle AfricaMoldovaMoroccoNepalNetherlandsNicaraguaNigeriaNorth AmericaNorth MacedoniaNorthern AfricaNorthern EuropeNorwayOceaniaPakistanPanamaPeruPhilippinesPolandPortugalRomaniaRussiaSaudi ArabiaScotlandSenegalSerbiaSierra LeoneSingaporeSomaliaSouth AfricaSouth AmericaSouth Central AsiaSouth Eastern AsiaSouthern EuropeSpainSri LankaSt. Vincent and the GrenadinesSudanSwedenSwitzerlandSyriaTaiwanThailandTrinidad and TobagoTurkeyUgandaUkraineUruguayUzbekistanVenezuelaVietnamWest IndiesWestern AfricaWestern AsiaWestern EuropeYemenZaireZimbabweAzores
Select to Compare
Race
Ancestry
AfghanAfricanAlaska NativeAlaskan AthabascanAlbanianAleutAlsatianAmericanApacheArabArapahoArgentineanArmenianAssyrian/Chaldean/SyriacAustralianAustrianBahamianBangladeshiBarbadianBasqueBelgianBelizeanBermudanBhutaneseBlackfeetBolivianBrazilianBritishBritish West IndianBulgarianBurmeseCajunCambodianCanadianCape VerdeanCarpatho RusynCelticCentral AmericanCentral American IndianCherokeeCheyenneChickasawChileanChineseChippewaChoctawColombianColvilleComancheCosta RicanCreeCreekCroatianCrowCubanCypriotCzechCzechoslovakianDanishDelawareDominicanDutchDutch West IndianEastern EuropeanEcuadorianEgyptianEnglishEstonianEthiopianEuropeanFijianFilipinoFinnishFrenchFrench American IndianFrench CanadianGermanGerman RussianGhanaianGreekGuamanian/ChamorroGuatemalanGuyaneseHaitianHmongHonduranHopiHoumaHungarianIcelanderIndian (Asian)IndonesianInupiatIranianIraqiIrishIroquoisIsraeliItalianJamaicanJapaneseJordanianKenyanKiowaKoreanLaotianLatvianLebaneseLiberianLithuanianLumbeeLuxembourgerMacedonianMalaysianMalteseMarshalleseMenomineeMexicanMexican American IndianMongolianMoroccanNative HawaiianNavajoNepaleseNew ZealanderNicaraguanNigerianNorthern EuropeanNorwegianOkinawanOsageOttawaPaiutePakistaniPalestinianPanamanianParaguayanPennsylvania GermanPeruvianPimaPolishPortuguesePotawatomiPuebloPuerto RicanPuget Sound SalishRomanianRussianSalvadoranSamoanScotch-IrishScottishSeminoleSenegaleseSerbianShoshoneSierra LeoneanSiouxSlavicSlovakSloveneSomaliSouth AfricanSouth AmericanSouth American IndianSoviet UnionSpaniardSpanishSpanish AmericanSpanish American IndianSri LankanSubsaharan AfricanSudaneseSwedishSwissSyrianTaiwaneseThaiTlingit-HaidaTohono O'OdhamTonganTrinidadian and TobagonianTsimshianTurkishU.S. Virgin IslanderUgandanUkrainianUruguayanUteVenezuelanVietnameseWelshWest IndianYakamaYaquiYugoslavianYumanYup'ikZimbabwean
Immigration
NonimmigrantsImmigrantsAfghanistanAfricaAlbaniaArgentinaArmeniaAsiaAustraliaAustriaBahamasBangladeshBarbadosBelarusBelgiumBelizeBoliviaBosnia and HerzegovinaBrazilBulgariaBurma/MyanmarCabo VerdeCambodiaCameroonCanadaCaribbeanCentral AmericaChileChinaColombiaCongoCosta RicaCroatiaCubaCzechoslovakiaDenmarkDominicaDominican RepublicEastern AfricaEastern AsiaEastern EuropeEcuadorEgyptEl SalvadorEnglandEritreaEthiopiaEuropeFijiFranceGermanyGhanaGreeceGrenadaGuatemalaGuyanaHaitiHondurasHong KongHungaryIndiaIndonesiaIranIraqIrelandIsraelItalyJamaicaJapanJordanKazakhstanKenyaKoreaKuwaitLaosLatin AmericaLatviaLebanonLiberiaLithuaniaMalaysiaMexicoMicronesiaMiddle AfricaMoldovaMoroccoNepalNetherlandsNicaraguaNigeriaNorth AmericaNorth MacedoniaNorthern AfricaNorthern EuropeNorwayOceaniaPakistanPanamaPeruPhilippinesPolandPortugalRomaniaRussiaSaudi ArabiaScotlandSenegalSerbiaSierra LeoneSingaporeSomaliaSouth AfricaSouth AmericaSouth Central AsiaSouth Eastern AsiaSouthern EuropeSpainSri LankaSt. Vincent and the GrenadinesSudanSwedenSwitzerlandSyriaTaiwanThailandTrinidad and TobagoTurkeyUgandaUkraineUruguayUzbekistanVenezuelaVietnamWest IndiesWestern AfricaWestern AsiaWestern EuropeYemenZaireZimbabweAzores
Wage/Income Gap
Income
Poverty
Unemployment
Labor Participation
Family Structure
Vehicle Availability
Education Level
Disability

Scandinavian Wage/Income Gap
Tragic

29.1%
WAGE/INCOME GAP
0.0/ 100
METRIC RATING
328th/ 347
METRIC RANK

Scandinavian Wage/Income Gap Correlation Chart

The statistical analysis conducted on geographies consisting of 471,744,681 people shows a poor positive correlation between the proportion of Scandinavians and wage/income gap percentage in the United States with a correlation coefficient (R) of 0.156 and weighted average of 29.1%. On average, for every 1% (one percent) increase in Scandinavians within a typical geography, there is an increase of 0.20% in wage/income gap percentage.
Scandinavian Wage/Income Gap
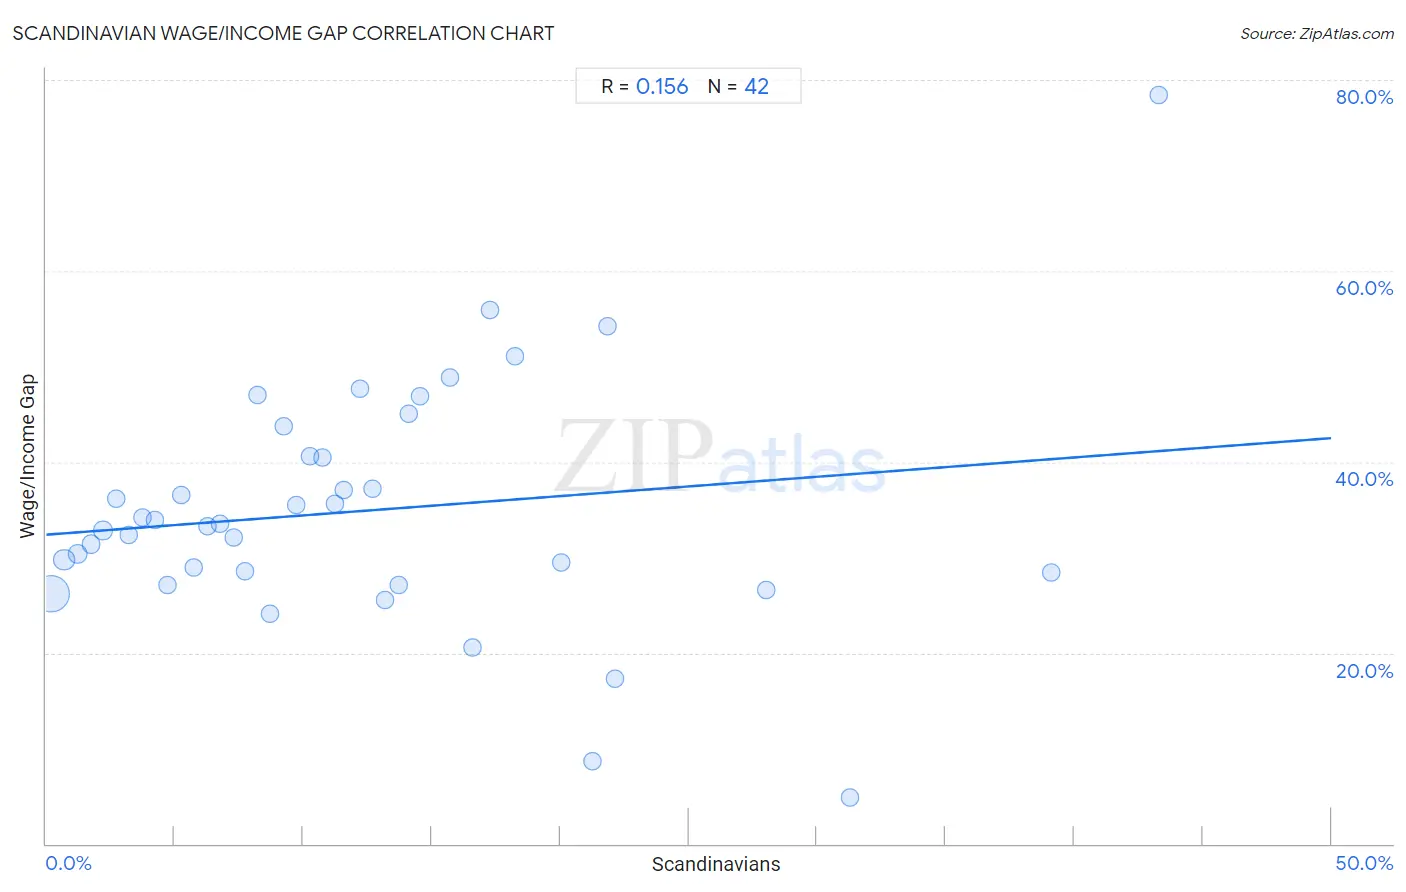
It is essential to understand that the correlation between the percentage of Scandinavians and wage/income gap percentage does not imply a direct cause-and-effect relationship. It remains uncertain whether the presence of Scandinavians influences an upward or downward trend in the level of wage/income gap percentage within an area, or if Scandinavians simply ended up residing in those areas with higher or lower levels of wage/income gap percentage due to other factors.

Demographics Similar to Scandinavians by Wage/Income Gap

In terms of wage/income gap, the demographic groups most similar to Scandinavians are Immigrants from Iran (29.1%, a difference of 0.060%), Scottish (29.1%, a difference of 0.14%), Immigrants from Belgium (29.0%, a difference of 0.17%), Hungarian (29.0%, a difference of 0.24%), and German (29.2%, a difference of 0.24%).
DemographicsRating | RankWage/Income Gap
Welsh
0.1
/100
|
#321
Tragic
28.9%
Immigrants from Singapore
0.1
/100
|
#322
Tragic
28.9%
Norwegians
0.1
/100
|
#323
Tragic
29.0%
Croatians
0.0
/100
|
#324
Tragic
29.0%
Hungarians
0.0
/100
|
#325
Tragic
29.0%
Immigrants from Belgium
0.0
/100
|
#326
Tragic
29.0%
Immigrants from Iran
0.0
/100
|
#327
Tragic
29.1%
Scandinavians
0.0
/100
|
#328
Tragic
29.1%
Scottish
0.0
/100
|
#329
Tragic
29.1%
Germans
0.0
/100
|
#330
Tragic
29.2%
Czechs
0.0
/100
|
#331
Tragic
29.2%
Immigrants from South Central Asia
0.0
/100
|
#332
Tragic
29.3%
Europeans
0.0
/100
|
#333
Tragic
29.4%
Swedes
0.0
/100
|
#334
Tragic
29.4%
Immigrants from Taiwan
0.0
/100
|
#335
Tragic
29.5%

Scandinavian Wage/Income Gap Correlation Summary

MeasurementScandinavian DataWage/Income Gap Data
Minimum0.19%4.8%
Maximum43.3%78.5%
Range43.1%73.7%
Mean12.4%34.9%
Median10.5%33.4%
Interquartile 25% (IQ1)5.3%28.4%
Interquartile 75% (IQ3)16.6%40.6%
Interquartile Range (IQR)11.3%12.2%
Standard Deviation (Sample)9.8%12.8%
Standard Deviation (Population)9.7%12.6%

Correlation Details

Scandinavian PercentileSample SizeWage/Income Gap
[
0.0%
-
0.5%
]
0.19%
375,551,08726.1%
[
0.5%
-
1.0%
]
0.70%
59,932,76929.8%
[
1.0%
-
1.5%
]
1.22%
18,850,14330.4%
[
1.5%
-
2.0%
]
1.73%
8,361,39931.4%
[
2.0%
-
2.5%
]
2.21%
4,705,35732.8%
[
2.5%
-
3.0%
]
2.73%
2,302,02636.1%
[
3.0%
-
3.5%
]
3.21%
868,15232.4%
[
3.5%
-
4.0%
]
3.72%
467,54234.2%
[
4.0%
-
4.5%
]
4.24%
184,06233.9%
[
4.5%
-
5.0%
]
4.74%
115,28927.0%
[
5.0%
-
5.5%
]
5.25%
90,50936.5%
[
5.5%
-
6.0%
]
5.74%
95,56528.9%
[
6.0%
-
6.5%
]
6.28%
48,52733.3%
[
6.5%
-
7.0%
]
6.76%
45,30933.5%
[
7.0%
-
7.5%
]
7.30%
31,28432.1%
[
7.5%
-
8.0%
]
7.71%
19,29728.6%
[
8.0%
-
8.5%
]
8.23%
14,44947.0%
[
8.5%
-
9.0%
]
8.71%
12,95824.0%
[
9.0%
-
9.5%
]
9.24%
5,50743.7%
[
9.5%
-
10.0%
]
9.71%
4,94535.5%
[
10.0%
-
10.5%
]
10.26%
11,48740.6%
[
10.5%
-
11.0%
]
10.74%
4,73940.5%
[
11.0%
-
11.5%
]
11.26%
1,15535.6%
[
11.5%
-
12.0%
]
11.60%
1,98337.0%
[
12.0%
-
12.5%
]
12.20%
2,02547.7%
[
12.5%
-
13.0%
]
12.69%
65437.1%
[
13.0%
-
13.5%
]
13.20%
55325.6%
[
13.5%
-
14.0%
]
13.73%
84527.0%
[
14.0%
-
14.5%
]
14.13%
4,31845.0%
[
14.5%
-
15.0%
]
14.55%
3,74046.9%
[
15.5%
-
16.0%
]
15.71%
1,27348.8%
[
16.5%
-
17.0%
]
16.57%
49520.6%
[
17.0%
-
17.5%
]
17.26%
1,68055.9%
[
18.0%
-
18.5%
]
18.22%
25851.1%
[
20.0%
-
20.5%
]
20.05%
77829.4%
[
21.0%
-
21.5%
]
21.26%
1278.6%
[
21.5%
-
22.0%
]
21.85%
89754.1%
[
22.0%
-
22.5%
]
22.14%
28017.2%
[
28.0%
-
28.5%
]
28.03%
60326.6%
[
31.0%
-
31.5%
]
31.29%
1474.8%
[
39.0%
-
39.5%
]
39.10%
15628.4%
[
43.0%
-
43.5%
]
43.27%
31278.5%