Nigerian Wage/Income Gap
COMPARE
Nigerian
Select to Compare
Wage/Income Gap
Nigerian Wage/Income Gap
23.0%
WAGE/INCOME GAP
99.9/ 100
METRIC RATING
78th/ 347
METRIC RANK
Nigerian Wage/Income Gap Correlation Chart
The statistical analysis conducted on geographies consisting of 332,662,722 people shows a poor positive correlation between the proportion of Nigerians and wage/income gap percentage in the United States with a correlation coefficient (R) of 0.107 and weighted average of 23.0%. On average, for every 1% (one percent) increase in Nigerians within a typical geography, there is an increase of 0.28% in wage/income gap percentage.
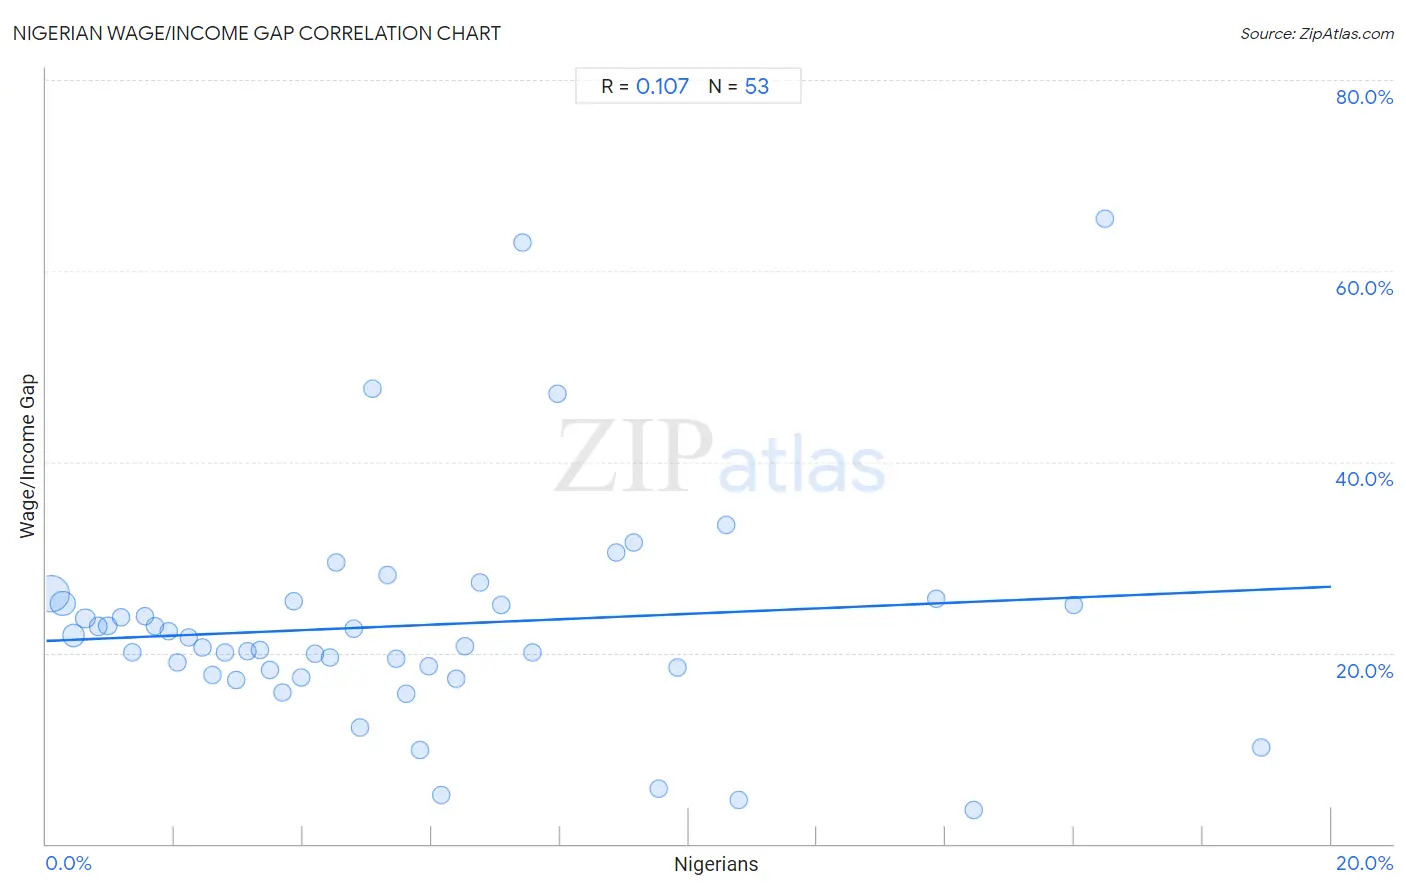
It is essential to understand that the correlation between the percentage of Nigerians and wage/income gap percentage does not imply a direct cause-and-effect relationship. It remains uncertain whether the presence of Nigerians influences an upward or downward trend in the level of wage/income gap percentage within an area, or if Nigerians simply ended up residing in those areas with higher or lower levels of wage/income gap percentage due to other factors.
Demographics Similar to Nigerians by Wage/Income Gap
In terms of wage/income gap, the demographic groups most similar to Nigerians are Immigrants from Nicaragua (23.0%, a difference of 0.090%), African (22.9%, a difference of 0.11%), Salvadoran (23.0%, a difference of 0.15%), Ecuadorian (22.9%, a difference of 0.24%), and Fijian (22.9%, a difference of 0.25%).
| Demographics | Rating | Rank | Wage/Income Gap |
| Immigrants from El Salvador | 99.9 /100 | #71 | Exceptional 22.8% |
| Sub-Saharan Africans | 99.9 /100 | #72 | Exceptional 22.8% |
| Immigrants from Eastern Africa | 99.9 /100 | #73 | Exceptional 22.8% |
| Immigrants from Burma/Myanmar | 99.9 /100 | #74 | Exceptional 22.8% |
| Fijians | 99.9 /100 | #75 | Exceptional 22.9% |
| Ecuadorians | 99.9 /100 | #76 | Exceptional 22.9% |
| Africans | 99.9 /100 | #77 | Exceptional 22.9% |
| Nigerians | 99.9 /100 | #78 | Exceptional 23.0% |
| Immigrants from Nicaragua | 99.9 /100 | #79 | Exceptional 23.0% |
| Salvadorans | 99.9 /100 | #80 | Exceptional 23.0% |
| Bermudans | 99.8 /100 | #81 | Exceptional 23.1% |
| Central Americans | 99.8 /100 | #82 | Exceptional 23.1% |
| Immigrants from Africa | 99.8 /100 | #83 | Exceptional 23.2% |
| Cubans | 99.7 /100 | #84 | Exceptional 23.3% |
| Immigrants from Cambodia | 99.7 /100 | #85 | Exceptional 23.3% |
Nigerian Wage/Income Gap Correlation Summary
| Measurement | Nigerian Data | Wage/Income Gap Data |
| Minimum | 0.080% | 3.6% |
| Maximum | 18.9% | 65.4% |
| Range | 18.8% | 61.9% |
| Mean | 5.6% | 22.8% |
| Median | 4.8% | 20.7% |
| Interquartile 25% (IQ1) | 2.3% | 17.9% |
| Interquartile 75% (IQ3) | 7.5% | 25.3% |
| Interquartile Range (IQR) | 5.2% | 7.3% |
| Standard Deviation (Sample) | 4.4% | 11.7% |
| Standard Deviation (Population) | 4.4% | 11.6% |
Correlation Details
| Nigerian Percentile | Sample Size | Wage/Income Gap |
[ 0.0% - 0.5% ] 0.080% | 178,259,567 | 26.2% |
[ 0.0% - 0.5% ] 0.25% | 65,724,760 | 25.2% |
[ 0.0% - 0.5% ] 0.42% | 38,791,802 | 21.8% |
[ 0.5% - 1.0% ] 0.61% | 17,212,156 | 23.6% |
[ 0.5% - 1.0% ] 0.81% | 9,203,105 | 22.7% |
[ 0.5% - 1.0% ] 0.96% | 7,781,637 | 22.8% |
[ 1.0% - 1.5% ] 1.17% | 3,806,770 | 23.7% |
[ 1.0% - 1.5% ] 1.34% | 2,893,150 | 20.0% |
[ 1.5% - 2.0% ] 1.53% | 1,307,882 | 23.8% |
[ 1.5% - 2.0% ] 1.69% | 1,315,479 | 22.7% |
[ 1.5% - 2.0% ] 1.90% | 828,652 | 22.3% |
[ 2.0% - 2.5% ] 2.04% | 811,068 | 19.0% |
[ 2.0% - 2.5% ] 2.22% | 800,421 | 21.6% |
[ 2.0% - 2.5% ] 2.43% | 612,348 | 20.6% |
[ 2.5% - 3.0% ] 2.59% | 325,229 | 17.7% |
[ 2.5% - 3.0% ] 2.79% | 201,011 | 20.0% |
[ 2.5% - 3.0% ] 2.95% | 296,061 | 17.2% |
[ 3.0% - 3.5% ] 3.14% | 219,402 | 20.2% |
[ 3.0% - 3.5% ] 3.32% | 194,173 | 20.3% |
[ 3.0% - 3.5% ] 3.49% | 207,480 | 18.2% |
[ 3.5% - 4.0% ] 3.68% | 141,167 | 15.9% |
[ 3.5% - 4.0% ] 3.86% | 81,445 | 25.4% |
[ 3.5% - 4.0% ] 3.98% | 184,387 | 17.4% |
[ 4.0% - 4.5% ] 4.18% | 205,483 | 19.9% |
[ 4.0% - 4.5% ] 4.41% | 68,599 | 19.5% |
[ 4.5% - 5.0% ] 4.51% | 96,408 | 29.5% |
[ 4.5% - 5.0% ] 4.79% | 92,124 | 22.5% |
[ 4.5% - 5.0% ] 4.88% | 182,400 | 12.1% |
[ 5.0% - 5.5% ] 5.08% | 1,575 | 47.6% |
[ 5.0% - 5.5% ] 5.31% | 42,647 | 28.1% |
[ 5.0% - 5.5% ] 5.44% | 96,786 | 19.4% |
[ 5.5% - 6.0% ] 5.60% | 112,276 | 15.7% |
[ 5.5% - 6.0% ] 5.82% | 69,731 | 9.9% |
[ 5.5% - 6.0% ] 5.95% | 70,197 | 18.6% |
[ 6.0% - 6.5% ] 6.15% | 26,141 | 5.1% |
[ 6.0% - 6.5% ] 6.37% | 8,205 | 17.2% |
[ 6.5% - 7.0% ] 6.51% | 123,135 | 20.7% |
[ 6.5% - 7.0% ] 6.75% | 46,957 | 27.3% |
[ 7.0% - 7.5% ] 7.08% | 904 | 25.0% |
[ 7.0% - 7.5% ] 7.41% | 526 | 62.9% |
[ 7.5% - 8.0% ] 7.56% | 55,876 | 20.1% |
[ 7.5% - 8.0% ] 7.95% | 528 | 47.1% |
[ 8.5% - 9.0% ] 8.88% | 116,463 | 30.5% |
[ 9.0% - 9.5% ] 9.15% | 2,351 | 31.5% |
[ 9.5% - 10.0% ] 9.54% | 12,487 | 5.7% |
[ 9.5% - 10.0% ] 9.83% | 2,299 | 18.5% |
[ 10.5% - 11.0% ] 10.58% | 4,375 | 33.4% |
[ 10.5% - 11.0% ] 10.77% | 130 | 4.5% |
[ 13.5% - 14.0% ] 13.85% | 13,192 | 25.6% |
[ 14.0% - 14.5% ] 14.44% | 2,348 | 3.6% |
[ 15.5% - 16.0% ] 15.99% | 3,914 | 25.1% |
[ 16.0% - 16.5% ] 16.48% | 182 | 65.4% |
[ 18.5% - 19.0% ] 18.91% | 5,331 | 10.0% |